M a r e k D ¹ b r o w s k i ( e d . )
WW aa rr ss aa ww ,, 22 00 00 11 NNoo.. 3399
The Episodes of Currency Crisis in Latin
American and Asian Economies
The views and opinions expressed in this publication reflectAuthors’ point of view and not necessarily those of CASE.
This paper was prepared for the research project No.0144/H02/99/17 entitled "Analiza przyczyn i przebiegukryzysów walutowych w krajach Azji, Ameryki £aciñskieji Europy Œrodkowo-Wschodniej: wnioski dla Polski i innychkrajów transformuj¹cych siê" (Analysis of the Causes andProgress of Currency Crises in Asian, Latin American andCEE Countries: Conclusions for Poland and Other Transi-tion Countries) financed by the State Committee for Scien-tific Research (KBN) in the years 1999–2001.
The publication was financed by Rabobank SA
Key words: currency crisis, financial crisis, Asian economiesArgentina, Mexico,Thailand, Indonesia, South Korea,Malaysia
DTP: CeDeWu Sp. z o.o.
Graphic Design – Agnieszka Natalia Bury
© CASE – Center for Social and Economic Research, Warsaw 2001
All rights reserved. No part of this publication may bereproduced, stored in a retrieval system, or transmitted in anyform or by any means, without prior permission in writingfrom the author and the CASE Foundation.
ISSN 1506-1647 ISBN 83-7178-257-8
Publisher:CASE – Center for Social and Economic Research ul. Sienkiewicza 12, 00-944 Warsaw, Polande-mail: [email protected]://www.case.com.pl
3
The Episodes of Currency Crisis in Latin...
CASE Reports No. 39
Contents
Introduction by Marek D¹browski . . . . . . . . . . . . . . . . . . . . . . . . . . . . . . . . . . . . . . . . . . . . . . . . . . . .7
Part I. The Mexican Peso Crisis 1994–1995 by Wojciech Paczyñski . . . . . . . . . . . . . . . . . . . . . . . . . . .91.1. History of the Crisis . . . . . . . . . . . . . . . . . . . . . . . . . . . . . . . . . . . . . . . . . . . . . . . . . . . . . . . . . . . . . . . . . .91.2. In Search of the Causes of the Crisis: Macroeconomic Factors . . . . . . . . . . . . . . . . . . . . . . . . . . . . . . . . .11
1.2.1. Fiscal Policy . . . . . . . . . . . . . . . . . . . . . . . . . . . . . . . . . . . . . . . . . . . . . . . . . . . . . . . . . . . . . . . . .111.2.2. Savings and Investment Balance . . . . . . . . . . . . . . . . . . . . . . . . . . . . . . . . . . . . . . . . . . . . . . . . . .111.2.3. Private and Public Debt . . . . . . . . . . . . . . . . . . . . . . . . . . . . . . . . . . . . . . . . . . . . . . . . . . . . . . . .121.2.4. Exchange Rate Policy . . . . . . . . . . . . . . . . . . . . . . . . . . . . . . . . . . . . . . . . . . . . . . . . . . . . . . . . . .141.2.5. Monetary Policy . . . . . . . . . . . . . . . . . . . . . . . . . . . . . . . . . . . . . . . . . . . . . . . . . . . . . . . . . . . . . .151.2.6. Foreign Trade . . . . . . . . . . . . . . . . . . . . . . . . . . . . . . . . . . . . . . . . . . . . . . . . . . . . . . . . . . . . . . . .161.2.7. Balance of Payments . . . . . . . . . . . . . . . . . . . . . . . . . . . . . . . . . . . . . . . . . . . . . . . . . . . . . . . . . . .16
1.3. In Search of the Causes of the Crisis: Microeconomic Factors . . . . . . . . . . . . . . . . . . . . . . . . . . . . . . . . . .171.4. Political Situation . . . . . . . . . . . . . . . . . . . . . . . . . . . . . . . . . . . . . . . . . . . . . . . . . . . . . . . . . . . . . . . . . . . .171.5. Crisis Management . . . . . . . . . . . . . . . . . . . . . . . . . . . . . . . . . . . . . . . . . . . . . . . . . . . . . . . . . . . . . . . . . .181.6. Conclusions . . . . . . . . . . . . . . . . . . . . . . . . . . . . . . . . . . . . . . . . . . . . . . . . . . . . . . . . . . . . . . . . . . . . . . .19Appendix: Chronology of the Mexican Crisis . . . . . . . . . . . . . . . . . . . . . . . . . . . . . . . . . . . . . . . . . . . . . . . . . .20References . . . . . . . . . . . . . . . . . . . . . . . . . . . . . . . . . . . . . . . . . . . . . . . . . . . . . . . . . . . . . . . . . . . . . . . . . .21
Part II. The 1995 Currency Crisis in Argentina by Ma³gorzata Jakubiak . . . . . . . . . . . . . . . . . . . . . .232.1. Introduction . . . . . . . . . . . . . . . . . . . . . . . . . . . . . . . . . . . . . . . . . . . . . . . . . . . . . . . . . . . . . . . . . . . . . . .232.2. Overview of Economic Situation Before and During the Crisis . . . . . . . . . . . . . . . . . . . . . . . . . . . . . . . . .23
2.2.1. Reforms of the Early 1990s and Crisis Developments . . . . . . . . . . . . . . . . . . . . . . . . . . . . . . . . . .232.2.2. Monetary and Exchange Rate Policy . . . . . . . . . . . . . . . . . . . . . . . . . . . . . . . . . . . . . . . . . . . . . . .242.2.3. Fiscal Policy . . . . . . . . . . . . . . . . . . . . . . . . . . . . . . . . . . . . . . . . . . . . . . . . . . . . . . . . . . . . . . . . .252.2.4. Private and Public Debt . . . . . . . . . . . . . . . . . . . . . . . . . . . . . . . . . . . . . . . . . . . . . . . . . . . . . . . .252.2.5. Savings and Investment . . . . . . . . . . . . . . . . . . . . . . . . . . . . . . . . . . . . . . . . . . . . . . . . . . . . . . . . .262.2.6. Foreign Trade . . . . . . . . . . . . . . . . . . . . . . . . . . . . . . . . . . . . . . . . . . . . . . . . . . . . . . . . . . . . . . . .272.2.7. Balance of Payments . . . . . . . . . . . . . . . . . . . . . . . . . . . . . . . . . . . . . . . . . . . . . . . . . . . . . . . . . . .272.2.8. Real and Nominal Rigidities . . . . . . . . . . . . . . . . . . . . . . . . . . . . . . . . . . . . . . . . . . . . . . . . . . . . . .292.2.9. Banking System . . . . . . . . . . . . . . . . . . . . . . . . . . . . . . . . . . . . . . . . . . . . . . . . . . . . . . . . . . . . . .292.2.10. Domestic Financial Market . . . . . . . . . . . . . . . . . . . . . . . . . . . . . . . . . . . . . . . . . . . . . . . . . . . . .312.1.11. Private and Public Sector . . . . . . . . . . . . . . . . . . . . . . . . . . . . . . . . . . . . . . . . . . . . . . . . . . . . . .32
2.3. Political Situation and Management of the Crisis . . . . . . . . . . . . . . . . . . . . . . . . . . . . . . . . . . . . . . . . . . . .322.4. Post-Crisis Developments . . . . . . . . . . . . . . . . . . . . . . . . . . . . . . . . . . . . . . . . . . . . . . . . . . . . . . . . . . . . .342.5. Conclusions . . . . . . . . . . . . . . . . . . . . . . . . . . . . . . . . . . . . . . . . . . . . . . . . . . . . . . . . . . . . . . . . . . . . . . .35Appendix: Chronology of the Argentinian Crisis . . . . . . . . . . . . . . . . . . . . . . . . . . . . . . . . . . . . . . . . . . . . . . . .36References . . . . . . . . . . . . . . . . . . . . . . . . . . . . . . . . . . . . . . . . . . . . . . . . . . . . . . . . . . . . . . . . . . . . . . . . . .37Data Sources . . . . . . . . . . . . . . . . . . . . . . . . . . . . . . . . . . . . . . . . . . . . . . . . . . . . . . . . . . . . . . . . . . . . . . . . . .37
4
Marek D¹browski (ed.)
Part III. The 1997 Currency Crisis in Thailand by Ma³gorzata Antczak . . . . . . . . . . . . . . . . . . . . . . .393..1. Introduction . . . . . . . . . . . . . . . . . . . . . . . . . . . . . . . . . . . . . . . . . . . . . . . . . . . . . . . . . . . . . . . . . . . . . . .393.2. The Way to the Crisis . . . . . . . . . . . . . . . . . . . . . . . . . . . . . . . . . . . . . . . . . . . . . . . . . . . . . . . . . . . . . . . .39
3.2.1. Macroeconoomic Signs of Vulnerability . . . . . . . . . . . . . . . . . . . . . . . . . . . . . . . . . . . . . . . . . . . . .413.2.2. Microeconoomic Signs of Vulnerability . . . . . . . . . . . . . . . . . . . . . . . . . . . . . . . . . . . . . . . . . . . . .42
3.3. The Crisis . . . . . . . . . . . . . . . . . . . . . . . . . . . . . . . . . . . . . . . . . . . . . . . . . . . . . . . . . . . . . . . . . . . . . . . . .443.3.1. Managing the Crisis. The IMF Intervention in Thailand . . . . . . . . . . . . . . . . . . . . . . . . . . . . . . . . .443.3.2. Macroeconomic Environment after the Crisis . . . . . . . . . . . . . . . . . . . . . . . . . . . . . . . . . . . . . . . .45
3.4. Conclusions . . . . . . . . . . . . . . . . . . . . . . . . . . . . . . . . . . . . . . . . . . . . . . . . . . . . . . . . . . . . . . . . . . . . . . .47Appendix: Chronology of the Thailand's Currency Crisis . . . . . . . . . . . . . . . . . . . . . . . . . . . . . . . . . . . . . . . . .52References . . . . . . . . . . . . . . . . . . . . . . . . . . . . . . . . . . . . . . . . . . . . . . . . . . . . . . . . . . . . . . . . . . . . . . . . . .54
Part IV. The Malaysian Currency Crisis, 1997–1998 by Marcin Sasin . . . . . . . . . . . . . . . . . . . . . . . . .55
4.1. Overview . . . . . . . . . . . . . . . . . . . . . . . . . . . . . . . . . . . . . . . . . . . . . . . . . . . . . . . . . . . . . . . . . . . . . . . . .554.1.1. Introduction . . . . . . . . . . . . . . . . . . . . . . . . . . . . . . . . . . . . . . . . . . . . . . . . . . . . . . . . . . . . . . . . .554.1.2. The Public Sector . . . . . . . . . . . . . . . . . . . . . . . . . . . . . . . . . . . . . . . . . . . . . . . . . . . . . . . . . . . . .564.1.3. Monetary Policy and the Financial Sector . . . . . . . . . . . . . . . . . . . . . . . . . . . . . . . . . . . . . . . . . . .584.1.4. The Corporate Sector . . . . . . . . . . . . . . . . . . . . . . . . . . . . . . . . . . . . . . . . . . . . . . . . . . . . . . . . .614.1.5. The External Sector . . . . . . . . . . . . . . . . . . . . . . . . . . . . . . . . . . . . . . . . . . . . . . . . . . . . . . . . . . .62
4.2. The Crisis . . . . . . . . . . . . . . . . . . . . . . . . . . . . . . . . . . . . . . . . . . . . . . . . . . . . . . . . . . . . . . . . . . . . . . . . .644.2.1. Introduction . . . . . . . . . . . . . . . . . . . . . . . . . . . . . . . . . . . . . . . . . . . . . . . . . . . . . . . . . . . . . . . . .644.2.2. Malaysian Vulnerability Analysis . . . . . . . . . . . . . . . . . . . . . . . . . . . . . . . . . . . . . . . . . . . . . . . . . . .654.2.3. Crisis Development . . . . . . . . . . . . . . . . . . . . . . . . . . . . . . . . . . . . . . . . . . . . . . . . . . . . . . . . . . .68
4.3. Response to the Crisis . . . . . . . . . . . . . . . . . . . . . . . . . . . . . . . . . . . . . . . . . . . . . . . . . . . . . . . . . . . . . . . .704.3.1. Introduction . . . . . . . . . . . . . . . . . . . . . . . . . . . . . . . . . . . . . . . . . . . . . . . . . . . . . . . . . . . . . . . . .704.3.2. Fiscal Policy Response . . . . . . . . . . . . . . . . . . . . . . . . . . . . . . . . . . . . . . . . . . . . . . . . . . . . . . . . . .704.3.3. Monetary Policy Response and Capital Control . . . . . . . . . . . . . . . . . . . . . . . . . . . . . . . . . . . . . . .714.3.4. Financial and Corporate Sector Restructuring . . . . . . . . . . . . . . . . . . . . . . . . . . . . . . . . . . . . . . . .73
4.4. Conclusions . . . . . . . . . . . . . . . . . . . . . . . . . . . . . . . . . . . . . . . . . . . . . . . . . . . . . . . . . . . . . . . . . . . . . . .74Appendix: Chronology of the Malaysian 1997–1998 Crisis . . . . . . . . . . . . . . . . . . . . . . . . . . . . . . . . . . . . . . . .75References . . . . . . . . . . . . . . . . . . . . . . . . . . . . . . . . . . . . . . . . . . . . . . . . . . . . . . . . . . . . . . . . . . . . . . . . . .76
Part V. The Indonesian Currency Crisis, 1997–1998 by Marcin Sasin . . . . . . . . . . . . . . . . . . . . . . . . .77
5.1. Overview . . . . . . . . . . . . . . . . . . . . . . . . . . . . . . . . . . . . . . . . . . . . . . . . . . . . . . . . . . . . . . . . . . . . . . . . .775.1.1. Introduction . . . . . . . . . . . . . . . . . . . . . . . . . . . . . . . . . . . . . . . . . . . . . . . . . . . . . . . . . . . . . . . . .775.1.2. Monetary Policy and the Financial Sector . . . . . . . . . . . . . . . . . . . . . . . . . . . . . . . . . . . . . . . . . . .785.1.3. The External Sector . . . . . . . . . . . . . . . . . . . . . . . . . . . . . . . . . . . . . . . . . . . . . . . . . . . . . . . . . . .815.1.4. The Public Sector . . . . . . . . . . . . . . . . . . . . . . . . . . . . . . . . . . . . . . . . . . . . . . . . . . . . . . . . . . . . .83
5.2. The Crisis . . . . . . . . . . . . . . . . . . . . . . . . . . . . . . . . . . . . . . . . . . . . . . . . . . . . . . . . . . . . . . . . . . . . . . . . .845.2.1. Introduction . . . . . . . . . . . . . . . . . . . . . . . . . . . . . . . . . . . . . . . . . . . . . . . . . . . . . . . . . . . . . . . . .845.2.2. Indonesia's Vulnerability Analysis . . . . . . . . . . . . . . . . . . . . . . . . . . . . . . . . . . . . . . . . . . . . . . . . . .855.2.3. Crisis Development . . . . . . . . . . . . . . . . . . . . . . . . . . . . . . . . . . . . . . . . . . . . . . . . . . . . . . . . . . .88
5.3. Response to the Crisis . . . . . . . . . . . . . . . . . . . . . . . . . . . . . . . . . . . . . . . . . . . . . . . . . . . . . . . . . . . . . . . .925.3.1. Introduction . . . . . . . . . . . . . . . . . . . . . . . . . . . . . . . . . . . . . . . . . . . . . . . . . . . . . . . . . . . . . . . . .925.3.2. Monetary Policy Response . . . . . . . . . . . . . . . . . . . . . . . . . . . . . . . . . . . . . . . . . . . . . . . . . . . . . .92
CASE Reports No. 39
5
The Episodes of Currency Crisis in Latin...
CASE Reports No. 39
5.3.3. Fiscal Policy Response . . . . . . . . . . . . . . . . . . . . . . . . . . . . . . . . . . . . . . . . . . . . . . . . . . . . . . . . . .925.3.4. Banking System and Debt Restructuring . . . . . . . . . . . . . . . . . . . . . . . . . . . . . . . . . . . . . . . . . . . .965.3.5. Prospects for the Future . . . . . . . . . . . . . . . . . . . . . . . . . . . . . . . . . . . . . . . . . . . . . . . . . . . . . . . .97
5.4. Conclusions . . . . . . . . . . . . . . . . . . . . . . . . . . . . . . . . . . . . . . . . . . . . . . . . . . . . . . . . . . . . . . . . . . . . . . .97Appendix: The Chronology of the Indonesian Crisis . . . . . . . . . . . . . . . . . . . . . . . . . . . . . . . . . . . . . . . . . . . . .99References . . . . . . . . . . . . . . . . . . . . . . . . . . . . . . . . . . . . . . . . . . . . . . . . . . . . . . . . . . . . . . . . . . . . . . . . .100
Part VI. The South Korean Currency Crisis, 1997–1998 by Monika B³aszkiewicz . . . . . . . . . . . . . .101
6.1. Was Korea Different? . . . . . . . . . . . . . . . . . . . . . . . . . . . . . . . . . . . . . . . . . . . . . . . . . . . . . . . . . . . . . . .1016.1.1. Introduction . . . . . . . . . . . . . . . . . . . . . . . . . . . . . . . . . . . . . . . . . . . . . . . . . . . . . . . . . . . . . . . .1016.1.2. Background to the Crisis . . . . . . . . . . . . . . . . . . . . . . . . . . . . . . . . . . . . . . . . . . . . . . . . . . . . . .1016.1.3. Signs of Vulnerability . . . . . . . . . . . . . . . . . . . . . . . . . . . . . . . . . . . . . . . . . . . . . . . . . . . . . . . . . .103
6.2. The Role of Chaebols in the Future Development of Crisis . . . . . . . . . . . . . . . . . . . . . . . . . . . . . . . . . . .1046.2.1. Debt Financing . . . . . . . . . . . . . . . . . . . . . . . . . . . . . . . . . . . . . . . . . . . . . . . . . . . . . . . . . . . . . .1056.2.2. Investments . . . . . . . . . . . . . . . . . . . . . . . . . . . . . . . . . . . . . . . . . . . . . . . . . . . . . . . . . . . . . . . .106
6.3. Korean Financial System and its Liberalization . . . . . . . . . . . . . . . . . . . . . . . . . . . . . . . . . . . . . . . . . . . . .1086.3.1. Non-banking Financial Institutions . . . . . . . . . . . . . . . . . . . . . . . . . . . . . . . . . . . . . . . . . . . . . . . .1086.3.2. Capital Account Liberalization . . . . . . . . . . . . . . . . . . . . . . . . . . . . . . . . . . . . . . . . . . . . . . . . . .1096.3.3. Credit Expansion . . . . . . . . . . . . . . . . . . . . . . . . . . . . . . . . . . . . . . . . . . . . . . . . . . . . . . . . . . . .1116.3.4. Risk Assessment in the Banking System . . . . . . . . . . . . . . . . . . . . . . . . . . . . . . . . . . . . . . . . . . . .113
6.4. The Onset of the Crisis . . . . . . . . . . . . . . . . . . . . . . . . . . . . . . . . . . . . . . . . . . . . . . . . . . . . . . . . . . . . . .1136.5. The 1998 Recession and 1999 Recovery . . . . . . . . . . . . . . . . . . . . . . . . . . . . . . . . . . . . . . . . . . . . . . . . .115
6.5.1. The IMF Intervention in Asia . . . . . . . . . . . . . . . . . . . . . . . . . . . . . . . . . . . . . . . . . . . . . . . . . . . .1156.5.2. Macroeconomic Environment after the Crisis . . . . . . . . . . . . . . . . . . . . . . . . . . . . . . . . . . . . . . .117
6.6. Conclusions . . . . . . . . . . . . . . . . . . . . . . . . . . . . . . . . . . . . . . . . . . . . . . . . . . . . . . . . . . . . . . . . . . . . . .117Appendixes . . . . . . . . . . . . . . . . . . . . . . . . . . . . . . . . . . . . . . . . . . . . . . . . . . . . . . . . . . . . . . . . . . . . . . . . .119
Appendix 1: 30 Largest Cheabols: April 1996 . . . . . . . . . . . . . . . . . . . . . . . . . . . . . . . . . . . . . . . . . . . .119Appendix 2: Foreign Capital Controls in Korea, June 1996 . . . . . . . . . . . . . . . . . . . . . . . . . . . . . . . . . .120Appendix 3: Chronology of the Korean Crisis 1997 . . . . . . . . . . . . . . . . . . . . . . . . . . . . . . . . . . . . . . .121Appendix 4: Banking System and Corporate Restucturing . . . . . . . . . . . . . . . . . . . . . . . . . . . . . . . . . . .122
References . . . . . . . . . . . . . . . . . . . . . . . . . . . . . . . . . . . . . . . . . . . . . . . . . . . . . . . . . . . . . . . . . . . . . . . . .123
Comments to Papers on Asian Crises by Jerzy Pruski . . . . . . . . . . . . . . . . . . . . . . . . . . . . . . . . . . .125
6
Marek D¹browski (ed.)
CASE Reports No. 39
Ma³gorzata Antczak
Ma³gorzata Antczak is an economist at the Centre for Social and Economic Research. After she graduated from theDepartment of Economics at the Warsaw University in 1994, she joined the CASE Foundation. She works in the fields ofmacroeconomics in transition economies and social policy issues. The research activity included also education issue and it'srelationship to labour market in Poland
Monika B³aszkiewiczEconomist, Ministry of Finance
The author received MA in International Economics from the University of Sussex in January 2000. Presently, MonikaB³aszkiewicz works for the Ministry of Finance at the Department of Financial Policy, Analysis and Statistics. Her main inter-est lies in short-term capital flows to developing and emerging market economies and the role this kind of capital plays inthe process of development and integration with the global economy. In every day work she deals with the problem relat-ed to Polish integration with EU, in particular in the area of Economic and Monetary Union.
Marek D¹browski
Marek D¹browski, Professor of Economics, V-Chairman and one of the founders of the CASE – Center for Social andEconomic Research in Warsaw; Director of the USAID Ukraine Macroeconomic Policy Program in Kiev carried out byCASE; from 1991 involved in policy advising for governments and central banks of Russia, Ukraine, Kyrgyzstan, Kazakhstan,Georgia, Uzbekistan, Mongolia, and Romania; 1989–1990 First Deputy Minister of Finance of Poland; 1991–1993 Memberof the Sejm (lower house of the Polish Parliament); 1991–1996 Chairman of the Council of Ownership Changes, the advi-sory body to the Prime Minister of Poland; 1994–1995 visiting consultant of the World Bank, Policy Research Department;from 1998 Member of the Monetary Policy Council of the National Bank of Poland. Recently his area of research interestis concentrated on macroeconomic policy problems and political economy of transition.
Ma³gorzata Jakubiak
Ma³gorzata Jakubiak has collaborated with the CASE Foundation since 1997. She graduated from the University of Sus-sex (UK; 1997) and the Department of Economics at the University of Warsaw (1998).
Her main areas of interest include foreign trade and macroeconomics of open economy. She has published articles ontrade flows, exchange rates, savings and investments in Poland and other CEE countries. During 2000-2001 she was work-ing at the CASE mission in Ukraine as resident consultant.
Wojciech Paczyñski
Economist at the Centre for Eastern Studies, Ministry of Economy, Warsaw. Graduated from the University of Sussex(1998, MA in International Economics) and University of Warsaw (1999, MA in Economics; 2000, MSc in Mathematics).Since 1998 he has been working as an economist at the CES. In 2000 started co-operation with CASE. His research inter-ests, include economies in transition, political economy and game theory.
Marcin Sasin
Marcin Sasin has joined CASE Foundation in 2000. He is an economist specializing in international financial economicsand monetary policy issues. He obtained Master of Science at the Catholic University of Leuven, Belgium in 2000. He alsoholds MA. in Oriental Studies at the Warsaw University.
7
The Episodes of Currency Crisis in Latin...
CASE Reports No. 39
The decade of the 1990s brought a new experience withfinancial instability. While earlier currency crises werecaused mainly by the evident macroeconomic mismanage-ment (what gave theoreticians an empirical ground for aconstruction of the so-called first generation models of cur-rency crises), during the last decade they also happened toeconomies enjoying a good reputation. This new experiencestarted with the 1992 ERM crisis when the British poundand Italian lira were forced to be devalued. This was parti-cularly surprising in the case of the UK, the country, whichwent successfully through series of very ambitious econo-mic reforms in the 1980s.
At the end of 1994 the serious currency crisis hit Mexi-co, and during next few months it spread to other LatinAmerican countries, particularly to Argentina (the so-calledTequila effect). Although Argentina managed to defend itscurrency board, the sudden outflow of capital and bankingcrisis caused a one-year recession. Currency crises have notbeen the new phenomena in the Western Hemispherewhere many Latin American countries served throughdecades as the textbook examples of populist policies andeconomic mismanagement. However, two main victims of"Tequila" crisis – Mexico and Argentina – represented a pret-ty successful record of reforming their economies and expe-rienced turbulence seemed to be unjustified, at least at firstsight.
Two years later even more unexpected and surprisingseries of financial crises happened in South East Asia. TheAsian Tigers enjoyed a reputation of fast growing, macro-economically balanced and highly competitive economies,which managed to make a great leap forward from the ca-tegory of low-income developing countries to middle oreven higher-middle income group during life of one genera-tion. However, a more careful analysis as done in this vol-ume could easlly the specify several serious weaknesses,particularly related to financial and corporate sector. Addi-tio-nally, as in the case of Mexico, managing the crisis in itsearly stage was not specially successful and only provokedfurther devaluation pressure and financial market panic.
The external consequences of the Asian crisis becamemuch more serious than those of the Mexican crisis. While
the later had a regional character only, the former affectedthe whole global economy and spread through other conti-nents. The Asian crisis started in Thailand in July 1997 and itsfirst round of contagion hit Malaysia, Indonesia and thePhilippines in summer 1997. The next wave caused seriousturbulence in Hong Kong, the Republic of Korea, and againin Indonesia in the fall of 1997 and beginning of 1998. Singa-pore and Taiwan were affected to lesser extent. Asiandevelopments also undermined market confidence in otheremerging markets, particularly in Russia and Ukraine expe-riencing the chronic fiscal imbalances. Both countries, afterresisting several speculative attacks against their currenciesin the end of 1997 and in the first half of 1998, finallyentered the full-scale financial crisis in August – September1998. Following Russia and Ukraine, also other post-Sovieteconomies experienced forced devaluation and debt crisis.This relates to Moldova, Georgia, Belarus, Kyrgyzstan,Uzbekistan, Kazakhstan, and Tajikistan. Finally, Russiandevelopments triggered eruption of currency crisis in Brazilin early 1999, and some negative contagion effects for otherLatin American economies, particularly for Argentina(1999–2000).
In the meantime, cumulated negative consequences ofthe Asian and Russian crises damaged confidence not only inrelation to the so-called emerging markets but also affectedthe financial markets of developed countries. In the lastquarter of 1998 the danger of recession in the US andworldwide pushed the Federal Reserve Board to ease sig-nificantly its monetary policy. However, some symptoms ofthe global slowdown such as a substantial drop in prices ofoil and other basic commodities could not be avoided.
The new crisis episodes stimulated both theoreticaldiscussion and large body of empirical analyzes trying toidentify the causes of currency crises, their economic andsocial consequences, methods of preventing them andeffective management when a crisis already happened. Onthe theoretical ground, the new experience brought theso-called second and third generation of currency crisesmodels. Both theoretical and empirical discussion startedto put attention on the role of market expectations andmultiple equilibria.
Introductionby Marek D¹browski
8
Marek D¹browski (ed.)
In some extreme interpretations the role of the so-called fundamentals, i.e. soundness of economic policy,started to be neglected in favor of the role of collective psy-chology of financial market players (multiple equilibria, herdbehavior, market panic, contagion effect). However, as thedetailed analysis of the crisis episodes shows it would behard to find any convincing case of currency crisis in "inno-cent" country. Although the role of multiple equilibria cannotbe questioned, they can trigger a crisis only when funda-mentals are under question. This is convincingly document-ed in all the country studies presented in this volume.
The same type of conclusions can be derived from dis-cussion on the role of globalization. Although increasingintegration of product and financial markets make all coun-tries more mutually dependent and vulnerable to the exter-nal shocks, globalization itself cannot be blamed for causingcrisis in any particular country.
This volume presents six monographs of currency crisisepisodes in two Latin American countries in 1994–1995(Mexico and Argentine) and four Asian countries in1997–1998 (Thailand, Malaysia, Indonesia, and Korea). The
Asian part of this volume is supplemented with a short com-parative note, commenting these four monographs.
All the studies were prepared under the research pro-ject no. OI44/H02/99/17 on "Analysis of Currency Crises inCountries of Asia, Latin America and Central and EasternEurope: Lessons for Poland and Other Transition Coun-tries", carried out by CASE and financed by the Committeefor Scientific Research (KBN) in the years 1999–2001. Theywere subjects of public presentation and discussion duringthe seminar in Warsaw organized by CASE on December21, 2000, under the same research project.
In the all analyzed cases currency crises were accompa-nied by other signs of financial turbulence such as (publicand/or private) debt crisis or banking crisis. However, thelimited scope of the conducted analysis forced the researchteam to concentrate on the currency crises and refer tobanking and debt crisis only as the background or conse-quence of the currency devaluation.
This collection of papers will be followed by another volume presenting episodes of currency crises in the Euro-pean transition economies.
CASE Reports No. 39
9
The Episodes of Currency Crisis in Latin...
CASE Reports No. 39
1.1. History of the Crisis
In order to put into context the developments that final-ly led to the currency crisis of 1994/1995, it is useful to goback as far as mid-1980's. In December 1987, a set ofreform policies was initiated aimed at "remaking the Mexi-can economy" [Lustig, 1992]. The shift in policies was acce-lerated after 1988 as they gained support from the newlyelected president Carlos Salinas de Gortari [DeLong et al.,1996]. The reform package was successful and broughtmacroeconomic stabilisation. Inflation was reduced fromnearly 160% in 1987 to the range of 18% – 30% in1989–1991 and further down to less than 12% in 1992 and8.3% in 1993. At the same time economic growth resumedreaching 3.5–4.5% pa. in the period 1989–1992. This resultwas quite remarkable given the record of failed reformattempts in previous years [Blejer and del Castillo, 1996].
The 1989 foreign debt restructuring left Mexico withrelatively low and mostly long-term foreign debt (itaccounted for some 19% of GDP at the end of 1993) [Sachset al., 1995]. Public debt was substantially reduced from67% of GDP in 1989 to 30% in 1993. From December1990 onwards, foreigners were allowed to purchase short-term government peso-denominated debt instruments [Gil-Diaz, 1998]. After the restructuring, Mexico once againgained access to international financial markets. Private ca-pital inflows surged to an average of above 6% of GDP inthe period 1990–1993 [IMF, 1995].
Economic policies during the period 1990–1993 result-ed in the implementation of important structural reforms invarious fields. The authorities undertook major domesticfinancial sector reform and capital account liberalisation[Otker and Pazarbasioglu, 1995] and privatisation. Oneshould also note the improvement of the regulatory frame-work governing economic activity in many sectors, e.g. intourism, means of transport, petrochemicals, electricity,telecommunications, etc. [WTO, 1997]. Another importantfactor was trade liberalisation. This process had started
much earlier. In 1985 Mexico formally joined the GeneralAgreement on Tariffs and Trade (GATT). The next majorstep was the signing of the North American Free TradeAgreement (NAFTA) in 1992 that stipulated the reductionin non-tariff barriers, liberalisation of investment laws,changes in competition law, etc. The NAFTA finally tookeffect in January 1994.
The government followed a path of budgetary discipline.The operational budget of the public sector [1] was in sur-plus in the range of 2–3% of GDP in the early 1990's. Sev-eral social pacts were concluded between the governmentand labour organisations as well as business representatives[Blejer and del Castillo, 1996]. Among the issues agreedupon was the exchange rate policy that became the centralanti-inflationary instrument. The question whether theexchange rate policy was appropriate and whether it result-ed in an overvaluation of the peso is one of the major issuesraised in all analyses of the currency crisis of 1994/1995.This problem will be discussed later.
In 1993, the overall economic situation deterioratedslightly. GDP growth slowed to only 0.6% and privateconsumption and investment fell in real terms. Thesedevelopments are mostly attributed to the ongoingrestructuring in the manufacturing sector, a tightening ofcredit conditions by monetary authorities, and a creditsqueeze resulting from the deterioration in the quality ofbanks' loan portfolio [IMF, 1995]. There was also someuncertainty about the approval of NAFTA, which was final-ly resolved in November.
Despite these setbacks, until 1994 Mexico was widelyregarded as an example of a successful economic reformstory. Some other views [Dornbusch and Werner, 1994]appeared among economists, but were not picked up norwere they considered important by investors. Suddenly, inthe course of 1994, several events took place that turnedout to be of considerable importance for Mexico's econo-mic situation.
January witnessed the peasant rebellion in Chiapas – thefirst one of political events of 1994 that later turned out tohave a significant impact on financial stability of the country.
Part I.The Mexican Peso Crisis 1994–1995by Wojciech Paczyñski
[1] Operational balance is defined as primary balance plus the real portion of the interest paid on public debt.
10
Marek D¹browski (ed.)
CASE Reports No. 39
In February, U.S. interest rates started to rise. In March thecandidate in presidential elections Luis D. Colosio wasassassinated. This came as a shock to investors and led tosevere financial turbulence. The peso exchange rateincreased from the bottom of the intervention band [2],where it stayed before, to the ceiling of the band, whichconstituted a nominal devaluation of ca. 10%. This wasaccompanied by a decrease in Central Bank reserves ofaround 9 billion USD. The monetary authorities followed apath of a rather loose monetary policy, boosting credit tothe economy in order to prevent interest rate increase andto support weak commercial banks. Also, in the run-up tothe presidential elections (the output slowdown could hadbeen another factor) fiscal policy became more expansion-ary. The actions involved some tax cuts and increases insocial spending [IMF, 1995].
In August presidential elections took place that gave avictory to Ernesto Zedilo. His victory, with a higher thanexpected margin, was considered a positive event from thepoint of view of foreign investors even though the electionswere not carried out in a perfect way. In September, thesecretary general of the ruling party was assassinated.
Higher domestic interest rates (around 16% pa. fromApril until July as opposed to around 10% pa. in the firstquarter) and the approval of a 6.75 billion USD short termcredit line from NAFTA partners helped to ease the pres-sures from financial markets. The peso exchange rate stayednear the ceiling of the band, outflow of capital was stoppedand reserves remained relatively stable from April untilOctober. After July, interest rates began even to decline.
Another policy action implemented by the authorities inorder to increase the credibility of maintaining the exchangerate rule and to prevent increases in interest rates was sub-stituting short term peso-denominated government debt(Cetes) with dollar-indexed (but payable in pesos) shortterm bonds (Tesobonos). This started after the Marchevents and continued in the following months. The out-standing stock of Tesobonos increased significantly – from14 billion pesos in March 1994 to 63.6 billion in November.The whole operation within a very short period dramatical-ly changed the composition of short-term debt held by theprivate sector. While in the first quarter the share ofTesobonos in total Cetes and Tesobonos stock did notexceeded 10%, it reached almost 60% in July.
The current account continued to deteriorate in thethird quarter of 1994 reaching a record level deficit of 7.9billion USD. In addition, both the stock of Tesobonos and itsshare in total short-term debt increased further. Heightenedconcerns about the sustainability of Mexico's external posi-tion led to intensified capital outflows. The reservesdeclined by 4.7 billion USD between October and Novem-
ber and further 2.5 billion USD to 10 billion USD in mid-December. On 1 December president Zedillo took officeand two days later the unrest in Chiapas intensified. Giventhe current situation, the authorities decided on 20 Decem-ber to widen the exchange rate band by 15%. This movewas accompanied by the announcement of the authoritiesto support the peso at a rate of around 4 pesos to the U.S.dollar. This announcement was, however, not perceived ascredible by investors, who put further pressure on theexchange rate. The Bank of Mexico lost around 4 billionUSD within two days and was forced to freely float the pesoon 22 December.
Inflation was certainly one of the most important prob-lems that the authorities had to tackle after the devaluation.It jumped to the level of around 8% monthly, but in the sec-ond half of the year was reduced to the range 2–4% month-ly. The peak of 12-month inflation was recorded in Decem-ber 1995, when it stood at 51.97%. During the first quarterof 1995, the peso depreciated at a rather high rate reaching6.82 in the end of March. It then regained some strengthfluctuating between 5.8 and 6.4 pesos to the dollar untilSeptember, to fell further in the last quarter to 7.64 in theend of December.
The crisis also resulted in a severe recession with GDPfalling by 9.2% YoY in the second quarter and respectivelyby 8.0% and 7.0% in the third and fourth quarter of 1995[INEGI, 2000]. Industrial production dropped sharply andthe unemployment rate increased. In the second part of theyear, the first signs of economic recovery became visible.These trends intensified in the last quarter, and since thesecond quarter of 1996 the Mexican economy returned to apath of fast growth (YoY rate of GDP growth reached 7.2%in the second quarter of 1996). The severity of the 1995recession was caused by several factors, the most importantprobably being very high interest rates (lending rate stayedclose to 70% in the first half of the year) that were used asan anti-inflationary measure. Other factors included a signi-ficant drop in capital inflows, and sudden reduction in cred-it in the economy. Domestic consumption was furtherrepressed due to debt overhang and possibly substantialnegative income and wealth effects resulting from the deva-luation [SHCP, 1995]. Gruben et al. (1997) point at sectoralfragmentation of severity of recession and the timing andstrength of a rebound.
During 1995, significant adjustment took place in exter-nal position of Mexico. Exports surged by 30% in compari-son to 1994 and imports contracted by around 9%. As aresult, the trade balance improved from a deficit of 18.5 bil-lion USD in 1994 to a surplus of 7 billion in 1995. The cur-rent account deficit contracted from nearly 30 billion USDin 1994 to only 1.5 billion USD. A very important achieve-
[2] Since November 1991 Mexico operated a moving band exchange rate system. This is discussed in more detail in section 1.2.4.
11
The Episodes of Currency Crisis in Latin...
CASE Reports No. 39
ment of the authorities was the elimination of the short-term debt overhang and consequently regaining access tointernational capital markets. In particular Tesobonos werepractically eliminated from the short-term debt stock during1995. An access to credits from the foreign financial supportpackage played an important role in managing the debtproblem. Mexico used close to 12 billion USD of IMF cre-dits in 1995 in addition to around 14 billion of other excep-tional financing. A much-improved economic conditionallowed Mexico to pay back these credits, in some instancesahead of schedule. Since 1996 Mexico has experienced re-latively stable economic growth.
1.2. In Search of the Causes of the Crisis:Macroeconomic Factors
1.2.1. Fiscal Policy
The role of fiscal policy in the peso crisis has not beenemphasised in most of the studies. This is because in theearly 1990's Mexico achieved remarkable successes in near-ly balancing the public finances. The general public sectordeficit declined from around 16% of GDP in 1986 to about2% in 1993. In 1994 the result was not much worse – thedeficit reached around 3.9% of GDP [3]. This fiscal perfor-mance was to a large extent due to reduced interest pay-ments during the period. One important observation is thatfiscal policy was not tightened, and thus was not used as atool for dealing with negative shocks of 1994. On the con-trary, fiscal policy was rather looser in the election year.
The role of quasi-fiscal operations via development bankcredits in 1994 is not very clear. Very soon after the crisis,some authors presented the view that fiscal expansion
through this channel could had played some role in the mixof bad policies that were implemented in 1994 [World Bank,1995]. Most of the analyses show however, that develop-ment banks' credit was not an important factor. Sachs et al.(1995) argue that most of the activities of these banks donot belong in an economically meaningful definition of abudget deficit.
An innovative way of looking at the role of fiscal policyin explaining the crisis is proposed by Kalter and Ribas(1999). They point out the role of the increasing magni-tude of go-vernment operations, rather than the size ofgovernment deficit, in affecting the relative price of tradedto non-traded goods (i.e. the real exchange rate), thefinancial condition of the traded sector, and interest rates.They argue that the significant rise in government non-oilrevenue collections measured in U.S. dollars or in terms oftraded goods prices has had an effect on the tradable sec-tor analogous to that of a surge in export commodityprices (Dutch disease). The resulting deterioration offinances of traded goods sector was then passed to com-mercial banks' finances. While the arguments used byKalter and Ribas (1999) are interesting and certainly addanother dimension to the understanding of fundamentalreasons behind the crisis, they do not provide an explana-tion for sudden events of December 1994.
1.2.2. Savings and Investment Balance
In the period 1988–1994 Mexico witnessed a notice-able growth in investment and a decline in savings (seeTable 1-2). Overall investment grew from 20.4% of GDPin 1988 to 23.6% in 1994. Interestingly, public sectorinvestments remained relatively stable and were evenreduced, while the growth was due to the private invest-
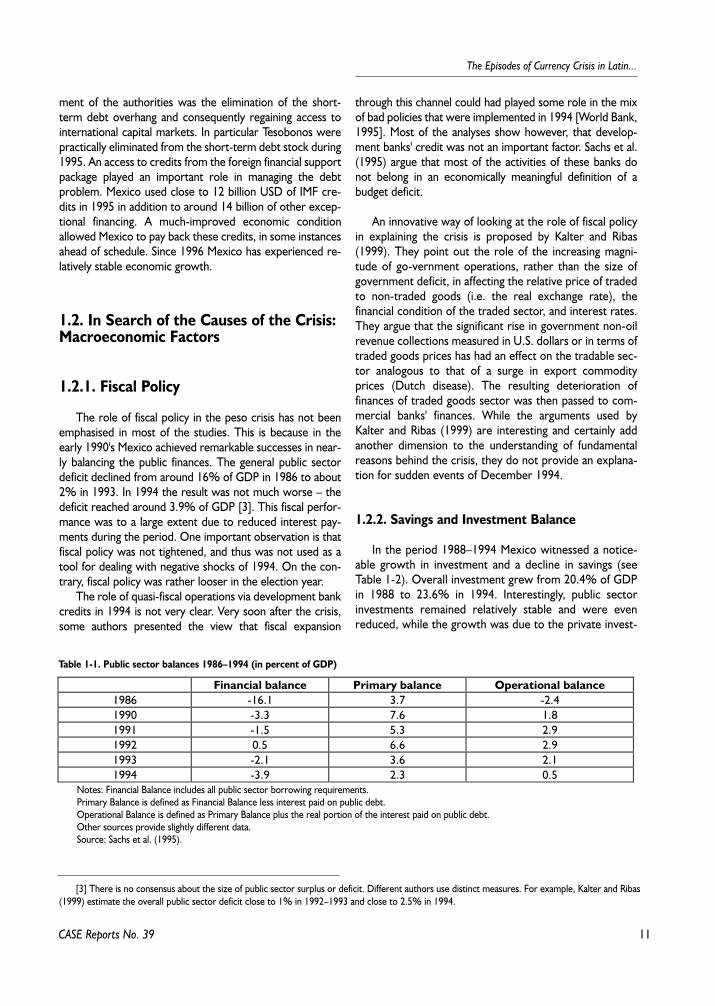
Table 1-1. Public sector balances 1986–1994 (in percent of GDP)
Financial balance Primary balance Operational balance1986 -16.1 3.7 -2.41990 -3.3 7.6 1.81991 -1.5 5.3 2.91992 0.5 6.6 2.91993 -2.1 3.6 2.11994 -3.9 2.3 0.5
Notes: Financial Balance includes all public sector borrowing requirements.Primary Balance is defined as Financial Balance less interest paid on public debt.Operational Balance is defined as Primary Balance plus the real portion of the interest paid on public debt.Other sources provide slightly different data.Source: Sachs et al. (1995).
[3] There is no consensus about the size of public sector surplus or deficit. Different authors use distinct measures. For example, Kalter and Ribas(1999) estimate the overall public sector deficit close to 1% in 1992–1993 and close to 2.5% in 1994.

12
Marek D¹browski (ed.)
CASE Reports No. 39
ment boom. This was accompanied by an even moreapparent reduction in propensity to save. Total savings fellfrom 19% of GDP in 1988 to only 15.2% of GDP in 1993and 15.7% in 1994. Private savings declined from 17.6%of GDP in 1988 to 8.9% in 1993 before starting to grow,albeit modestly, in 1994. This leads to the conclusion thatthe deterioration in the current account – the deficitreached 6.8% of GDP in 1993 and 7.9% in 1994 – wasprimarily caused by the level of private savings not match-ing the level of private investment [4].
1.2.3. Private and Public Debt
The role of Mexico's indebtedness in provoking thefinancial crisis deserves a more detailed analysis. First, itshould be noted that Mexico had a history of problems asso-ciated with its foreign debt, including the crisis of 1982. Incontrast to the past, the beginning of the 1990's was markedby a very significant improvement in this sphere. Public debtwas reduced from some 64% of GDP in 1989 to 35% ofGDP in 1993. Of this, 23% of GDP was foreign debt that asa result of 1989 restructuring had a favourable maturitystructure (long term liabilities prevailed). Domestic debtaccounted for 12% of GDP [IMF, 1995] [5]. These numberswere low in comparison to other developing and developedcountries. Moreover, standard debt indicators such as theratio of total debt to GDP or to exports or the ratio of inte-rests on debt to GDP or exports were improving in theearly 90's. This clearly shows that the overall level of publicdebt did not play a big role in the loss of investors' confi-dence in 1994.
What did matter, however, was the maturity and cur-rency structure of the domestic debt and the level of pri-vate borrowing. From 1989 to 1992, net credit to theprivate sector from the financial system expanded at anaverage annual rate of 66% in nominal terms, offsettingthe decline in borrowing of the public sector resultingfrom the substantially improved fiscal position [IMF,1995]. In 1993 net domestic credit of the banking systemcontinued to expand at an annual rate of around 20%.Interestingly, this decomposes into a substantial reduc-tion in credit to the public sector (around 30%) and anexpansion of credit to the private sector of the samemagnitude (see table 1-3). This trend continued throughthe first half of 1994, while in the second half public sec-tor borrowing also started to rise, bringing the 12-monthrate of growth of net domestic credit from the bankingsystem to around 30%. It is also worth noting the fasterexpansion of credit to private sector from developmentbanks than from commercial banks in 1994. Other inter-esting statistics are presen-ted in Gil-Diaz (1998) [6]which indicate that in the period from December 1988to November 1994 credit card liabilities rose at an aver-age rate of 31% per year, direct credit for consumerdurables rose at a yearly rate of 67% and mortgage loansat an annual rate of 47%, all in real terms.
The above numbers, along with numbers cited in sec-tion 1.2.2 with regard to private investment and savings,show that it was mostly private sector borrowing thatbrought the current account deficit to the levels it reachedin 1993 and 1994 (more than 6% of GDP). Such a level ofthe deficit seems quite high but was nevertheless easilyfinanced in 1993, and from that perspective there were
Table 1-2. Saving and investment levels 1988–1994 (in percent of GDP)
Saving Investment Net savingCurrentaccount
Public Private Total Public Private Total Public Private1988 1.4 17.6 19 5 15.4 20.4 -3.6 2.2 -1.41989 3.1 15.6 18.7 4.8 16.5 21.3 -1.7 -0.9 -2.61990 6.7 12.5 19.2 4.9 17 21.9 1.8 -4.5 -2.71991 7.5 10.3 17.8 4.6 17.8 22.4 2.9 -7.5 -4.61992 7.1 9.5 16.6 4.2 19.1 23.3 2.9 -9.6 -6.71993 6.3 8.9 15.2 4.2 17.8 22 2.1 -8.9 -6.81994 5 10.7 15.7 4.5 19.1 23.6 0.5 -8.4 -7.9
Source: Sachs et al. (1995)
[4] Sources differ in calculations of the current account deficit in relation to GDP. For example Gurrha (2000) citing official Mexican data estimatesthe deficit to account for 5.8% of GDP in 1993 and 7.0% in 1994.
[5] Also in this case different numbers are cited by other authors. For example Sachs et al. (1995) estimate the public debt at 67% of GDP in 1989and 30% in 1993. According to this source this last number can be broken down to 19% of GDP of foreign debt and 11% of domestic debt. The ave-rage maturity of domestic debt was around 200 days.
[6] The statistics were provided to the author (a former Vice Chancellor of the Bank of Mexico) by the Economic Research Department of Bankof Mexico.
13
The Episodes of Currency Crisis in Latin...
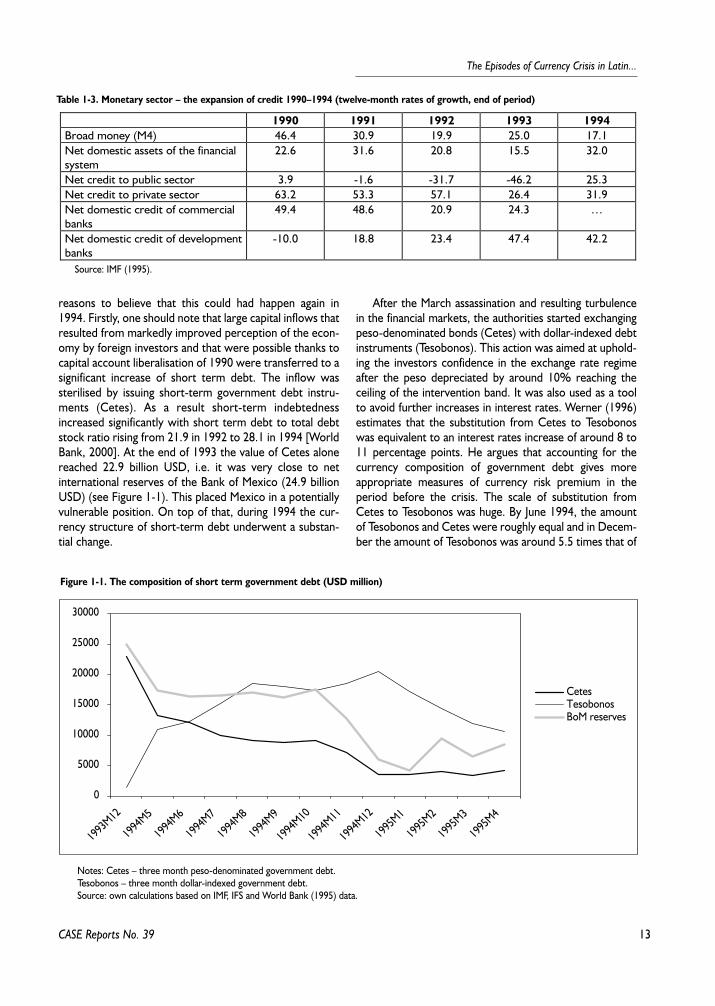
reasons to believe that this could had happen again in1994. Firstly, one should note that large capital inflows thatresulted from markedly improved perception of the econ-omy by foreign investors and that were possible thanks tocapital account liberalisation of 1990 were transferred to asignificant increase of short term debt. The inflow wassterilised by issuing short-term government debt instru-ments (Cetes). As a result short-term indebtednessincreased significantly with short term debt to total debtstock ratio rising from 21.9 in 1992 to 28.1 in 1994 [WorldBank, 2000]. At the end of 1993 the value of Cetes alonereached 22.9 billion USD, i.e. it was very close to netinternational reserves of the Bank of Mexico (24.9 billionUSD) (see Figure 1-1). This placed Mexico in a potentiallyvulnerable position. On top of that, during 1994 the cur-rency structure of short-term debt underwent a substan-tial change.
After the March assassination and resulting turbulencein the financial markets, the authorities started exchangingpeso-denominated bonds (Cetes) with dollar-indexed debtinstruments (Tesobonos). This action was aimed at uphold-ing the investors confidence in the exchange rate regimeafter the peso depreciated by around 10% reaching theceiling of the intervention band. It was also used as a toolto avoid further increases in interest rates. Werner (1996)estimates that the substitution from Cetes to Tesobonoswas equivalent to an interest rates increase of around 8 to11 percentage points. He argues that accounting for thecurrency composition of government debt gives moreappropriate measures of currency risk premium in theperiod before the crisis. The scale of substitution fromCetes to Tesobonos was huge. By June 1994, the amountof Tesobonos and Cetes were roughly equal and in Decem-ber the amount of Tesobonos was around 5.5 times that of
CASE Reports No. 39
Figure 1-1. The composition of short term government debt (USD million)
0
5000
10000
15000
20000
25000
30000
1993
M12
1994
M5
1994
M6
1994
M7
1994
M8
1994
M9
1994
M10
1994
M11
1994
M12
1995
M1
1995
M2
1995
M3
1995
M4
CetesTesobonosBoM reserves
Notes: Cetes – three month peso-denominated government debt.Tesobonos – three month dollar-indexed government debt.Source: own calculations based on IMF, IFS and World Bank (1995) data.
Table 1-3. Monetary sector – the expansion of credit 1990–1994 (twelve-month rates of growth, end of period)
1990 1991 1992 1993 1994Broad money (M4) 46.4 30.9 19.9 25.0 17.1Net domestic assets of the financialsystem
22.6 31.6 20.8 15.5 32.0
Net credit to public sector 3.9 -1.6 -31.7 -46.2 25.3Net credit to private sector 63.2 53.3 57.1 26.4 31.9Net domestic credit of commercialbanks
49.4 48.6 20.9 24.3 …
Net domestic credit of developmentbanks
-10.0 18.8 23.4 47.4 42.2
Source: IMF (1995).
14
Marek D¹browski (ed.)
Cetes. Another way to look at the process is to note thataround 15 billion USD of private sector holdings in Ceteswere swapped for Tesobonos from March till November.
After the devaluation on 20 December, governmentborrowing was clearly not sustainable. Investors rushed towithdraw their investments and the government founditself unable to cover short term liabilities that led to apanic and the severe currency devaluation. Eventually, onlya huge international support package helped to solve theproblem. The shift to dollar denominated short-term pub-lic debt certainly contributed to the whole set of factorsthat provoked the crisis. Interestingly, however, risks asso-ciated with rapidly growing short-term dollar indexed debtof Mexico seem to had been underestimated, not to sayunnoticed, by the international financial community untilthe devaluation took place. Sachs et al. (1996) presentpuzzling statistics on international press coverage of Mexi-co. The issue of Tesobonos was completely ignored byleading international financial papers with only one articlementioning it being published before December 1994 [7].The problem of accumulated dollar denominated debtaccompanied by depleted foreign reserves constituted animportant factor in provoking the panic after theannouncement of devaluation on 20 December (Sachs etal., 1995, see also section 1.2.5).
1.2.4. Exchange Rate Policy
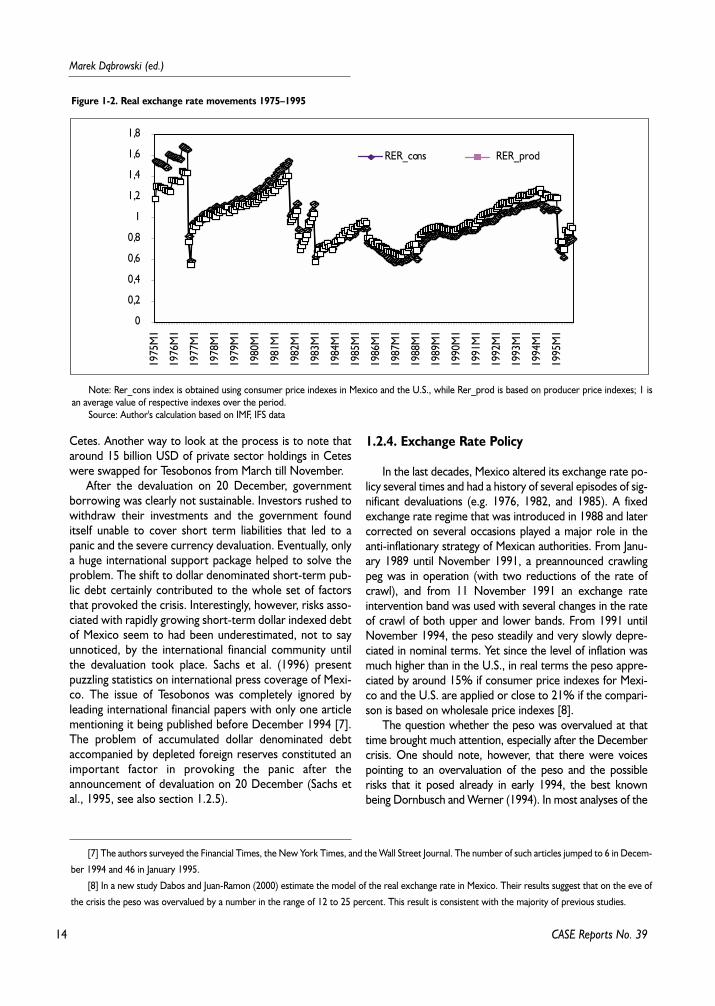
In the last decades, Mexico altered its exchange rate po-licy several times and had a history of several episodes of sig-nificant devaluations (e.g. 1976, 1982, and 1985). A fixedexchange rate regime that was introduced in 1988 and latercorrected on several occasions played a major role in theanti-inflationary strategy of Mexican authorities. From Janu-ary 1989 until November 1991, a preannounced crawlingpeg was in operation (with two reductions of the rate ofcrawl), and from 11 November 1991 an exchange rateintervention band was used with several changes in the rateof crawl of both upper and lower bands. From 1991 untilNovember 1994, the peso steadily and very slowly depre-ciated in nominal terms. Yet since the level of inflation wasmuch higher than in the U.S., in real terms the peso appre-ciated by around 15% if consumer price indexes for Mexi-co and the U.S. are applied or close to 21% if the compari-son is based on wholesale price indexes [8].
The question whether the peso was overvalued at thattime brought much attention, especially after the Decembercrisis. One should note, however, that there were voicespointing to an overvaluation of the peso and the possiblerisks that it posed already in early 1994, the best knownbeing Dornbusch and Werner (1994). In most analyses of the
CASE Reports No. 39
[7] The authors surveyed the Financial Times, the New York Times, and the Wall Street Journal. The number of such articles jumped to 6 in Decem-
ber 1994 and 46 in January 1995.
[8] In a new study Dabos and Juan-Ramon (2000) estimate the model of the real exchange rate in Mexico. Their results suggest that on the eve of
the crisis the peso was overvalued by a number in the range of 12 to 25 percent. This result is consistent with the majority of previous studies.
Figure 1-2. Real exchange rate movements 1975–1995
0
0,2
0,4
0,6
0,8
1
1,2
1,4
1,6
1,8
RER_cons RER_prod19
75M
1
1976
M1
1977
M1
1978
M1
1979
M1
1980
M1
1981
M1
1982
M1
1983
M1
1984
M1
1985
M1
1986
M1
1987
M1
1988
M1
1989
M1
1990
M1
1991
M1
1992
M1
1993
M1
1994
M1
1995
M1
Note: Rer_cons index is obtained using consumer price indexes in Mexico and the U.S., while Rer_prod is based on producer price indexes; 1 isan average value of respective indexes over the period.
Source: Author's calculation based on IMF, IFS data
15
The Episodes of Currency Crisis in Latin...
crisis that appeared after 1994, the view that the peso hasindeed been overvalued seems to gain rather strong support[World Bank, 1995]. The standard reasoning points to thefact that the exchange rate-based stabilisation under capitalmobility has led to a large current account deficit and realappreciation of the peso that at some point became unsus-tainable and the correction of real exchange rate was need-ed [IMF, 1995]. It is, however, not clear whether this hasplayed an important role in determining the crisis. In partic-ular, some authors concluded that the peso overvaluation isnot at all useful in explaining the crisis [Gil-Diaz, 1998]. Also,as Sachs et al. (1996) point out, significant reduction in infla-tion in 1994 and 10% nominal depreciation from March toApril 1994 certainly diminished the overvaluation problem.
On 20 December, the upper limit of the interventioncorridor was widened by 15%, but at that time the devalu-ation of that scale was widely regarded as insufficient. Onthe other hand, it undermined the confidence in the will andability of the Mexican authorities to uphold the announcedexchange rate policy. The continued pressure and a lack ofpossibilities to support the peso forced the authorities to letthe peso flow freely on 22 December. In later months, thepeso depreciated sharply hitting the rate of 6.82 pesos tothe dollar in the end of March 1995, i.e. nearly twice asmuch as before 20 December. It recovered slightly in thenext few months.
1.2.5. Monetary Policy
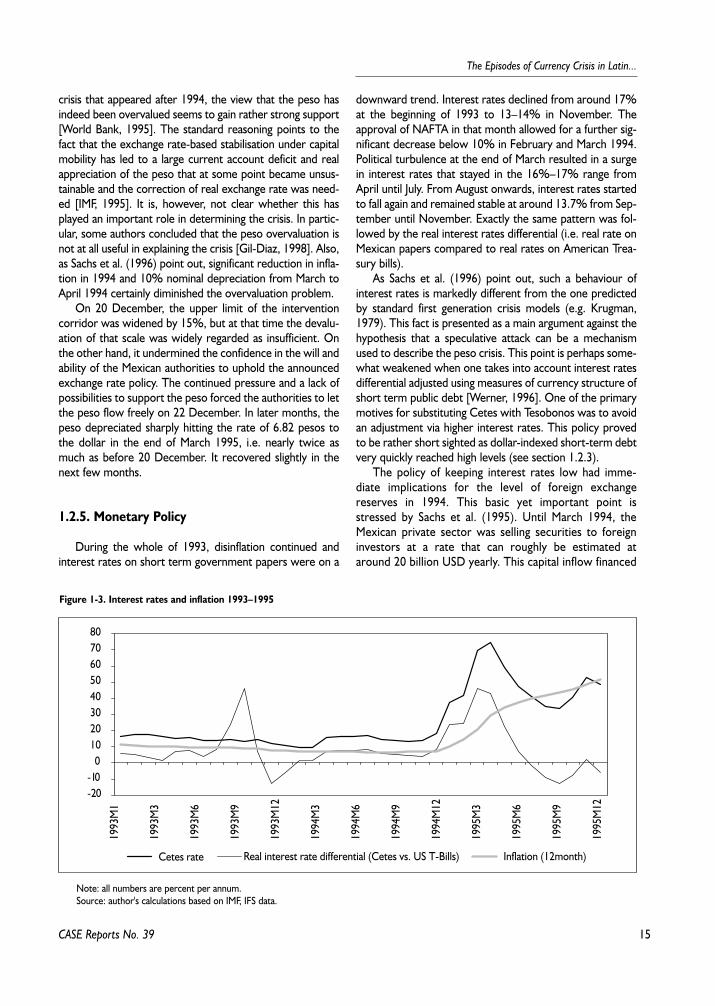
During the whole of 1993, disinflation continued andinterest rates on short term government papers were on a
downward trend. Interest rates declined from around 17%at the beginning of 1993 to 13–14% in November. Theapproval of NAFTA in that month allowed for a further sig-nificant decrease below 10% in February and March 1994.Political turbulence at the end of March resulted in a surgein interest rates that stayed in the 16%–17% range fromApril until July. From August onwards, interest rates startedto fall again and remained stable at around 13.7% from Sep-tember until November. Exactly the same pattern was fol-lowed by the real interest rates differential (i.e. real rate onMexican papers compared to real rates on American Trea-sury bills).
As Sachs et al. (1996) point out, such a behaviour ofinterest rates is markedly different from the one predictedby standard first generation crisis models (e.g. Krugman,1979). This fact is presented as a main argument against thehypothesis that a speculative attack can be a mechanismused to describe the peso crisis. This point is perhaps some-what weakened when one takes into account interest ratesdifferential adjusted using measures of currency structure ofshort term public debt [Werner, 1996]. One of the primarymotives for substituting Cetes with Tesobonos was to avoidan adjustment via higher interest rates. This policy provedto be rather short sighted as dollar-indexed short-term debtvery quickly reached high levels (see section 1.2.3).
The policy of keeping interest rates low had imme-diate implications for the level of foreign exchangereserves in 1994. This basic yet important point isstressed by Sachs et al. (1995). Until March 1994, theMexican private sector was selling securities to foreigninvestors at a rate that can roughly be estimated ataround 20 billion USD yearly. This capital inflow financed
CASE Reports No. 39
Figure 1-3. Interest rates and inflation 1993–1995
-20-10
01020304050607080
Cetes rate Real interest rate differential (Cetes vs. US T-Bills) Inflation (12month)
1993
M1
1993
M3
1993
M6
1993
M9
1993
M12
1994
M3
1994
M6
1994
M9
1994
M12
1995
M3
1995
M6
1995
M9
1995
M12
Note: all numbers are percent per annum.Source: author's calculations based on IMF, IFS data.
16
Marek D¹browski (ed.)
CASE Reports No. 39
the current account deficit. After March, interest ratesdemanded by foreign investors increased significantly yetthe monetary authorities responded by trying to fix inter-est rates using credit expansion. The Central Bank simplyoffered to buy securities accepting low interest rates.This shows up in the Bank of Mexico accounts as domes-tic credit expansion to both private sector (mainly banks)and the government (mainly Tesobonos purchased fromprivate investors). Such a behaviour did not provide anyincentive to reduce the current account deficit and left noother way but to finance it from foreign reserves. Whatactually happened was that credits (issued in pesos) wereconverted into dollars to cover the trade deficit at thefixed exchange rate.
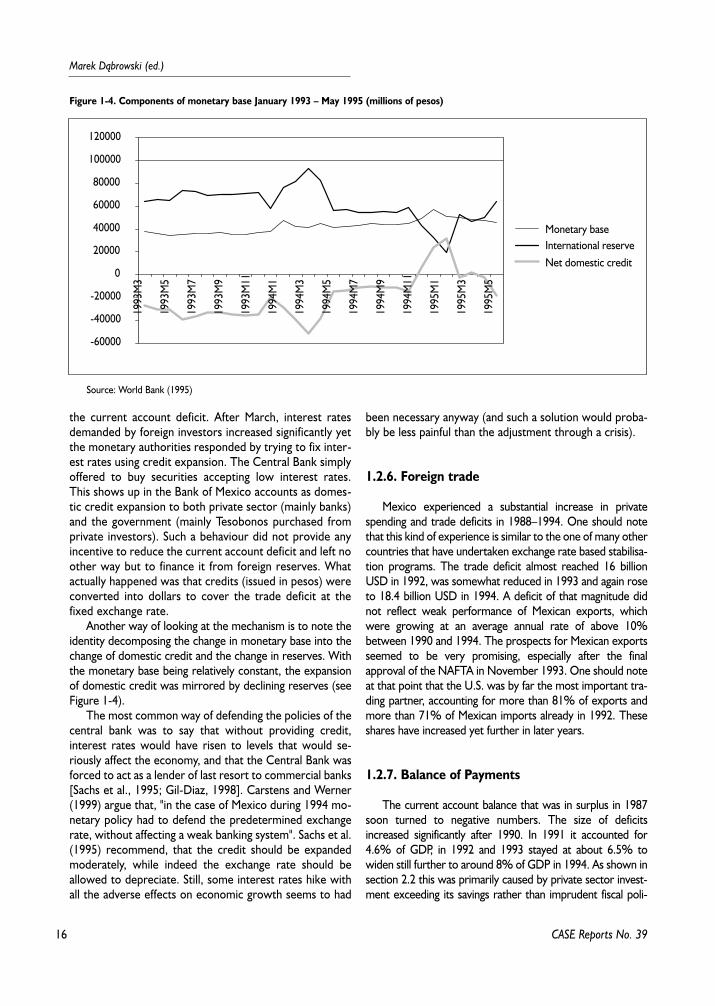
Another way of looking at the mechanism is to note theidentity decomposing the change in monetary base into thechange of domestic credit and the change in reserves. Withthe monetary base being relatively constant, the expansionof domestic credit was mirrored by declining reserves (seeFigure 1-4).
The most common way of defending the policies of thecentral bank was to say that without providing credit,interest rates would have risen to levels that would se-riously affect the economy, and that the Central Bank wasforced to act as a lender of last resort to commercial banks[Sachs et al., 1995; Gil-Diaz, 1998]. Carstens and Werner(1999) argue that, "in the case of Mexico during 1994 mo-netary policy had to defend the predetermined exchangerate, without affecting a weak banking system". Sachs et al.(1995) recommend, that the credit should be expandedmoderately, while indeed the exchange rate should beallowed to depreciate. Still, some interest rates hike withall the adverse effects on economic growth seems to had
been necessary anyway (and such a solution would proba-bly be less painful than the adjustment through a crisis).
1.2.6. Foreign trade
Mexico experienced a substantial increase in privatespending and trade deficits in 1988–1994. One should notethat this kind of experience is similar to the one of many othercountries that have undertaken exchange rate based stabilisa-tion programs. The trade deficit almost reached 16 billionUSD in 1992, was somewhat reduced in 1993 and again roseto 18.4 billion USD in 1994. A deficit of that magnitude didnot reflect weak performance of Mexican exports, whichwere growing at an average annual rate of above 10%between 1990 and 1994. The prospects for Mexican exportsseemed to be very promising, especially after the finalapproval of the NAFTA in November 1993. One should noteat that point that the U.S. was by far the most important tra-ding partner, accounting for more than 81% of exports andmore than 71% of Mexican imports already in 1992. Theseshares have increased yet further in later years.
1.2.7. Balance of Payments
The current account balance that was in surplus in 1987soon turned to negative numbers. The size of deficitsincreased significantly after 1990. In 1991 it accounted for4.6% of GDP, in 1992 and 1993 stayed at about 6.5% towiden still further to around 8% of GDP in 1994. As shown insection 2.2 this was primarily caused by private sector invest-ment exceeding its savings rather than imprudent fiscal poli-
Figure 1-4. Components of monetary base January 1993 – May 1995 (millions of pesos)
-60000
-40000
-20000
0
20000
40000
60000
80000
100000
120000
Monetary baseInternational reserveNet domestic credit
1993
M3
1993
M5
1993
M7
1993
M9
1993
M11
1994
M1
1994
M3
1994
M5
1994
M7
1994
M9
1994
M11
1995
M1
1995
M3
1995
M5
Source: World Bank (1995)
17
The Episodes of Currency Crisis in Latin...
CASE Reports No. 39
cies. The deficit was financed by high inflows of foreign capitalto the private sector, majority of which was portfolio invest-ment. With capital inflows higher than the level of the currentaccount deficit central bank's foreign currency reserves weregradually increasing from 6 billion USD in 1988 to 25.4 billionUSD in 1993. In order to sterilise capital inflows the govern-ment issued large amounts of short-term peso- denominatedtreasury bills (Cetes) (see also section 1.2.3).
The situation changed markedly after March 1994. Theinflow of foreign capital fell abruptly. The capital accountposition from the balance of payment deteriorated from11.8 billion USD in the first quarter to 3.7 billion in the sec-ond quarter. In turn, central bank's reserves fell from 29.3billion USD at the end of February to 17.7 billion at the endof April, i.e. by 11.6 billion USD. The reserves remainedrather stable at that level until November, when the nextwave of reserve erosion took place. At the end of Novem-ber they stayed at only 12.9 billion USD. This provoked thefinal speculative attack against the peso.
1.3. In Search for the Causes of theCrisis: Microeconomic Factors
In the years leading to the crisis major positive changestook place in the real sector environment. The economicprogram that was implemented starting in the late 1980sincluded several structural reforms. Substantial deregulationand privatisation took place along with trade liberalisation[Martinez, 1998]. The Mexican privatisation program wasone of the most comprehensive in the world in terms ofboth the size and the number of companies privatised [LaPorta and Lopez-de-Silane, 1999]. Privatisation was mostintensive in the period 1989–1992 and by 1992 the govern-ment had withdrawn from most sectors of the economywith the exception of oil, petrochemicals and the provisionof key infrastructure services. This constituted a majorchange to the situation from the early 1980s when the statewas intensely involved in the economy through more than athousand state-owned enterprises.
The financial system, that until late 1988 was highly regu-lated, also underwent a quick and substantial liberalisation[Gelos and Werner, 1999]. All these factors contributed to amajor improvement in perceived prospects of the Mexicaneconomy and consequently, given the situation in world finan-cial markets, resulted in large capital inflows to Mexico in theperiod 1990–1993. There is no general consensus concerningthe role of financial and real sector weaknesses in the pesocrisis. Also, this channel is not very often thoroughly analysed,perhaps due to limited access to relevant data.
It is clear that Mexico experienced a rapid expansion ofcredit to the private sector (see section 1.2.3). It is likely
that this was associated with poor screening of borrowers,and consequently, declining quality of credit [cf. Edwards,1999]. Such a process is not unique to Mexico. Lidgren et al.(1996) highlight the problem of a lack of necessary creditevaluation skills in formerly regulated banks that are there-fore unable to use newly available resources more efficient-ly. Also, the notion that banks problems often precedes thefinancial crisis (devaluation) has strong support from othercross-country analyses [e.g. Kaminsky and Reinhart, 1996;Lidgren et al., 1996]. Gil-Diaz (1998) points to several caus-es of the rapid debt increase, the speed of which over-whelmed supervisors, e.g.:
– speedy and not always well prepared privatisation ofbanks, sometimes with no respect to "fit and proper" criteria,either in the selection of new shareholders or top officers,
– lack of proper capitalisation of some privatised banksand involvement in reciprocal leverage schemes,
– lack of capitalisation rules based on market risk; thisencouraged asset-liability mismatches that in turn led to ahighly liquid liability structure,
– loss of human capital in banks during the years whenthey were under the government; banking supervisioncapacity not meeting the requirements of increases inbanks' portfolios.
1.4. Political Situation
The Mexican peso crisis provides a clear and very inte-resting example of how political factors can contribute to afinancial turbulence. The series of unexpected events in po-litics had a visible influence on the behaviour of economicaggregates and certainly played an important, through hardto measure, role in triggering the December crisis.
The first of the series of events started on New Year'sDay 1994 when peasants in the southern Mexican state ofChiapas began a rebellion by taking over six towns. Eventhough the uprising was rather quickly suppressed, itremained an issue in internal political life and occasionallyflared up again. Especially before the August elections, therebellion was again discussed and was recalled to questionthe extent of popular support for the government's eco-nomic program. On 23 March, Luis Donaldo Colosio, thepresidential candidate of the ruling party, was assassinated.The causes of this murder were never actually revealed, andthere were signs that it might had been associated with ten-sions within the ruling Institutional Revolutionary Party (PRI)[World Bank, 1995]. It should be noted that the PRI gov-erned Mexico since 1929 as a party organised around wellconnected political families. The assassination brought se-rious turbulence to the financial markets with the peso atthe ceiling of the intervention band and sharply higher inte-
18
Marek D¹browski (ed.)
CASE Reports No. 39
rest rates. Improper response of authorities to the turmoilin the end of March and in April set the stage for theDecember crisis [Sachs et al., 1995].
The situation seemed to have calmed down whenanother candidate of the PRI, Ernesto Zedillo won the pre-sidential elections on 21 August. He received above 50% ofvotes that came as a surprise to many observers. It is indeedhard to verify whether the elections were free of fraud. Onthe other hand, 1994 elections were perhaps more demo-cratic and fair than many previous elections in Mexico. Theoutcome of the elections was generally considered positivefrom the financial stability point of view but may also havecaused the authorities to believe that the worst of the insta-bility was over. One month after the elections, on 28 Sep-tember, PRI leader Jose Francisco Ruiz Massieu was assassi-nated. This murder remained a mystery too with severalhigh officials of PRI possibly somehow implicated.
All these developments certainly changed the position ofMexico's traditional ruling party. The process of reform inthe political scene actually began slightly earlier, and, asDornbusch and Werner (1994) point out, the rapid embraceof greater openness has shattered the PRI coherence, sothat the old corporatism became unmanageable. It is thusclear that during the whole 1994 there were serious ten-sions within the ruling elite and the uncertainty about Me-xico's political future was a factor in the foreign perceptionof the country's financial stability.
It should also be noted that the years of presidentialelections have traditionally been associated with financialturbulence. This fact was recalled in many analyses of the2000 presidential elections. Also, as many authors agree thelong period between the voting and taking the office by thepresident elect has a negative impact on the quality of go-verning the country. President Zedillo took office on 1December and it was followed by the intensified unrest inChiapas.
1.5. Crisis Management
While the policy mistakes of most of 1994 played animportant role in triggering the December crisis, improperhandling of the initial devaluation on 20 December probablyexacerbated the crisis.
The devaluation on 20 December was announced afterweeks of assurances that the government was committed tothe previous exchange rate system. The announcement wasmade by the Finance Minister on radio and television ratherthan through an official channel. As the World Bank (1995)stresses, such a way of publicising such a major policychange angered investors. Also, it turned out that businessleaders were consulted before the devaluation, thus havingthe opportunity to make profits at the expense of unin-
formed foreign investors [Krugman, 1997]. The devaluationwas widely considered insufficient and the exchange rateimmediately depreciated to the ceiling of the band, i.e. by15%. The authorities had sacrificed the credibility withoutsatisfying market expectations. The rush out of the countrycontinued on the next day with Central Bank's reservesreportedly falling below 6 billion USD [World Bank, 1995].President Zedillo affirmed the commitment to the newband, but on the next morning the government let the pesofloat. During the day it depreciated by a further 15%. On 26December the planned press conference by the FinanceMinister on the government anti-crisis plan was cancelled atthe last moment. On the next day the peso depreciated to5.45 pesos to the dollar. The auction of dollar denominatedgovernment bonds attracted almost no bids. Increasingprices made labour leaders to demand wage negotiations.On 29 December a new Finance Minister, Guillermo OrtizMartinez was appointed, who within a few days announceda new economic program.
On 3 January, Stanley Fisher, Acting Managing Directorof the International Monetary Fund, made a statementexpressing the Fund's support for this program andannouncing the establishment of the Exchange StabilisationFund of 18 billion USD with contributions under theNAFTA from the monetary authorities of other majorcountries as well as from private investors. The talks on astand-by credit from the IMF started a few days later andan 18-month credit of 17.8 billion USD was finallyapproved on 1 February.
The Mexican authorities' program constituted of threemain components: minimising the inflationary pressures ofthe devaluation, pushing forward structural reforms to sup-port and promote competitiveness of the private sector, andto address short term concerns of investors and establish acoherent floating exchange regime. To the end of the firstobjective, a National Accord was set among workers, busi-ness and government to prevent wages and prices hikes, thegovernment spending were to be reduced by 1.3% of GDP,and cuts in credits from state development banks were tobe implemented.
In terms of structural reforms President Zedillo pledgedto propose amendments to the constitution allowing for pri-vate investment in railroads and satellites, to open thetelecommunication sector to competition, and to increaseforeign participation in the banking sector. As the thirdobjective is concerned, the co-operation with investmentbanks in order to address the issue of Tesobonos wasannounced, as well as creating a futures market in pesos,and commitment to a tight monetary policy. In the beginningof March, the finance minister announced a package of fur-ther measures aimed at strengthening the program. Theseincluded substantial increases in prices charged by publicenterprises, VAT rate hike, and public expenditure reduc-tions, and were designed to allow the public sector to stay
19
The Episodes of Currency Crisis in Latin...
CASE Reports No. 39
in surplus in 1995. Also, a further reduction of developmentbanks was declared.
The Mexican Rescue Plan was supported with what wasthen the biggest ever financial support package. The initialamount of 18 billion USD announced by Fisher at the begin-ning of January after further intense discussions rose to therange of 25–40 billion USD in mid- January and finallyaround 52 billion USD of loan guarantees and credits at theend of February. This package included 20 billion USD ofloan guarantees from the U.S. government, 17.8 billion USDstand-by credit from the IMF (by-then the largest everfinancial package approved by the IMF for a member coun-try both in terms of the amount and the overall percentageof quota, 688.4%), 10 billion USD from central banks viathe BIS, and several billion dollars from other American gov-ernments [World Bank, 1995].
The unprecedented size of the support package broughtabout several controversies, especially in the U.S. The Clin-ton Administration was criticised heavily both for lack ofaction before the crisis, and for too much engagement inco-ordinating the support package. On 29 March 1995,Undersecretary of the Treasury, Lawrence Summersdefended in closed hearings in the Senate the Administra-tion's failure to publicise a warnings on the situation in Me-xico. He admitted that the U.S Treasury lost the confidencein the peso before the dramatic devaluation took place butdid not want to set off a market run on Mexico by making apublic statement about the situation [Burkart, 1995]. Themain arguments backing the support package pointed to thefact that Mexican economy was illiquid rather than funda-mentally insolvent [DeLong et al., 1996]. In retrospect itseems that this view was indeed right, even though the U.S.engagement in the package was to a large extent motivatedpolitically, i.e. by fears of possible political destabilisation inthe neighbouring country [Krugman, 1997].
1.6. Conclusions
The above presentation of several key factors and theirpossible role in explaining the crisis shows that there is stillno clear consensus on the issue. Several aspects did play arole and only their joint impact led to the abrupt events ofend of December 1994. Various models were used todescribe the crisis. These were both models of the secondgeneration type, pointing to the role of self fulfilling expec-tations and the political and economic constraints faced bythe authorities, as well as modified first generation modelsstressing the importance of economic fundamentals. Withrespect to the causes of the crisis following general pointscan be made:
– Private sector savings did not match the level of invest-ment. Mexico had easy access to credit as a result of the si-
tuation in the world financial markets, and liberalisation ofthe economy. Resulting credit expansion was not accompa-nied by proper credit screening.
– Mexico was relying too heavily on foreign borrowingin 1993 and early 1994, having no easy escape route in thecase this inflow would stop.
– The exchange rate rule was perhaps not quite consis-tent with the developments in other spheres (overindul-gence of credit, excess of funds in international financialmarkets, fast growth of short-term debt, financial liberalisa-tion). The real overvaluation of the peso might also haveplayed some role.
– Mexico experienced a series of unexpected negativeshocks during 1994 – the rise in U.S. interest rates coincid-ing with political tensions in the country.
– Mexican politics in 1994 did play an important role inthe crisis.
– Lack of availability of timely and accurate informationon the economic situation in the country might have playedsome role in the abrupt change of investors' attitudetowards Mexico.
– The policy response to the shocks of early 1994 wascertainly inappropriate (this is an ex post diagnosis).
– Neither fiscal nor monetary policy tools were used toadjust the economy to a worsening situation during 1994.
– Allowing for the erosion of foreign reserves of thatextent while building a large and rapidly growing stock ofdollar indexed short term debt in the period March-December 1994 was an extremely risky strategy that didnot work. This set the stage for the December crisis andthen led to very high interest rates and, consequently, harshconsequences for the real sector.
– Perceived risk of financial collapse played a role in bothcausing the collapse and making it very severe.
– Inappropriate management of the devaluation andimproper steps taken in the days following it led to a com-plete loss of confidence in Mexican policies and conse-quently to more severe consequences.
An interesting feature of the Mexican crisis is the seve-rity of the recession that was caused by it. On the otherhand, the crisis was relatively quickly overcome and theeconomy seems to have overcome its underlying causes.One of the possible explanations of such developmentsmight be that the private sector was indeed heavily depen-dent on external financing. Then again, a relatively quickrebound of the economy could suggest that it was funda-mentally sound, and the crisis exposed it to the liquiditytrap. In other words, given the abundance of credit, the pri-vate sector was using it heavily and possibly sometimesunwisely, but exposed to the dramatic change in the exter-nal environment was still able to become competitive again.
20
Marek D¹browski (ed.)
Appendix: Chronology of the MexicanCrisis
– January 1994 – peasant rebellion in the Chiapasprovince
– February 1994 – U.S. interest rates increase slightly– 23 March 1994 – assassination of the presidential can-
didate of the ruling party– end of March – April – severe financial turbulence in
Mexico: exchange rate depreciates by around 10% reachingthe ceiling of the band, Bank of Mexico reserves shrink by 9billion USD, interest rate rise significantly
– April – December 1994 – government continues theprocess of substituting its short term peso denominateddebt with dollar indexed debt
– 21 August 1994 – Ernesto Zedilo wins the presidentialelections; interest rates fall slightly
– 28 September 1994 – assassination of the ruling partyleader
– October – November – capital outflow continues,Bank of Mexico reserves decline by further 4.7 billion USD
– 1 December 1994 – president Zedilo takes office– 20 December 1994 – Finance Ministers announces the
widening of the exchange rate corridor by 15%– 22 December 1994 – under pressure from financial
markets the authorities announce free floating the peso– 29 December 1994 – appointment of the new Finance
Minister, a few days later announcement of the governmenteconomic program
– 3 January 1995 – IMF expresses its support for theprogram, announces the establishment of the Exchange Sta-bilisation Fund
– 1st quarter 1996 – economic growth (0,1%) resumesto average at close to 7% during the next three quarters
CASE Reports No. 39
21
The Episodes of Currency Crisis in Latin...
CASE Reports No. 39
References
Blejer M.I., G. del Castillo (1996). "Deja Vu All OverAgain?" The Mexican Crisis and the Stabilization of Uruguayin the 1970s. IMF Working Paper WP/96/80.
Burkart P. (1995). "Mexican Peso Devaluation: An Inves-tigative Report". web page: www.nafta.net/comuniq2.htm
Carstens A.G., A.M. Werner (1999). "Mexico's Mone-tary Policy Framework under a Floating Exchange RateRegime". Mimeo, Banco de Mexico.
Dabos M., V.H. Juan-Ramon (2000). "Real Exchange RateResponse to Capital Flows in Mexico: An Empirical Analy-sis". IMF Working Paper, WP/00/108.
DeLong B. et al. (1996). "The Mexican Peso Crisis. InDefense of U.S. Policy Toward Mexico". web page:http://econ161.berkley.edu (a shorter version of that paperappeared in May-June edition of Foreign Affairs).
Dornusch R., A. Werner (1994). "Mexico: Stabilization,Reform, and No Growth". Brookings Papers on EconomicActivity, 1:1994.
Edwards S. (1999). "On Crisis Prevention: Lessons formMexico and East Asia". NBER Working Paper WP 7233,Cambridge.
Gelos R.G., A.M. Werner (1999). "Financial Liberaliza-tion, Credit Constraints, and Collateral: Investment in theMexican Manufacturing Sector". IMF Working Paper,WP/99/25.
Gil-Diaz F. (1998). "The Origin of Mexico's 1994 Finan-cial Crisis". The Cato Journal Vol. 17 No. 3, Winter, CatoInstitute, Washington, D.C.
Gruben W.C. (1997). "The Mexican Economy SnapsBack". Southwest Economy, March/April, Federal ReserveBank of Dallas.
Gurrha J.A. (2000). "Mexico: Recent Development,Structural Reforms, and Future Challenges". Finance &Development, Vol. 37, No. 1, March, International Mone-tary Fund.
INEGI (2000). "Producto Interno Bruto Real1991–1999". web page: www.quicklink.com/mexico/
IMF (1995). "World Economic Outlook". May.Kalter E., A. Ribas (1999). "The 1994 Mexican Econom-
ic Crisis: The Role of Government Expenditure and RelativePrices". IMF Working paper, WP/99/160.
Kaminsky G.L., C.M. Reinhart (1996). "The Twin Crises:The Causes of Banking and Balance-of-Payment Problems".International Finance Discussion Papers No. 554, Board ofGovernors of the Federal Reserve System.
Krugman P. (1979). "A Model of Balance of PaymentsCrises". Journal of Money, Credit and Banking 11: 311–325.
Krugman P. (1997). "Currency crises". (Paper preparedfor NBER conference), web site: http://web.mit.edu/krug-man/www
La Porta R., F. Lopez-de-Silane (1999). "The Benefits ofPrivatization: Evidence from Mexico". Quarterly Journal ofEconomics, November, p. 1193–1242.
Lindgren C. J. et al. (1996). "Bank Soundness andMacroeconomic Policy". International Monetary Fund,Washington, D.C.
Lustig N. (1992). "Mexico: The remaking of an econo-my". The Brookings Institution, Washington, D.C.
Martinez G.O. (1998). "What lessons Does the MexicanCrisis Hold for Recovery in Asia?". Finance & Development,Vol. 35, No. 2, International Monetary Fund.
Masson P.R., P.-R. Agenor (1996). "The Mexican PesoCrisis: Overview and Analysis of Credibility Factors". IMFWorking Paper WP/96/6.
Otker I., C. Pazarbasioglu (1995). "Speculative Attacksand Currency Crises: The Mexican Experience". IMF Work-ing Paper WP/95/112.
Sachs J. et al. (1995). "The Collapse of the Mexican Peso:What Have we Learned?" NBER Working Paper WP 5142,Cambridge.
Sachs J. et al. (1996). "The Mexican Peso Crisis: SuddenDeath or Death Foretold?". NBER Working Paper WP 5563,Cambridge.
SHCP (Secretariat of Finance and Public Credit) (1996)."Mexico: Quarterly Report; Second Quarter 1996". webpage: http://www.shcp.gob.mx/english/docs/index.html
SHCP (Secretariat of Finance and Public Credit) (1995)."Mexico: Quarterly Report; Fourth Quarter 1995". webpage: http://www.shcp.gob.mx/english/docs/index.html
Werner A.M. (1996). "Mexico's Currency Risk Premia in1992–94: A closer Look at the Interest Rate Differentials".IMF Working Paper, WP/96/41.
World Bank (1995). "Mexican Economic Crisis". WorldBank Institute Policy Forum, web page: http://www.world-bank.org/wbi/edimp/mex/mex.html
World Bank (2000). "Global Development Finance2000".
WTO (1997). "Trade Policy Review Mexico". web site:www.wto.org
23
The Episodes of Currency Crisis in Latin...
CASE Reports No. 39
2.1. Introduction
This paper presents the economic developments thattook place in Argentina at the time of the 1995 currency cri-sis. This financial turbulence resulted from the contagion ofthe Tequila crisis of the late 1994. And although the countrymaintained its commitment to a peg under the currencyboard arrangement, the reserves of the central bank wereseverely depleted and the consequences for the economymanifest.
The study starts from a description of the economicreforms of the early 1990s that set the framework for themonetary and fiscal policies in place when the crisis hit.There is then a discussion on the macro- and microeconom-ic climate, followed by the description of policy responses tothe crisis. The paper concludes with the assessment ofwhether the core factors that drove the crisis have beenproperly addressed by looking at the post-crisis situation.
2.2. Overview of Economic SituationBefore and During the Crisis
2.2.1. Reforms of the Early 1990s and CrisisDevelopments
The 1980s were marked by a series of economic andfinancial problems. One of them was chronic inflation andperiodic hyperinflation which led to widespread dollariza-tion of the economy. Moreover, prevailing public sectordeficits were crowding out private sector credit (Garcia-Herrero, 1997). A banking crisis erupted in 1980, and thendeveloped into a severe currency crisis a year later. Thenext crisis started in 1985 and ended in 1987. The subse-quent economic plan aimed at lowering inflation resulted inits outburst in 1989 and the complete dollarization of theeconomy as investors' confidence weakened. Two hugedevaluations took place in the late 1989 and in 1990. Afteranother bout of financial turbulence, one more stabilization
plan failed. The exchange rate, which under earlier planshad been pegged, was allowed to fluctuate, and all pricecontrols were removed (Choueiri and Kaminsky, 1999).The difficulties of the period 1989–1990 – mainly as a resultof hyperinflation – allowed for the general recognition ofthe need for reforms.
The changes, that put the country on a sustained growthpath began with the Convertibility Plan of 1991. The Convert-ibility Law, which is still in operation, established the curren-cy board arrangement. Financial sector reforms followed.Argentina also eliminated, by 1993, restrictions on capitalflows, relaxed or abolished barriers on imports and exportsand deregulated trade and some professional services. Until1994, roughly 90% of all state-owned enterprises was pri-vatized, bringing considerable gains to economic efficiency[IMF, 1998]. In 1994 Argentina recorded economic growthof 8%, managed to lower inflation to 4.2% (from over 10%in 1993 and 25% in 1992), and kept the budget deficit of thefederal government at the level of 0.5% of GDP. The ban-king sector recorded growth in credits and deposits. Fromthe early 1990s, capital started to flow in, as a result ofinvestors' more favourable perception of the region and rel-atively high interest rates.
At the time, interest rates in the United States were low,and net flows of portfolio capital to Argentina amounted to33.7 billion dollars in 1993 and to 8.4 billion in 1994. Thesehuge capital inflows led to an explosion of domestic credit,consumption, real estate and stock market booms, and lackof diversification of bank portfolios [Choueiri and Kaminsky,1999]. The current account deficit deteriorated as a resultof real exchange rate appreciation. As the U.S. and worldinterest rates soared in 1994, the Mexican peso was deva-lued in December 1994 and the capital outflows broughtabout balance of payment pressures, the rumors aboutabandoning the currency board spread out. The Argentinebanking system suffered from a run on deposits, and thecredit crunch followed. Between December 1994 andMarch 1995, the central bank (BCRA) lost 41 percent of itsinternational reserves, defending the peso-dollar peg. Thebanking system lost 18% of its deposits in five monthswhich generated liquidity problems. A number of prudentialregulations were introduced in early 1995 in order to
Part II.The 1995 Currency Crisis in Argentinaby Ma³gorzata Jakubiak
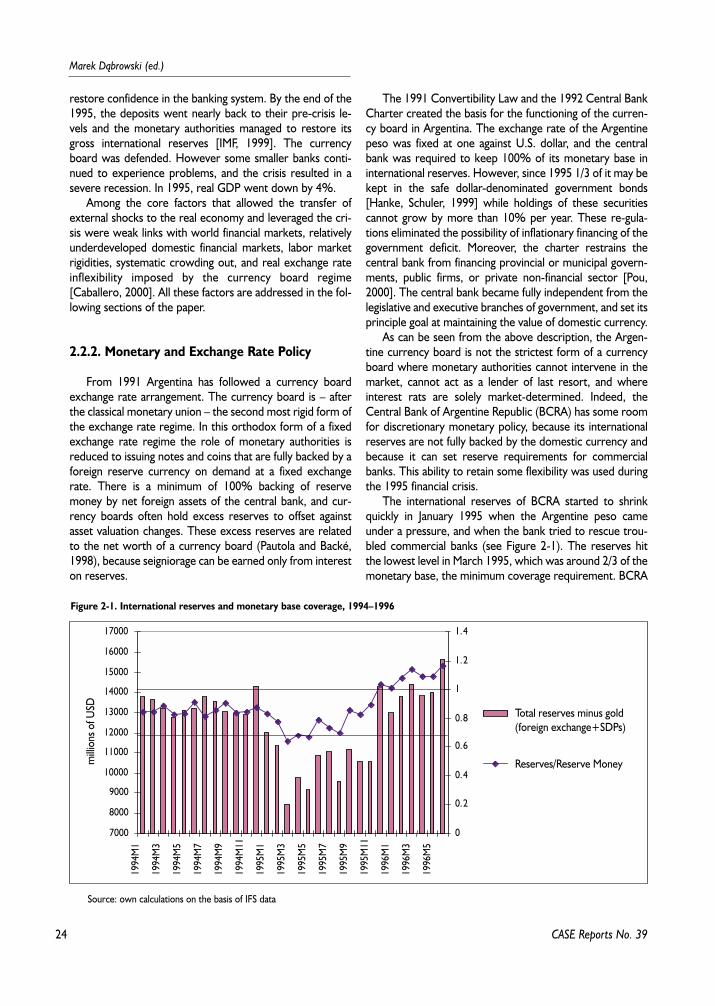
24
Marek D¹browski (ed.)
CASE Reports No. 39
restore confidence in the banking system. By the end of the1995, the deposits went nearly back to their pre-crisis le-vels and the monetary authorities managed to restore itsgross international reserves [IMF, 1999]. The currencyboard was defended. However some smaller banks conti-nued to experience problems, and the crisis resulted in asevere recession. In 1995, real GDP went down by 4%.
Among the core factors that allowed the transfer ofexternal shocks to the real economy and leveraged the cri-sis were weak links with world financial markets, relativelyunderdeveloped domestic financial markets, labor marketrigidities, systematic crowding out, and real exchange rateinflexibility imposed by the currency board regime[Caballero, 2000]. All these factors are addressed in the fol-lowing sections of the paper.
2.2.2. Monetary and Exchange Rate Policy
From 1991 Argentina has followed a currency boardexchange rate arrangement. The currency board is – afterthe classical monetary union – the second most rigid form ofthe exchange rate regime. In this orthodox form of a fixedexchange rate regime the role of monetary authorities isreduced to issuing notes and coins that are fully backed by aforeign reserve currency on demand at a fixed exchangerate. There is a minimum of 100% backing of reservemoney by net foreign assets of the central bank, and cur-rency boards often hold excess reserves to offset againstasset valuation changes. These excess reserves are relatedto the net worth of a currency board (Pautola and Backé,1998), because seigniorage can be earned only from intereston reserves.
The 1991 Convertibility Law and the 1992 Central BankCharter created the basis for the functioning of the curren-cy board in Argentina. The exchange rate of the Argentinepeso was fixed at one against U.S. dollar, and the centralbank was required to keep 100% of its monetary base ininternational reserves. However, since 1995 1/3 of it may bekept in the safe dollar-denominated government bonds[Hanke, Schuler, 1999] while holdings of these securitiescannot grow by more than 10% per year. These re-gula-tions eliminated the possibility of inflationary financing of thegovernment deficit. Moreover, the charter restrains thecentral bank from financing provincial or municipal govern-ments, public firms, or private non-financial sector [Pou,2000]. The central bank became fully independent from thelegislative and executive branches of government, and set itsprinciple goal at maintaining the value of domestic currency.
As can be seen from the above description, the Argen-tine currency board is not the strictest form of a currencyboard where monetary authorities cannot intervene in themarket, cannot act as a lender of last resort, and whereinterest rats are solely market-determined. Indeed, theCentral Bank of Argentine Republic (BCRA) has some roomfor discretionary monetary policy, because its internationalreserves are not fully backed by the domestic currency andbecause it can set reserve requirements for commercialbanks. This ability to retain some flexibility was used duringthe 1995 financial crisis.
The international reserves of BCRA started to shrinkquickly in January 1995 when the Argentine peso cameunder a pressure, and when the bank tried to rescue trou-bled commercial banks (see Figure 2-1). The reserves hitthe lowest level in March 1995, which was around 2/3 of themonetary base, the minimum coverage requirement. BCRA
Figure 2-1. International reserves and monetary base coverage, 1994–1996
7000
8000
9000
10000
11000
12000
13000
14000
15000
16000
17000
0
0.2
0.4
0.6
0.8
1
1.2
1.4
milli
ons o
f USD Total reserves minus gold
(foreign exchange+SDPs)
Reserves/Reserve Money
1994
M1
1994
M3
1994
M5
1994
M7
1994
M9
1994
M11
1995
M1
1995
M3
1995
M5
1995
M7
1995
M9
1995
M11
1996
M1
1996
M3
1996
M5
Source: own calculations on the basis of IFS data
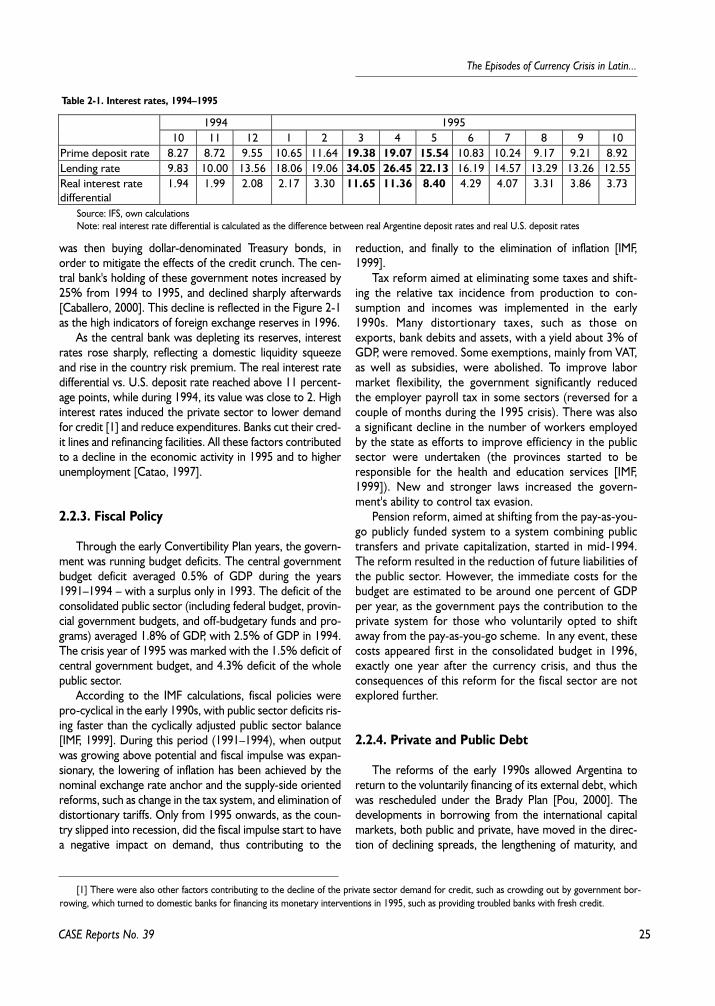
25
The Episodes of Currency Crisis in Latin...
CASE Reports No. 39
was then buying dollar-denominated Treasury bonds, inorder to mitigate the effects of the credit crunch. The cen-tral bank's holding of these government notes increased by25% from 1994 to 1995, and declined sharply afterwards[Caballero, 2000]. This decline is reflected in the Figure 2-1as the high indicators of foreign exchange reserves in 1996.
As the central bank was depleting its reserves, interestrates rose sharply, reflecting a domestic liquidity squeezeand rise in the country risk premium. The real interest ratedifferential vs. U.S. deposit rate reached above 11 percent-age points, while during 1994, its value was close to 2. Highinterest rates induced the private sector to lower demandfor credit [1] and reduce expenditures. Banks cut their cred-it lines and refinancing facilities. All these factors contributedto a decline in the economic activity in 1995 and to higherunemployment [Catao, 1997].
2.2.3. Fiscal Policy
Through the early Convertibility Plan years, the govern-ment was running budget deficits. The central governmentbudget deficit averaged 0.5% of GDP during the years1991–1994 – with a surplus only in 1993. The deficit of theconsolidated public sector (including federal budget, provin-cial government budgets, and off-budgetary funds and pro-grams) averaged 1.8% of GDP, with 2.5% of GDP in 1994.The crisis year of 1995 was marked with the 1.5% deficit ofcentral government budget, and 4.3% deficit of the wholepublic sector.
According to the IMF calculations, fiscal policies werepro-cyclical in the early 1990s, with public sector deficits ris-ing faster than the cyclically adjusted public sector balance[IMF, 1999]. During this period (1991–1994), when outputwas growing above potential and fiscal impulse was expan-sionary, the lowering of inflation has been achieved by thenominal exchange rate anchor and the supply-side orientedreforms, such as change in the tax system, and elimination ofdistortionary tariffs. Only from 1995 onwards, as the coun-try slipped into recession, did the fiscal impulse start to havea negative impact on demand, thus contributing to the
reduction, and finally to the elimination of inflation [IMF,1999].
Tax reform aimed at eliminating some taxes and shift-ing the relative tax incidence from production to con-sumption and incomes was implemented in the early1990s. Many distortionary taxes, such as those onexports, bank debits and assets, with a yield about 3% ofGDP, were removed. Some exemptions, mainly from VAT,as well as subsidies, were abolished. To improve labormarket flexibility, the government significantly reducedthe employer payroll tax in some sectors (reversed for acouple of months during the 1995 crisis). There was alsoa significant decline in the number of workers employedby the state as efforts to improve efficiency in the publicsector were undertaken (the provinces started to beresponsible for the health and education services [IMF,1999]). New and stronger laws increased the govern-ment's ability to control tax evasion.
Pension reform, aimed at shifting from the pay-as-you-go publicly funded system to a system combining publictransfers and private capitalization, started in mid-1994.The reform resulted in the reduction of future liabilities ofthe public sector. However, the immediate costs for thebudget are estimated to be around one percent of GDPper year, as the government pays the contribution to theprivate system for those who voluntarily opted to shiftaway from the pay-as-you-go scheme. In any event, thesecosts appeared first in the consolidated budget in 1996,exactly one year after the currency crisis, and thus theconsequences of this reform for the fiscal sector are notexplored further.
2.2.4. Private and Public Debt
The reforms of the early 1990s allowed Argentina toreturn to the voluntarily financing of its external debt, whichwas rescheduled under the Brady Plan [Pou, 2000]. Thedevelopments in borrowing from the international capitalmarkets, both public and private, have moved in the direc-tion of declining spreads, the lengthening of maturity, and
[1] There were also other factors contributing to the decline of the private sector demand for credit, such as crowding out by government bor-rowing, which turned to domestic banks for financing its monetary interventions in 1995, such as providing troubled banks with fresh credit.
Table 2-1. Interest rates, 1994–1995
1994 199510 11 12 1 2 3 4 5 6 7 8 9 10
Prime deposit rate 8.27 8.72 9.55 10.65 11.64 19.38 19.07 15.54 10.83 10.24 9.17 9.21 8.92Lending rate 9.83 10.00 13.56 18.06 19.06 34.05 26.45 22.13 16.19 14.57 13.29 13.26 12.55Real interest ratedifferential
1.94 1.99 2.08 2.17 3.30 11.65 11.36 8.40 4.29 4.07 3.31 3.86 3.73
Source: IFS, own calculationsNote: real interest rate differential is calculated as the difference between real Argentine deposit rates and real U.S. deposit rates
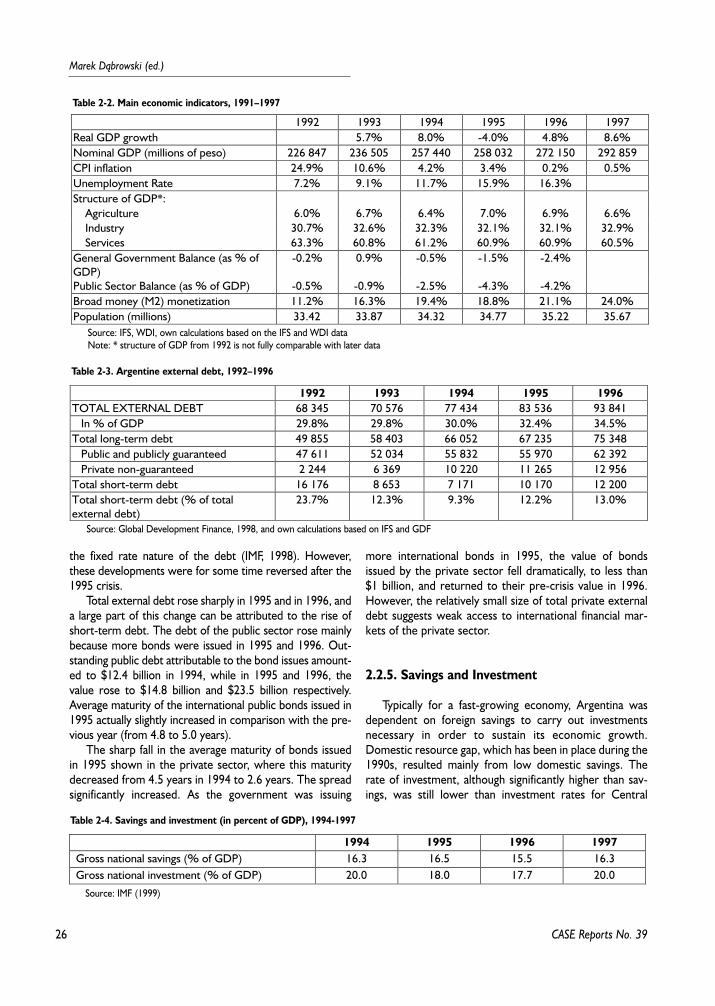
26
Marek D¹browski (ed.)
CASE Reports No. 39
the fixed rate nature of the debt (IMF, 1998). However,these developments were for some time reversed after the1995 crisis.
Total external debt rose sharply in 1995 and in 1996, anda large part of this change can be attributed to the rise ofshort-term debt. The debt of the public sector rose mainlybecause more bonds were issued in 1995 and 1996. Out-standing public debt attributable to the bond issues amount-ed to $12.4 billion in 1994, while in 1995 and 1996, thevalue rose to $14.8 billion and $23.5 billion respectively.Average maturity of the international public bonds issued in1995 actually slightly increased in comparison with the pre-vious year (from 4.8 to 5.0 years).
The sharp fall in the average maturity of bonds issuedin 1995 shown in the private sector, where this maturitydecreased from 4.5 years in 1994 to 2.6 years. The spreadsignificantly increased. As the government was issuing
more international bonds in 1995, the value of bondsissued by the private sector fell dramatically, to less than$1 billion, and returned to their pre-crisis value in 1996.However, the relatively small size of total private externaldebt suggests weak access to international financial mar-kets of the private sector.
2.2.5. Savings and Investment
Typically for a fast-growing economy, Argentina wasdependent on foreign savings to carry out investmentsnecessary in order to sustain its economic growth.Domestic resource gap, which has been in place during the1990s, resulted mainly from low domestic savings. Therate of investment, although significantly higher than sav-ings, was still lower than investment rates for Central
Table 2-2. Main economic indicators, 1991–1997
1992 1993 1994 1995 1996 1997Real GDP growth 5.7% 8.0% -4.0% 4.8% 8.6%Nominal GDP (millions of peso) 226 847 236 505 257 440 258 032 272 150 292 859CPI inflation 24.9% 10.6% 4.2% 3.4% 0.2% 0.5%Unemployment Rate 7.2% 9.1% 11.7% 15.9% 16.3%Structure of GDP*: Agriculture 6.0% 6.7% 6.4% 7.0% 6.9% 6.6% Industry 30.7% 32.6% 32.3% 32.1% 32.1% 32.9% Services 63.3% 60.8% 61.2% 60.9% 60.9% 60.5%General Government Balance (as % ofGDP)
-0.2% 0.9% -0.5% -1.5% -2.4%
Public Sector Balance (as % of GDP) -0.5% -0.9% -2.5% -4.3% -4.2%Broad money (M2) monetization 11.2% 16.3% 19.4% 18.8% 21.1% 24.0%Population (millions) 33.42 33.87 34.32 34.77 35.22 35.67
Source: IFS, WDI, own calculations based on the IFS and WDI dataNote: * structure of GDP from 1992 is not fully comparable with later data
Table 2-3. Argentine external debt, 1992–1996
1992 1993 1994 1995 1996TOTAL EXTERNAL DEBT 68 345 70 576 77 434 83 536 93 841 In % of GDP 29.8% 29.8% 30.0% 32.4% 34.5%Total long-term debt 49 855 58 403 66 052 67 235 75 348 Public and publicly guaranteed 47 611 52 034 55 832 55 970 62 392 Private non-guaranteed 2 244 6 369 10 220 11 265 12 956Total short-term debt 16 176 8 653 7 171 10 170 12 200Total short-term debt (% of totalexternal debt)
23.7% 12.3% 9.3% 12.2% 13.0%
Source: Global Development Finance, 1998, and own calculations based on IFS and GDF
Table 2-4. Savings and investment (in percent of GDP), 1994-1997
1994 1995 1996 1997Gross national savings (% of GDP) 16.3 16.5 15.5 16.3Gross national investment (% of GDP) 20.0 18.0 17.7 20.0
Source: IMF (1999)
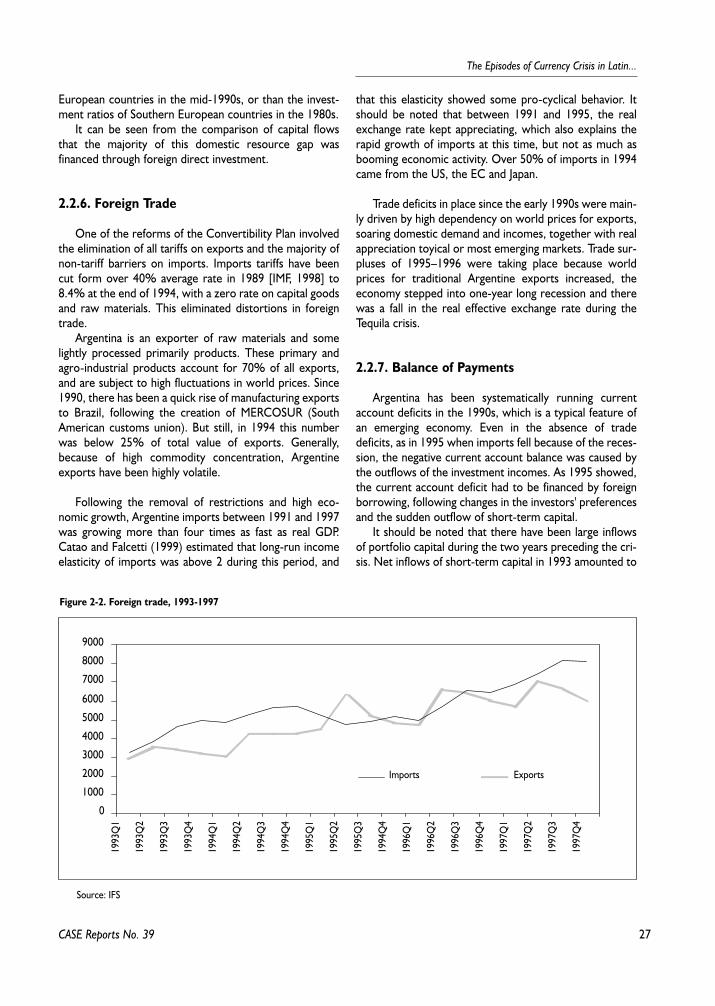
27
The Episodes of Currency Crisis in Latin...
European countries in the mid-1990s, or than the invest-ment ratios of Southern European countries in the 1980s.
It can be seen from the comparison of capital flowsthat the majority of this domestic resource gap wasfinanced through foreign direct investment.
2.2.6. Foreign Trade
One of the reforms of the Convertibility Plan involvedthe elimination of all tariffs on exports and the majority ofnon-tariff barriers on imports. Imports tariffs have beencut form over 40% average rate in 1989 [IMF, 1998] to8.4% at the end of 1994, with a zero rate on capital goodsand raw materials. This eliminated distortions in foreigntrade.
Argentina is an exporter of raw materials and somelightly processed primarily products. These primary andagro-industrial products account for 70% of all exports,and are subject to high fluctuations in world prices. Since1990, there has been a quick rise of manufacturing exportsto Brazil, following the creation of MERCOSUR (SouthAmerican customs union). But still, in 1994 this numberwas below 25% of total value of exports. Generally,because of high commodity concentration, Argentineexports have been highly volatile.
Following the removal of restrictions and high eco-nomic growth, Argentine imports between 1991 and 1997was growing more than four times as fast as real GDP.Catao and Falcetti (1999) estimated that long-run incomeelasticity of imports was above 2 during this period, and
that this elasticity showed some pro-cyclical behavior. Itshould be noted that between 1991 and 1995, the realexchange rate kept appreciating, which also explains therapid growth of imports at this time, but not as much asbooming economic activity. Over 50% of imports in 1994came from the US, the EC and Japan.
Trade deficits in place since the early 1990s were main-ly driven by high dependency on world prices for exports,soaring domestic demand and incomes, together with realappreciation toyical or most emerging markets. Trade sur-pluses of 1995–1996 were taking place because worldprices for traditional Argentine exports increased, theeconomy stepped into one-year long recession and therewas a fall in the real effective exchange rate during theTequila crisis.
2.2.7. Balance of Payments
Argentina has been systematically running currentaccount deficits in the 1990s, which is a typical feature ofan emerging economy. Even in the absence of tradedeficits, as in 1995 when imports fell because of the reces-sion, the negative current account balance was caused bythe outflows of the investment incomes. As 1995 showed,the current account deficit had to be financed by foreignborrowing, following changes in the investors' preferencesand the sudden outflow of short-term capital.
It should be noted that there have been large inflowsof portfolio capital during the two years preceding the cri-sis. Net inflows of short-term capital in 1993 amounted to
CASE Reports No. 39
Figure 2-2. Foreign trade, 1993-1997
0
1000
2000
3000
4000
5000
6000
7000
8000
9000
ExportsImports
1993
Q1
1993
Q2
1993
Q3
1993
Q4
1994
Q1
1994
Q2
1994
Q3
1994
Q4
1995
Q1
1995
Q2
1995
Q3
1994
Q4
1996
Q1
1996
Q2
1996
Q3
1996
Q4
1997
Q1
1997
Q2
1997
Q3
1997
Q4
Source: IFS
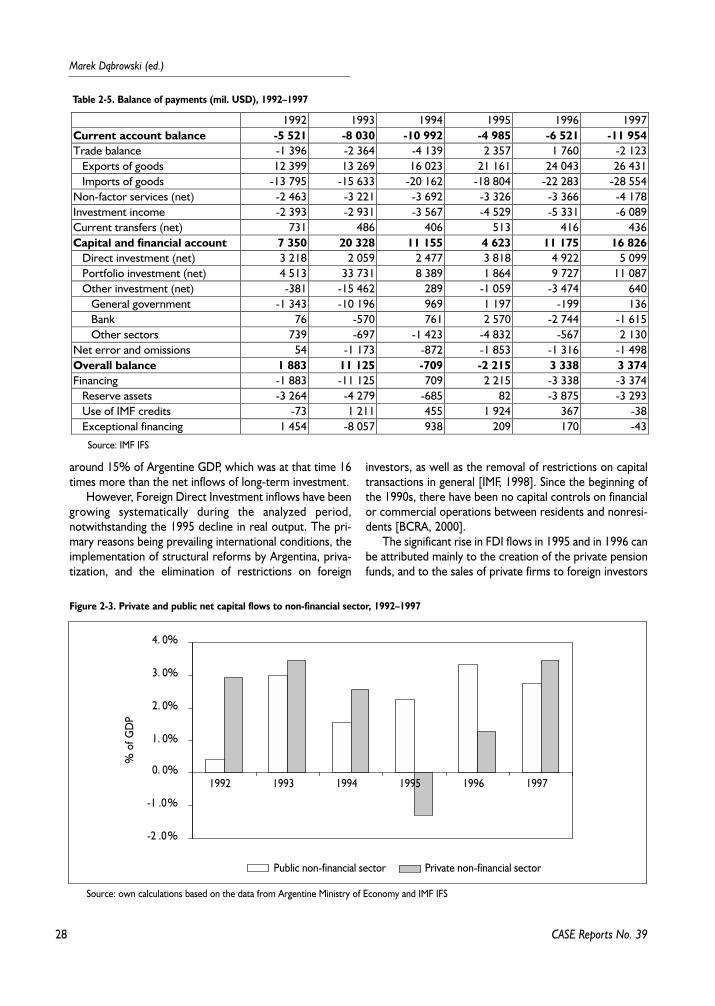
28
Marek D¹browski (ed.)
around 15% of Argentine GDP, which was at that time 16times more than the net inflows of long-term investment.
However, Foreign Direct Investment inflows have beengrowing systematically during the analyzed period,notwithstanding the 1995 decline in real output. The pri-mary reasons being prevailing international conditions, theimplementation of structural reforms by Argentina, priva-tization, and the elimination of restrictions on foreign
investors, as well as the removal of restrictions on capitaltransactions in general [IMF, 1998]. Since the beginning ofthe 1990s, there have been no capital controls on financialor commercial operations between residents and nonresi-dents [BCRA, 2000].
The significant rise in FDI flows in 1995 and in 1996 canbe attributed mainly to the creation of the private pensionfunds, and to the sales of private firms to foreign investors
CASE Reports No. 39
Table 2-5. Balance of payments (mil. USD), 1992–1997
1992 1993 1994 1995 1996 1997Current account balance -5 521 -8 030 -10 992 -4 985 -6 521 -11 954Trade balance -1 396 -2 364 -4 139 2 357 1 760 -2 123 Exports of goods 12 399 13 269 16 023 21 161 24 043 26 431 Imports of goods -13 795 -15 633 -20 162 -18 804 -22 283 -28 554Non-factor services (net) -2 463 -3 221 -3 692 -3 326 -3 366 -4 178Investment income -2 393 -2 931 -3 567 -4 529 -5 331 -6 089Current transfers (net) 731 486 406 513 416 436Capital and financial account 7 350 20 328 11 155 4 623 11 175 16 826 Direct investment (net) 3 218 2 059 2 477 3 818 4 922 5 099 Portfolio investment (net) 4 513 33 731 8 389 1 864 9 727 11 087 Other investment (net) -381 -15 462 289 -1 059 -3 474 640 General government -1 343 -10 196 969 1 197 -199 136 Bank 76 -570 761 2 570 -2 744 -1 615 Other sectors 739 -697 -1 423 -4 832 -567 2 130Net error and omissions 54 -1 173 -872 -1 853 -1 316 -1 498Overall balance 1 883 11 125 -709 -2 215 3 338 3 374Financing -1 883 -11 125 709 2 215 -3 338 -3 374 Reserve assets -3 264 -4 279 -685 82 -3 875 -3 293 Use of IMF credits -73 1 211 455 1 924 367 -38 Exceptional financing 1 454 -8 057 938 209 170 -43
Source: IMF IFS
Figure 2-3. Private and public net capital flows to non-financial sector, 1992–1997
-2 .0%
-1 .0%
0. 0%
1. 0%
2. 0%
3. 0%
4. 0%
1992 1993 1994 1995 1996 1997
% o
f GD
P
Public non-financial sector Private non-financial sector
Source: own calculations based on the data from Argentine Ministry of Economy and IMF IFS
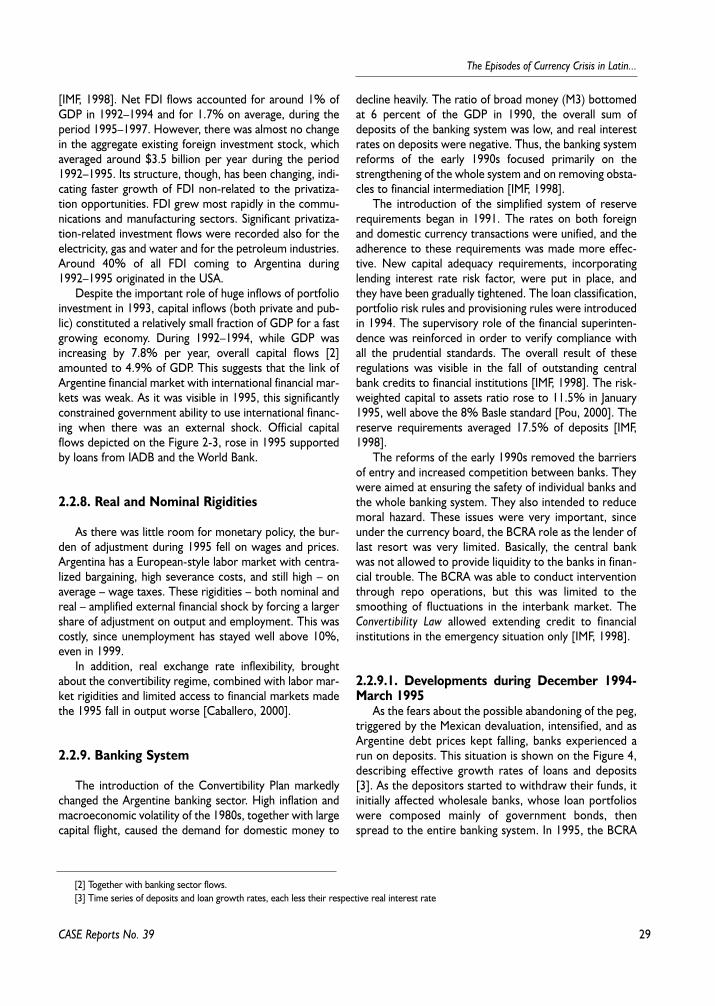
29
The Episodes of Currency Crisis in Latin...
[IMF, 1998]. Net FDI flows accounted for around 1% ofGDP in 1992–1994 and for 1.7% on average, during theperiod 1995–1997. However, there was almost no changein the aggregate existing foreign investment stock, whichaveraged around $3.5 billion per year during the period1992–1995. Its structure, though, has been changing, indi-cating faster growth of FDI non-related to the privatiza-tion opportunities. FDI grew most rapidly in the commu-nications and manufacturing sectors. Significant privatiza-tion-related investment flows were recorded also for theelectricity, gas and water and for the petroleum industries.Around 40% of all FDI coming to Argentina during1992–1995 originated in the USA.
Despite the important role of huge inflows of portfolioinvestment in 1993, capital inflows (both private and pub-lic) constituted a relatively small fraction of GDP for a fastgrowing economy. During 1992–1994, while GDP wasincreasing by 7.8% per year, overall capital flows [2]amounted to 4.9% of GDP. This suggests that the link ofArgentine financial market with international financial mar-kets was weak. As it was visible in 1995, this significantlyconstrained government ability to use international financ-ing when there was an external shock. Official capitalflows depicted on the Figure 2-3, rose in 1995 supportedby loans from IADB and the World Bank.
2.2.8. Real and Nominal Rigidities
As there was little room for monetary policy, the bur-den of adjustment during 1995 fell on wages and prices.Argentina has a European-style labor market with centra-lized bargaining, high severance costs, and still high – onaverage – wage taxes. These rigidities – both nominal andreal – amplified external financial shock by forcing a largershare of adjustment on output and employment. This wascostly, since unemployment has stayed well above 10%,even in 1999.
In addition, real exchange rate inflexibility, broughtabout the convertibility regime, combined with labor mar-ket rigidities and limited access to financial markets madethe 1995 fall in output worse [Caballero, 2000].
2.2.9. Banking System
The introduction of the Convertibility Plan markedlychanged the Argentine banking sector. High inflation andmacroeconomic volatility of the 1980s, together with largecapital flight, caused the demand for domestic money to
decline heavily. The ratio of broad money (M3) bottomedat 6 percent of the GDP in 1990, the overall sum ofdeposits of the banking system was low, and real interestrates on deposits were negative. Thus, the banking systemreforms of the early 1990s focused primarily on thestrengthening of the whole system and on removing obsta-cles to financial intermediation [IMF, 1998].
The introduction of the simplified system of reserverequirements began in 1991. The rates on both foreignand domestic currency transactions were unified, and theadherence to these requirements was made more effec-tive. New capital adequacy requirements, incorporatinglending interest rate risk factor, were put in place, andthey have been gradually tightened. The loan classification,portfolio risk rules and provisioning rules were introducedin 1994. The supervisory role of the financial superinten-dence was reinforced in order to verify compliance withall the prudential standards. The overall result of theseregulations was visible in the fall of outstanding centralbank credits to financial institutions [IMF, 1998]. The risk-weighted capital to assets ratio rose to 11.5% in January1995, well above the 8% Basle standard [Pou, 2000]. Thereserve requirements averaged 17.5% of deposits [IMF,1998].
The reforms of the early 1990s removed the barriersof entry and increased competition between banks. Theywere aimed at ensuring the safety of individual banks andthe whole banking system. They also intended to reducemoral hazard. These issues were very important, sinceunder the currency board, the BCRA role as the lender oflast resort was very limited. Basically, the central bankwas not allowed to provide liquidity to the banks in finan-cial trouble. The BCRA was able to conduct interventionthrough repo operations, but this was limited to thesmoothing of fluctuations in the interbank market. TheConvertibility Law allowed extending credit to financialinstitutions in the emergency situation only [IMF, 1998].
2.2.9.1. Developments during December 1994-March 1995
As the fears about the possible abandoning of the peg,triggered by the Mexican devaluation, intensified, and asArgentine debt prices kept falling, banks experienced arun on deposits. This situation is shown on the Figure 4,describing effective growth rates of loans and deposits[3]. As the depositors started to withdraw their funds, itinitially affected wholesale banks, whose loan portfolioswere composed mainly of government bonds, thenspread to the entire banking system. In 1995, the BCRA
CASE Reports No. 39
[2] Together with banking sector flows.[3] Time series of deposits and loan growth rates, each less their respective real interest rate
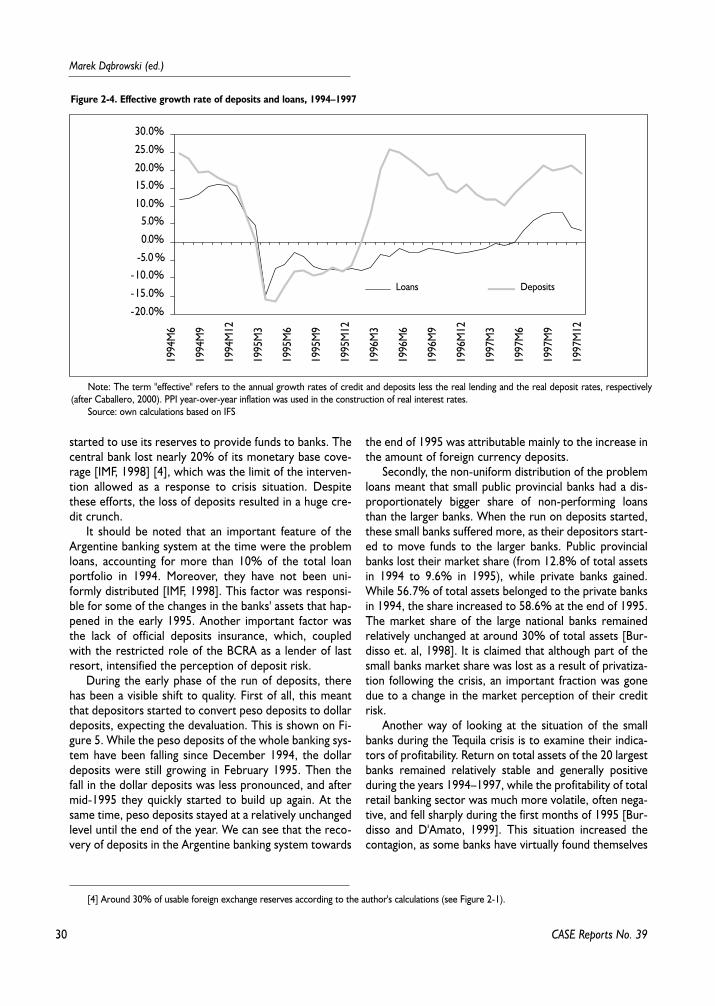
30
Marek D¹browski (ed.)
started to use its reserves to provide funds to banks. Thecentral bank lost nearly 20% of its monetary base cove-rage [IMF, 1998] [4], which was the limit of the interven-tion allowed as a response to crisis situation. Despitethese efforts, the loss of deposits resulted in a huge cre-dit crunch.
It should be noted that an important feature of theArgentine banking system at the time were the problemloans, accounting for more than 10% of the total loanportfolio in 1994. Moreover, they have not been uni-formly distributed [IMF, 1998]. This factor was responsi-ble for some of the changes in the banks' assets that hap-pened in the early 1995. Another important factor wasthe lack of official deposits insurance, which, coupledwith the restricted role of the BCRA as a lender of lastresort, intensified the perception of deposit risk.
During the early phase of the run of deposits, therehas been a visible shift to quality. First of all, this meantthat depositors started to convert peso deposits to dollardeposits, expecting the devaluation. This is shown on Fi-gure 5. While the peso deposits of the whole banking sys-tem have been falling since December 1994, the dollardeposits were still growing in February 1995. Then thefall in the dollar deposits was less pronounced, and aftermid-1995 they quickly started to build up again. At thesame time, peso deposits stayed at a relatively unchangedlevel until the end of the year. We can see that the reco-very of deposits in the Argentine banking system towards
the end of 1995 was attributable mainly to the increase inthe amount of foreign currency deposits.
Secondly, the non-uniform distribution of the problemloans meant that small public provincial banks had a dis-proportionately bigger share of non-performing loansthan the larger banks. When the run on deposits started,these small banks suffered more, as their depositors start-ed to move funds to the larger banks. Public provincialbanks lost their market share (from 12.8% of total assetsin 1994 to 9.6% in 1995), while private banks gained.While 56.7% of total assets belonged to the private banksin 1994, the share increased to 58.6% at the end of 1995.The market share of the large national banks remainedrelatively unchanged at around 30% of total assets [Bur-disso et. al, 1998]. It is claimed that although part of thesmall banks market share was lost as a result of privatiza-tion following the crisis, an important fraction was gonedue to a change in the market perception of their creditrisk.
Another way of looking at the situation of the smallbanks during the Tequila crisis is to examine their indica-tors of profitability. Return on total assets of the 20 largestbanks remained relatively stable and generally positiveduring the years 1994–1997, while the profitability of totalretail banking sector was much more volatile, often nega-tive, and fell sharply during the first months of 1995 [Bur-disso and D'Amato, 1999]. This situation increased thecontagion, as some banks have virtually found themselves
CASE Reports No. 39
[4] Around 30% of usable foreign exchange reserves according to the author's calculations (see Figure 2-1).
Figure 2-4. Effective growth rate of deposits and loans, 1994–1997
-20.0%
-15.0%
-10.0%-5.0 %
0.0%
5.0%10.0%
15.0%20.0%
25.0%
30.0%
1994
M6
1994
M9
1994
M12
1995
M3
1995
M6
1995
M9
1995
M12
1996
M3
1996
M6
1996
M9
1996
M12
1997
M3
1997
M6
1997
M9
1997
M12
DepositsLoans
Note: The term "effective" refers to the annual growth rates of credit and deposits less the real lending and the real deposit rates, respectively(after Caballero, 2000). PPI year-over-year inflation was used in the construction of real interest rates.
Source: own calculations based on IFS
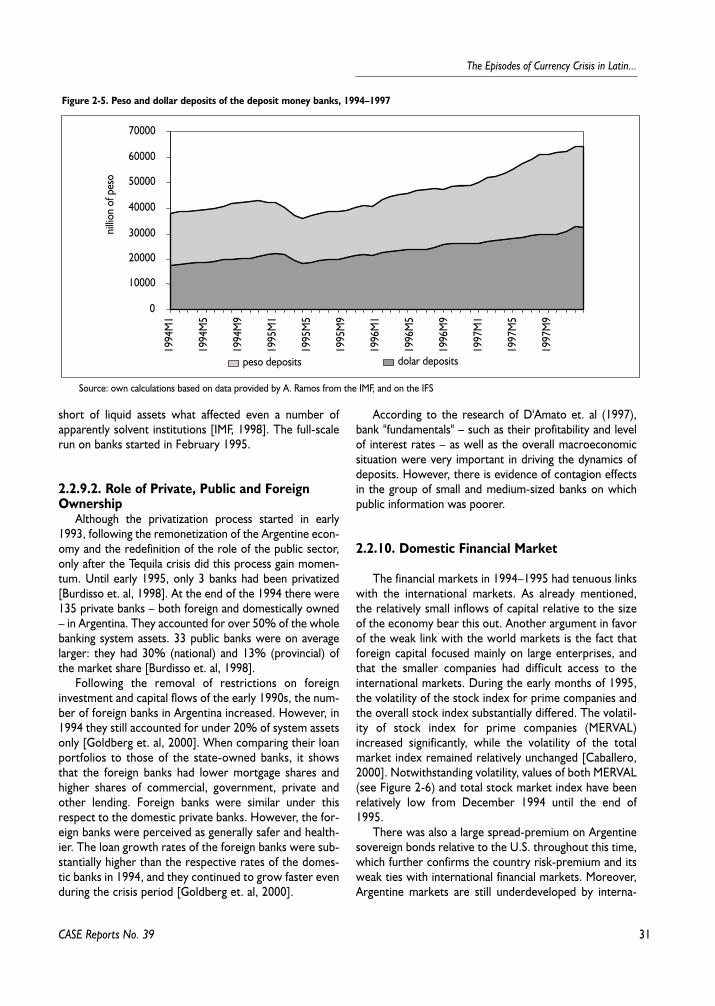
31
The Episodes of Currency Crisis in Latin...
short of liquid assets what affected even a number ofapparently solvent institutions [IMF, 1998]. The full-scalerun on banks started in February 1995.
2.2.9.2. Role of Private, Public and ForeignOwnership
Although the privatization process started in early1993, following the remonetization of the Argentine econ-omy and the redefinition of the role of the public sector,only after the Tequila crisis did this process gain momen-tum. Until early 1995, only 3 banks had been privatized[Burdisso et. al, 1998]. At the end of the 1994 there were135 private banks – both foreign and domestically owned– in Argentina. They accounted for over 50% of the wholebanking system assets. 33 public banks were on averagelarger: they had 30% (national) and 13% (provincial) ofthe market share [Burdisso et. al, 1998].
Following the removal of restrictions on foreigninvestment and capital flows of the early 1990s, the num-ber of foreign banks in Argentina increased. However, in1994 they still accounted for under 20% of system assetsonly [Goldberg et. al, 2000]. When comparing their loanportfolios to those of the state-owned banks, it showsthat the foreign banks had lower mortgage shares andhigher shares of commercial, government, private andother lending. Foreign banks were similar under thisrespect to the domestic private banks. However, the for-eign banks were perceived as generally safer and health-ier. The loan growth rates of the foreign banks were sub-stantially higher than the respective rates of the domes-tic banks in 1994, and they continued to grow faster evenduring the crisis period [Goldberg et. al, 2000].
According to the research of D'Amato et. al (1997),bank "fundamentals" – such as their profitability and levelof interest rates – as well as the overall macroeconomicsituation were very important in driving the dynamics ofdeposits. However, there is evidence of contagion effectsin the group of small and medium-sized banks on whichpublic information was poorer.
2.2.10. Domestic Financial Market
The financial markets in 1994–1995 had tenuous linkswith the international markets. As already mentioned,the relatively small inflows of capital relative to the sizeof the economy bear this out. Another argument in favorof the weak link with the world markets is the fact thatforeign capital focused mainly on large enterprises, andthat the smaller companies had difficult access to theinternational markets. During the early months of 1995,the volatility of the stock index for prime companies andthe overall stock index substantially differed. The volatil-ity of stock index for prime companies (MERVAL)increased significantly, while the volatility of the totalmarket index remained relatively unchanged [Caballero,2000]. Notwithstanding volatility, values of both MERVAL(see Figure 2-6) and total stock market index have beenrelatively low from December 1994 until the end of1995.
There was also a large spread-premium on Argentinesovereign bonds relative to the U.S. throughout this time,which further confirms the country risk-premium and itsweak ties with international financial markets. Moreover,Argentine markets are still underdeveloped by interna-
CASE Reports No. 39
Figure 2-5. Peso and dollar deposits of the deposit money banks, 1994–1997
0
10000
20000
30000
40000
50000
60000
70000
peso deposits dolar deposits
1994
M1
1994
M5
1994
M9
1995
M1
1995
M5
1995
M9
1996
M1
1996
M5
1996
M9
1997
M1
1997
M5
1997
M9
nillio
n of
pes
o
Source: own calculations based on data provided by A. Ramos from the IMF, and on the IFS
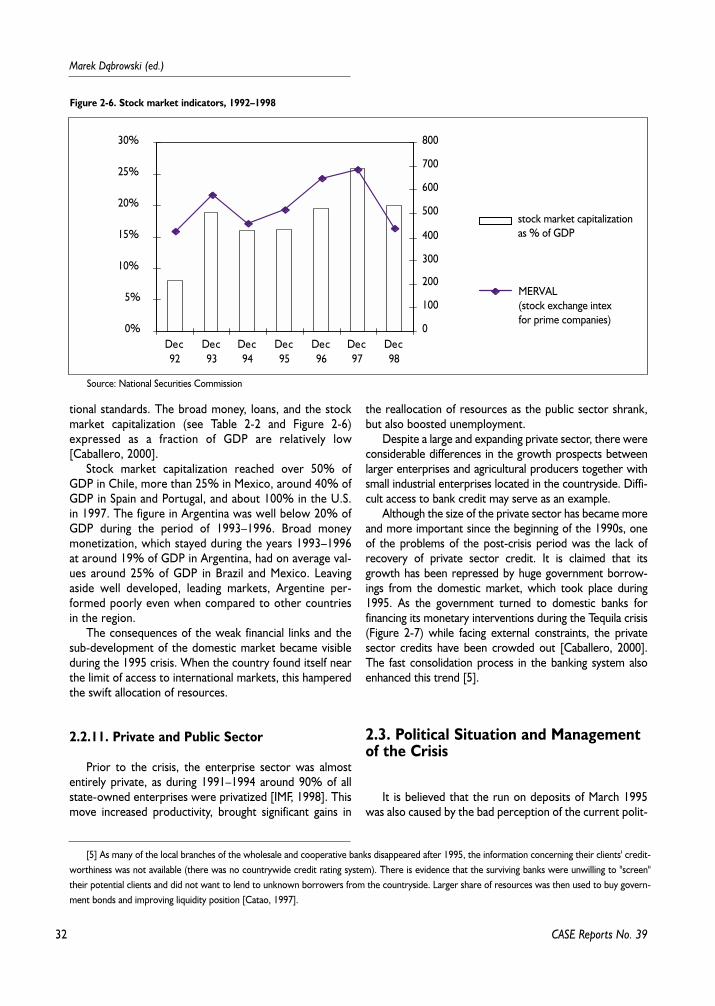
32
Marek D¹browski (ed.)
tional standards. The broad money, loans, and the stockmarket capitalization (see Table 2-2 and Figure 2-6)expressed as a fraction of GDP are relatively low[Caballero, 2000].
Stock market capitalization reached over 50% ofGDP in Chile, more than 25% in Mexico, around 40% ofGDP in Spain and Portugal, and about 100% in the U.S.in 1997. The figure in Argentina was well below 20% ofGDP during the period of 1993–1996. Broad moneymonetization, which stayed during the years 1993–1996at around 19% of GDP in Argentina, had on average val-ues around 25% of GDP in Brazil and Mexico. Leavingaside well developed, leading markets, Argentine per-formed poorly even when compared to other countriesin the region.
The consequences of the weak financial links and thesub-development of the domestic market became visibleduring the 1995 crisis. When the country found itself nearthe limit of access to international markets, this hamperedthe swift allocation of resources.
2.2.11. Private and Public Sector
Prior to the crisis, the enterprise sector was almostentirely private, as during 1991–1994 around 90% of allstate-owned enterprises were privatized [IMF, 1998]. Thismove increased productivity, brought significant gains in
the reallocation of resources as the public sector shrank,but also boosted unemployment.
Despite a large and expanding private sector, there wereconsiderable differences in the growth prospects betweenlarger enterprises and agricultural producers together withsmall industrial enterprises located in the countryside. Diffi-cult access to bank credit may serve as an example.
Although the size of the private sector has became moreand more important since the beginning of the 1990s, oneof the problems of the post-crisis period was the lack ofrecovery of private sector credit. It is claimed that itsgrowth has been repressed by huge government borrow-ings from the domestic market, which took place during1995. As the government turned to domestic banks forfinancing its monetary interventions during the Tequila crisis(Figure 2-7) while facing external constraints, the privatesector credits have been crowded out [Caballero, 2000].The fast consolidation process in the banking system alsoenhanced this trend [5].
2.3. Political Situation and Managementof the Crisis
It is believed that the run on deposits of March 1995was also caused by the bad perception of the current polit-
CASE Reports No. 39
[5] As many of the local branches of the wholesale and cooperative banks disappeared after 1995, the information concerning their clients' credit-worthiness was not available (there was no countrywide credit rating system). There is evidence that the surviving banks were unwilling to "screen"their potential clients and did not want to lend to unknown borrowers from the countryside. Larger share of resources was then used to buy govern-ment bonds and improving liquidity position [Catao, 1997].
Figure 2-6. Stock market indicators, 1992–1998
0%
5%
10%
15%
20%
25%
30%
Dec92
Dec93
Dec94
Dec95
Dec96
Dec97
Dec98
0
100
200
300
400
500
600
700
800
stock market capitalizationas % of GDP
MERVAL(stock exchange intexfor prime companies)
Source: National Securities Commission
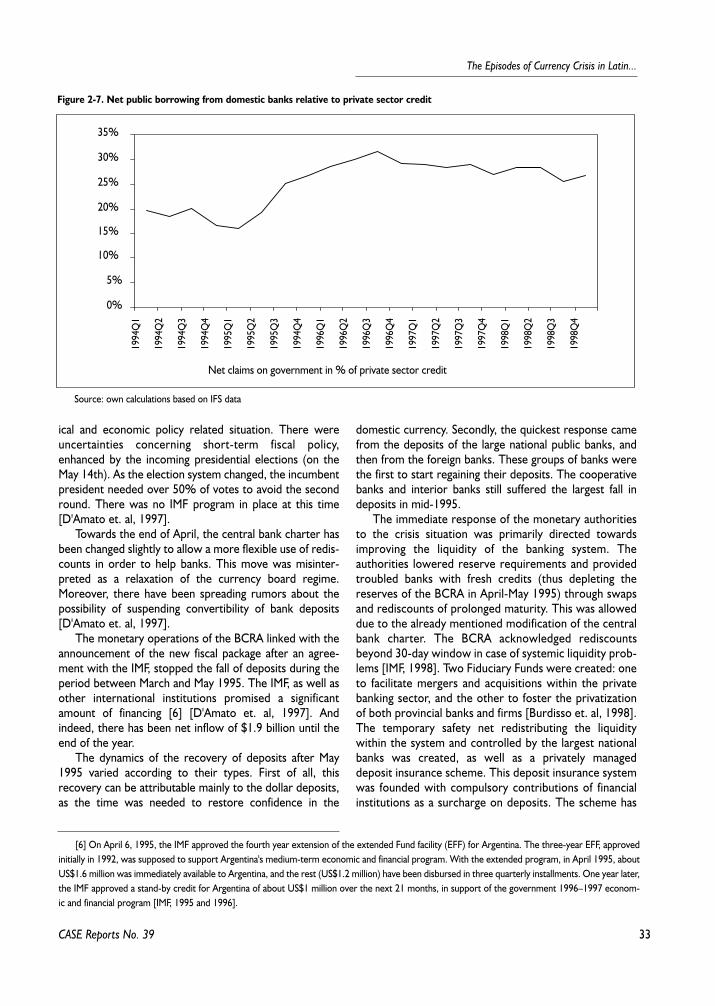
33
The Episodes of Currency Crisis in Latin...
ical and economic policy related situation. There wereuncertainties concerning short-term fiscal policy,enhanced by the incoming presidential elections (on theMay 14th). As the election system changed, the incumbentpresident needed over 50% of votes to avoid the secondround. There was no IMF program in place at this time[D'Amato et. al, 1997].
Towards the end of April, the central bank charter hasbeen changed slightly to allow a more flexible use of redis-counts in order to help banks. This move was misinter-preted as a relaxation of the currency board regime.Moreover, there have been spreading rumors about thepossibility of suspending convertibility of bank deposits[D'Amato et. al, 1997].
The monetary operations of the BCRA linked with theannouncement of the new fiscal package after an agree-ment with the IMF, stopped the fall of deposits during theperiod between March and May 1995. The IMF, as well asother international institutions promised a significantamount of financing [6] [D'Amato et. al, 1997]. Andindeed, there has been net inflow of $1.9 billion until theend of the year.
The dynamics of the recovery of deposits after May1995 varied according to their types. First of all, thisrecovery can be attributable mainly to the dollar deposits,as the time was needed to restore confidence in the
domestic currency. Secondly, the quickest response camefrom the deposits of the large national public banks, andthen from the foreign banks. These groups of banks werethe first to start regaining their deposits. The cooperativebanks and interior banks still suffered the largest fall indeposits in mid-1995.
The immediate response of the monetary authoritiesto the crisis situation was primarily directed towardsimproving the liquidity of the banking system. Theauthorities lowered reserve requirements and providedtroubled banks with fresh credits (thus depleting thereserves of the BCRA in April-May 1995) through swapsand rediscounts of prolonged maturity. This was alloweddue to the already mentioned modification of the centralbank charter. The BCRA acknowledged rediscountsbeyond 30-day window in case of systemic liquidity prob-lems [IMF, 1998]. Two Fiduciary Funds were created: oneto facilitate mergers and acquisitions within the privatebanking sector, and the other to foster the privatizationof both provincial banks and firms [Burdisso et. al, 1998].The temporary safety net redistributing the liquiditywithin the system and controlled by the largest nationalbanks was created, as well as a privately manageddeposit insurance scheme. This deposit insurance systemwas founded with compulsory contributions of financialinstitutions as a surcharge on deposits. The scheme has
CASE Reports No. 39
Figure 2-7. Net public borrowing from domestic banks relative to private sector credit
0%
5%
10%
15%
20%
25%
30%
35%
Net claims on government in % of private sector credit
1994
Q1
1994
Q2
1994
Q3
1994
Q4
1995
Q1
1995
Q2
1995
Q3
1994
Q4
1996
Q1
1996
Q2
1996
Q3
1996
Q4
1997
Q1
1997
Q2
1997
Q3
1997
Q4
1998
Q1
1998
Q2
1998
Q3
1998
Q4
Source: own calculations based on IFS data
[6] On April 6, 1995, the IMF approved the fourth year extension of the extended Fund facility (EFF) for Argentina. The three-year EFF, approvedinitially in 1992, was supposed to support Argentina's medium-term economic and financial program. With the extended program, in April 1995, aboutUS$1.6 million was immediately available to Argentina, and the rest (US$1.2 million) have been disbursed in three quarterly installments. One year later,the IMF approved a stand-by credit for Argentina of about US$1 million over the next 21 months, in support of the government 1996–1997 econom-ic and financial program [IMF, 1995 and 1996].
34
Marek D¹browski (ed.)
an upper limit per depositor in order to hamper moralhazard [IMF, 1998].
As the confidence in the banking system was restored,deposits kept mounting, and the interest rate spreadsstarted to decline, the government commenced the intro-duction of new prudential measures. Generally, thesemeasures were aimed at further raising the liquidity offinancial institutions, capital to assets ratios, addressed stillexisting information asymmetries in the credit market,and improved the existing payment system [IMF, 1998].
In 1995, the reserve requirements were still beingreplaced by liquidity requirements, with rates dependingof the residual times of maturity [7] [BCRA, 2000]. Theserequirements have been gradually tightened over time byincreasing their rates [8] and extending their applicabilityto other types of bank liabilities. The purpose of this movewas to improve the public perception of individual banks'liquidity position and limit imprudent lending policies asthere is evidence that the public discriminated against"good" and "bad" banks on the basis of their perceived liq-uidity position during the Tequila crisis.
Between 1996 and 1997, the authorities furtherstrengthened banks' capacity to withstand liquidity short-ages by the creation of a contingent repo facility betweenthe BCRA and a group of 13 major international banks.This agreement allows to swap a collateral – Argentinegovernment securities owned by the central bank or bydomestic financial institutions – for up to $ 7.3 billion incash [IMF, 1998]. Capital to assets ratio was furtherincreased by the incorporation of a new weighting systemthat takes into account market risk factors, as well as bythe increased role of the regulator of banks. There werealso steps towards the improvements in the informationabout debtors available to financial institutions (addressingadverse selection problem), as well as about individualbanks. There were also significant improvements in thefunctioning of the payment system, which today consistsof a real-time gross settlement scheme and three auto-mated clearinghouses [Pou, 2000].
It is claimed that the "second set" of prudential measuressignificantly improved the liquidity of the system, as therewas no system-large run on banks during the Brazilian crisis.
2.4. Post-Crisis Developments
Domestic financial markets have grown visibly since1994. Some indicators, such as monetization or stock mar-
ket capitalization, show gradual improvement. Neverthe-less, the rise of private sector credit has been constrainedfor a long time. Credit to the private sector has basicallydid not recover until only very recently.
The banking system increased significantly, and becamegenerally healthier. Regulations implemented after the1995 reduced its exposure to external shocks. As a resultof consolidation within private banks, privatizations andclosures, the number of banks declined to 119 in 1999.Several smaller, provincial banks, which were not trans-parent and suffered during the 1995 run, have been priva-tized. Non-performing assets in the banking sectordecreased significantly. They accounted for 8% of totalassets in private banks and for 13% in public banks in1997.
There is a need for further fiscal adjustment. The sup-ply-side rigidities should be addressed, so that externalshocks will not affect the real economy as quickly as in1995.
The public sector is still running large deficits which isa problem. It is argued that around 1% of GDP of thesedeficits per year can be attributed to the pension reform,effective since 1996, and thus should improve future effi-ciency. Nevertheless, as the external conditions hardenedagain in 1998–1999, public sector deficits went up to over4% of Argentine's GDP.
The country risk still remains high and was increasingduring the Asian, Russian, and Brazilian crises. The ratio ofbroad money to GDP – although growing over time – islow by international standards. Similar to the Argentinecountry risk, also interest rates were rising in response tothe recent currency crises. Although the increases, whichtook place in 1998 and 1999, were significantly lower thanduring 1995, the rates stayed high for a long period, andfinally soared in 2000.
The high interest rates in the period of 1999–2000reflect significant decreases in consumer and business con-fidence, and the progressive hardening of the borrowingconditions on international financial markets [9] (andhence the suppressed access to foreign borrowing forArgentine investors). The slow recovery from recessionaffecting Argentine economy since mid-1998, has alsobeen attributable to the impact of fiscal tightening ondomestic demand, the political uncertainties (new govern-ment taking office in 1999) reflecting doubts about thecourse of economic policy, and the downturn of tradingpartner demand.
Argentine GDP fell by 3.4% in 1999, and according tothe preliminary data, by 0.2% in 2000 [IMF, 2001]. Therehas been consumer price deflation, and the significant fall in
CASE Reports No. 39
[7] Higher for shorter residual time of maturity.[8] To reach 20% of most banking liabilities in 1998; the rate substantially higher than in other countries of the region.[9] High U.S. interest rates, and reduced access to international financial markets for emerging economies in general.
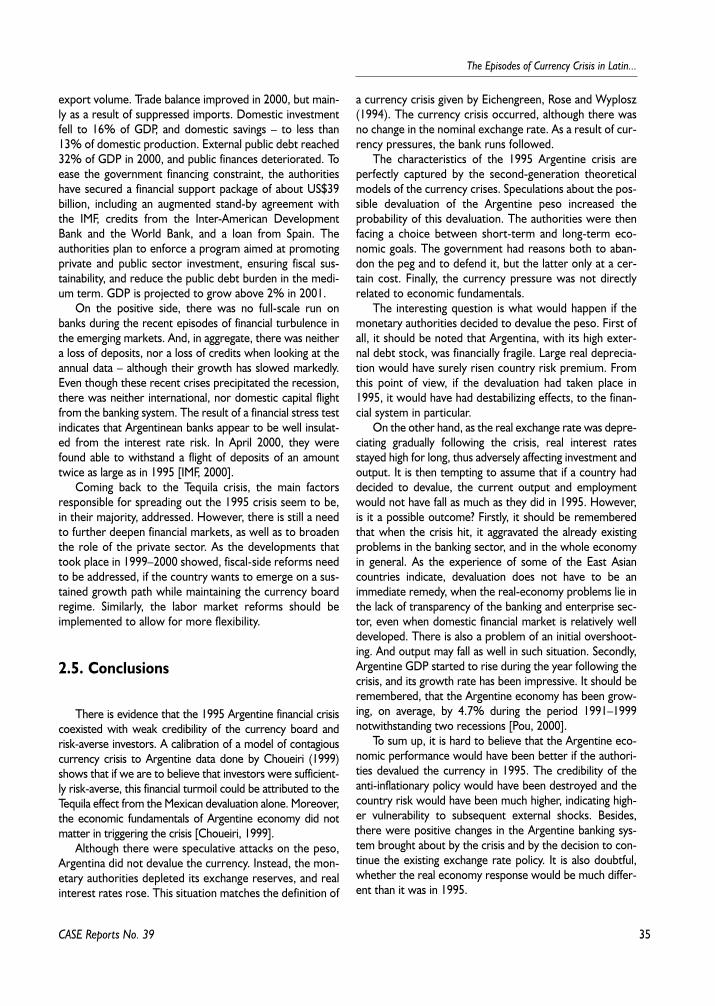
35
The Episodes of Currency Crisis in Latin...
export volume. Trade balance improved in 2000, but main-ly as a result of suppressed imports. Domestic investmentfell to 16% of GDP, and domestic savings – to less than13% of domestic production. External public debt reached32% of GDP in 2000, and public finances deteriorated. Toease the government financing constraint, the authoritieshave secured a financial support package of about US$39billion, including an augmented stand-by agreement withthe IMF, credits from the Inter-American DevelopmentBank and the World Bank, and a loan from Spain. Theauthorities plan to enforce a program aimed at promotingprivate and public sector investment, ensuring fiscal sus-tainability, and reduce the public debt burden in the medi-um term. GDP is projected to grow above 2% in 2001.
On the positive side, there was no full-scale run onbanks during the recent episodes of financial turbulence inthe emerging markets. And, in aggregate, there was neithera loss of deposits, nor a loss of credits when looking at theannual data – although their growth has slowed markedly.Even though these recent crises precipitated the recession,there was neither international, nor domestic capital flightfrom the banking system. The result of a financial stress testindicates that Argentinean banks appear to be well insulat-ed from the interest rate risk. In April 2000, they werefound able to withstand a flight of deposits of an amounttwice as large as in 1995 [IMF, 2000].
Coming back to the Tequila crisis, the main factorsresponsible for spreading out the 1995 crisis seem to be,in their majority, addressed. However, there is still a needto further deepen financial markets, as well as to broadenthe role of the private sector. As the developments thattook place in 1999–2000 showed, fiscal-side reforms needto be addressed, if the country wants to emerge on a sus-tained growth path while maintaining the currency boardregime. Similarly, the labor market reforms should beimplemented to allow for more flexibility.
2.5. Conclusions
There is evidence that the 1995 Argentine financial crisiscoexisted with weak credibility of the currency board andrisk-averse investors. A calibration of a model of contagiouscurrency crisis to Argentine data done by Choueiri (1999)shows that if we are to believe that investors were sufficient-ly risk-averse, this financial turmoil could be attributed to theTequila effect from the Mexican devaluation alone. Moreover,the economic fundamentals of Argentine economy did notmatter in triggering the crisis [Choueiri, 1999].
Although there were speculative attacks on the peso,Argentina did not devalue the currency. Instead, the mon-etary authorities depleted its exchange reserves, and realinterest rates rose. This situation matches the definition of
a currency crisis given by Eichengreen, Rose and Wyplosz(1994). The currency crisis occurred, although there wasno change in the nominal exchange rate. As a result of cur-rency pressures, the bank runs followed.
The characteristics of the 1995 Argentine crisis areperfectly captured by the second-generation theoreticalmodels of the currency crises. Speculations about the pos-sible devaluation of the Argentine peso increased theprobability of this devaluation. The authorities were thenfacing a choice between short-term and long-term eco-nomic goals. The government had reasons both to aban-don the peg and to defend it, but the latter only at a cer-tain cost. Finally, the currency pressure was not directlyrelated to economic fundamentals.
The interesting question is what would happen if themonetary authorities decided to devalue the peso. First ofall, it should be noted that Argentina, with its high exter-nal debt stock, was financially fragile. Large real deprecia-tion would have surely risen country risk premium. Fromthis point of view, if the devaluation had taken place in1995, it would have had destabilizing effects, to the finan-cial system in particular.
On the other hand, as the real exchange rate was depre-ciating gradually following the crisis, real interest ratesstayed high for long, thus adversely affecting investment andoutput. It is then tempting to assume that if a country haddecided to devalue, the current output and employmentwould not have fall as much as they did in 1995. However,is it a possible outcome? Firstly, it should be rememberedthat when the crisis hit, it aggravated the already existingproblems in the banking sector, and in the whole economyin general. As the experience of some of the East Asiancountries indicate, devaluation does not have to be animmediate remedy, when the real-economy problems lie inthe lack of transparency of the banking and enterprise sec-tor, even when domestic financial market is relatively welldeveloped. There is also a problem of an initial overshoot-ing. And output may fall as well in such situation. Secondly,Argentine GDP started to rise during the year following thecrisis, and its growth rate has been impressive. It should beremembered, that the Argentine economy has been grow-ing, on average, by 4.7% during the period 1991–1999notwithstanding two recessions [Pou, 2000].
To sum up, it is hard to believe that the Argentine eco-nomic performance would have been better if the authori-ties devalued the currency in 1995. The credibility of theanti-inflationary policy would have been destroyed and thecountry risk would have been much higher, indicating high-er vulnerability to subsequent external shocks. Besides,there were positive changes in the Argentine banking sys-tem brought about by the crisis and by the decision to con-tinue the existing exchange rate policy. It is also doubtful,whether the real economy response would be much differ-ent than it was in 1995.
CASE Reports No. 39
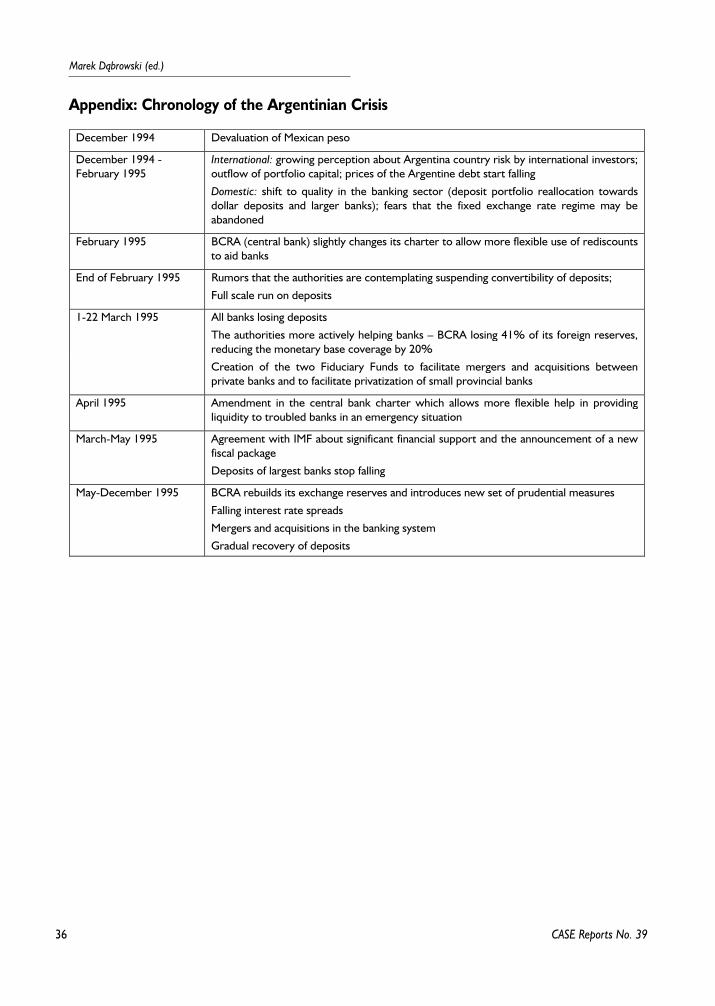
36
Marek D¹browski (ed.)
CASE Reports No. 39
Appendix: Chronology of the Argentinian Crisis
December 1994 Devaluation of Mexican peso
December 1994 -February 1995
International: growing perception about Argentina country risk by international investors;outflow of portfolio capital; prices of the Argentine debt start falling
Domestic: shift to quality in the banking sector (deposit portfolio reallocation towardsdollar deposits and larger banks); fears that the fixed exchange rate regime may beabandoned
February 1995 BCRA (central bank) slightly changes its charter to allow more flexible use of rediscountsto aid banks
End of February 1995 Rumors that the authorities are contemplating suspending convertibility of deposits;
Full scale run on deposits
1-22 March 1995 All banks losing deposits
The authorities more actively helping banks – BCRA losing 41% of its foreign reserves,reducing the monetary base coverage by 20%
Creation of the two Fiduciary Funds to facilitate mergers and acquisitions betweenprivate banks and to facilitate privatization of small provincial banks
April 1995 Amendment in the central bank charter which allows more flexible help in providingliquidity to troubled banks in an emergency situation
March-May 1995 Agreement with IMF about significant financial support and the announcement of a newfiscal package
Deposits of largest banks stop falling
May-December 1995 BCRA rebuilds its exchange reserves and introduces new set of prudential measures
Falling interest rate spreads
Mergers and acquisitions in the banking system
Gradual recovery of deposits
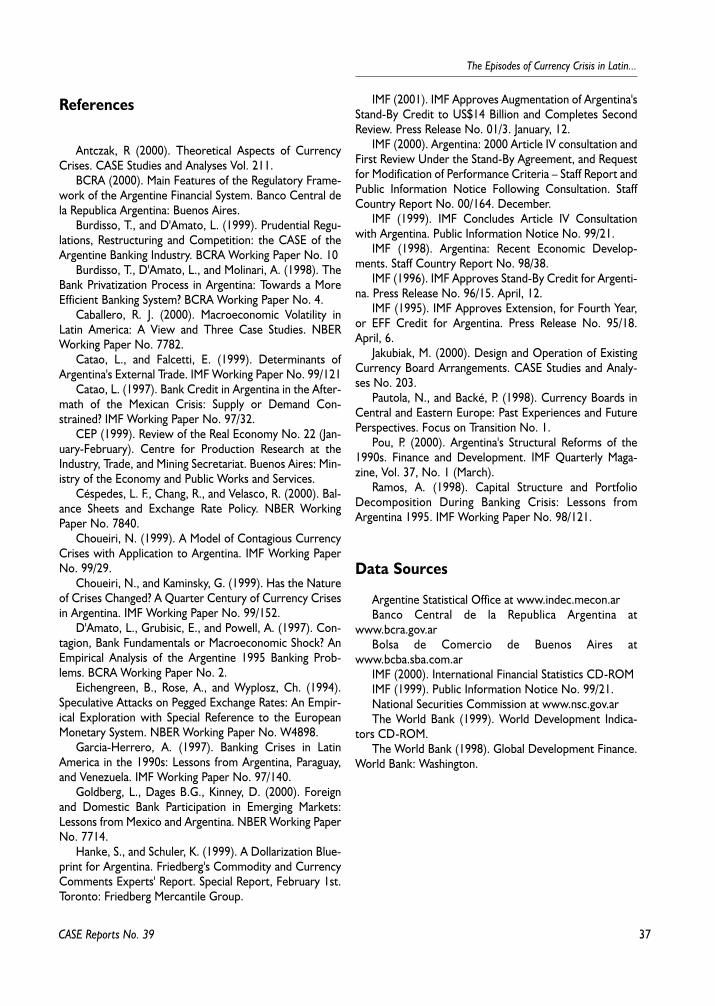
37
The Episodes of Currency Crisis in Latin...
CASE Reports No. 39
References
Antczak, R (2000). Theoretical Aspects of CurrencyCrises. CASE Studies and Analyses Vol. 211.
BCRA (2000). Main Features of the Regulatory Frame-work of the Argentine Financial System. Banco Central dela Republica Argentina: Buenos Aires.
Burdisso, T., and D'Amato, L. (1999). Prudential Regu-lations, Restructuring and Competition: the CASE of theArgentine Banking Industry. BCRA Working Paper No. 10
Burdisso, T., D'Amato, L., and Molinari, A. (1998). TheBank Privatization Process in Argentina: Towards a MoreEfficient Banking System? BCRA Working Paper No. 4.
Caballero, R. J. (2000). Macroeconomic Volatility inLatin America: A View and Three Case Studies. NBERWorking Paper No. 7782.
Catao, L., and Falcetti, E. (1999). Determinants ofArgentina's External Trade. IMF Working Paper No. 99/121
Catao, L. (1997). Bank Credit in Argentina in the After-math of the Mexican Crisis: Supply or Demand Con-strained? IMF Working Paper No. 97/32.
CEP (1999). Review of the Real Economy No. 22 (Jan-uary-February). Centre for Production Research at theIndustry, Trade, and Mining Secretariat. Buenos Aires: Min-istry of the Economy and Public Works and Services.
Céspedes, L. F., Chang, R., and Velasco, R. (2000). Bal-ance Sheets and Exchange Rate Policy. NBER WorkingPaper No. 7840.
Choueiri, N. (1999). A Model of Contagious CurrencyCrises with Application to Argentina. IMF Working PaperNo. 99/29.
Choueiri, N., and Kaminsky, G. (1999). Has the Natureof Crises Changed? A Quarter Century of Currency Crisesin Argentina. IMF Working Paper No. 99/152.
D'Amato, L., Grubisic, E., and Powell, A. (1997). Con-tagion, Bank Fundamentals or Macroeconomic Shock? AnEmpirical Analysis of the Argentine 1995 Banking Prob-lems. BCRA Working Paper No. 2.
Eichengreen, B., Rose, A., and Wyplosz, Ch. (1994).Speculative Attacks on Pegged Exchange Rates: An Empir-ical Exploration with Special Reference to the EuropeanMonetary System. NBER Working Paper No. W4898.
Garcia-Herrero, A. (1997). Banking Crises in LatinAmerica in the 1990s: Lessons from Argentina, Paraguay,and Venezuela. IMF Working Paper No. 97/140.
Goldberg, L., Dages B.G., Kinney, D. (2000). Foreignand Domestic Bank Participation in Emerging Markets:Lessons from Mexico and Argentina. NBER Working PaperNo. 7714.
Hanke, S., and Schuler, K. (1999). A Dollarization Blue-print for Argentina. Friedberg's Commodity and CurrencyComments Experts' Report. Special Report, February 1st.Toronto: Friedberg Mercantile Group.
IMF (2001). IMF Approves Augmentation of Argentina'sStand-By Credit to US$14 Billion and Completes SecondReview. Press Release No. 01/3. January, 12.
IMF (2000). Argentina: 2000 Article IV consultation andFirst Review Under the Stand-By Agreement, and Requestfor Modification of Performance Criteria – Staff Report andPublic Information Notice Following Consultation. StaffCountry Report No. 00/164. December.
IMF (1999). IMF Concludes Article IV Consultationwith Argentina. Public Information Notice No. 99/21.
IMF (1998). Argentina: Recent Economic Develop-ments. Staff Country Report No. 98/38.
IMF (1996). IMF Approves Stand-By Credit for Argenti-na. Press Release No. 96/15. April, 12.
IMF (1995). IMF Approves Extension, for Fourth Year,or EFF Credit for Argentina. Press Release No. 95/18.April, 6.
Jakubiak, M. (2000). Design and Operation of ExistingCurrency Board Arrangements. CASE Studies and Analy-ses No. 203.
Pautola, N., and Backé, P. (1998). Currency Boards inCentral and Eastern Europe: Past Experiences and FuturePerspectives. Focus on Transition No. 1.
Pou, P. (2000). Argentina's Structural Reforms of the1990s. Finance and Development. IMF Quarterly Maga-zine, Vol. 37, No. 1 (March).
Ramos, A. (1998). Capital Structure and PortfolioDecomposition During Banking Crisis: Lessons fromArgentina 1995. IMF Working Paper No. 98/121.
Data Sources
Argentine Statistical Office at www.indec.mecon.arBanco Central de la Republica Argentina at
www.bcra.gov.arBolsa de Comercio de Buenos Aires at
www.bcba.sba.com.arIMF (2000). International Financial Statistics CD-ROMIMF (1999). Public Information Notice No. 99/21.National Securities Commission at www.nsc.gov.arThe World Bank (1999). World Development Indica-
tors CD-ROM.The World Bank (1998). Global Development Finance.
World Bank: Washington.

39
The Episodes of Currency Crisis in Latin...
CASE Reports No. 39
3.1. Introduction
The financial turmoil that erupted in Thailand in 1997did not fit into any group of models of financial crises exist-ing in the economic literature at that time. It is just recent-ly when researches tried do develop the so-called thirdgeneration models. The Thai experience is an examplewhich confirms that financial crises occur when macroeco-nomic as well as microeconomic fundamentals experiencevulnerabilities.
This paper seeks to explore the country-specific factorslying behind the Thai financial crisis. It provides analysis ofmacroeconomic and microeconomic roots of the crisis. Itshows that while macroeconomic imbalances played animportant role, the close relationship among banks, corpo-rations and the government created additional problems,which resulted in many bankruptcies and led to a sharp andunexpected economic downturn. The financial crisis con-tributed to a sharp contraction in domestic demand andactivity. Also, the paper describes the sequence of the crisisand its management.
Having relatively strong macroeconomic fundamentals(excluding a deteriorating current account balance, fallinginvestments and some foreign exchange reserve indicators)the Thai authorities did not face any dramatic externalshock as in the second-generation models. In Thailand, as inall Asian countries there was a boom-bust cycle in segmentsof the asset market (stocks, land prices, and real estate)preceding the currency crisis.
Starting from the late eighties, prudent macroeconomicpolicies have supported a period of rapid economic growthand price stability in Thailand. However, in recent years thecombination of a fixed exchange rate (which was linked to abasket of other currencies but with a strong dominance of theU.S. dollar), an increasingly open capital account, and impres-sive economic growth, attracted short-term capital inflows.These inflows were often channeled to over-invested sectors
due to weak prudential regulations in the banking sectorenhanced by risky investments and poor corporate gover-nance [1]. The huge amount of short-term investments leftthe economy vulnerable to sudden shifts and external shocks.
These began to materialize in 1996 as a sudden drop inexports led to a high current account deficit. At the sametime, slowing economic activity and a weakening in thefinancial position of banks and finance companies led todebt-servicing difficulties and an increase in non-performingloans (NPLs). Starting from May 1997, the Thai currencymarket was destabilized by a series of currency attacks ofincreasing intensity. The Thai authorities attempted todefend the baht by increasing short-term interest rates andintervention in the market. As a result, the Bank of Thailandreserves were depleted, to significant extent, and the bahtdepreciated sharply.
From the beginning of the crisis, economic policieshave been progressively strengthened through: suspensionof unlivable finance companies, expenditure cuts in thecentral government budget, and an increase in the centralbank interest rates. Probably the most important actionwas a change in the Thai exchange rate regime, effectiveon July 2, 1997, from the so-called fixed but adjustable pegto a managed float. Building on these steps, the govern-ment developed a comprehensive medium-term econom-ic policy package, which was implemented with the help ofthe IMF. It was focused on the stabilization of the curren-cy and strengthening of the financial system.
3.2. The Way to the Crisis
Simplifying the classification, the economic fundamentalscan be divided into two broad categories: macro and micro-economic. At the onset of the crisis, macroeconomic fun-damentals in Thailand remained relatively sound and did notshow many signs of vulnerability.
Part III.The 1997 Currency Crisis in Thailandby Ma³gorzata Antczak
[1] Recent literature, which emphasizes weak banking and financial sectors as one factor in currency crisis, includes Chau-Lau and Chen (1998),Chang and Velasco (1998), Krugman (1998), and Marshall (1998).
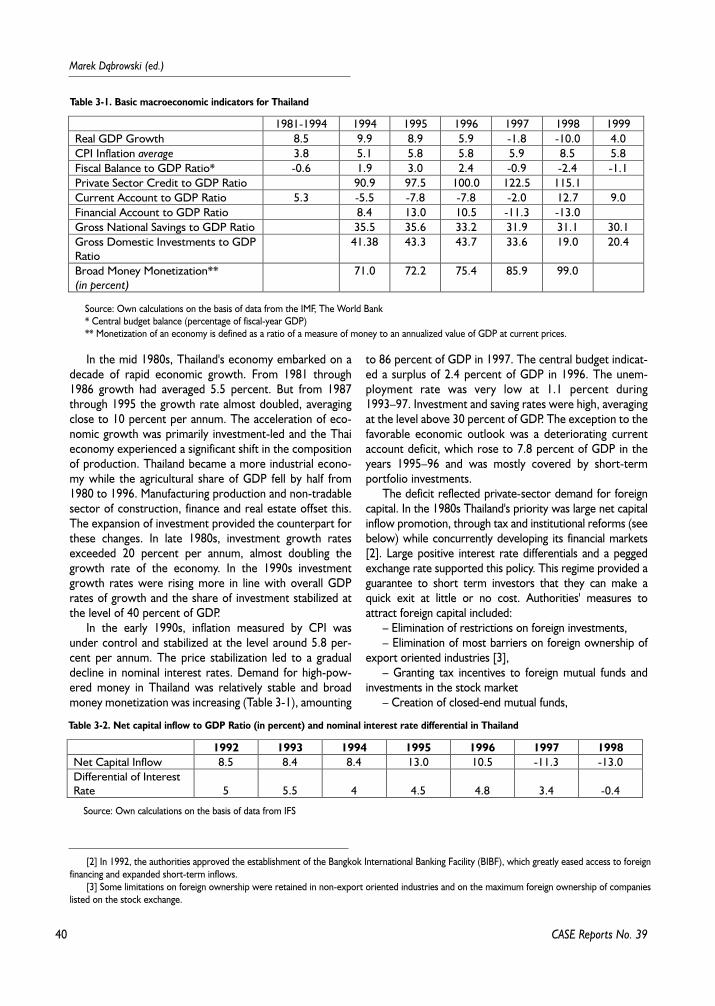
40
Marek D¹browski (ed.)
CASE Reports No. 39
In the mid 1980s, Thailand's economy embarked on adecade of rapid economic growth. From 1981 through1986 growth had averaged 5.5 percent. But from 1987through 1995 the growth rate almost doubled, averagingclose to 10 percent per annum. The acceleration of eco-nomic growth was primarily investment-led and the Thaieconomy experienced a significant shift in the compositionof production. Thailand became a more industrial econo-my while the agricultural share of GDP fell by half from1980 to 1996. Manufacturing production and non-tradablesector of construction, finance and real estate offset this.The expansion of investment provided the counterpart forthese changes. In late 1980s, investment growth ratesexceeded 20 percent per annum, almost doubling thegrowth rate of the economy. In the 1990s investmentgrowth rates were rising more in line with overall GDPrates of growth and the share of investment stabilized atthe level of 40 percent of GDP.
In the early 1990s, inflation measured by CPI wasunder control and stabilized at the level around 5.8 per-cent per annum. The price stabilization led to a gradualdecline in nominal interest rates. Demand for high-pow-ered money in Thailand was relatively stable and broadmoney monetization was increasing (Table 3-1), amounting
to 86 percent of GDP in 1997. The central budget indicat-ed a surplus of 2.4 percent of GDP in 1996. The unem-ployment rate was very low at 1.1 percent during1993–97. Investment and saving rates were high, averagingat the level above 30 percent of GDP. The exception to thefavorable economic outlook was a deteriorating currentaccount deficit, which rose to 7.8 percent of GDP in theyears 1995–96 and was mostly covered by short-termportfolio investments.
The deficit reflected private-sector demand for foreigncapital. In the 1980s Thailand's priority was large net capitalinflow promotion, through tax and institutional reforms (seebelow) while concurrently developing its financial markets[2]. Large positive interest rate differentials and a peggedexchange rate supported this policy. This regime provided aguarantee to short term investors that they can make aquick exit at little or no cost. Authorities' measures toattract foreign capital included:
– Elimination of restrictions on foreign investments,– Elimination of most barriers on foreign ownership of
export oriented industries [3],– Granting tax incentives to foreign mutual funds and
investments in the stock market– Creation of closed-end mutual funds,
[2] In 1992, the authorities approved the establishment of the Bangkok International Banking Facility (BIBF), which greatly eased access to foreignfinancing and expanded short-term inflows.
[3] Some limitations on foreign ownership were retained in non-export oriented industries and on the maximum foreign ownership of companieslisted on the stock exchange.
Table 3-1. Basic macroeconomic indicators for Thailand
1981-1994 1994 1995 1996 1997 1998 1999Real GDP Growth 8.5 9.9 8.9 5.9 -1.8 -10.0 4.0CPI Inflation average 3.8 5.1 5.8 5.8 5.9 8.5 5.8Fiscal Balance to GDP Ratio* -0.6 1.9 3.0 2.4 -0.9 -2.4 -1.1Private Sector Credit to GDP Ratio 90.9 97.5 100.0 122.5 115.1Current Account to GDP Ratio 5.3 -5.5 -7.8 -7.8 -2.0 12.7 9.0Financial Account to GDP Ratio 8.4 13.0 10.5 -11.3 -13.0Gross National Savings to GDP Ratio 35.5 35.6 33.2 31.9 31.1 30.1Gross Domestic Investments to GDPRatio
41.38 43.3 43.7 33.6 19.0 20.4
Broad Money Monetization**(in percent)
71.0 72.2 75.4 85.9 99.0
Source: Own calculations on the basis of data from the IMF, The World Bank* Central budget balance (percentage of fiscal-year GDP)** Monetization of an economy is defined as a ratio of a measure of money to an annualized value of GDP at current prices.
Table 3-2. Net capital inflow to GDP Ratio (in percent) and nominal interest rate differential in Thailand
1992 1993 1994 1995 1996 1997 1998Net Capital Inflow 8.5 8.4 8.4 13.0 10.5 -11.3 -13.0Differential of InterestRate 5 5.5 4 4.5 4.8 3.4 -0.4
Source: Own calculations on the basis of data from IFS
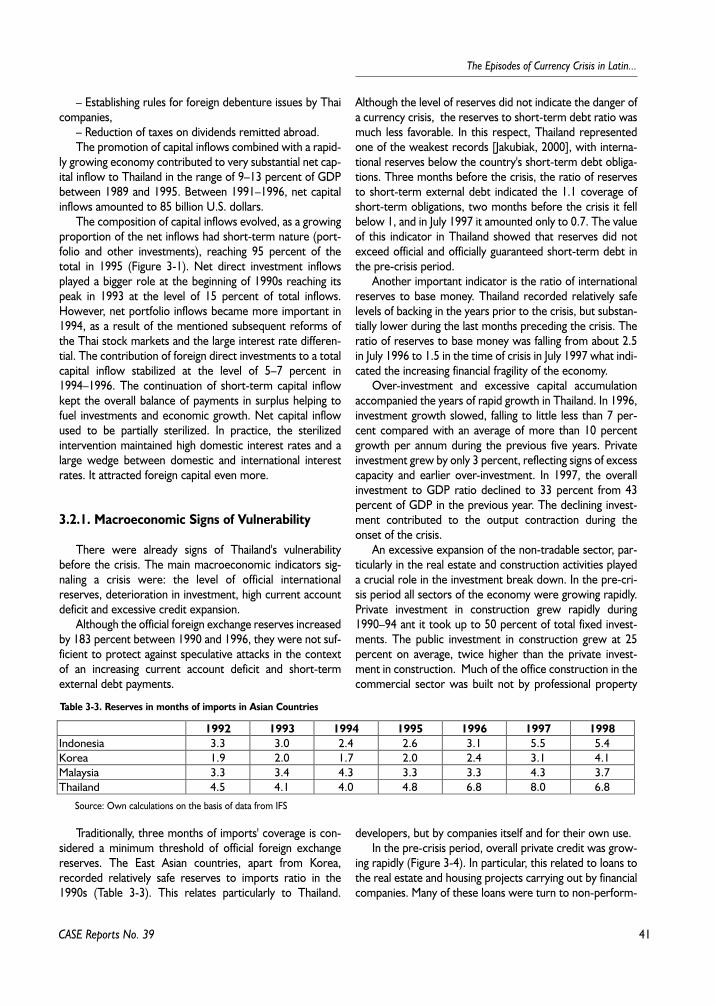
41
The Episodes of Currency Crisis in Latin...
CASE Reports No. 39
– Establishing rules for foreign debenture issues by Thaicompanies,
– Reduction of taxes on dividends remitted abroad.The promotion of capital inflows combined with a rapid-
ly growing economy contributed to very substantial net cap-ital inflow to Thailand in the range of 9–13 percent of GDPbetween 1989 and 1995. Between 1991–1996, net capitalinflows amounted to 85 billion U.S. dollars.
The composition of capital inflows evolved, as a growingproportion of the net inflows had short-term nature (port-folio and other investments), reaching 95 percent of thetotal in 1995 (Figure 3-1). Net direct investment inflowsplayed a bigger role at the beginning of 1990s reaching itspeak in 1993 at the level of 15 percent of total inflows.However, net portfolio inflows became more important in1994, as a result of the mentioned subsequent reforms ofthe Thai stock markets and the large interest rate differen-tial. The contribution of foreign direct investments to a totalcapital inflow stabilized at the level of 5–7 percent in1994–1996. The continuation of short-term capital inflowkept the overall balance of payments in surplus helping tofuel investments and economic growth. Net capital inflowused to be partially sterilized. In practice, the sterilizedintervention maintained high domestic interest rates and alarge wedge between domestic and international interestrates. It attracted foreign capital even more.
3.2.1. Macroeconomic Signs of Vulnerability
There were already signs of Thailand's vulnerabilitybefore the crisis. The main macroeconomic indicators sig-naling a crisis were: the level of official internationalreserves, deterioration in investment, high current accountdeficit and excessive credit expansion.
Although the official foreign exchange reserves increasedby 183 percent between 1990 and 1996, they were not suf-ficient to protect against speculative attacks in the contextof an increasing current account deficit and short-termexternal debt payments.
Traditionally, three months of imports' coverage is con-sidered a minimum threshold of official foreign exchangereserves. The East Asian countries, apart from Korea,recorded relatively safe reserves to imports ratio in the1990s (Table 3-3). This relates particularly to Thailand.
Although the level of reserves did not indicate the danger ofa currency crisis, the reserves to short-term debt ratio wasmuch less favorable. In this respect, Thailand representedone of the weakest records [Jakubiak, 2000], with interna-tional reserves below the country's short-term debt obliga-tions. Three months before the crisis, the ratio of reservesto short-term external debt indicated the 1.1 coverage ofshort-term obligations, two months before the crisis it fellbelow 1, and in July 1997 it amounted only to 0.7. The valueof this indicator in Thailand showed that reserves did notexceed official and officially guaranteed short-term debt inthe pre-crisis period.
Another important indicator is the ratio of internationalreserves to base money. Thailand recorded relatively safelevels of backing in the years prior to the crisis, but substan-tially lower during the last months preceding the crisis. Theratio of reserves to base money was falling from about 2.5in July 1996 to 1.5 in the time of crisis in July 1997 what indi-cated the increasing financial fragility of the economy.
Over-investment and excessive capital accumulationaccompanied the years of rapid growth in Thailand. In 1996,investment growth slowed, falling to little less than 7 per-cent compared with an average of more than 10 percentgrowth per annum during the previous five years. Privateinvestment grew by only 3 percent, reflecting signs of excesscapacity and earlier over-investment. In 1997, the overallinvestment to GDP ratio declined to 33 percent from 43percent of GDP in the previous year. The declining invest-ment contributed to the output contraction during theonset of the crisis.
An excessive expansion of the non-tradable sector, par-ticularly in the real estate and construction activities playeda crucial role in the investment break down. In the pre-cri-sis period all sectors of the economy were growing rapidly.Private investment in construction grew rapidly during1990–94 ant it took up to 50 percent of total fixed invest-ments. The public investment in construction grew at 25percent on average, twice higher than the private invest-ment in construction. Much of the office construction in thecommercial sector was built not by professional property
developers, but by companies itself and for their own use. In the pre-crisis period, overall private credit was grow-
ing rapidly (Figure 3-4). In particular, this related to loans tothe real estate and housing projects carrying out by financialcompanies. Many of these loans were turn to non-perform-
Table 3-3. Reserves in months of imports in Asian Countries
1992 1993 1994 1995 1996 1997 1998Indonesia 3.3 3.0 2.4 2.6 3.1 5.5 5.4Korea 1.9 2.0 1.7 2.0 2.4 3.1 4.1Malaysia 3.3 3.4 4.3 3.3 3.3 4.3 3.7Thailand 4.5 4.1 4.0 4.8 6.8 8.0 6.8
Source: Own calculations on the basis of data from IFS
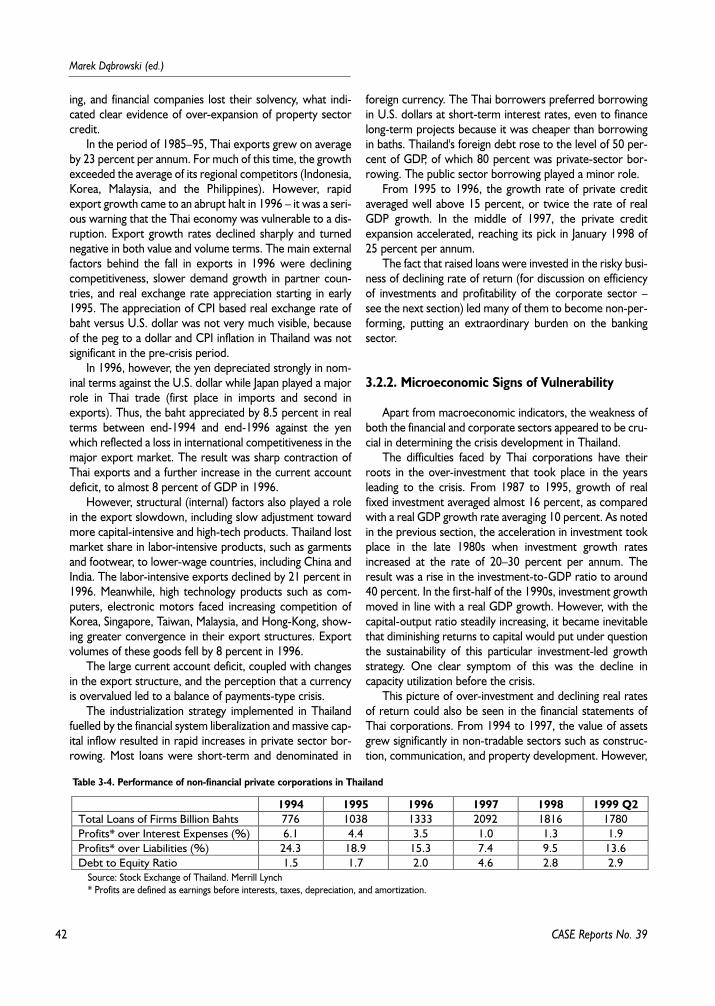
42
Marek D¹browski (ed.)
CASE Reports No. 39
ing, and financial companies lost their solvency, what indi-cated clear evidence of over-expansion of property sectorcredit.
In the period of 1985–95, Thai exports grew on averageby 23 percent per annum. For much of this time, the growthexceeded the average of its regional competitors (Indonesia,Korea, Malaysia, and the Philippines). However, rapidexport growth came to an abrupt halt in 1996 – it was a seri-ous warning that the Thai economy was vulnerable to a dis-ruption. Export growth rates declined sharply and turnednegative in both value and volume terms. The main externalfactors behind the fall in exports in 1996 were decliningcompetitiveness, slower demand growth in partner coun-tries, and real exchange rate appreciation starting in early1995. The appreciation of CPI based real exchange rate ofbaht versus U.S. dollar was not very much visible, becauseof the peg to a dollar and CPI inflation in Thailand was notsignificant in the pre-crisis period.
In 1996, however, the yen depreciated strongly in nom-inal terms against the U.S. dollar while Japan played a majorrole in Thai trade (first place in imports and second inexports). Thus, the baht appreciated by 8.5 percent in realterms between end-1994 and end-1996 against the yenwhich reflected a loss in international competitiveness in themajor export market. The result was sharp contraction ofThai exports and a further increase in the current accountdeficit, to almost 8 percent of GDP in 1996.
However, structural (internal) factors also played a rolein the export slowdown, including slow adjustment towardmore capital-intensive and high-tech products. Thailand lostmarket share in labor-intensive products, such as garmentsand footwear, to lower-wage countries, including China andIndia. The labor-intensive exports declined by 21 percent in1996. Meanwhile, high technology products such as com-puters, electronic motors faced increasing competition ofKorea, Singapore, Taiwan, Malaysia, and Hong-Kong, show-ing greater convergence in their export structures. Exportvolumes of these goods fell by 8 percent in 1996.
The large current account deficit, coupled with changesin the export structure, and the perception that a currencyis overvalued led to a balance of payments-type crisis.
The industrialization strategy implemented in Thailandfuelled by the financial system liberalization and massive cap-ital inflow resulted in rapid increases in private sector bor-rowing. Most loans were short-term and denominated in
foreign currency. The Thai borrowers preferred borrowingin U.S. dollars at short-term interest rates, even to financelong-term projects because it was cheaper than borrowingin baths. Thailand's foreign debt rose to the level of 50 per-cent of GDP, of which 80 percent was private-sector bor-rowing. The public sector borrowing played a minor role.
From 1995 to 1996, the growth rate of private creditaveraged well above 15 percent, or twice the rate of realGDP growth. In the middle of 1997, the private creditexpansion accelerated, reaching its pick in January 1998 of25 percent per annum.
The fact that raised loans were invested in the risky busi-ness of declining rate of return (for discussion on efficiencyof investments and profitability of the corporate sector –see the next section) led many of them to become non-per-forming, putting an extraordinary burden on the bankingsector.
3.2.2. Microeconomic Signs of Vulnerability
Apart from macroeconomic indicators, the weakness ofboth the financial and corporate sectors appeared to be cru-cial in determining the crisis development in Thailand.
The difficulties faced by Thai corporations have theirroots in the over-investment that took place in the yearsleading to the crisis. From 1987 to 1995, growth of realfixed investment averaged almost 16 percent, as comparedwith a real GDP growth rate averaging 10 percent. As notedin the previous section, the acceleration in investment tookplace in the late 1980s when investment growth ratesincreased at the rate of 20–30 percent per annum. Theresult was a rise in the investment-to-GDP ratio to around40 percent. In the first-half of the 1990s, investment growthmoved in line with a real GDP growth. However, with thecapital-output ratio steadily increasing, it became inevitablethat diminishing returns to capital would put under questionthe sustainability of this particular investment-led growthstrategy. One clear symptom of this was the decline incapacity utilization before the crisis.
This picture of over-investment and declining real ratesof return could also be seen in the financial statements ofThai corporations. From 1994 to 1997, the value of assetsgrew significantly in non-tradable sectors such as construc-tion, communication, and property development. However,
Table 3-4. Performance of non-financial private corporations in Thailand
1994 1995 1996 1997 1998 1999 Q2Total Loans of Firms Billion Bahts 776 1038 1333 2092 1816 1780Profits* over Interest Expenses (%) 6.1 4.4 3.5 1.0 1.3 1.9Profits* over Liabilities (%) 24.3 18.9 15.3 7.4 9.5 13.6Debt to Equity Ratio 1.5 1.7 2.0 4.6 2.8 2.9
Source: Stock Exchange of Thailand. Merrill Lynch* Profits are defined as earnings before interests, taxes, depreciation, and amortization.
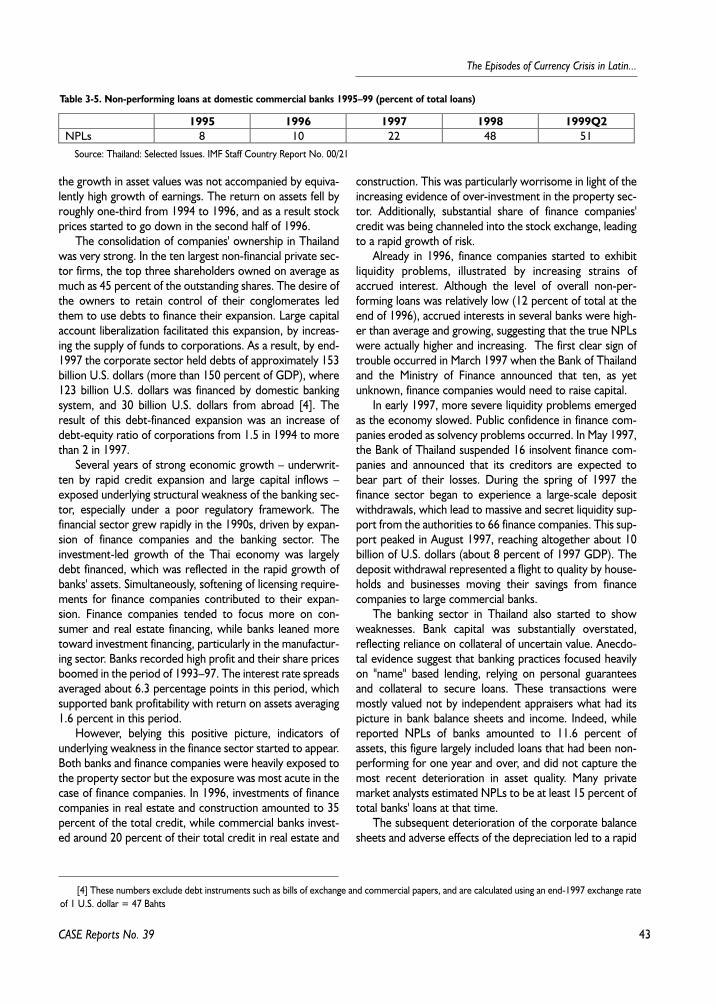
43
The Episodes of Currency Crisis in Latin...
the growth in asset values was not accompanied by equiva-lently high growth of earnings. The return on assets fell byroughly one-third from 1994 to 1996, and as a result stockprices started to go down in the second half of 1996.
The consolidation of companies' ownership in Thailandwas very strong. In the ten largest non-financial private sec-tor firms, the top three shareholders owned on average asmuch as 45 percent of the outstanding shares. The desire ofthe owners to retain control of their conglomerates ledthem to use debts to finance their expansion. Large capitalaccount liberalization facilitated this expansion, by increas-ing the supply of funds to corporations. As a result, by end-1997 the corporate sector held debts of approximately 153billion U.S. dollars (more than 150 percent of GDP), where123 billion U.S. dollars was financed by domestic bankingsystem, and 30 billion U.S. dollars from abroad [4]. Theresult of this debt-financed expansion was an increase ofdebt-equity ratio of corporations from 1.5 in 1994 to morethan 2 in 1997.
Several years of strong economic growth – underwrit-ten by rapid credit expansion and large capital inflows –exposed underlying structural weakness of the banking sec-tor, especially under a poor regulatory framework. Thefinancial sector grew rapidly in the 1990s, driven by expan-sion of finance companies and the banking sector. Theinvestment-led growth of the Thai economy was largelydebt financed, which was reflected in the rapid growth ofbanks' assets. Simultaneously, softening of licensing require-ments for finance companies contributed to their expan-sion. Finance companies tended to focus more on con-sumer and real estate financing, while banks leaned moretoward investment financing, particularly in the manufactur-ing sector. Banks recorded high profit and their share pricesboomed in the period of 1993–97. The interest rate spreadsaveraged about 6.3 percentage points in this period, whichsupported bank profitability with return on assets averaging1.6 percent in this period.
However, belying this positive picture, indicators ofunderlying weakness in the finance sector started to appear.Both banks and finance companies were heavily exposed tothe property sector but the exposure was most acute in thecase of finance companies. In 1996, investments of financecompanies in real estate and construction amounted to 35percent of the total credit, while commercial banks invest-ed around 20 percent of their total credit in real estate and
construction. This was particularly worrisome in light of theincreasing evidence of over-investment in the property sec-tor. Additionally, substantial share of finance companies'credit was being channeled into the stock exchange, leadingto a rapid growth of risk.
Already in 1996, finance companies started to exhibitliquidity problems, illustrated by increasing strains ofaccrued interest. Although the level of overall non-per-forming loans was relatively low (12 percent of total at theend of 1996), accrued interests in several banks were high-er than average and growing, suggesting that the true NPLswere actually higher and increasing. The first clear sign oftrouble occurred in March 1997 when the Bank of Thailandand the Ministry of Finance announced that ten, as yetunknown, finance companies would need to raise capital.
In early 1997, more severe liquidity problems emergedas the economy slowed. Public confidence in finance com-panies eroded as solvency problems occurred. In May 1997,the Bank of Thailand suspended 16 insolvent finance com-panies and announced that its creditors are expected tobear part of their losses. During the spring of 1997 thefinance sector began to experience a large-scale depositwithdrawals, which lead to massive and secret liquidity sup-port from the authorities to 66 finance companies. This sup-port peaked in August 1997, reaching altogether about 10billion of U.S. dollars (about 8 percent of 1997 GDP). Thedeposit withdrawal represented a flight to quality by house-holds and businesses moving their savings from financecompanies to large commercial banks.
The banking sector in Thailand also started to showweaknesses. Bank capital was substantially overstated,reflecting reliance on collateral of uncertain value. Anecdo-tal evidence suggest that banking practices focused heavilyon "name" based lending, relying on personal guaranteesand collateral to secure loans. These transactions weremostly valued not by independent appraisers what had itspicture in bank balance sheets and income. Indeed, whilereported NPLs of banks amounted to 11.6 percent ofassets, this figure largely included loans that had been non-performing for one year and over, and did not capture themost recent deterioration in asset quality. Many privatemarket analysts estimated NPLs to be at least 15 percent oftotal banks' loans at that time.
The subsequent deterioration of the corporate balancesheets and adverse effects of the depreciation led to a rapid
CASE Reports No. 39
[4] These numbers exclude debt instruments such as bills of exchange and commercial papers, and are calculated using an end-1997 exchange rateof 1 U.S. dollar = 47 Bahts
Table 3-5. Non-performing loans at domestic commercial banks 1995–99 (percent of total loans)
1995 1996 1997 1998 1999Q2NPLs 8 10 22 48 51
Source: Thailand: Selected Issues. IMF Staff Country Report No. 00/21
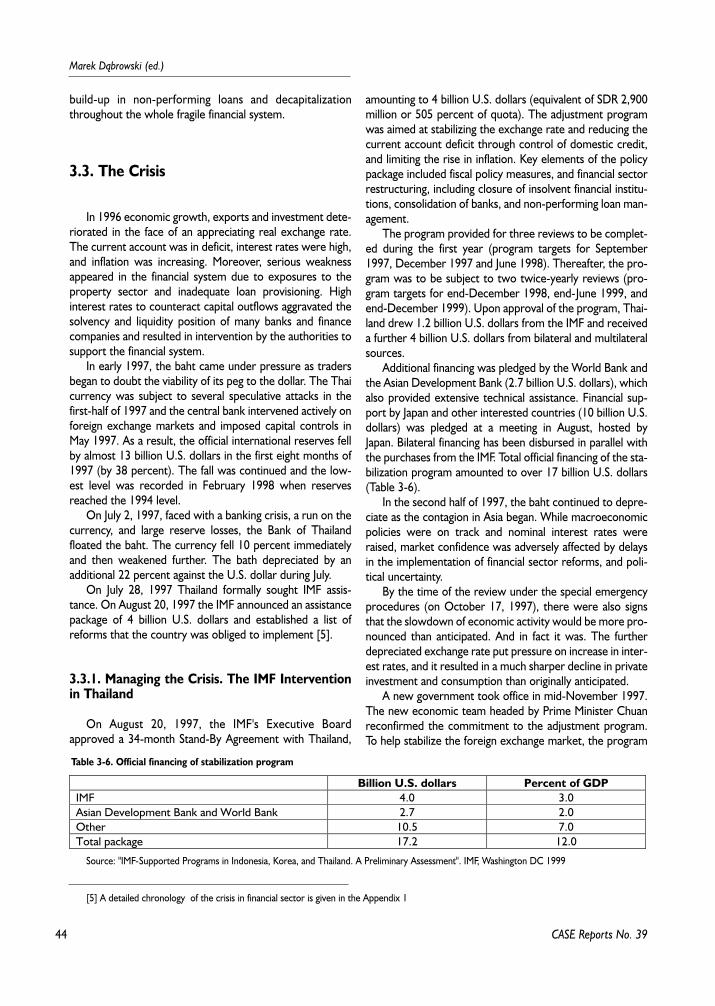
44
Marek D¹browski (ed.)
build-up in non-performing loans and decapitalizationthroughout the whole fragile financial system.
3.3. The Crisis
In 1996 economic growth, exports and investment dete-riorated in the face of an appreciating real exchange rate.The current account was in deficit, interest rates were high,and inflation was increasing. Moreover, serious weaknessappeared in the financial system due to exposures to theproperty sector and inadequate loan provisioning. Highinterest rates to counteract capital outflows aggravated thesolvency and liquidity position of many banks and financecompanies and resulted in intervention by the authorities tosupport the financial system.
In early 1997, the baht came under pressure as tradersbegan to doubt the viability of its peg to the dollar. The Thaicurrency was subject to several speculative attacks in thefirst-half of 1997 and the central bank intervened actively onforeign exchange markets and imposed capital controls inMay 1997. As a result, the official international reserves fellby almost 13 billion U.S. dollars in the first eight months of1997 (by 38 percent). The fall was continued and the low-est level was recorded in February 1998 when reservesreached the 1994 level.
On July 2, 1997, faced with a banking crisis, a run on thecurrency, and large reserve losses, the Bank of Thailandfloated the baht. The currency fell 10 percent immediatelyand then weakened further. The bath depreciated by anadditional 22 percent against the U.S. dollar during July.
On July 28, 1997 Thailand formally sought IMF assis-tance. On August 20, 1997 the IMF announced an assistancepackage of 4 billion U.S. dollars and established a list ofreforms that the country was obliged to implement [5].
3.3.1. Managing the Crisis. The IMF Interventionin Thailand
On August 20, 1997, the IMF's Executive Boardapproved a 34-month Stand-By Agreement with Thailand,
amounting to 4 billion U.S. dollars (equivalent of SDR 2,900million or 505 percent of quota). The adjustment programwas aimed at stabilizing the exchange rate and reducing thecurrent account deficit through control of domestic credit,and limiting the rise in inflation. Key elements of the policypackage included fiscal policy measures, and financial sectorrestructuring, including closure of insolvent financial institu-tions, consolidation of banks, and non-performing loan man-agement.
The program provided for three reviews to be complet-ed during the first year (program targets for September1997, December 1997 and June 1998). Thereafter, the pro-gram was to be subject to two twice-yearly reviews (pro-gram targets for end-December 1998, end-June 1999, andend-December 1999). Upon approval of the program, Thai-land drew 1.2 billion U.S. dollars from the IMF and receiveda further 4 billion U.S. dollars from bilateral and multilateralsources.
Additional financing was pledged by the World Bank andthe Asian Development Bank (2.7 billion U.S. dollars), whichalso provided extensive technical assistance. Financial sup-port by Japan and other interested countries (10 billion U.S.dollars) was pledged at a meeting in August, hosted byJapan. Bilateral financing has been disbursed in parallel withthe purchases from the IMF. Total official financing of the sta-bilization program amounted to over 17 billion U.S. dollars(Table 3-6).
In the second half of 1997, the baht continued to depre-ciate as the contagion in Asia began. While macroeconomicpolicies were on track and nominal interest rates wereraised, market confidence was adversely affected by delaysin the implementation of financial sector reforms, and poli-tical uncertainty.
By the time of the review under the special emergencyprocedures (on October 17, 1997), there were also signsthat the slowdown of economic activity would be more pro-nounced than anticipated. And in fact it was. The furtherdepreciated exchange rate put pressure on increase in inter-est rates, and it resulted in a much sharper decline in privateinvestment and consumption than originally anticipated.
A new government took office in mid-November 1997.The new economic team headed by Prime Minister Chuanreconfirmed the commitment to the adjustment program.To help stabilize the foreign exchange market, the program
CASE Reports No. 39
[5] A detailed chronology of the crisis in financial sector is given in the Appendix 1
Table 3-6. Official financing of stabilization program
Billion U.S. dollars Percent of GDPIMF 4.0 3.0Asian Development Bank and World Bank 2.7 2.0Other 10.5 7.0Total package 17.2 12.0
Source: "IMF-Supported Programs in Indonesia, Korea, and Thailand. A Preliminary Assessment". IMF, Washington DC 1999
45
The Episodes of Currency Crisis in Latin...
was strengthened at the first quarterly review (on Decem-ber 8, 1997). The new government was determined to takea number of additional measures to support the policy pack-age. With weakening economic activity, constraining rev-enues, additional fiscal measures were introduced toachieve the original fiscal target for 1997/98. Reservemoney and net domestic assets of the Bank of Thailandwere to be kept below the original program limits. As aresult, indicative interest rates were raised and a specifictimetable for financial sector restructuring was announced.
In early February 1998, the baht began to strengthenagainst the U.S. dollar as improvements in the policy settingrevived market confidence. Growth projections, however,were marked down further. Contracting domestic demandhelped to keep inflation under control and contributed to alarger-than-expected adjustment in the current account.
The stabilization program was revised significantly at thetime of the second quarterly review (on March 4, 1998).Under the revised program, monetary policy continued tofocus on the exchange rate, with interest rates to be main-tained at high levels until evidence of sustained stabilizationemerged. Fiscal policy shifted to a more accommodatingstance. In addition, the program included measures tostrengthen the social safety net, and broaden the scope ofstructural reforms to strengthen the core banking systemand promote corporate restructuring.
The third quarterly review took place on June 10, 1998and a marked strengthening of the baht during February-May 1998 was noticed (some 35 percent vis-a-vis the U.S.dollar from the low in January). The revised program wason track, but with real GDP projected to decline 4–5 per-cent in 1998 and inflation subdued, further adjustmentswere made to allow for an increase in the fiscal deficit tar-get for 1997/98 from 2 percent to 3 percent of GDP. Mon-etary policy continued to focus on maintaining the stabilityof the baht. While the reductions of interest rates since lateMarch 1998 was viewed as consistent with exchange mar-ket developments, it was understood that interest rateswould be raised again if necessary. Additional measures tostrengthen the social safety net were planned, and the pro-gram for financial sector and corporate restructuring wasfurther specified.
The exchange rate weakened during June-July 1998amid growing concerns about the growth outlook, andrenewed signs of strains in the financial sector, where grow-ing difficulties in the corporate sector complicated restruc-turing of financial institutions. Fiscal and monetary policieshad been tighter than programmed, economic activity wasweaker than expected, and exports had failed to pick up.The large adjustment in the current account (projected toamount to over 10 percent of GDP) reflected a sharp con-traction of imports.
The fourth quarterly review (on September 11, 1998)focused on adapting the policy framework to support the
recovery without sacrificing stabilization gains. With outputnow projected to decline by 6–8 percent in 1998, effortswere stepped up to utilize the scope of fiscal easing provid-ed under the program. Foreign exchange market conditionswere relatively stable (in spite of the Russian crisis), provid-ing room for further lowering of interest rates. The pro-gram for financial and corporate sector restructuring wasbroadened significantly, and the structural reform agenda inother areas (privatization, foreign ownership, and socialsafety net) was strengthened.
As of October 19, 1998, 12.2 billion U.S. dollars fromthe total financing package for Thailand (17.2 billion U.S.dollars) had been disbursed, including 3 billion U.S. dollarsfrom the IMF and 9.2 billion U.S. dollars from other multi-lateral (World Bank and Asian Development Bank) and bilat-eral sources.
During 1999 there were several additional quarterlyreviews of the stabilization program. All of them werefocused on revitalizing of domestic demand and on thesocial safety net. The overall public sector deficit was grad-ually set at the higher level (5 percent of GDP in the fiscalyear 1998/99 and 7 percent in the fiscal year 1999/00.These fiscal targets accommodated reductions in revenues(of about 0.5 percent of GDP in 1998/99 and in 1999/00)from the impact of lower-than-expected nominal GDP. Theflexible use of interest rate policy to maintain baht stabilitywas reaffirmed, monthly interest rates were lowered andinflation was falling. Growing confidence has allowed inter-est rates to fall below pre-crisis levels without compromis-ing exchange rate stability. The overall balance of paymentsoutcome was stronger than expected, as a higher currentaccount surplus, reflecting weak domestic demand, carriedover to higher than projected reserves.
On May 8, 2000 the Executive Board of the IMF com-pleted the ninth, and final review under Thailand's Stand-ByArrangement. To date, under 17.2 billion U.S. dollars officialfinancing package, Thailand has drawn 14.3 billion U.S. dol-lars from bilateral and multilateral contributors, including3.4 billion U.S. dollars from the Fund.
3.3.2. Macroeconomic Environment after the Crisis
The persistence and widening of the current accountdeficit, over-investment, declining rates of return on capital,and the over-expansion of the non-tradable sector pointedon macroeconomic reasons of the crisis and the need fordeep adjustment in exchange rate. In the aftermath of thecrisis, Thailand's real effective exchange rate depreciated by35 percent in the second half of 1997, but subsequentlyrecovered. As of end-1999, the cumulative real exchangerate depreciation was 25 percent. After depreciation Thai-land's external current account balance shifted from a deficit
CASE Reports No. 39
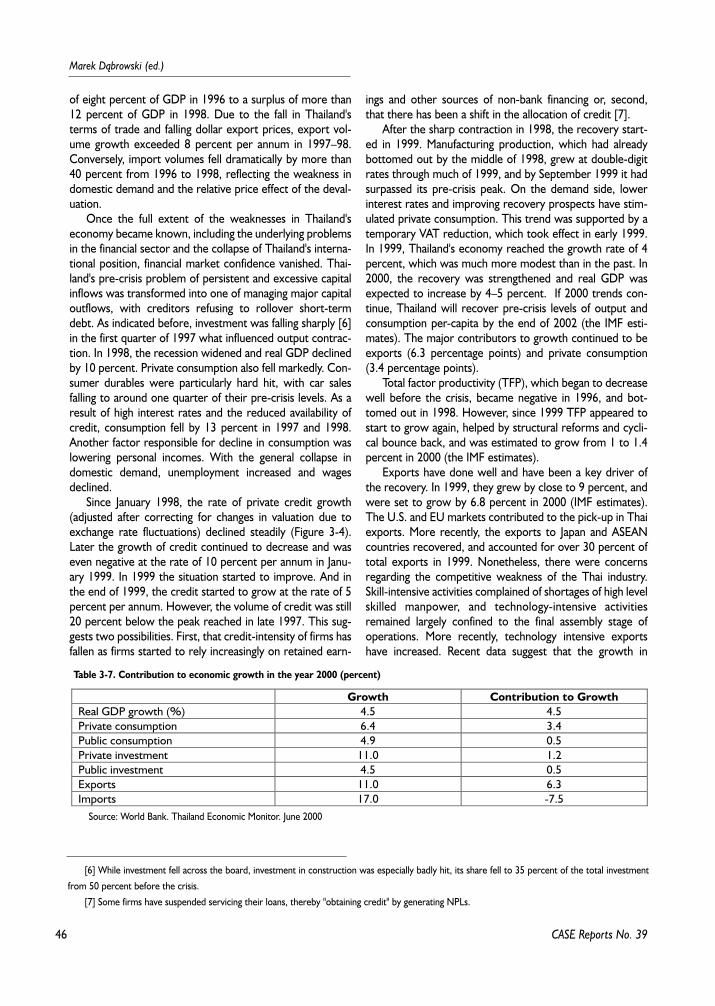
46
Marek D¹browski (ed.)
of eight percent of GDP in 1996 to a surplus of more than12 percent of GDP in 1998. Due to the fall in Thailand'sterms of trade and falling dollar export prices, export vol-ume growth exceeded 8 percent per annum in 1997–98.Conversely, import volumes fell dramatically by more than40 percent from 1996 to 1998, reflecting the weakness indomestic demand and the relative price effect of the deval-uation.
Once the full extent of the weaknesses in Thailand'seconomy became known, including the underlying problemsin the financial sector and the collapse of Thailand's interna-tional position, financial market confidence vanished. Thai-land's pre-crisis problem of persistent and excessive capitalinflows was transformed into one of managing major capitaloutflows, with creditors refusing to rollover short-termdebt. As indicated before, investment was falling sharply [6]in the first quarter of 1997 what influenced output contrac-tion. In 1998, the recession widened and real GDP declinedby 10 percent. Private consumption also fell markedly. Con-sumer durables were particularly hard hit, with car salesfalling to around one quarter of their pre-crisis levels. As aresult of high interest rates and the reduced availability ofcredit, consumption fell by 13 percent in 1997 and 1998.Another factor responsible for decline in consumption waslowering personal incomes. With the general collapse indomestic demand, unemployment increased and wagesdeclined.
Since January 1998, the rate of private credit growth(adjusted after correcting for changes in valuation due toexchange rate fluctuations) declined steadily (Figure 3-4).Later the growth of credit continued to decrease and waseven negative at the rate of 10 percent per annum in Janu-ary 1999. In 1999 the situation started to improve. And inthe end of 1999, the credit started to grow at the rate of 5percent per annum. However, the volume of credit was still20 percent below the peak reached in late 1997. This sug-gests two possibilities. First, that credit-intensity of firms hasfallen as firms started to rely increasingly on retained earn-
ings and other sources of non-bank financing or, second,that there has been a shift in the allocation of credit [7].
After the sharp contraction in 1998, the recovery start-ed in 1999. Manufacturing production, which had alreadybottomed out by the middle of 1998, grew at double-digitrates through much of 1999, and by September 1999 it hadsurpassed its pre-crisis peak. On the demand side, lowerinterest rates and improving recovery prospects have stim-ulated private consumption. This trend was supported by atemporary VAT reduction, which took effect in early 1999.In 1999, Thailand's economy reached the growth rate of 4percent, which was much more modest than in the past. In2000, the recovery was strengthened and real GDP wasexpected to increase by 4–5 percent. If 2000 trends con-tinue, Thailand will recover pre-crisis levels of output andconsumption per-capita by the end of 2002 (the IMF esti-mates). The major contributors to growth continued to beexports (6.3 percentage points) and private consumption(3.4 percentage points).
Total factor productivity (TFP), which began to decreasewell before the crisis, became negative in 1996, and bot-tomed out in 1998. However, since 1999 TFP appeared tostart to grow again, helped by structural reforms and cycli-cal bounce back, and was estimated to grow from 1 to 1.4percent in 2000 (the IMF estimates).
Exports have done well and have been a key driver ofthe recovery. In 1999, they grew by close to 9 percent, andwere set to grow by 6.8 percent in 2000 (IMF estimates).The U.S. and EU markets contributed to the pick-up in Thaiexports. More recently, the exports to Japan and ASEANcountries recovered, and accounted for over 30 percent oftotal exports in 1999. Nonetheless, there were concernsregarding the competitive weakness of the Thai industry.Skill-intensive activities complained of shortages of high levelskilled manpower, and technology-intensive activitiesremained largely confined to the final assembly stage ofoperations. More recently, technology intensive exportshave increased. Recent data suggest that the growth in
CASE Reports No. 39
[6] While investment fell across the board, investment in construction was especially badly hit, its share fell to 35 percent of the total investmentfrom 50 percent before the crisis.
[7] Some firms have suspended servicing their loans, thereby "obtaining credit" by generating NPLs.
Table 3-7. Contribution to economic growth in the year 2000 (percent)
Growth Contribution to GrowthReal GDP growth (%) 4.5 4.5Private consumption 6.4 3.4Public consumption 4.9 0.5Private investment 11.0 1.2Public investment 4.5 0.5Exports 11.0 6.3Imports 17.0 -7.5
Source: World Bank. Thailand Economic Monitor. June 2000
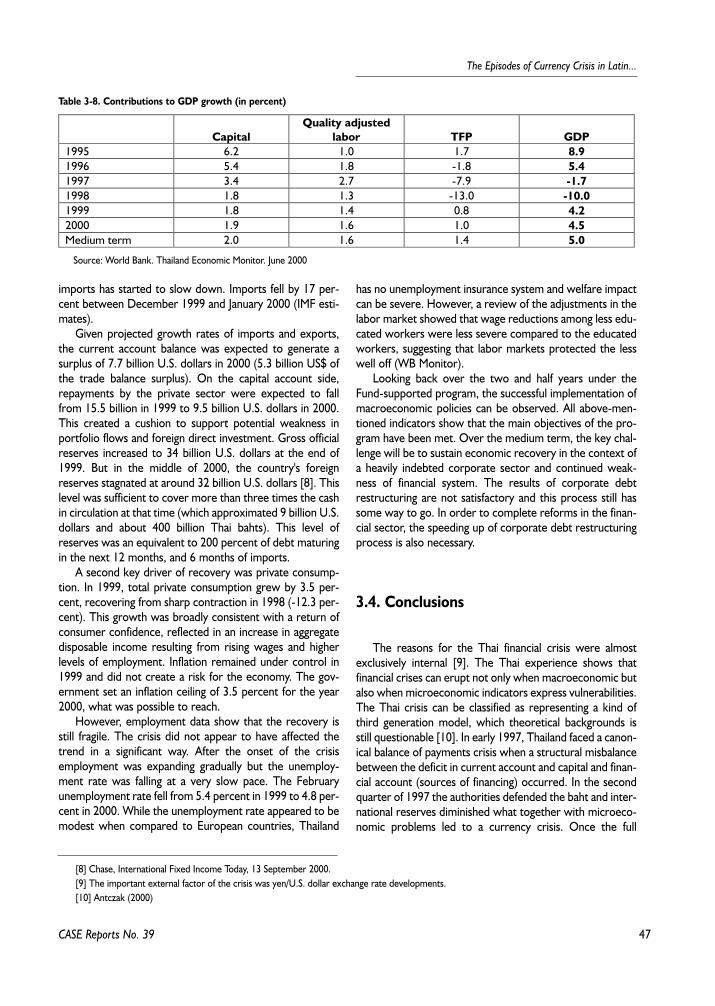
47
The Episodes of Currency Crisis in Latin...
imports has started to slow down. Imports fell by 17 per-cent between December 1999 and January 2000 (IMF esti-mates).
Given projected growth rates of imports and exports,the current account balance was expected to generate asurplus of 7.7 billion U.S. dollars in 2000 (5.3 billion US$ ofthe trade balance surplus). On the capital account side,repayments by the private sector were expected to fallfrom 15.5 billion in 1999 to 9.5 billion U.S. dollars in 2000.This created a cushion to support potential weakness inportfolio flows and foreign direct investment. Gross officialreserves increased to 34 billion U.S. dollars at the end of1999. But in the middle of 2000, the country's foreignreserves stagnated at around 32 billion U.S. dollars [8]. Thislevel was sufficient to cover more than three times the cashin circulation at that time (which approximated 9 billion U.S.dollars and about 400 billion Thai bahts). This level ofreserves was an equivalent to 200 percent of debt maturingin the next 12 months, and 6 months of imports.
A second key driver of recovery was private consump-tion. In 1999, total private consumption grew by 3.5 per-cent, recovering from sharp contraction in 1998 (-12.3 per-cent). This growth was broadly consistent with a return ofconsumer confidence, reflected in an increase in aggregatedisposable income resulting from rising wages and higherlevels of employment. Inflation remained under control in1999 and did not create a risk for the economy. The gov-ernment set an inflation ceiling of 3.5 percent for the year2000, what was possible to reach.
However, employment data show that the recovery isstill fragile. The crisis did not appear to have affected thetrend in a significant way. After the onset of the crisisemployment was expanding gradually but the unemploy-ment rate was falling at a very slow pace. The Februaryunemployment rate fell from 5.4 percent in 1999 to 4.8 per-cent in 2000. While the unemployment rate appeared to bemodest when compared to European countries, Thailand
has no unemployment insurance system and welfare impactcan be severe. However, a review of the adjustments in thelabor market showed that wage reductions among less edu-cated workers were less severe compared to the educatedworkers, suggesting that labor markets protected the lesswell off (WB Monitor).
Looking back over the two and half years under theFund-supported program, the successful implementation ofmacroeconomic policies can be observed. All above-men-tioned indicators show that the main objectives of the pro-gram have been met. Over the medium term, the key chal-lenge will be to sustain economic recovery in the context ofa heavily indebted corporate sector and continued weak-ness of financial system. The results of corporate debtrestructuring are not satisfactory and this process still hassome way to go. In order to complete reforms in the finan-cial sector, the speeding up of corporate debt restructuringprocess is also necessary.
3.4. Conclusions
The reasons for the Thai financial crisis were almostexclusively internal [9]. The Thai experience shows thatfinancial crises can erupt not only when macroeconomic butalso when microeconomic indicators express vulnerabilities.The Thai crisis can be classified as representing a kind ofthird generation model, which theoretical backgrounds isstill questionable [10]. In early 1997, Thailand faced a canon-ical balance of payments crisis when a structural misbalancebetween the deficit in current account and capital and finan-cial account (sources of financing) occurred. In the secondquarter of 1997 the authorities defended the baht and inter-national reserves diminished what together with microeco-nomic problems led to a currency crisis. Once the full
CASE Reports No. 39
Table 3-8. Contributions to GDP growth (in percent)
CapitalQuality adjusted
labor TFP GDP1995 6.2 1.0 1.7 8.91996 5.4 1.8 -1.8 5.41997 3.4 2.7 -7.9 -1.71998 1.8 1.3 -13.0 -10.01999 1.8 1.4 0.8 4.22000 1.9 1.6 1.0 4.5Medium term 2.0 1.6 1.4 5.0
Source: World Bank. Thailand Economic Monitor. June 2000
[8] Chase, International Fixed Income Today, 13 September 2000.[9] The important external factor of the crisis was yen/U.S. dollar exchange rate developments.[10] Antczak (2000)
48
Marek D¹browski (ed.)
extend of the weakness in Thailand economy becameknown, including underlying problems in the financial sector,excessive capital account liberalization led to massive with-drawal and to full-fledged financial crisis.
The Thai crisis led to a contagion effect in Asia. Thesedevelopments changed investors' perception of the AsianTigers of early 1990s. It contributed to external shocks andthe Asian flu infected Korea, Philippines, Malaysia, andIndonesia. The second broad conclusion from this analysis isa fundamental need for an integrated approach to capital lib-eralization and financial sector reform.
The Thai stabilization program was successful and theeconomy recovered. The authorities have made progresstoward resolving the problems in the financial sector. Bankshave raised substantial amounts of new capital, the corebanking system remained in private hands, and foreign entryshould stimulate competition and improvements in thetechnology and service. But despite the positive changesthere is still a lot to be done, especially in the area of struc-tural reforms.
CASE Reports No. 39
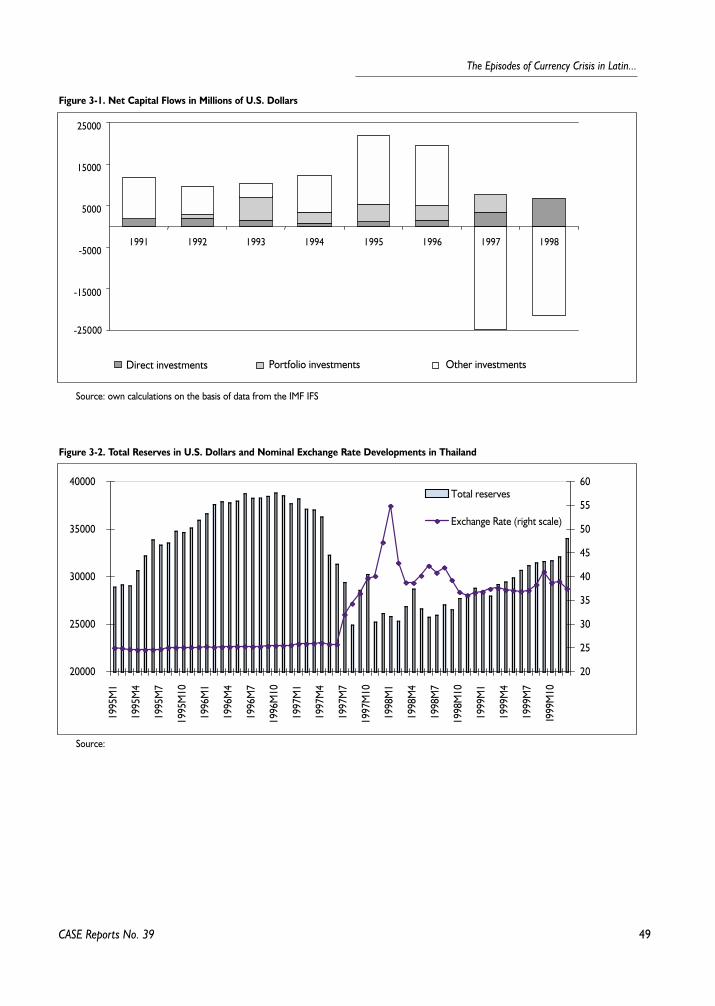
49
The Episodes of Currency Crisis in Latin...
CASE Reports No. 39
Figure 3-1. Net Capital Flows in Millions of U.S. Dollars
-25000
-15000
-5000
5000
15000
25000
1991 1992 1993 1994 1995 1996 1997 1998
Direct investments Portfolio investments Other investments
Source: own calculations on the basis of data from the IMF IFS
Figure 3-2. Total Reserves in U.S. Dollars and Nominal Exchange Rate Developments in Thailand
20000
25000
30000
35000
40000
1995
M1
1995
M4
1995
M7
1995
M10
1996
M1
1996
M4
1996
M7
1996
M10
1997
M1
1997
M4
1997
M7
1997
M10
1998
M1
1998
M4
1998
M7
1998
M10
1999
M1
1999
M4
1999
M7
1999
M10
20
25
30
35
40
45
50
55
60Total reserves
Exchange Rate (right scale)
Source:
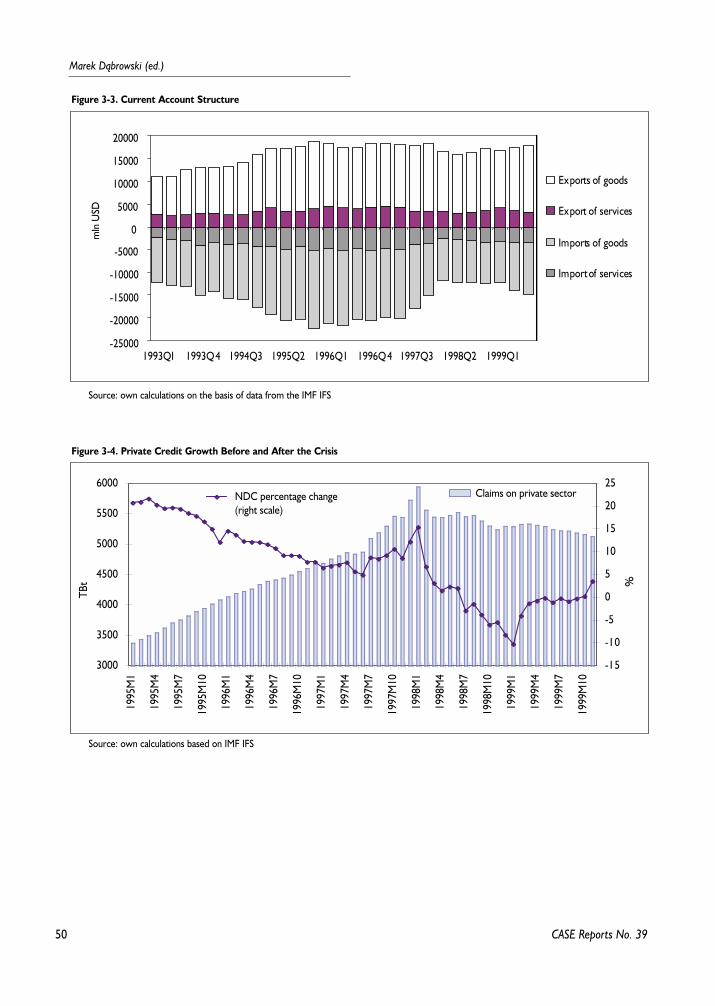
50
Marek D¹browski (ed.)
CASE Reports No. 39
Figure 3-3. Current Account Structure
-25000
-20000
-15000
-10000
-5000
0
5000
10000
15000
20000
1993Q1 1993Q4 1994Q3 1995Q2 1996Q1 1996Q4 1997Q3 1998Q2 1999Q1
Exports of goods
Export of services
Imports of goods
Import of services
mln
USD
Source: own calculations on the basis of data from the IMF IFS
Figure 3-4. Private Credit Growth Before and After the Crisis
3000
3500
4000
4500
5000
5500
6000
1995
M1
1995
M4
1995
M7
1995
M10
1996
M1
1996
M4
1996
M7
1996
M10
1997
M1
1997
M4
1997
M7
1997
M10
1998
M1
1998
M4
1998
M7
1998
M10
1999
M1
1999
M4
1999
M7
1999
M10
TBt
-15
-10
-5
0
5
10
15
20
25
%
Claims on private sectorNDC percentage change
(right scale)
Source: own calculations based on IMF IFS
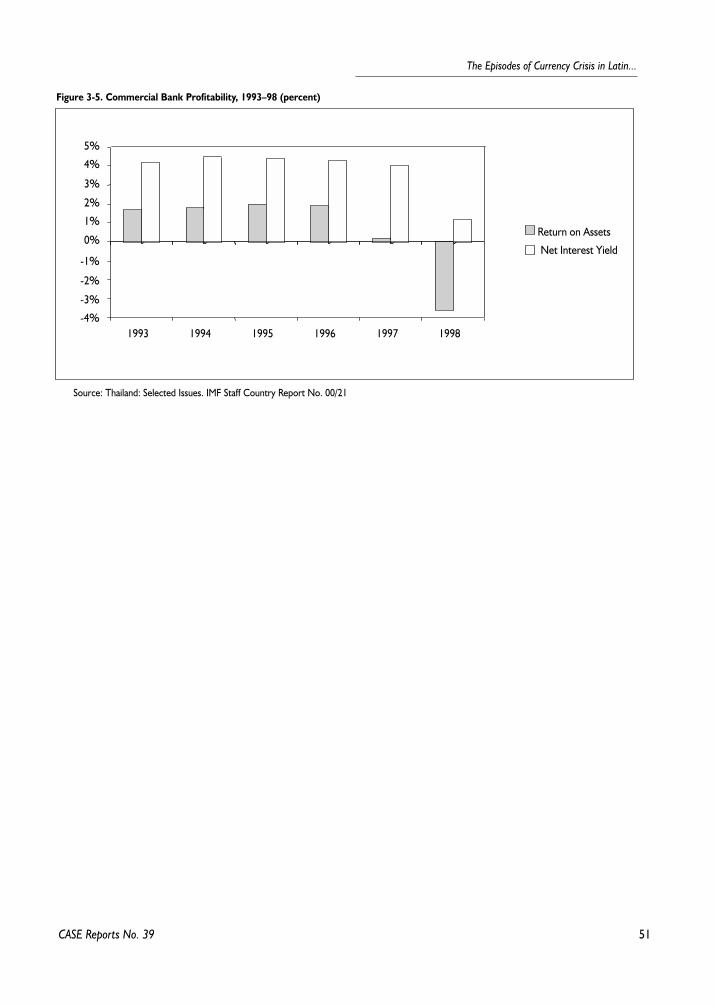
51
The Episodes of Currency Crisis in Latin...
CASE Reports No. 39
Figure 3-5. Commercial Bank Profitability, 1993–98 (percent)
1993 1994 1995 1996 1997 1998
Return on Assets
Net Interest Yield0%
1%
2%
3%
4%
5%
-4%
-3%
-2%
-1%
Source: Thailand: Selected Issues. IMF Staff Country Report No. 00/21
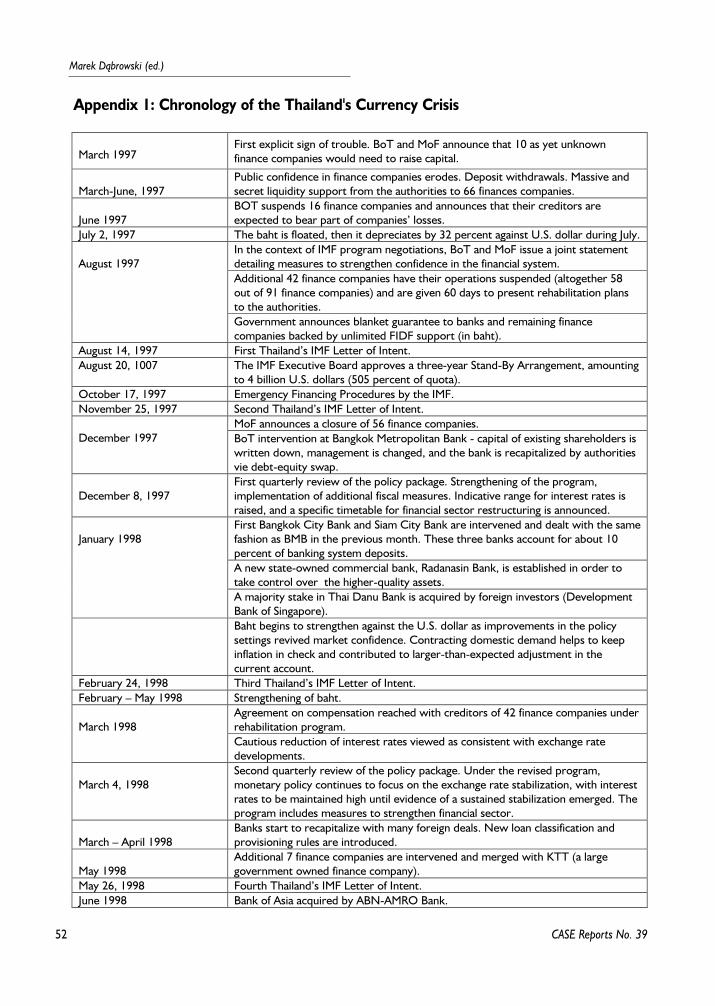
52
Marek D¹browski (ed.)
CASE Reports No. 39
Appendix 1: Chronology of the Thailand's Currency Crisis
March 1997First explicit sign of trouble. BoT and MoF announce that 10 as yet unknownfinance companies would need to raise capital.
March-June, 1997Public confidence in finance companies erodes. Deposit withdrawals. Massive andsecret liquidity support from the authorities to 66 finances companies.
June 1997BOT suspends 16 finance companies and announces that their creditors areexpected to bear part of companies’ losses.
July 2, 1997 The baht is floated, then it depreciates by 32 percent against U.S. dollar during July.In the context of IMF program negotiations, BoT and MoF issue a joint statementdetailing measures to strengthen confidence in the financial system.Additional 42 finance companies have their operations suspended (altogether 58out of 91 finance companies) and are given 60 days to present rehabilitation plansto the authorities.
August 1997
Government announces blanket guarantee to banks and remaining financecompanies backed by unlimited FIDF support (in baht).
August 14, 1997 First Thailand’s IMF Letter of Intent.August 20, 1007 The IMF Executive Board approves a three-year Stand-By Arrangement, amounting
to 4 billion U.S. dollars (505 percent of quota).October 17, 1997 Emergency Financing Procedures by the IMF.November 25, 1997 Second Thailand’s IMF Letter of Intent.
MoF announces a closure of 56 finance companies.December 1997 BoT intervention at Bangkok Metropolitan Bank - capital of existing shareholders is
written down, management is changed, and the bank is recapitalized by authoritiesvie debt-equity swap.
December 8, 1997First quarterly review of the policy package. Strengthening of the program,implementation of additional fiscal measures. Indicative range for interest rates israised, and a specific timetable for financial sector restructuring is announced.First Bangkok City Bank and Siam City Bank are intervened and dealt with the samefashion as BMB in the previous month. These three banks account for about 10percent of banking system deposits.A new state-owned commercial bank, Radanasin Bank, is established in order totake control over the higher-quality assets.
January 1998
A majority stake in Thai Danu Bank is acquired by foreign investors (DevelopmentBank of Singapore).Baht begins to strengthen against the U.S. dollar as improvements in the policysettings revived market confidence. Contracting domestic demand helps to keepinflation in check and contributed to larger-than-expected adjustment in thecurrent account.
February 24, 1998 Third Thailand’s IMF Letter of Intent.February – May 1998 Strengthening of baht.
Agreement on compensation reached with creditors of 42 finance companies underrehabilitation program.March 1998Cautious reduction of interest rates viewed as consistent with exchange ratedevelopments.
March 4, 1998Second quarterly review of the policy package. Under the revised program,monetary policy continues to focus on the exchange rate stabilization, with interestrates to be maintained high until evidence of a sustained stabilization emerged. Theprogram includes measures to strengthen financial sector.
March – April 1998Banks start to recapitalize with many foreign deals. New loan classification andprovisioning rules are introduced.
May 1998Additional 7 finance companies are intervened and merged with KTT (a largegovernment owned finance company).
May 26, 1998 Fourth Thailand’s IMF Letter of Intent.June 1998 Bank of Asia acquired by ABN-AMRO Bank.
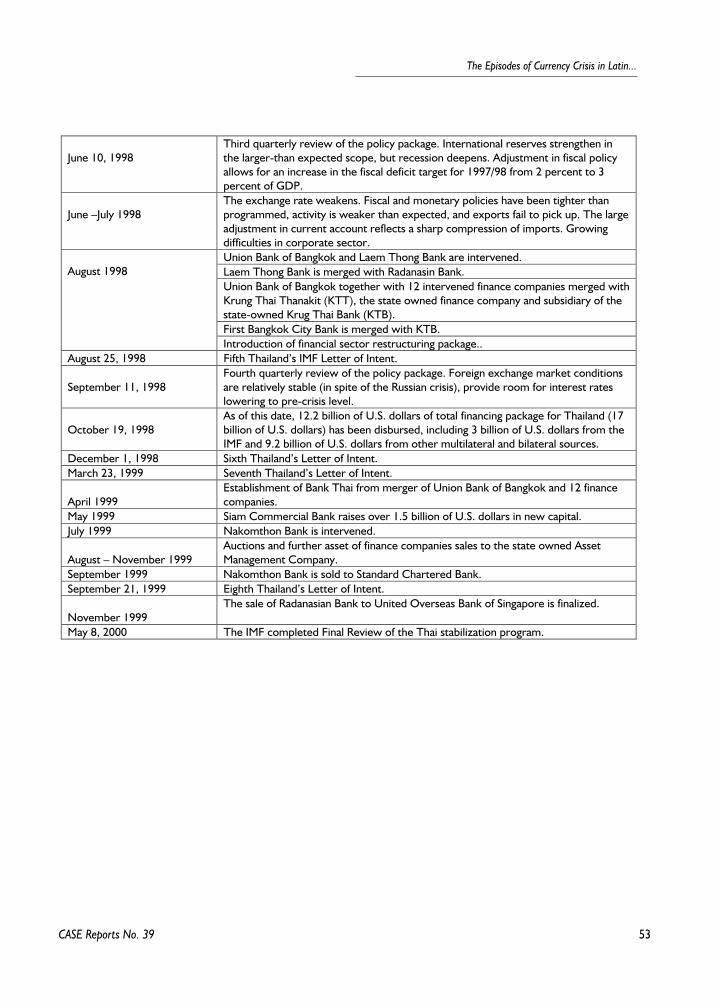
53
The Episodes of Currency Crisis in Latin...
CASE Reports No. 39
June 10, 1998Third quarterly review of the policy package. International reserves strengthen inthe larger-than expected scope, but recession deepens. Adjustment in fiscal policyallows for an increase in the fiscal deficit target for 1997/98 from 2 percent to 3percent of GDP.
June –July 1998The exchange rate weakens. Fiscal and monetary policies have been tighter thanprogrammed, activity is weaker than expected, and exports fail to pick up. The largeadjustment in current account reflects a sharp compression of imports. Growingdifficulties in corporate sector.Union Bank of Bangkok and Laem Thong Bank are intervened.Laem Thong Bank is merged with Radanasin Bank.Union Bank of Bangkok together with 12 intervened finance companies merged withKrung Thai Thanakit (KTT), the state owned finance company and subsidiary of thestate-owned Krug Thai Bank (KTB).First Bangkok City Bank is merged with KTB.
August 1998
Introduction of financial sector restructuring package..August 25, 1998 Fifth Thailand’s IMF Letter of Intent.
September 11, 1998Fourth quarterly review of the policy package. Foreign exchange market conditionsare relatively stable (in spite of the Russian crisis), provide room for interest rateslowering to pre-crisis level.
October 19, 1998As of this date, 12.2 billion of U.S. dollars of total financing package for Thailand (17billion of U.S. dollars) has been disbursed, including 3 billion of U.S. dollars from theIMF and 9.2 billion of U.S. dollars from other multilateral and bilateral sources.
December 1, 1998 Sixth Thailand’s Letter of Intent.March 23, 1999 Seventh Thailand’s Letter of Intent.
April 1999Establishment of Bank Thai from merger of Union Bank of Bangkok and 12 financecompanies.
May 1999 Siam Commercial Bank raises over 1.5 billion of U.S. dollars in new capital.July 1999 Nakomthon Bank is intervened.
August – November 1999Auctions and further asset of finance companies sales to the state owned AssetManagement Company.
September 1999 Nakomthon Bank is sold to Standard Chartered Bank.September 21, 1999 Eighth Thailand’s Letter of Intent.
November 1999The sale of Radanasian Bank to United Overseas Bank of Singapore is finalized.
May 8, 2000 The IMF completed Final Review of the Thai stabilization program.
54
Marek D¹browski (ed.)
References
Antczak R. (2000). "Theoretical Aspects of Currencycrises", Studies and Analyses, No. 211, CASE Warsaw.
Blaszkiewicz M. (2000). "What Factors Led to the AsianFinancial Crisis: Were or Were not Asian Economics Sound",Studies and Analyses, No. 209, CASE Warsaw.
Chau-Lau J.A., Z. Chen (1998). "Financial Crisis andCredit Crunch as a Result of Inefficient Financial Intermedi-ation – with Reference to an Asian Financial Crisis". IMFWorking Paper, 98/127, (Washington: International Mone-tary Fund).
Chang R., A. Velasco (1998, "Financial Crisis in EmergingMarkets: A Canonical Model", Working Paper 98-10,Reserve Bank of Atlanta.
Demirguc-Kunt A., E. Detragiache, P. Gupta. "Inside theCrisis: An Empirical Analysis of Banking Systems in Distress".IMF Working Paper 00/156, Washington D.C.
Fisher Jr. R., R.P. O'Quinn (1998). "The United States andThailand: Helping a Friend in Need". The Heritage Founda-tion Backgrounder, March, Washington, D.C.
Jakubiak M. (2000). "Indicators of a Currency Crises:Empirical Analysis of Some Emerging and TransitionalEconomies", Studies and Analyses, No. 218, CASE, Warsaw.
Johnson B.R., S.M. Darbar, C. Echeverria (1997)."Sequencing Capital Account Liberalization: Lessons fromthe Experiences in Chile, Indonesia, Korea, and Thailand".IMF Working Paper, 97/197, (Washington: InternationalMonetary Fund).
Krugman P. (1998). "What Happened to Asia?". (January),http://web.mit.edu/krugman/www/disinter.html
Marshall D. (1998). "Understanding the Asian Crisis: Sys-temic Risk as Coordination Failure". Economic Perspectives,3rd Quarter, Federal Reserve Bank of Chicago, p. 13–28.
Nogayasu J. (2000). "Currency Crisis and Contagion: Evi-dence from Exchange Rates and Sectoral Stock Indices ofthe Philippines and Thailand". IMF Working Paper, 00/39,(Washington: International Monetary Fund), June.
O'Driscoll Jr. G.P. (1999). "IMF Policies in Asia; a CriticalAssessment". The Heritage Foundation Backgrounder,March 1999, Washington, D.C.
Stone M.R. (1998). ”Corporate Debt Restructuring inEast Asia. Some Lessons from International Experience”.IMF Paper for Analyses and Assessment, PPAA/98/13, Octo-ber, Washington, D.C.
"Thailand Economic Monitor", June 2000, The WorldBank, http://www.worldbank.or.th/monitor.
Thailand Selected Issues, IMF Staff Country Report No.00/21, (Washington: International Monetary Fund).
Thailand Letters of Intent and Memorandums of Eco-nomic Policies of: August 14, 1997, November 25, 1997,February 24, 1998, May 26, 1998, August 25, 1998,
December 1, 1998, March 23, 1999, September 21, 1999,http://www.imf.org/external/np/loi
CASE Reports No. 39
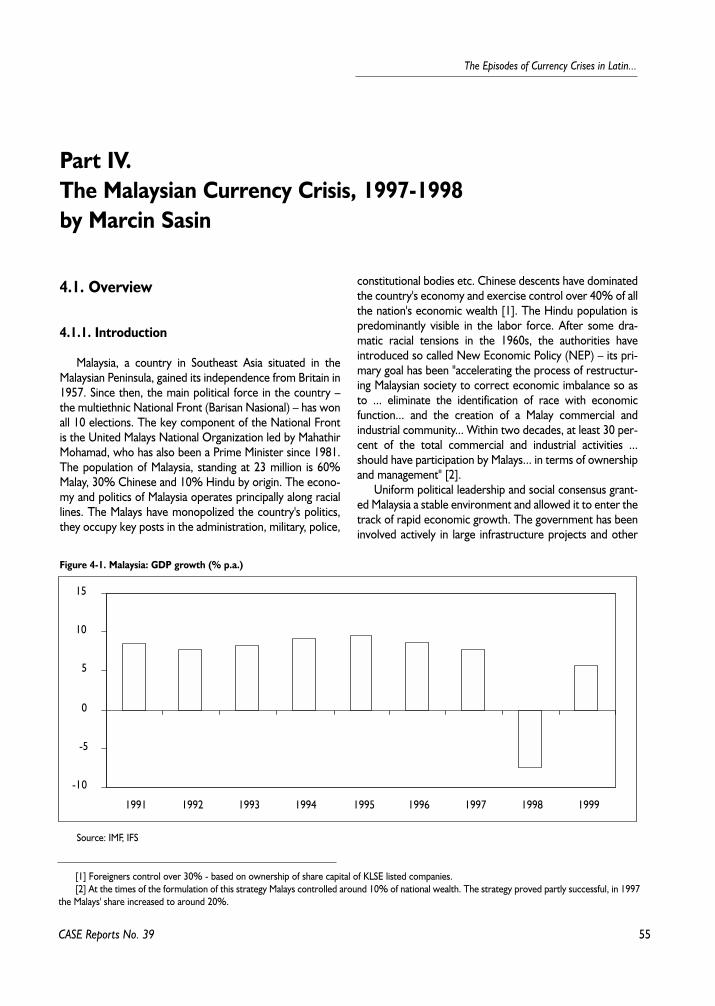
55
The Episodes of Currency Crises in Latin...
CASE Reports No. 39
4.1. Overview
4.1.1. Introduction
Malaysia, a country in Southeast Asia situated in theMalaysian Peninsula, gained its independence from Britain in1957. Since then, the main political force in the country –the multiethnic National Front (Barisan Nasional) – has wonall 10 elections. The key component of the National Frontis the United Malays National Organization led by MahathirMohamad, who has also been a Prime Minister since 1981.The population of Malaysia, standing at 23 million is 60%Malay, 30% Chinese and 10% Hindu by origin. The econo-my and politics of Malaysia operates principally along raciallines. The Malays have monopolized the country's politics,they occupy key posts in the administration, military, police,
constitutional bodies etc. Chinese descents have dominatedthe country's economy and exercise control over 40% of allthe nation's economic wealth [1]. The Hindu population ispredominantly visible in the labor force. After some dra-matic racial tensions in the 1960s, the authorities haveintroduced so called New Economic Policy (NEP) – its pri-mary goal has been "accelerating the process of restructur-ing Malaysian society to correct economic imbalance so asto ... eliminate the identification of race with economicfunction... and the creation of a Malay commercial andindustrial community... Within two decades, at least 30 per-cent of the total commercial and industrial activities ...should have participation by Malays... in terms of ownershipand management" [2].
Uniform political leadership and social consensus grant-ed Malaysia a stable environment and allowed it to enter thetrack of rapid economic growth. The government has beeninvolved actively in large infrastructure projects and other
Part IV.The Malaysian Currency Crisis, 1997-1998by Marcin Sasin
Figure 4-1. Malaysia: GDP growth (% p.a.)
-10
-5
0
5
10
15
1991 1992 1993 1994 1995 1996 1997 1998 1999
Source: IMF, IFS
[1] Foreigners control over 30% - based on ownership of share capital of KLSE listed companies.[2] At the times of the formulation of this strategy Malays controlled around 10% of national wealth. The strategy proved partly successful, in 1997
the Malays' share increased to around 20%.
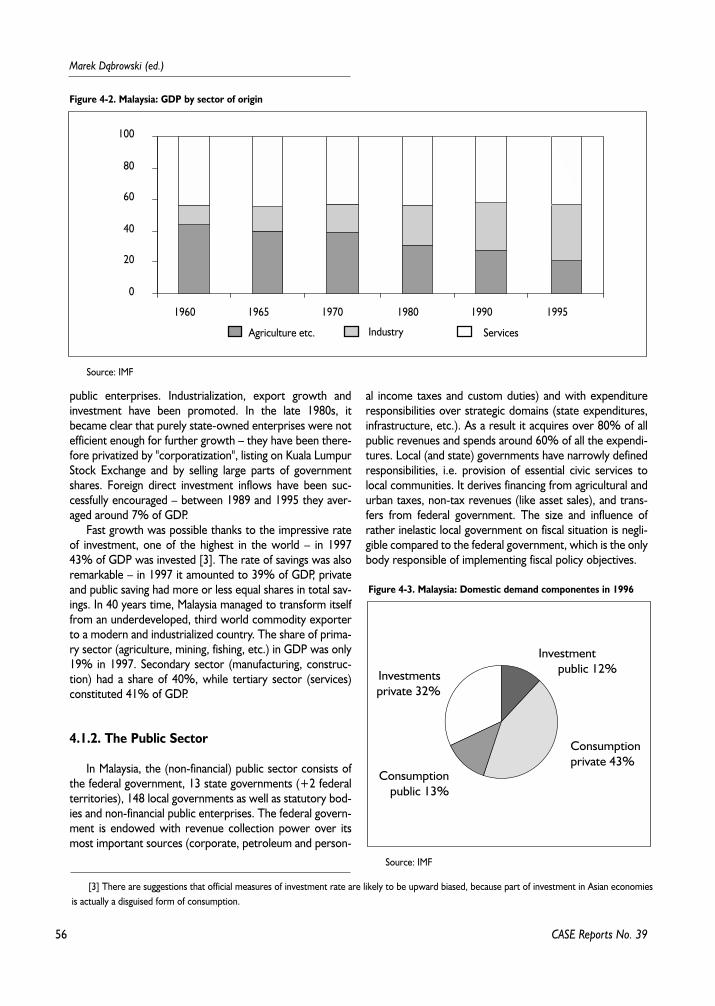
56
Marek D¹browski (ed.)
CASE Reports No. 39
public enterprises. Industrialization, export growth andinvestment have been promoted. In the late 1980s, itbecame clear that purely state-owned enterprises were notefficient enough for further growth – they have been there-fore privatized by "corporatization", listing on Kuala LumpurStock Exchange and by selling large parts of governmentshares. Foreign direct investment inflows have been suc-cessfully encouraged – between 1989 and 1995 they aver-aged around 7% of GDP.
Fast growth was possible thanks to the impressive rateof investment, one of the highest in the world – in 199743% of GDP was invested [3]. The rate of savings was alsoremarkable – in 1997 it amounted to 39% of GDP, privateand public saving had more or less equal shares in total sav-ings. In 40 years time, Malaysia managed to transform itselffrom an underdeveloped, third world commodity exporterto a modern and industrialized country. The share of prima-ry sector (agriculture, mining, fishing, etc.) in GDP was only19% in 1997. Secondary sector (manufacturing, construc-tion) had a share of 40%, while tertiary sector (services)constituted 41% of GDP.
4.1.2. The Public Sector
In Malaysia, the (non-financial) public sector consists ofthe federal government, 13 state governments (+2 federalterritories), 148 local governments as well as statutory bod-ies and non-financial public enterprises. The federal govern-ment is endowed with revenue collection power over itsmost important sources (corporate, petroleum and person-
al income taxes and custom duties) and with expenditureresponsibilities over strategic domains (state expenditures,infrastructure, etc.). As a result it acquires over 80% of allpublic revenues and spends around 60% of all the expendi-tures. Local (and state) governments have narrowly definedresponsibilities, i.e. provision of essential civic services tolocal communities. It derives financing from agricultural andurban taxes, non-tax revenues (like asset sales), and trans-fers from federal government. The size and influence ofrather inelastic local government on fiscal situation is negli-gible compared to the federal government, which is the onlybody responsible of implementing fiscal policy objectives.
Figure 4-2. Malaysia: GDP by sector of origin
0
20
40
60
80
100
1960 1965 1970 1980 1990 1995
Agriculture etc. Industry Services
Source: IMF
[3] There are suggestions that official measures of investment rate are likely to be upward biased, because part of investment in Asian economiesis actually a disguised form of consumption.
Figure 4-3. Malaysia: Domestic demand componentes in 1996
Investment public 12%
Consumptionprivate 43%
Investmentsprivate 32%
Consumptionpublic 13%
Source: IMF
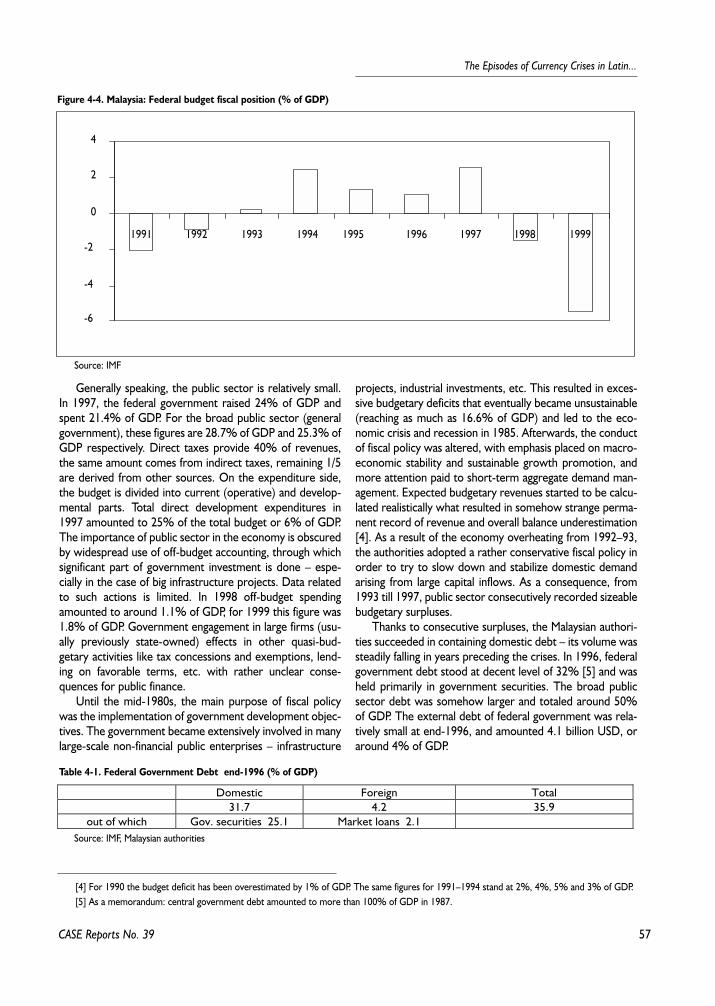
57
The Episodes of Currency Crises in Latin...
CASE Reports No. 39
Generally speaking, the public sector is relatively small.In 1997, the federal government raised 24% of GDP andspent 21.4% of GDP. For the broad public sector (generalgovernment), these figures are 28.7% of GDP and 25.3% ofGDP respectively. Direct taxes provide 40% of revenues,the same amount comes from indirect taxes, remaining 1/5are derived from other sources. On the expenditure side,the budget is divided into current (operative) and develop-mental parts. Total direct development expenditures in1997 amounted to 25% of the total budget or 6% of GDP.The importance of public sector in the economy is obscuredby widespread use of off-budget accounting, through whichsignificant part of government investment is done – espe-cially in the case of big infrastructure projects. Data relatedto such actions is limited. In 1998 off-budget spendingamounted to around 1.1% of GDP, for 1999 this figure was1.8% of GDP. Government engagement in large firms (usu-ally previously state-owned) effects in other quasi-bud-getary activities like tax concessions and exemptions, lend-ing on favorable terms, etc. with rather unclear conse-quences for public finance.
Until the mid-1980s, the main purpose of fiscal policywas the implementation of government development objec-tives. The government became extensively involved in manylarge-scale non-financial public enterprises – infrastructure
projects, industrial investments, etc. This resulted in exces-sive budgetary deficits that eventually became unsustainable(reaching as much as 16.6% of GDP) and led to the eco-nomic crisis and recession in 1985. Afterwards, the conductof fiscal policy was altered, with emphasis placed on macro-economic stability and sustainable growth promotion, andmore attention paid to short-term aggregate demand man-agement. Expected budgetary revenues started to be calcu-lated realistically what resulted in somehow strange perma-nent record of revenue and overall balance underestimation[4]. As a result of the economy overheating from 1992–93,the authorities adopted a rather conservative fiscal policy inorder to try to slow down and stabilize domestic demandarising from large capital inflows. As a consequence, from1993 till 1997, public sector consecutively recorded sizeablebudgetary surpluses.
Thanks to consecutive surpluses, the Malaysian authori-ties succeeded in containing domestic debt – its volume wassteadily falling in years preceding the crises. In 1996, federalgovernment debt stood at decent level of 32% [5] and washeld primarily in government securities. The broad publicsector debt was somehow larger and totaled around 50%of GDP. The external debt of federal government was rela-tively small at end-1996, and amounted 4.1 billion USD, oraround 4% of GDP.
Figure 4-4. Malaysia: Federal budget fiscal position (% of GDP)
-6
-4
-2
0
2
4
1991 1992 1993 1994 1995 1996 1997 1998 1999
Source: IMF
Table 4-1. Federal Government Debt end-1996 (% of GDP)
Domestic Foreign Total31.7 4.2 35.9
out of which Gov. securities 25.1 Market loans 2.1Source: IMF, Malaysian authorities
[4] For 1990 the budget deficit has been overestimated by 1% of GDP. The same figures for 1991–1994 stand at 2%, 4%, 5% and 3% of GDP.[5] As a memorandum: central government debt amounted to more than 100% of GDP in 1987.
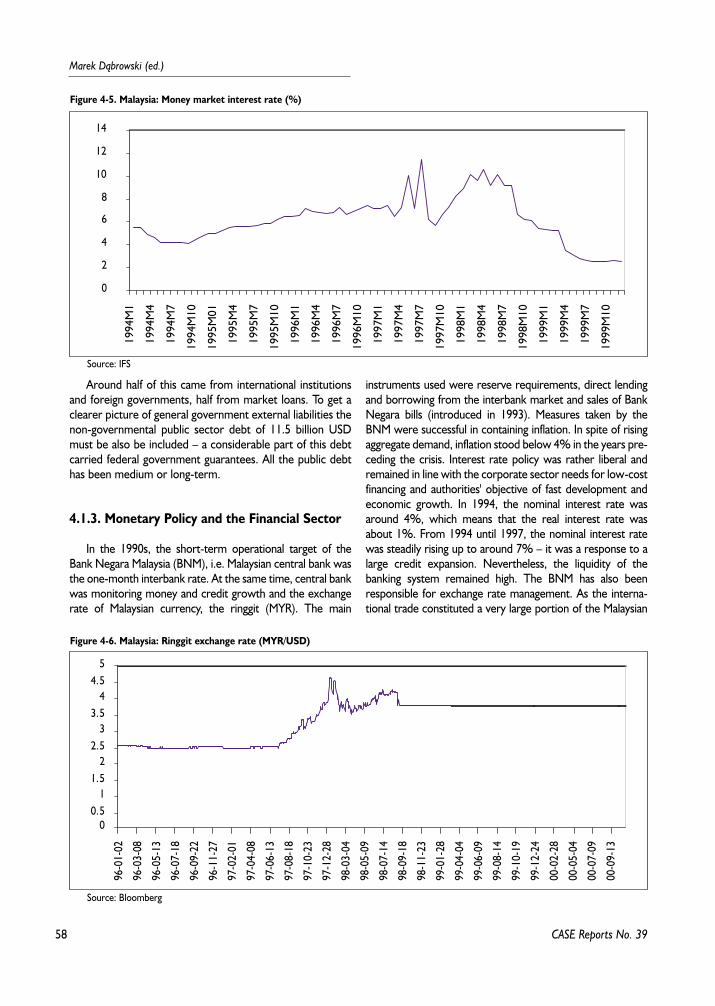
58
Marek D¹browski (ed.)
CASE Reports No. 39
Around half of this came from international institutionsand foreign governments, half from market loans. To get aclearer picture of general government external liabilities thenon-governmental public sector debt of 11.5 billion USDmust be also be included – a considerable part of this debtcarried federal government guarantees. All the public debthas been medium or long-term.
4.1.3. Monetary Policy and the Financial Sector
In the 1990s, the short-term operational target of theBank Negara Malaysia (BNM), i.e. Malaysian central bank wasthe one-month interbank rate. At the same time, central bankwas monitoring money and credit growth and the exchangerate of Malaysian currency, the ringgit (MYR). The main
instruments used were reserve requirements, direct lendingand borrowing from the interbank market and sales of BankNegara bills (introduced in 1993). Measures taken by theBNM were successful in containing inflation. In spite of risingaggregate demand, inflation stood below 4% in the years pre-ceding the crisis. Interest rate policy was rather liberal andremained in line with the corporate sector needs for low-costfinancing and authorities' objective of fast development andeconomic growth. In 1994, the nominal interest rate wasaround 4%, which means that the real interest rate wasabout 1%. From 1994 until 1997, the nominal interest ratewas steadily rising up to around 7% – it was a response to alarge credit expansion. Nevertheless, the liquidity of thebanking system remained high. The BNM has also beenresponsible for exchange rate management. As the interna-tional trade constituted a very large portion of the Malaysian
Figure 4-5. Malaysia: Money market interest rate (%)
0
2
4
6
8
10
12
1419
94M
1
1994
M4
1994
M7
1994
M10
1995
M01
1995
M4
1995
M7
1995
M10
1996
M1
1996
M4
1996
M7
1996
M10
1997
M1
1997
M4
1997
M7
1997
M10
1998
M1
1998
M4
1998
M7
1998
M10
1999
M1
1999
M4
1999
M7
1999
M10
Source: IFS
Figure 4-6. Malaysia: Ringgit exchange rate (MYR/USD)
00.5
11.5
22.5
33.5
44.5
5
96-0
1-02
96-0
3-08
96-0
5-13
96-0
7-18
96-0
9-22
96-1
1-27
97-0
2-01
97-0
4-08
97-0
6-13
97-0
8-18
97-1
0-23
97-1
2-28
98-0
3-04
98-0
5-09
98-0
7-14
98-0
9-18
98-1
1-23
99-0
1-28
99-0
4-04
99-0
6-09
99-0
8-14
99-1
0-19
99-1
2-24
00-0
2-28
00-0
5-04
00-0
7-09
00-0
9-13
Source: Bloomberg
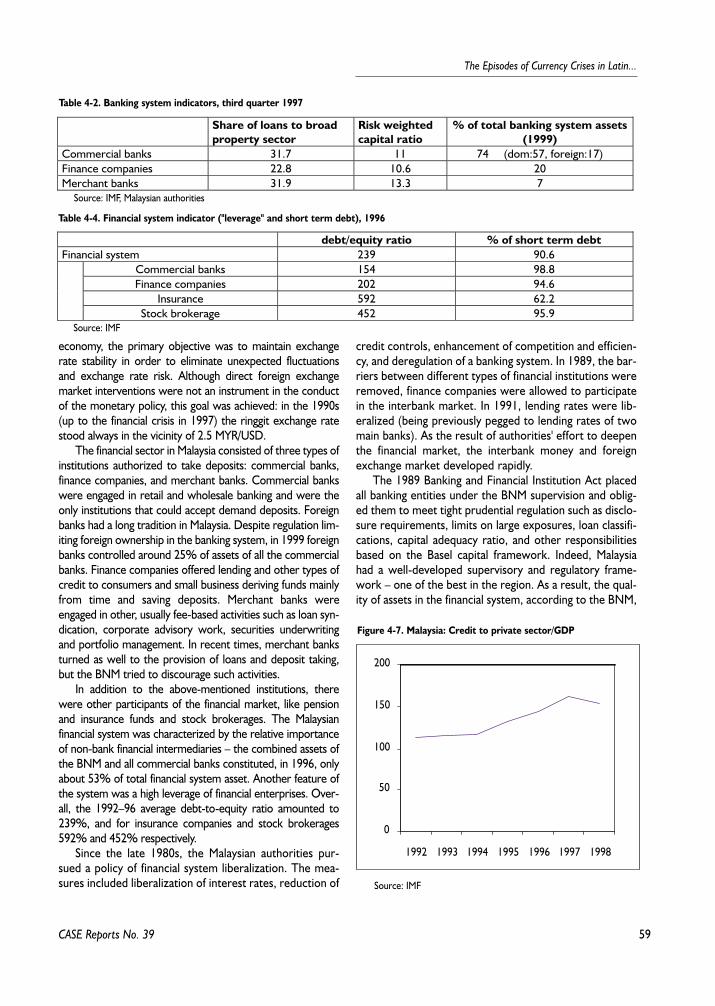
59
The Episodes of Currency Crises in Latin...
economy, the primary objective was to maintain exchangerate stability in order to eliminate unexpected fluctuationsand exchange rate risk. Although direct foreign exchangemarket interventions were not an instrument in the conductof the monetary policy, this goal was achieved: in the 1990s(up to the financial crisis in 1997) the ringgit exchange ratestood always in the vicinity of 2.5 MYR/USD.
The financial sector in Malaysia consisted of three types ofinstitutions authorized to take deposits: commercial banks,finance companies, and merchant banks. Commercial bankswere engaged in retail and wholesale banking and were theonly institutions that could accept demand deposits. Foreignbanks had a long tradition in Malaysia. Despite regulation lim-iting foreign ownership in the banking system, in 1999 foreignbanks controlled around 25% of assets of all the commercialbanks. Finance companies offered lending and other types ofcredit to consumers and small business deriving funds mainlyfrom time and saving deposits. Merchant banks wereengaged in other, usually fee-based activities such as loan syn-dication, corporate advisory work, securities underwritingand portfolio management. In recent times, merchant banksturned as well to the provision of loans and deposit taking,but the BNM tried to discourage such activities.
In addition to the above-mentioned institutions, therewere other participants of the financial market, like pensionand insurance funds and stock brokerages. The Malaysianfinancial system was characterized by the relative importanceof non-bank financial intermediaries – the combined assets ofthe BNM and all commercial banks constituted, in 1996, onlyabout 53% of total financial system asset. Another feature ofthe system was a high leverage of financial enterprises. Over-all, the 1992–96 average debt-to-equity ratio amounted to239%, and for insurance companies and stock brokerages592% and 452% respectively.
Since the late 1980s, the Malaysian authorities pur-sued a policy of financial system liberalization. The mea-sures included liberalization of interest rates, reduction of
credit controls, enhancement of competition and efficien-cy, and deregulation of a banking system. In 1989, the bar-riers between different types of financial institutions wereremoved, finance companies were allowed to participatein the interbank market. In 1991, lending rates were lib-eralized (being previously pegged to lending rates of twomain banks). As the result of authorities' effort to deepenthe financial market, the interbank money and foreignexchange market developed rapidly.
The 1989 Banking and Financial Institution Act placedall banking entities under the BNM supervision and oblig-ed them to meet tight prudential regulation such as disclo-sure requirements, limits on large exposures, loan classifi-cations, capital adequacy ratio, and other responsibilitiesbased on the Basel capital framework. Indeed, Malaysiahad a well-developed supervisory and regulatory frame-work – one of the best in the region. As a result, the qual-ity of assets in the financial system, according to the BNM,
CASE Reports No. 39
Table 4-2. Banking system indicators, third quarter 1997
Share of loans to broadproperty sector
Risk weightedcapital ratio
% of total banking system assets(1999)
Commercial banks 31.7 11 74 (dom:57, foreign:17)Finance companies 22.8 10.6 20Merchant banks 31.9 13.3 7
Source: IMF, Malaysian authorities
Table 4-4. Financial system indicator ("leverage" and short term debt), 1996
debt/equity ratio % of short term debtFinancial system 239 90.6
Commercial banks 154 98.8Finance companies 202 94.6
Insurance 592 62.2Stock brokerage 452 95.9
Source: IMF
Figure 4-7. Malaysia: Credit to private sector/GDP
0
50
100
150
200
1992 1993 1994 1995 1996 1997 1998
Source: IMF
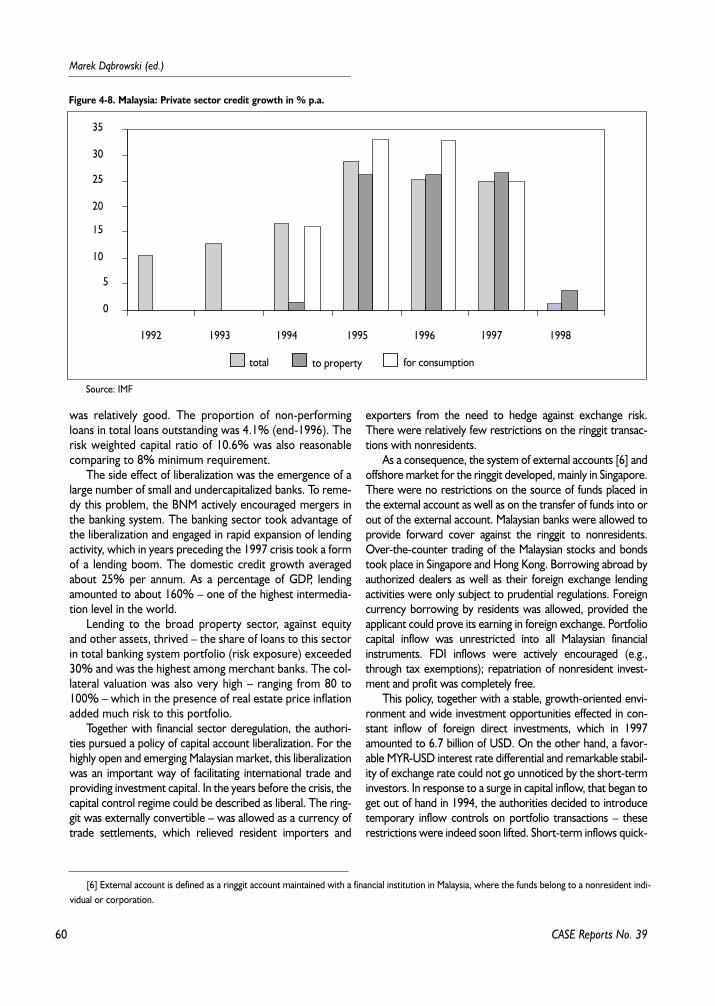
60
Marek D¹browski (ed.)
was relatively good. The proportion of non-performingloans in total loans outstanding was 4.1% (end-1996). Therisk weighted capital ratio of 10.6% was also reasonablecomparing to 8% minimum requirement.
The side effect of liberalization was the emergence of alarge number of small and undercapitalized banks. To reme-dy this problem, the BNM actively encouraged mergers inthe banking system. The banking sector took advantage ofthe liberalization and engaged in rapid expansion of lendingactivity, which in years preceding the 1997 crisis took a formof a lending boom. The domestic credit growth averagedabout 25% per annum. As a percentage of GDP, lendingamounted to about 160% – one of the highest intermedia-tion level in the world.
Lending to the broad property sector, against equityand other assets, thrived – the share of loans to this sectorin total banking system portfolio (risk exposure) exceeded30% and was the highest among merchant banks. The col-lateral valuation was also very high – ranging from 80 to100% – which in the presence of real estate price inflationadded much risk to this portfolio.
Together with financial sector deregulation, the authori-ties pursued a policy of capital account liberalization. For thehighly open and emerging Malaysian market, this liberalizationwas an important way of facilitating international trade andproviding investment capital. In the years before the crisis, thecapital control regime could be described as liberal. The ring-git was externally convertible – was allowed as a currency oftrade settlements, which relieved resident importers and
exporters from the need to hedge against exchange risk.There were relatively few restrictions on the ringgit transac-tions with nonresidents.
As a consequence, the system of external accounts [6] andoffshore market for the ringgit developed, mainly in Singapore.There were no restrictions on the source of funds placed inthe external account as well as on the transfer of funds into orout of the external account. Malaysian banks were allowed toprovide forward cover against the ringgit to nonresidents.Over-the-counter trading of the Malaysian stocks and bondstook place in Singapore and Hong Kong. Borrowing abroad byauthorized dealers as well as their foreign exchange lendingactivities were only subject to prudential regulations. Foreigncurrency borrowing by residents was allowed, provided theapplicant could prove its earning in foreign exchange. Portfoliocapital inflow was unrestricted into all Malaysian financialinstruments. FDI inflows were actively encouraged (e.g.,through tax exemptions); repatriation of nonresident invest-ment and profit was completely free.
This policy, together with a stable, growth-oriented envi-ronment and wide investment opportunities effected in con-stant inflow of foreign direct investments, which in 1997amounted to 6.7 billion of USD. On the other hand, a favor-able MYR-USD interest rate differential and remarkable stabil-ity of exchange rate could not go unnoticed by the short-terminvestors. In response to a surge in capital inflow, that began toget out of hand in 1994, the authorities decided to introducetemporary inflow controls on portfolio transactions – theserestrictions were indeed soon lifted. Short-term inflows quick-
CASE Reports No. 39
Figure 4-8. Malaysia: Private sector credit growth in % p.a.
0
5
10
15
20
25
30
35
1992 1993 1994 1995 1996 1997 1998
total to property for consumption
Source: IMF
[6] External account is defined as a ringgit account maintained with a financial institution in Malaysia, where the funds belong to a nonresident indi-vidual or corporation.
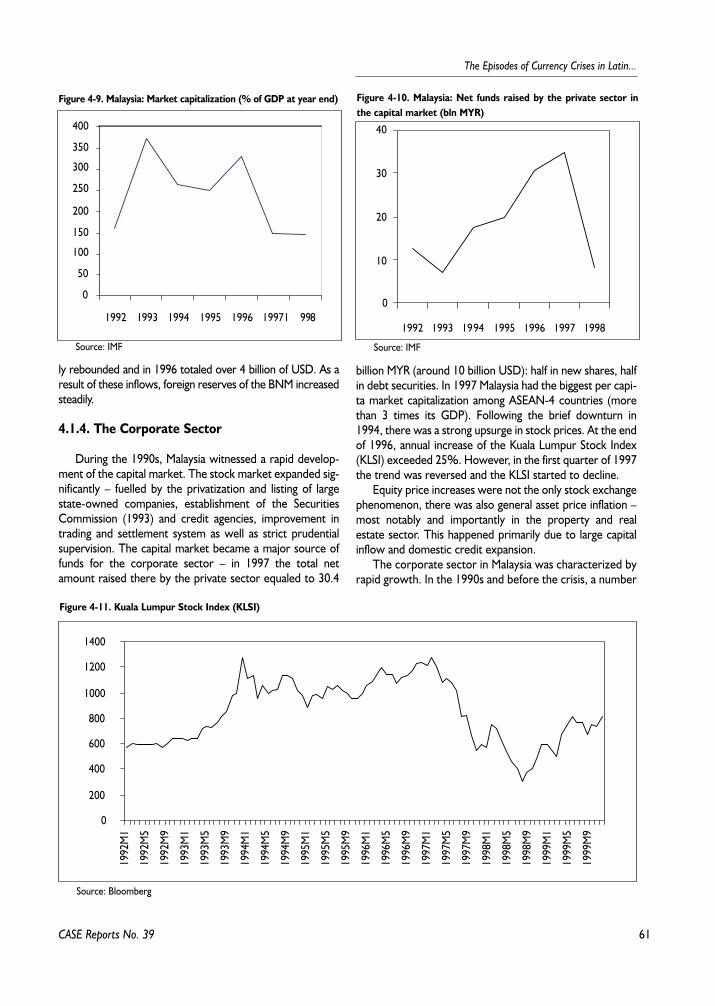
61
The Episodes of Currency Crises in Latin...
ly rebounded and in 1996 totaled over 4 billion of USD. As aresult of these inflows, foreign reserves of the BNM increasedsteadily.
4.1.4. The Corporate Sector
During the 1990s, Malaysia witnessed a rapid develop-ment of the capital market. The stock market expanded sig-nificantly – fuelled by the privatization and listing of largestate-owned companies, establishment of the SecuritiesCommission (1993) and credit agencies, improvement intrading and settlement system as well as strict prudentialsupervision. The capital market became a major source offunds for the corporate sector – in 1997 the total netamount raised there by the private sector equaled to 30.4
billion MYR (around 10 billion USD): half in new shares, halfin debt securities. In 1997 Malaysia had the biggest per capi-ta market capitalization among ASEAN-4 countries (morethan 3 times its GDP). Following the brief downturn in1994, there was a strong upsurge in stock prices. At the endof 1996, annual increase of the Kuala Lumpur Stock Index(KLSI) exceeded 25%. However, in the first quarter of 1997the trend was reversed and the KLSI started to decline.
Equity price increases were not the only stock exchangephenomenon, there was also general asset price inflation –most notably and importantly in the property and realestate sector. This happened primarily due to large capitalinflow and domestic credit expansion.
The corporate sector in Malaysia was characterized byrapid growth. In the 1990s and before the crisis, a number
CASE Reports No. 39
Figure 4-9. Malaysia: Market capitalization (% of GDP at year end)
0
50
100
150
200
250
300
350
400
1992 1993 1994 1995 1996 19971 998
Source: IMF
Figure 4-10. Malaysia: Net funds raised by the private sector inthe capital market (bln MYR)
0
10
20
30
40
1992 1993 1994 1995 1996 1997 1998
Source: IMF
Figure 4-11. Kuala Lumpur Stock Index (KLSI)
0
200
400
600
800
1000
1200
1400
1992
M1
1992
M5
1992
M9
1993
M1
1993
M5
1993
M9
1994
M1
1994
M5
1994
M9
1995
M1
1995
M5
1995
M9
1996
M1
1996
M5
1996
M9
1997
M1
1997
M5
1997
M9
1998
M1
1998
M5
1998
M9
1999
M1
1999
M5
1999
M9
Source: Bloomberg
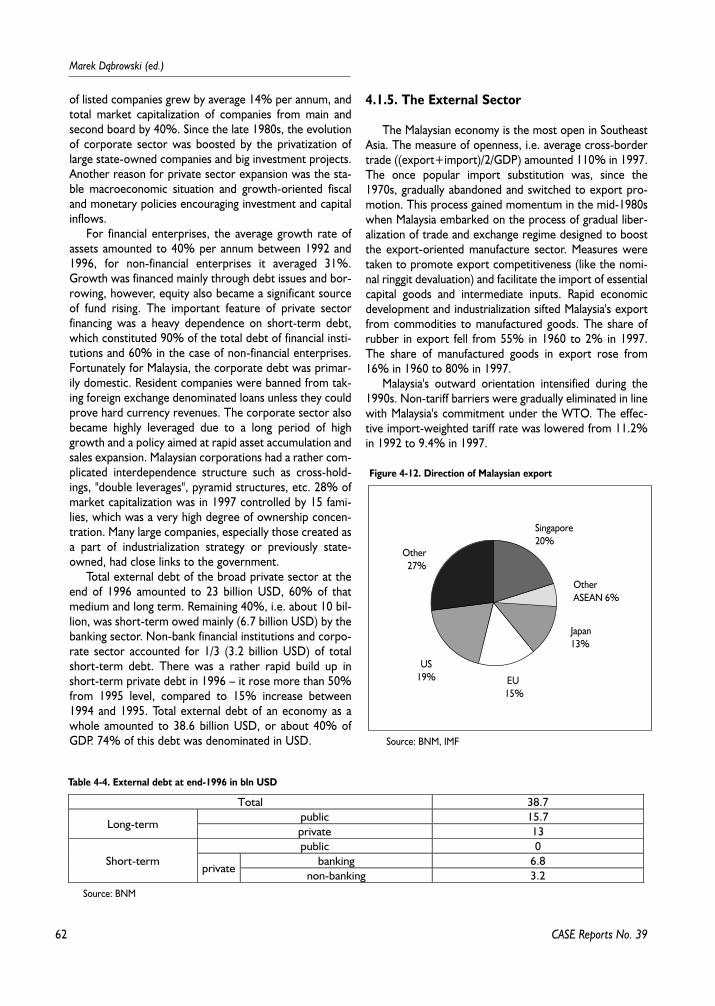
62
Marek D¹browski (ed.)
of listed companies grew by average 14% per annum, andtotal market capitalization of companies from main andsecond board by 40%. Since the late 1980s, the evolutionof corporate sector was boosted by the privatization oflarge state-owned companies and big investment projects.Another reason for private sector expansion was the sta-ble macroeconomic situation and growth-oriented fiscaland monetary policies encouraging investment and capitalinflows.
For financial enterprises, the average growth rate ofassets amounted to 40% per annum between 1992 and1996, for non-financial enterprises it averaged 31%.Growth was financed mainly through debt issues and bor-rowing, however, equity also became a significant sourceof fund rising. The important feature of private sectorfinancing was a heavy dependence on short-term debt,which constituted 90% of the total debt of financial insti-tutions and 60% in the case of non-financial enterprises.Fortunately for Malaysia, the corporate debt was primar-ily domestic. Resident companies were banned from tak-ing foreign exchange denominated loans unless they couldprove hard currency revenues. The corporate sector alsobecame highly leveraged due to a long period of highgrowth and a policy aimed at rapid asset accumulation andsales expansion. Malaysian corporations had a rather com-plicated interdependence structure such as cross-hold-ings, "double leverages", pyramid structures, etc. 28% ofmarket capitalization was in 1997 controlled by 15 fami-lies, which was a very high degree of ownership concen-tration. Many large companies, especially those created asa part of industrialization strategy or previously state-owned, had close links to the government.
Total external debt of the broad private sector at theend of 1996 amounted to 23 billion USD, 60% of thatmedium and long term. Remaining 40%, i.e. about 10 bil-lion, was short-term owed mainly (6.7 billion USD) by thebanking sector. Non-bank financial institutions and corpo-rate sector accounted for 1/3 (3.2 billion USD) of totalshort-term debt. There was a rather rapid build up inshort-term private debt in 1996 – it rose more than 50%from 1995 level, compared to 15% increase between1994 and 1995. Total external debt of an economy as awhole amounted to 38.6 billion USD, or about 40% ofGDP. 74% of this debt was denominated in USD.
4.1.5. The External Sector
The Malaysian economy is the most open in SoutheastAsia. The measure of openness, i.e. average cross-bordertrade ((export+import)/2/GDP) amounted 110% in 1997.The once popular import substitution was, since the1970s, gradually abandoned and switched to export pro-motion. This process gained momentum in the mid-1980swhen Malaysia embarked on the process of gradual liber-alization of trade and exchange regime designed to boostthe export-oriented manufacture sector. Measures weretaken to promote export competitiveness (like the nomi-nal ringgit devaluation) and facilitate the import of essentialcapital goods and intermediate inputs. Rapid economicdevelopment and industrialization sifted Malaysia's exportfrom commodities to manufactured goods. The share ofrubber in export fell from 55% in 1960 to 2% in 1997.The share of manufactured goods in export rose from16% in 1960 to 80% in 1997.
Malaysia's outward orientation intensified during the1990s. Non-tariff barriers were gradually eliminated in linewith Malaysia's commitment under the WTO. The effec-tive import-weighted tariff rate was lowered from 11.2%in 1992 to 9.4% in 1997.
CASE Reports No. 39
Table 4-4. External debt at end-1996 in bln USD
Total 38.7public 15.7
Long-termprivate 13public 0
banking 6.8Short-termprivate
non-banking 3.2Source: BNM
Figure 4-12. Direction of Malaysian export
––
Singapore20%
Japan13%
Other27%
US19%
OtherASEAN 6%
EU 15%
Source: BNM, IMF
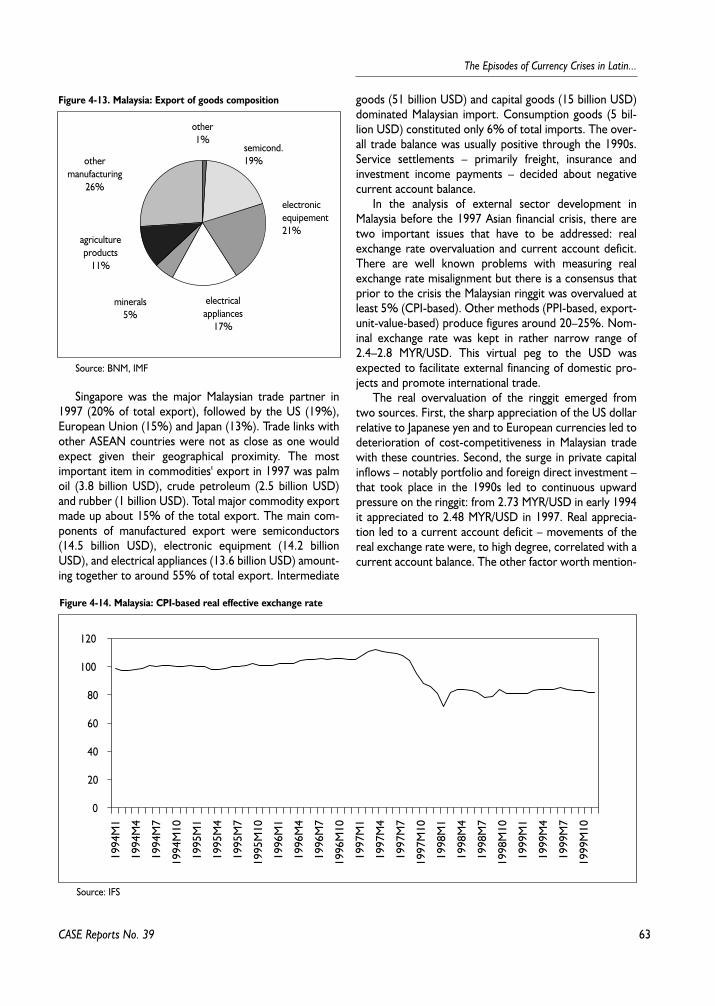
63
The Episodes of Currency Crises in Latin...
Singapore was the major Malaysian trade partner in1997 (20% of total export), followed by the US (19%),European Union (15%) and Japan (13%). Trade links withother ASEAN countries were not as close as one wouldexpect given their geographical proximity. The mostimportant item in commodities' export in 1997 was palmoil (3.8 billion USD), crude petroleum (2.5 billion USD)and rubber (1 billion USD). Total major commodity exportmade up about 15% of the total export. The main com-ponents of manufactured export were semiconductors(14.5 billion USD), electronic equipment (14.2 billionUSD), and electrical appliances (13.6 billion USD) amount-ing together to around 55% of total export. Intermediate
goods (51 billion USD) and capital goods (15 billion USD)dominated Malaysian import. Consumption goods (5 bil-lion USD) constituted only 6% of total imports. The over-all trade balance was usually positive through the 1990s.Service settlements – primarily freight, insurance andinvestment income payments – decided about negativecurrent account balance.
In the analysis of external sector development inMalaysia before the 1997 Asian financial crisis, there aretwo important issues that have to be addressed: realexchange rate overvaluation and current account deficit.There are well known problems with measuring realexchange rate misalignment but there is a consensus thatprior to the crisis the Malaysian ringgit was overvalued atleast 5% (CPI-based). Other methods (PPI-based, export-unit-value-based) produce figures around 20–25%. Nom-inal exchange rate was kept in rather narrow range of2.4–2.8 MYR/USD. This virtual peg to the USD wasexpected to facilitate external financing of domestic pro-jects and promote international trade.
The real overvaluation of the ringgit emerged fromtwo sources. First, the sharp appreciation of the US dollarrelative to Japanese yen and to European currencies led todeterioration of cost-competitiveness in Malaysian tradewith these countries. Second, the surge in private capitalinflows – notably portfolio and foreign direct investment –that took place in the 1990s led to continuous upwardpressure on the ringgit: from 2.73 MYR/USD in early 1994it appreciated to 2.48 MYR/USD in 1997. Real apprecia-tion led to a current account deficit – movements of thereal exchange rate were, to high degree, correlated with acurrent account balance. The other factor worth mention-
CASE Reports No. 39
Figure 4-13. Malaysia: Export of goods composition
––
semicond.19%
other1%
othermanufacturing
26%
minerals5%
electronicequipement21%
electricalappliances
17%
agricultureproducts
11%
Source: BNM, IMF
Figure 4-14. Malaysia: CPI-based real effective exchange rate
0
20
40
60
80
100
120
1994
M1
1994
M4
1994
M7
1994
M10
1995
M1
1995
M4
1995
M7
1995
M10
1996
M1
1996
M4
1996
M7
1996
M10
1997
M1
1997
M4
1997
M7
1997
M10
1998
M1
1998
M4
1998
M7
1998
M10
1999
M1
1999
M4
1999
M7
1999
M10
Source: IFS
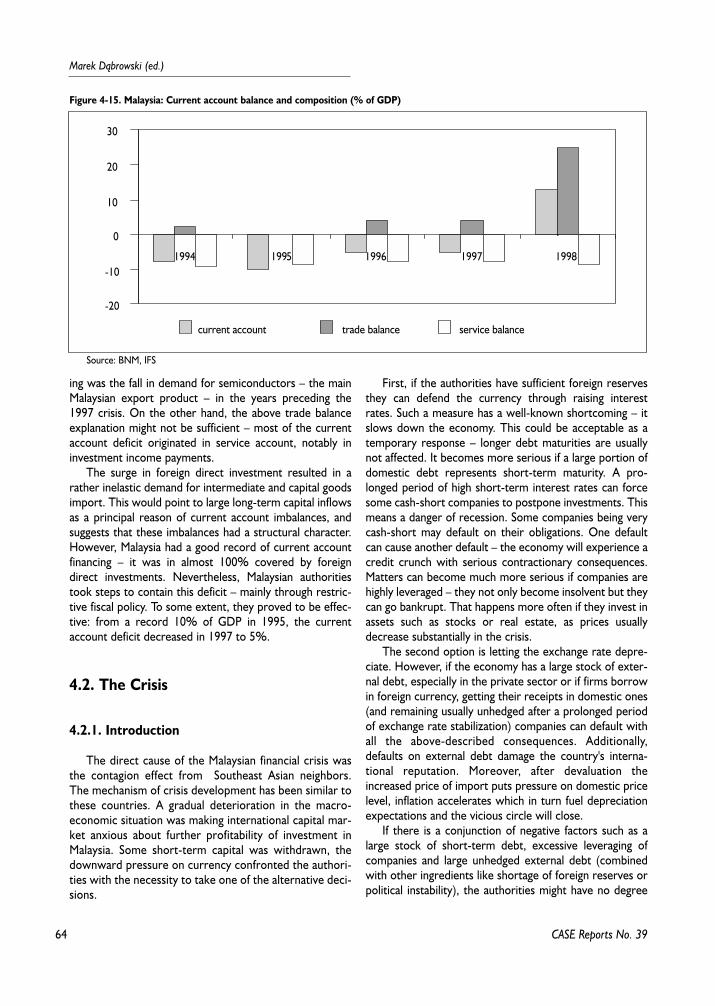
64
Marek D¹browski (ed.)
ing was the fall in demand for semiconductors – the mainMalaysian export product – in the years preceding the1997 crisis. On the other hand, the above trade balanceexplanation might not be sufficient – most of the currentaccount deficit originated in service account, notably ininvestment income payments.
The surge in foreign direct investment resulted in arather inelastic demand for intermediate and capital goodsimport. This would point to large long-term capital inflowsas a principal reason of current account imbalances, andsuggests that these imbalances had a structural character.However, Malaysia had a good record of current accountfinancing – it was in almost 100% covered by foreigndirect investments. Nevertheless, Malaysian authoritiestook steps to contain this deficit – mainly through restric-tive fiscal policy. To some extent, they proved to be effec-tive: from a record 10% of GDP in 1995, the currentaccount deficit decreased in 1997 to 5%.
4.2. The Crisis
4.2.1. Introduction
The direct cause of the Malaysian financial crisis wasthe contagion effect from Southeast Asian neighbors.The mechanism of crisis development has been similar tothese countries. A gradual deterioration in the macro-economic situation was making international capital mar-ket anxious about further profitability of investment inMalaysia. Some short-term capital was withdrawn, thedownward pressure on currency confronted the authori-ties with the necessity to take one of the alternative deci-sions.
First, if the authorities have sufficient foreign reservesthey can defend the currency through raising interestrates. Such a measure has a well-known shortcoming – itslows down the economy. This could be acceptable as atemporary response – longer debt maturities are usuallynot affected. It becomes more serious if a large portion ofdomestic debt represents short-term maturity. A pro-longed period of high short-term interest rates can forcesome cash-short companies to postpone investments. Thismeans a danger of recession. Some companies being verycash-short may default on their obligations. One defaultcan cause another default – the economy will experience acredit crunch with serious contractionary consequences.Matters can become much more serious if companies arehighly leveraged – they not only become insolvent but theycan go bankrupt. That happens more often if they invest inassets such as stocks or real estate, as prices usuallydecrease substantially in the crisis.
The second option is letting the exchange rate depre-ciate. However, if the economy has a large stock of exter-nal debt, especially in the private sector or if firms borrowin foreign currency, getting their receipts in domestic ones(and remaining usually unhedged after a prolonged periodof exchange rate stabilization) companies can default withall the above-described consequences. Additionally,defaults on external debt damage the country's interna-tional reputation. Moreover, after devaluation theincreased price of import puts pressure on domestic pricelevel, inflation accelerates which in turn fuel depreciationexpectations and the vicious circle will close.
If there is a conjunction of negative factors such as alarge stock of short-term debt, excessive leveraging ofcompanies and large unhedged external debt (combinedwith other ingredients like shortage of foreign reserves orpolitical instability), the authorities might have no degree
CASE Reports No. 39
Figure 4-15. Malaysia: Current account balance and composition (% of GDP)
-20
-10
0
10
20
30
1994 1995 1996 1997 1998
current account trade balance service balance
Source: BNM, IFS
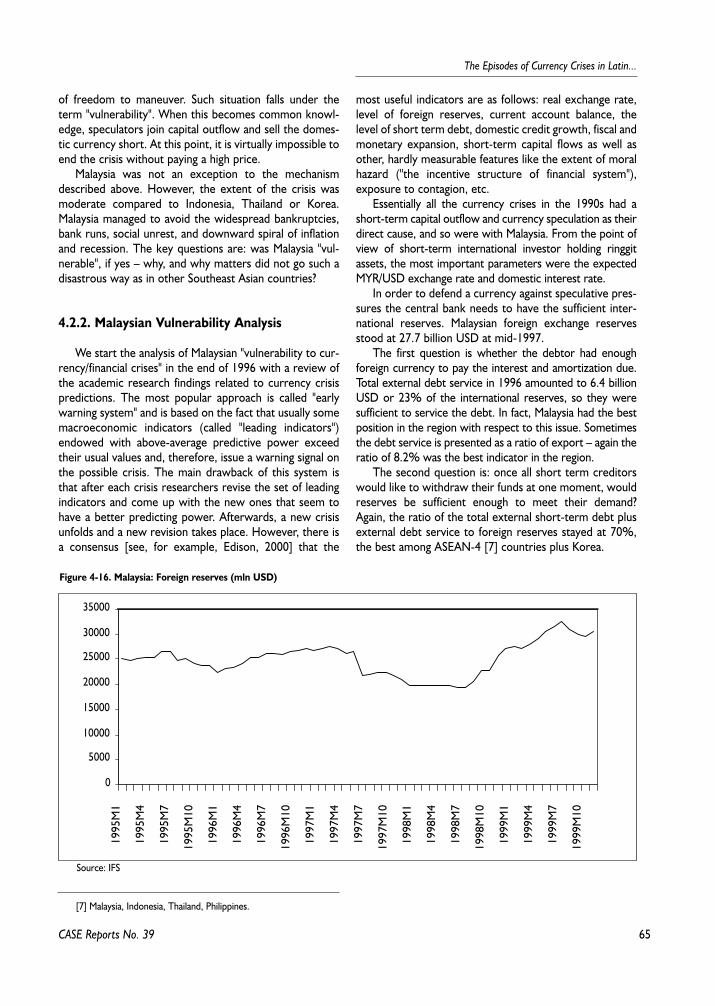
65
The Episodes of Currency Crises in Latin...
of freedom to maneuver. Such situation falls under theterm "vulnerability". When this becomes common knowl-edge, speculators join capital outflow and sell the domes-tic currency short. At this point, it is virtually impossible toend the crisis without paying a high price.
Malaysia was not an exception to the mechanismdescribed above. However, the extent of the crisis wasmoderate compared to Indonesia, Thailand or Korea.Malaysia managed to avoid the widespread bankruptcies,bank runs, social unrest, and downward spiral of inflationand recession. The key questions are: was Malaysia "vul-nerable", if yes – why, and why matters did not go such adisastrous way as in other Southeast Asian countries?
4.2.2. Malaysian Vulnerability Analysis
We start the analysis of Malaysian "vulnerability to cur-rency/financial crises" in the end of 1996 with a review ofthe academic research findings related to currency crisispredictions. The most popular approach is called "earlywarning system" and is based on the fact that usually somemacroeconomic indicators (called "leading indicators")endowed with above-average predictive power exceedtheir usual values and, therefore, issue a warning signal onthe possible crisis. The main drawback of this system isthat after each crisis researchers revise the set of leadingindicators and come up with the new ones that seem tohave a better predicting power. Afterwards, a new crisisunfolds and a new revision takes place. However, there isa consensus [see, for example, Edison, 2000] that the
most useful indicators are as follows: real exchange rate,level of foreign reserves, current account balance, thelevel of short term debt, domestic credit growth, fiscal andmonetary expansion, short-term capital flows as well asother, hardly measurable features like the extent of moralhazard ("the incentive structure of financial system"),exposure to contagion, etc.
Essentially all the currency crises in the 1990s had ashort-term capital outflow and currency speculation as theirdirect cause, and so were with Malaysia. From the point ofview of short-term international investor holding ringgitassets, the most important parameters were the expectedMYR/USD exchange rate and domestic interest rate.
In order to defend a currency against speculative pres-sures the central bank needs to have the sufficient inter-national reserves. Malaysian foreign exchange reservesstood at 27.7 billion USD at mid-1997.
The first question is whether the debtor had enoughforeign currency to pay the interest and amortization due.Total external debt service in 1996 amounted to 6.4 billionUSD or 23% of the international reserves, so they weresufficient to service the debt. In fact, Malaysia had the bestposition in the region with respect to this issue. Sometimesthe debt service is presented as a ratio of export – again theratio of 8.2% was the best indicator in the region.
The second question is: once all short term creditorswould like to withdraw their funds at one moment, wouldreserves be sufficient enough to meet their demand?Again, the ratio of the total external short-term debt plusexternal debt service to foreign reserves stayed at 70%,the best among ASEAN-4 [7] countries plus Korea.
CASE Reports No. 39
[7] Malaysia, Indonesia, Thailand, Philippines.
Figure 4-16. Malaysia: Foreign reserves (mln USD)
0
5000
10000
15000
20000
25000
30000
35000
1995
M1
1995
M4
1995
M7
1995
M10
1996
M1
1996
M4
1996
M7
1996
M10
1997
M1
1997
M4
1997
M7
1997
M10
1998
M1
1998
M4
1998
M7
1998
M10
1999
M1
1999
M4
1999
M7
1999
M10
Source: IFS
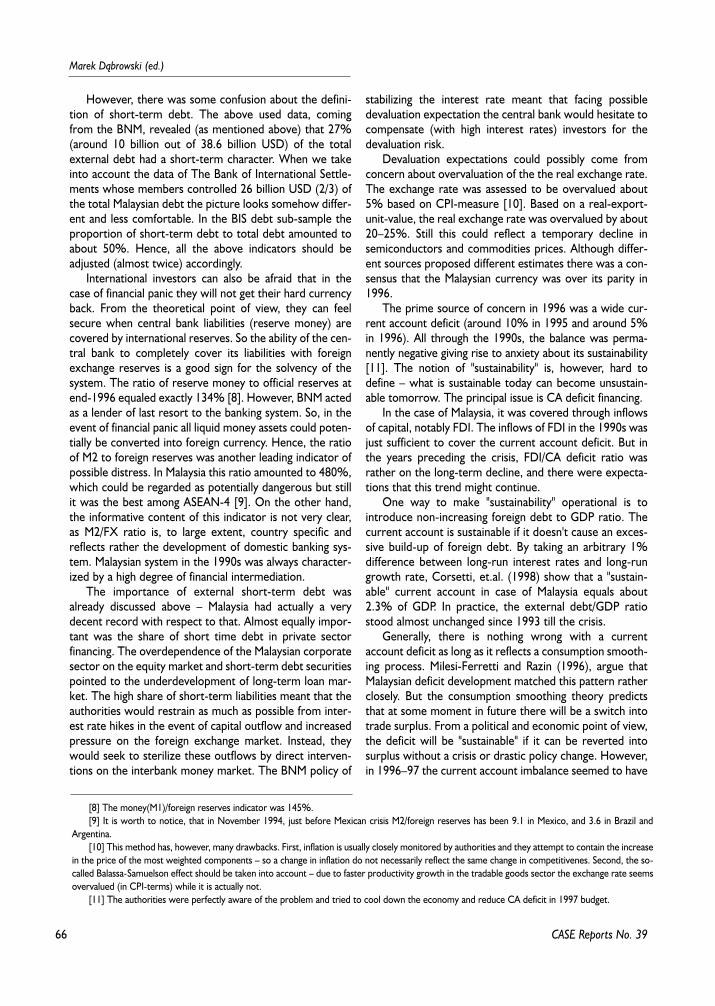
66
Marek D¹browski (ed.)
However, there was some confusion about the defini-tion of short-term debt. The above used data, comingfrom the BNM, revealed (as mentioned above) that 27%(around 10 billion out of 38.6 billion USD) of the totalexternal debt had a short-term character. When we takeinto account the data of The Bank of International Settle-ments whose members controlled 26 billion USD (2/3) ofthe total Malaysian debt the picture looks somehow differ-ent and less comfortable. In the BIS debt sub-sample theproportion of short-term debt to total debt amounted toabout 50%. Hence, all the above indicators should beadjusted (almost twice) accordingly.
International investors can also be afraid that in thecase of financial panic they will not get their hard currencyback. From the theoretical point of view, they can feelsecure when central bank liabilities (reserve money) arecovered by international reserves. So the ability of the cen-tral bank to completely cover its liabilities with foreignexchange reserves is a good sign for the solvency of thesystem. The ratio of reserve money to official reserves atend-1996 equaled exactly 134% [8]. However, BNM actedas a lender of last resort to the banking system. So, in theevent of financial panic all liquid money assets could poten-tially be converted into foreign currency. Hence, the ratioof M2 to foreign reserves was another leading indicator ofpossible distress. In Malaysia this ratio amounted to 480%,which could be regarded as potentially dangerous but stillit was the best among ASEAN-4 [9]. On the other hand,the informative content of this indicator is not very clear,as M2/FX ratio is, to large extent, country specific andreflects rather the development of domestic banking sys-tem. Malaysian system in the 1990s was always character-ized by a high degree of financial intermediation.
The importance of external short-term debt wasalready discussed above – Malaysia had actually a verydecent record with respect to that. Almost equally impor-tant was the share of short time debt in private sectorfinancing. The overdependence of the Malaysian corporatesector on the equity market and short-term debt securitiespointed to the underdevelopment of long-term loan mar-ket. The high share of short-term liabilities meant that theauthorities would restrain as much as possible from inter-est rate hikes in the event of capital outflow and increasedpressure on the foreign exchange market. Instead, theywould seek to sterilize these outflows by direct interven-tions on the interbank money market. The BNM policy of
stabilizing the interest rate meant that facing possibledevaluation expectation the central bank would hesitate tocompensate (with high interest rates) investors for thedevaluation risk.
Devaluation expectations could possibly come fromconcern about overvaluation of the the real exchange rate.The exchange rate was assessed to be overvalued about5% based on CPI-measure [10]. Based on a real-export-unit-value, the real exchange rate was overvalued by about20–25%. Still this could reflect a temporary decline insemiconductors and commodities prices. Although differ-ent sources proposed different estimates there was a con-sensus that the Malaysian currency was over its parity in1996.
The prime source of concern in 1996 was a wide cur-rent account deficit (around 10% in 1995 and around 5%in 1996). All through the 1990s, the balance was perma-nently negative giving rise to anxiety about its sustainability[11]. The notion of "sustainability" is, however, hard todefine – what is sustainable today can become unsustain-able tomorrow. The principal issue is CA deficit financing.
In the case of Malaysia, it was covered through inflowsof capital, notably FDI. The inflows of FDI in the 1990s wasjust sufficient to cover the current account deficit. But inthe years preceding the crisis, FDI/CA deficit ratio wasrather on the long-term decline, and there were expecta-tions that this trend might continue.
One way to make "sustainability" operational is tointroduce non-increasing foreign debt to GDP ratio. Thecurrent account is sustainable if it doesn't cause an exces-sive build-up of foreign debt. By taking an arbitrary 1%difference between long-run interest rates and long-rungrowth rate, Corsetti, et.al. (1998) show that a "sustain-able" current account in case of Malaysia equals about2.3% of GDP. In practice, the external debt/GDP ratiostood almost unchanged since 1993 till the crisis.
Generally, there is nothing wrong with a currentaccount deficit as long as it reflects a consumption smooth-ing process. Milesi-Ferretti and Razin (1996), argue thatMalaysian deficit development matched this pattern ratherclosely. But the consumption smoothing theory predictsthat at some moment in future there will be a switch intotrade surplus. From a political and economic point of view,the deficit will be "sustainable" if it can be reverted intosurplus without a crisis or drastic policy change. However,in 1996–97 the current account imbalance seemed to have
CASE Reports No. 39
[8] The money(M1)/foreign reserves indicator was 145%.[9] It is worth to notice, that in November 1994, just before Mexican crisis M2/foreign reserves has been 9.1 in Mexico, and 3.6 in Brazil and
Argentina.[10] This method has, however, many drawbacks. First, inflation is usually closely monitored by authorities and they attempt to contain the increase
in the price of the most weighted components – so a change in inflation do not necessarily reflect the same change in competitivenes. Second, the so-called Balassa-Samuelson effect should be taken into account – due to faster productivity growth in the tradable goods sector the exchange rate seemsovervalued (in CPI-terms) while it is actually not.
[11] The authorities were perfectly aware of the problem and tried to cool down the economy and reduce CA deficit in 1997 budget.
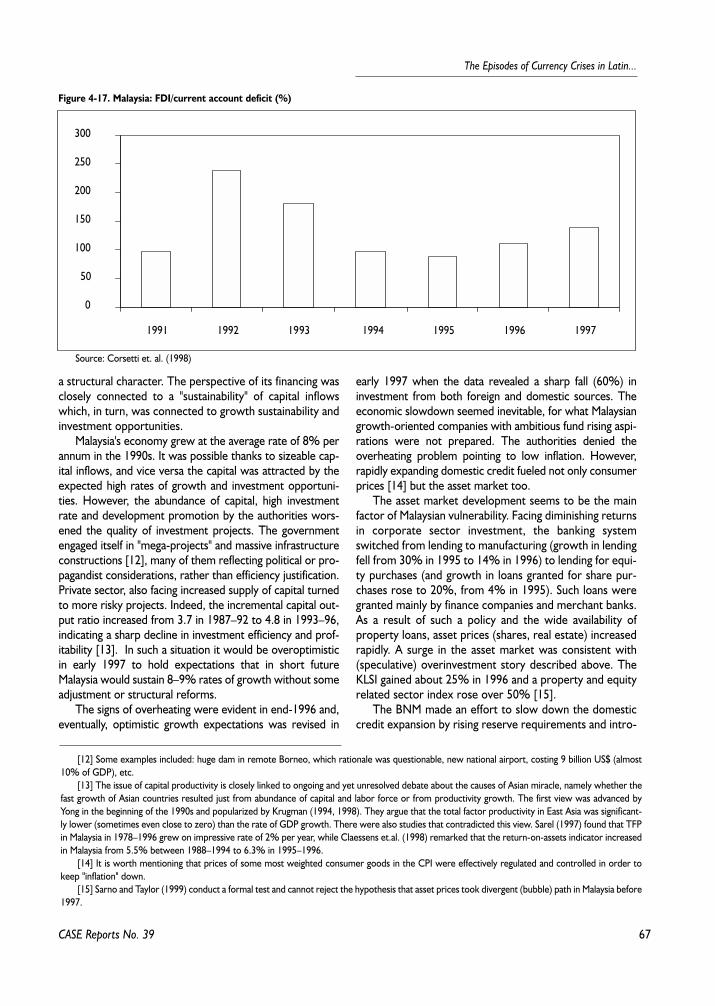
67
The Episodes of Currency Crises in Latin...
a structural character. The perspective of its financing wasclosely connected to a "sustainability" of capital inflowswhich, in turn, was connected to growth sustainability andinvestment opportunities.
Malaysia's economy grew at the average rate of 8% perannum in the 1990s. It was possible thanks to sizeable cap-ital inflows, and vice versa the capital was attracted by theexpected high rates of growth and investment opportuni-ties. However, the abundance of capital, high investmentrate and development promotion by the authorities wors-ened the quality of investment projects. The governmentengaged itself in "mega-projects" and massive infrastructureconstructions [12], many of them reflecting political or pro-pagandist considerations, rather than efficiency justification.Private sector, also facing increased supply of capital turnedto more risky projects. Indeed, the incremental capital out-put ratio increased from 3.7 in 1987–92 to 4.8 in 1993–96,indicating a sharp decline in investment efficiency and prof-itability [13]. In such a situation it would be overoptimisticin early 1997 to hold expectations that in short futureMalaysia would sustain 8–9% rates of growth without someadjustment or structural reforms.
The signs of overheating were evident in end-1996 and,eventually, optimistic growth expectations was revised in
early 1997 when the data revealed a sharp fall (60%) ininvestment from both foreign and domestic sources. Theeconomic slowdown seemed inevitable, for what Malaysiangrowth-oriented companies with ambitious fund rising aspi-rations were not prepared. The authorities denied theoverheating problem pointing to low inflation. However,rapidly expanding domestic credit fueled not only consumerprices [14] but the asset market too.
The asset market development seems to be the mainfactor of Malaysian vulnerability. Facing diminishing returnsin corporate sector investment, the banking systemswitched from lending to manufacturing (growth in lendingfell from 30% in 1995 to 14% in 1996) to lending for equi-ty purchases (and growth in loans granted for share pur-chases rose to 20%, from 4% in 1995). Such loans weregranted mainly by finance companies and merchant banks.As a result of such a policy and the wide availability ofproperty loans, asset prices (shares, real estate) increasedrapidly. A surge in the asset market was consistent with(speculative) overinvestment story described above. TheKLSI gained about 25% in 1996 and a property and equityrelated sector index rose over 50% [15].
The BNM made an effort to slow down the domesticcredit expansion by rising reserve requirements and intro-
CASE Reports No. 39
Figure 4-17. Malaysia: FDI/current account deficit (%)
0
50
100
150
200
250
300
1991 1992 1993 1994 1995 1996 1997
Source: Corsetti et. al. (1998)
[12] Some examples included: huge dam in remote Borneo, which rationale was questionable, new national airport, costing 9 billion US$ (almost10% of GDP), etc.
[13] The issue of capital productivity is closely linked to ongoing and yet unresolved debate about the causes of Asian miracle, namely whether thefast growth of Asian countries resulted just from abundance of capital and labor force or from productivity growth. The first view was advanced byYong in the beginning of the 1990s and popularized by Krugman (1994, 1998). They argue that the total factor productivity in East Asia was significant-ly lower (sometimes even close to zero) than the rate of GDP growth. There were also studies that contradicted this view. Sarel (1997) found that TFPin Malaysia in 1978–1996 grew on impressive rate of 2% per year, while Claessens et.al. (1998) remarked that the return-on-assets indicator increasedin Malaysia from 5.5% between 1988–1994 to 6.3% in 1995–1996.
[14] It is worth mentioning that prices of some most weighted consumer goods in the CPI were effectively regulated and controlled in order tokeep "inflation" down.
[15] Sarno and Taylor (1999) conduct a formal test and cannot reject the hypothesis that asset prices took divergent (bubble) path in Malaysia before1997.
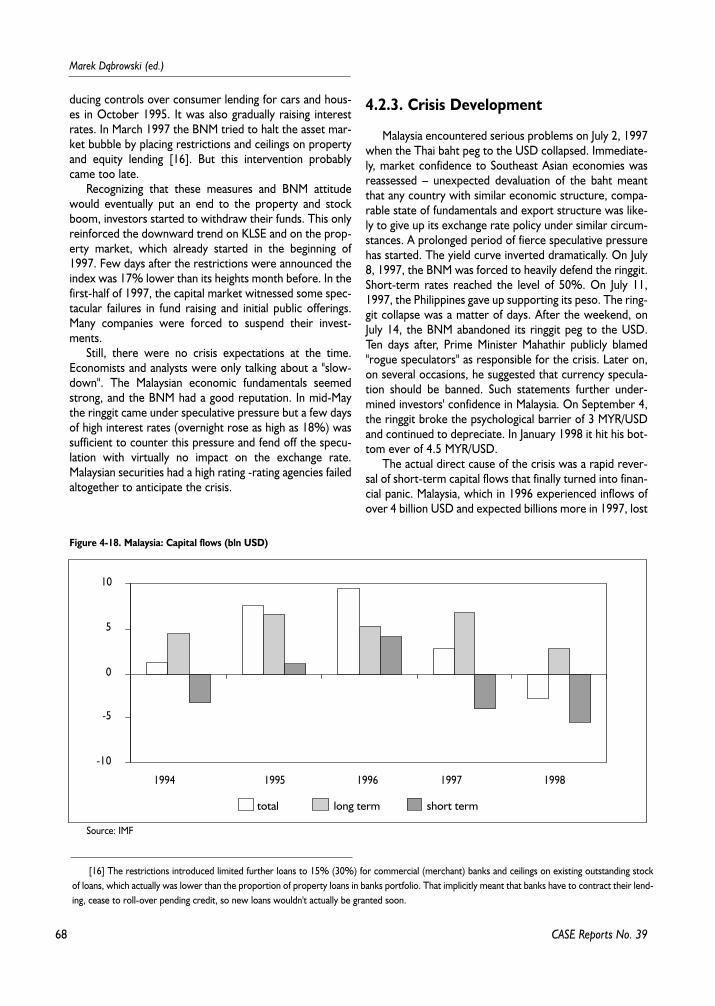
68
Marek D¹browski (ed.)
ducing controls over consumer lending for cars and hous-es in October 1995. It was also gradually raising interestrates. In March 1997 the BNM tried to halt the asset mar-ket bubble by placing restrictions and ceilings on propertyand equity lending [16]. But this intervention probablycame too late.
Recognizing that these measures and BNM attitudewould eventually put an end to the property and stockboom, investors started to withdraw their funds. This onlyreinforced the downward trend on KLSE and on the prop-erty market, which already started in the beginning of1997. Few days after the restrictions were announced theindex was 17% lower than its heights month before. In thefirst-half of 1997, the capital market witnessed some spec-tacular failures in fund raising and initial public offerings.Many companies were forced to suspend their invest-ments.
Still, there were no crisis expectations at the time.Economists and analysts were only talking about a "slow-down". The Malaysian economic fundamentals seemedstrong, and the BNM had a good reputation. In mid-Maythe ringgit came under speculative pressure but a few daysof high interest rates (overnight rose as high as 18%) wassufficient to counter this pressure and fend off the specu-lation with virtually no impact on the exchange rate.Malaysian securities had a high rating -rating agencies failedaltogether to anticipate the crisis.
4.2.3. Crisis Development
Malaysia encountered serious problems on July 2, 1997when the Thai baht peg to the USD collapsed. Immediate-ly, market confidence to Southeast Asian economies wasreassessed – unexpected devaluation of the baht meantthat any country with similar economic structure, compa-rable state of fundamentals and export structure was like-ly to give up its exchange rate policy under similar circum-stances. A prolonged period of fierce speculative pressurehas started. The yield curve inverted dramatically. On July8, 1997, the BNM was forced to heavily defend the ringgit.Short-term rates reached the level of 50%. On July 11,1997, the Philippines gave up supporting its peso. The ring-git collapse was a matter of days. After the weekend, onJuly 14, the BNM abandoned its ringgit peg to the USD.Ten days after, Prime Minister Mahathir publicly blamed"rogue speculators" as responsible for the crisis. Later on,on several occasions, he suggested that currency specula-tion should be banned. Such statements further under-mined investors' confidence in Malaysia. On September 4,the ringgit broke the psychological barrier of 3 MYR/USDand continued to depreciate. In January 1998 it hit his bot-tom ever of 4.5 MYR/USD.
The actual direct cause of the crisis was a rapid rever-sal of short-term capital flows that finally turned into finan-cial panic. Malaysia, which in 1996 experienced inflows ofover 4 billion USD and expected billions more in 1997, lost
CASE Reports No. 39
[16] The restrictions introduced limited further loans to 15% (30%) for commercial (merchant) banks and ceilings on existing outstanding stockof loans, which actually was lower than the proportion of property loans in banks portfolio. That implicitly meant that banks have to contract their lend-ing, cease to roll-over pending credit, so new loans wouldn't actually be granted soon.
Figure 4-18. Malaysia: Capital flows (bln USD)
-10
-5
0
5
10
1994 1995 1996 1997 1998
total long term short term
Source: IMF
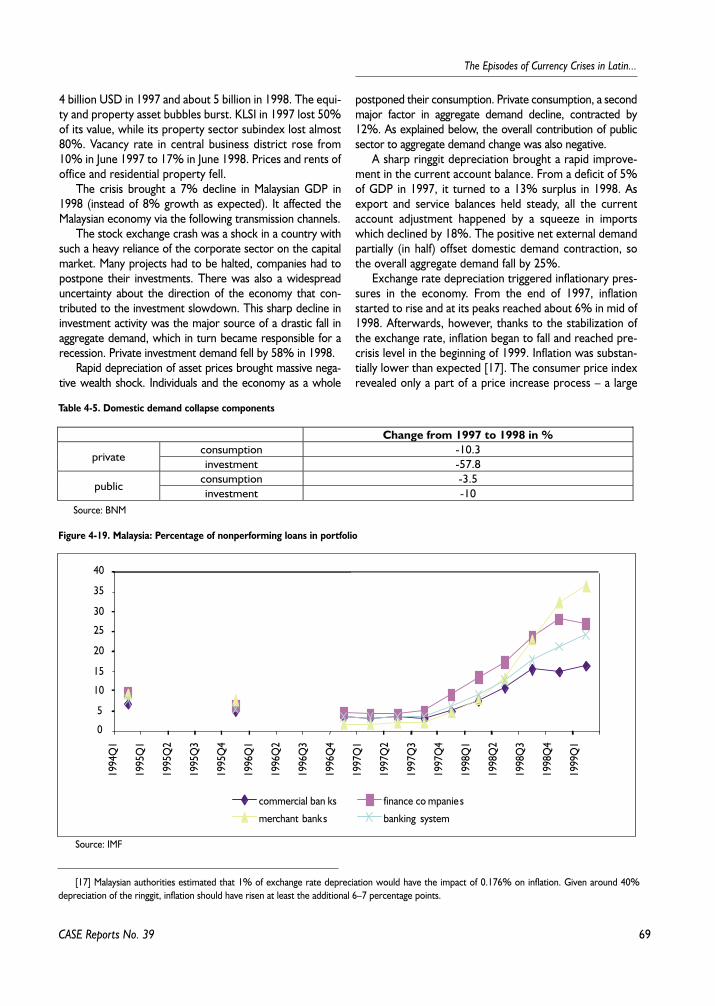
69
The Episodes of Currency Crises in Latin...
CASE Reports No. 39
4 billion USD in 1997 and about 5 billion in 1998. The equi-ty and property asset bubbles burst. KLSI in 1997 lost 50%of its value, while its property sector subindex lost almost80%. Vacancy rate in central business district rose from10% in June 1997 to 17% in June 1998. Prices and rents ofoffice and residential property fell.
The crisis brought a 7% decline in Malaysian GDP in1998 (instead of 8% growth as expected). It affected theMalaysian economy via the following transmission channels.
The stock exchange crash was a shock in a country withsuch a heavy reliance of the corporate sector on the capitalmarket. Many projects had to be halted, companies had topostpone their investments. There was also a widespreaduncertainty about the direction of the economy that con-tributed to the investment slowdown. This sharp decline ininvestment activity was the major source of a drastic fall inaggregate demand, which in turn became responsible for arecession. Private investment demand fell by 58% in 1998.
Rapid depreciation of asset prices brought massive nega-tive wealth shock. Individuals and the economy as a whole
postponed their consumption. Private consumption, a secondmajor factor in aggregate demand decline, contracted by12%. As explained below, the overall contribution of publicsector to aggregate demand change was also negative.
A sharp ringgit depreciation brought a rapid improve-ment in the current account balance. From a deficit of 5%of GDP in 1997, it turned to a 13% surplus in 1998. Asexport and service balances held steady, all the currentaccount adjustment happened by a squeeze in importswhich declined by 18%. The positive net external demandpartially (in half) offset domestic demand contraction, sothe overall aggregate demand fall by 25%.
Exchange rate depreciation triggered inflationary pres-sures in the economy. From the end of 1997, inflationstarted to rise and at its peaks reached about 6% in mid of1998. Afterwards, however, thanks to the stabilization ofthe exchange rate, inflation began to fall and reached pre-crisis level in the beginning of 1999. Inflation was substan-tially lower than expected [17]. The consumer price indexrevealed only a part of a price increase process – a large
[17] Malaysian authorities estimated that 1% of exchange rate depreciation would have the impact of 0.176% on inflation. Given around 40%depreciation of the ringgit, inflation should have risen at least the additional 6–7 percentage points.
Table 4-5. Domestic demand collapse components
Change from 1997 to 1998 in %consumption -10.3
privateinvestment -57.8
consumption -3.5public
investment -10Source: BNM
Figure 4-19. Malaysia: Percentage of nonperforming loans in portfolio
0
5
10
15
20
25
30
35
40
commercial ban ks finance co mpanies
merchant banks banking system
1994
Q1
1995
Q1
1995
Q2
1995
Q3
1995
Q4
1996
Q1
1996
Q2
1996
Q3
1996
Q4
1997
Q1
1997
Q2
1997
Q3
1997
Q4
1998
Q1
1998
Q2
1998
Q3
1998
Q4
1999
Q1
Source: IMF
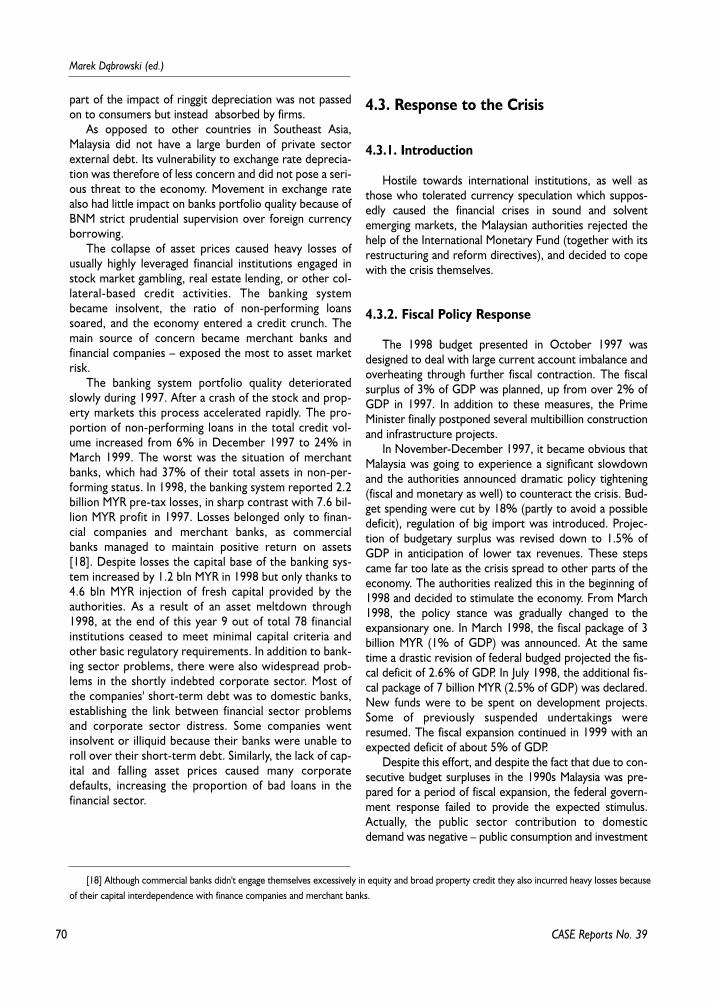
70
Marek D¹browski (ed.)
part of the impact of ringgit depreciation was not passedon to consumers but instead absorbed by firms.
As opposed to other countries in Southeast Asia,Malaysia did not have a large burden of private sectorexternal debt. Its vulnerability to exchange rate deprecia-tion was therefore of less concern and did not pose a seri-ous threat to the economy. Movement in exchange ratealso had little impact on banks portfolio quality because ofBNM strict prudential supervision over foreign currencyborrowing.
The collapse of asset prices caused heavy losses ofusually highly leveraged financial institutions engaged instock market gambling, real estate lending, or other col-lateral-based credit activities. The banking systembecame insolvent, the ratio of non-performing loanssoared, and the economy entered a credit crunch. Themain source of concern became merchant banks andfinancial companies – exposed the most to asset marketrisk.
The banking system portfolio quality deterioratedslowly during 1997. After a crash of the stock and prop-erty markets this process accelerated rapidly. The pro-portion of non-performing loans in the total credit vol-ume increased from 6% in December 1997 to 24% inMarch 1999. The worst was the situation of merchantbanks, which had 37% of their total assets in non-per-forming status. In 1998, the banking system reported 2.2billion MYR pre-tax losses, in sharp contrast with 7.6 bil-lion MYR profit in 1997. Losses belonged only to finan-cial companies and merchant banks, as commercialbanks managed to maintain positive return on assets[18]. Despite losses the capital base of the banking sys-tem increased by 1.2 bln MYR in 1998 but only thanks to4.6 bln MYR injection of fresh capital provided by theauthorities. As a result of an asset meltdown through1998, at the end of this year 9 out of total 78 financialinstitutions ceased to meet minimal capital criteria andother basic regulatory requirements. In addition to bank-ing sector problems, there were also widespread prob-lems in the shortly indebted corporate sector. Most ofthe companies' short-term debt was to domestic banks,establishing the link between financial sector problemsand corporate sector distress. Some companies wentinsolvent or illiquid because their banks were unable toroll over their short-term debt. Similarly, the lack of cap-ital and falling asset prices caused many corporatedefaults, increasing the proportion of bad loans in thefinancial sector.
4.3. Response to the Crisis
4.3.1. Introduction
Hostile towards international institutions, as well asthose who tolerated currency speculation which suppos-edly caused the financial crises in sound and solventemerging markets, the Malaysian authorities rejected thehelp of the International Monetary Fund (together with itsrestructuring and reform directives), and decided to copewith the crisis themselves.
4.3.2. Fiscal Policy Response
The 1998 budget presented in October 1997 wasdesigned to deal with large current account imbalance andoverheating through further fiscal contraction. The fiscalsurplus of 3% of GDP was planned, up from over 2% ofGDP in 1997. In addition to these measures, the PrimeMinister finally postponed several multibillion constructionand infrastructure projects.
In November-December 1997, it became obvious thatMalaysia was going to experience a significant slowdownand the authorities announced dramatic policy tightening(fiscal and monetary as well) to counteract the crisis. Bud-get spending were cut by 18% (partly to avoid a possibledeficit), regulation of big import was introduced. Projec-tion of budgetary surplus was revised down to 1.5% ofGDP in anticipation of lower tax revenues. These stepscame far too late as the crisis spread to other parts of theeconomy. The authorities realized this in the beginning of1998 and decided to stimulate the economy. From March1998, the policy stance was gradually changed to theexpansionary one. In March 1998, the fiscal package of 3billion MYR (1% of GDP) was announced. At the sametime a drastic revision of federal budged projected the fis-cal deficit of 2.6% of GDP. In July 1998, the additional fis-cal package of 7 billion MYR (2.5% of GDP) was declared.New funds were to be spent on development projects.Some of previously suspended undertakings wereresumed. The fiscal expansion continued in 1999 with anexpected deficit of about 5% of GDP.
Despite this effort, and despite the fact that due to con-secutive budget surpluses in the 1990s Malaysia was pre-pared for a period of fiscal expansion, the federal govern-ment response failed to provide the expected stimulus.Actually, the public sector contribution to domesticdemand was negative – public consumption and investment
CASE Reports No. 39
[18] Although commercial banks didn't engage themselves excessively in equity and broad property credit they also incurred heavy losses becauseof their capital interdependence with finance companies and merchant banks.
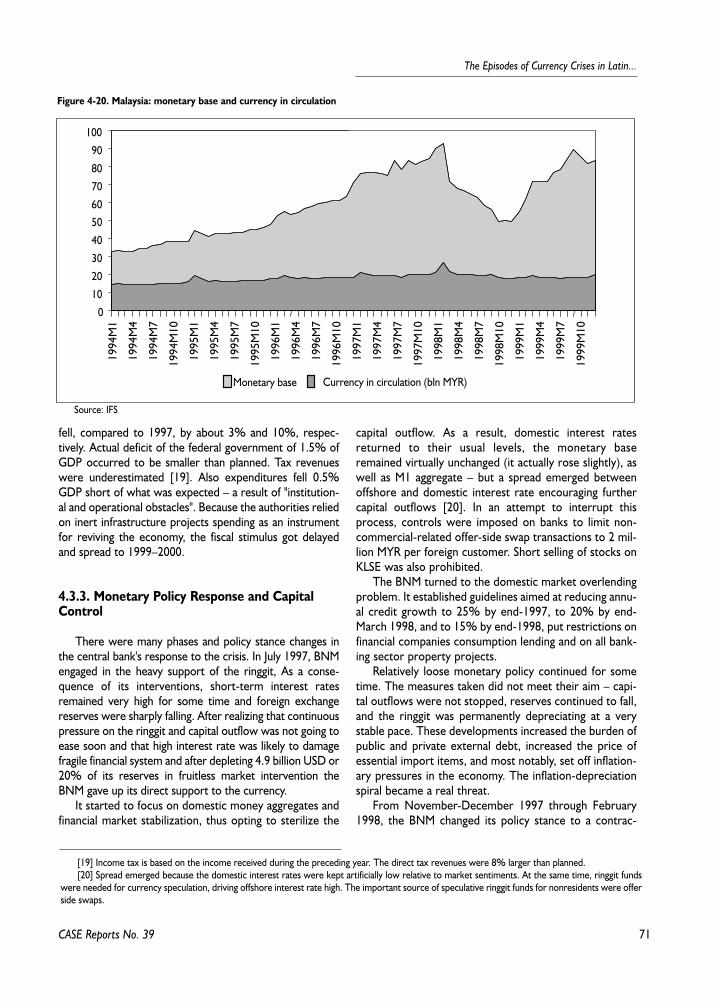
71
The Episodes of Currency Crises in Latin...
fell, compared to 1997, by about 3% and 10%, respec-tively. Actual deficit of the federal government of 1.5% ofGDP occurred to be smaller than planned. Tax revenueswere underestimated [19]. Also expenditures fell 0.5%GDP short of what was expected – a result of "institution-al and operational obstacles". Because the authorities reliedon inert infrastructure projects spending as an instrumentfor reviving the economy, the fiscal stimulus got delayedand spread to 1999–2000.
4.3.3. Monetary Policy Response and Capital Control
There were many phases and policy stance changes inthe central bank's response to the crisis. In July 1997, BNMengaged in the heavy support of the ringgit, As a conse-quence of its interventions, short-term interest ratesremained very high for some time and foreign exchangereserves were sharply falling. After realizing that continuouspressure on the ringgit and capital outflow was not going toease soon and that high interest rate was likely to damagefragile financial system and after depleting 4.9 billion USD or20% of its reserves in fruitless market intervention theBNM gave up its direct support to the currency.
It started to focus on domestic money aggregates andfinancial market stabilization, thus opting to sterilize the
capital outflow. As a result, domestic interest ratesreturned to their usual levels, the monetary baseremained virtually unchanged (it actually rose slightly), aswell as M1 aggregate – but a spread emerged betweenoffshore and domestic interest rate encouraging furthercapital outflows [20]. In an attempt to interrupt thisprocess, controls were imposed on banks to limit non-commercial-related offer-side swap transactions to 2 mil-lion MYR per foreign customer. Short selling of stocks onKLSE was also prohibited.
The BNM turned to the domestic market overlendingproblem. It established guidelines aimed at reducing annu-al credit growth to 25% by end-1997, to 20% by end-March 1998, and to 15% by end-1998, put restrictions onfinancial companies consumption lending and on all bank-ing sector property projects.
Relatively loose monetary policy continued for sometime. The measures taken did not meet their aim – capi-tal outflows were not stopped, reserves continued to fall,and the ringgit was permanently depreciating at a verystable pace. These developments increased the burden ofpublic and private external debt, increased the price ofessential import items, and most notably, set off inflation-ary pressures in the economy. The inflation-depreciationspiral became a real threat.
From November-December 1997 through February1998, the BNM changed its policy stance to a contrac-
CASE Reports No. 39
[19] Income tax is based on the income received during the preceding year. The direct tax revenues were 8% larger than planned.[20] Spread emerged because the domestic interest rates were kept artificially low relative to market sentiments. At the same time, ringgit funds
were needed for currency speculation, driving offshore interest rate high. The important source of speculative ringgit funds for nonresidents were offerside swaps.
Figure 4-20. Malaysia: monetary base and currency in circulation
0
10
20
30
40
50
60
70
80
90
100
Monetary base Currency in circulation (bln MYR)
1994
M1
1994
M4
1994
M7
1994
M10
1995
M1
1995
M4
1995
M7
1995
M10
1996
M1
1996
M4
1996
M7
1996
M10
1997
M1
1997
M4
1997
M7
1997
M10
1998
M1
1998
M4
1998
M7
1998
M10
1999
M1
1999
M4
1999
M7
1999
M10
Source: IFS
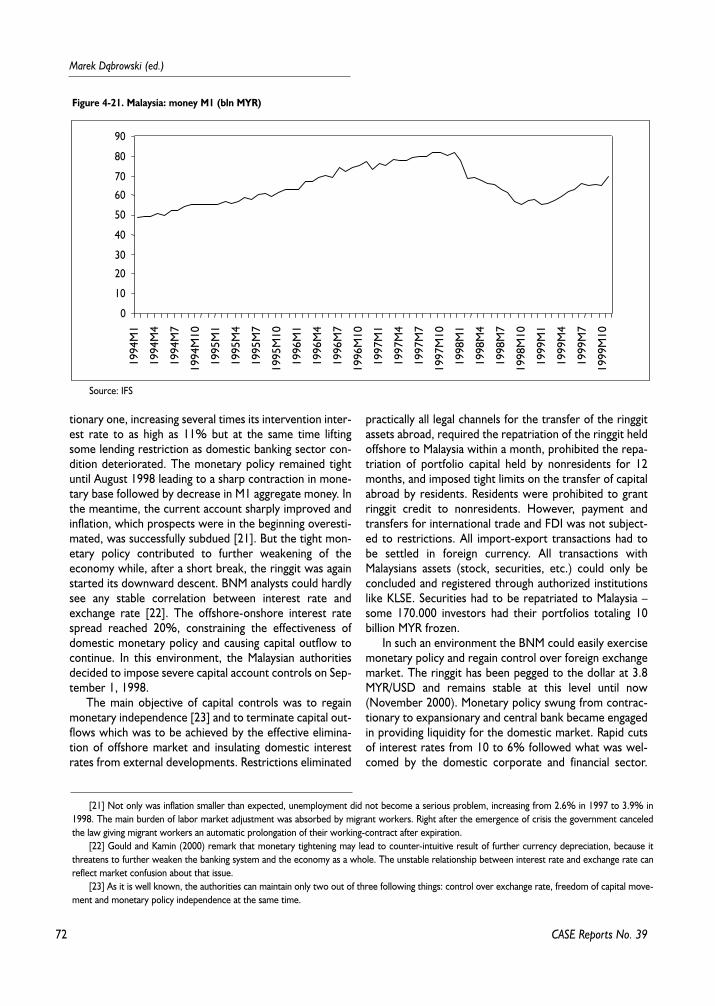
72
Marek D¹browski (ed.)
tionary one, increasing several times its intervention inter-est rate to as high as 11% but at the same time liftingsome lending restriction as domestic banking sector con-dition deteriorated. The monetary policy remained tightuntil August 1998 leading to a sharp contraction in mone-tary base followed by decrease in M1 aggregate money. Inthe meantime, the current account sharply improved andinflation, which prospects were in the beginning overesti-mated, was successfully subdued [21]. But the tight mon-etary policy contributed to further weakening of theeconomy while, after a short break, the ringgit was againstarted its downward descent. BNM analysts could hardlysee any stable correlation between interest rate andexchange rate [22]. The offshore-onshore interest ratespread reached 20%, constraining the effectiveness ofdomestic monetary policy and causing capital outflow tocontinue. In this environment, the Malaysian authoritiesdecided to impose severe capital account controls on Sep-tember 1, 1998.
The main objective of capital controls was to regainmonetary independence [23] and to terminate capital out-flows which was to be achieved by the effective elimina-tion of offshore market and insulating domestic interestrates from external developments. Restrictions eliminated
practically all legal channels for the transfer of the ringgitassets abroad, required the repatriation of the ringgit heldoffshore to Malaysia within a month, prohibited the repa-triation of portfolio capital held by nonresidents for 12months, and imposed tight limits on the transfer of capitalabroad by residents. Residents were prohibited to grantringgit credit to nonresidents. However, payment andtransfers for international trade and FDI was not subject-ed to restrictions. All import-export transactions had tobe settled in foreign currency. All transactions withMalaysians assets (stock, securities, etc.) could only beconcluded and registered through authorized institutionslike KLSE. Securities had to be repatriated to Malaysia –some 170.000 investors had their portfolios totaling 10billion MYR frozen.
In such an environment the BNM could easily exercisemonetary policy and regain control over foreign exchangemarket. The ringgit has been pegged to the dollar at 3.8MYR/USD and remains stable at this level until now(November 2000). Monetary policy swung from contrac-tionary to expansionary and central bank became engagedin providing liquidity for the domestic market. Rapid cutsof interest rates from 10 to 6% followed what was wel-comed by the domestic corporate and financial sector.
CASE Reports No. 39
Figure 4-21. Malaysia: money M1 (bln MYR)
0
10
20
30
40
50
60
70
80
9019
94M
1
1994
M4
1994
M7
1994
M10
1995
M1
1995
M4
1995
M7
1995
M10
1996
M1
1996
M4
1996
M7
1996
M10
1997
M1
1997
M4
1997
M7
1997
M10
1998
M1
1998
M4
1998
M7
1998
M10
1999
M1
1999
M4
1999
M7
1999
M10
Source: IFS
[21] Not only was inflation smaller than expected, unemployment did not become a serious problem, increasing from 2.6% in 1997 to 3.9% in1998. The main burden of labor market adjustment was absorbed by migrant workers. Right after the emergence of crisis the government canceledthe law giving migrant workers an automatic prolongation of their working-contract after expiration.
[22] Gould and Kamin (2000) remark that monetary tightening may lead to counter-intuitive result of further currency depreciation, because itthreatens to further weaken the banking system and the economy as a whole. The unstable relationship between interest rate and exchange rate canreflect market confusion about that issue.
[23] As it is well known, the authorities can maintain only two out of three following things: control over exchange rate, freedom of capital move-ment and monetary policy independence at the same time.
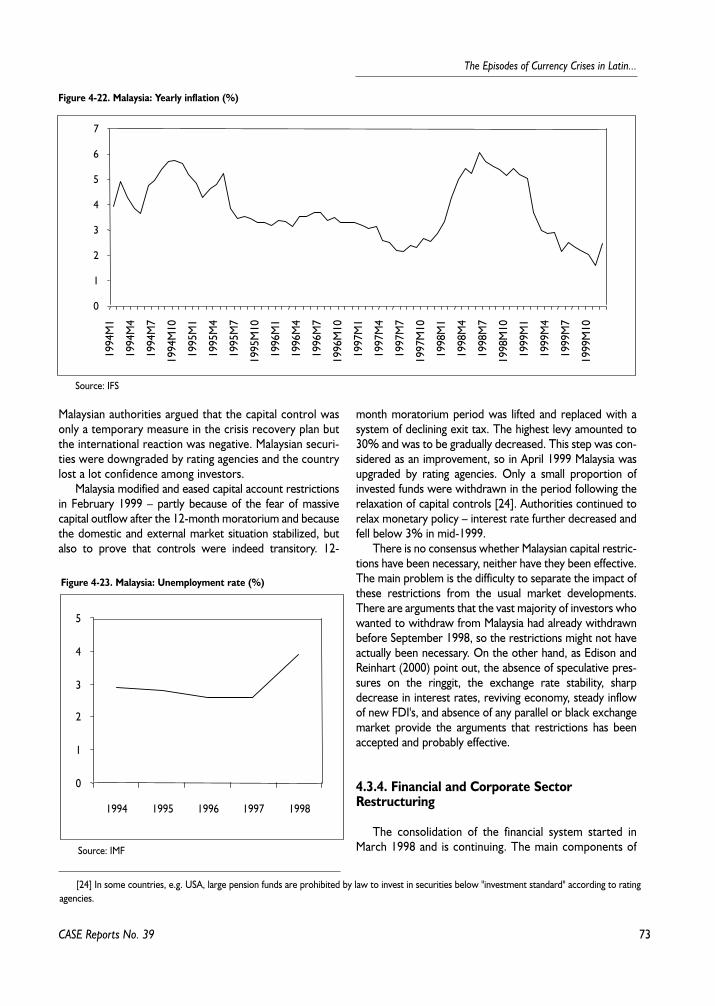
73
The Episodes of Currency Crises in Latin...
Malaysian authorities argued that the capital control wasonly a temporary measure in the crisis recovery plan butthe international reaction was negative. Malaysian securi-ties were downgraded by rating agencies and the countrylost a lot confidence among investors.
Malaysia modified and eased capital account restrictionsin February 1999 – partly because of the fear of massivecapital outflow after the 12-month moratorium and becausethe domestic and external market situation stabilized, butalso to prove that controls were indeed transitory. 12-
month moratorium period was lifted and replaced with asystem of declining exit tax. The highest levy amounted to30% and was to be gradually decreased. This step was con-sidered as an improvement, so in April 1999 Malaysia wasupgraded by rating agencies. Only a small proportion ofinvested funds were withdrawn in the period following therelaxation of capital controls [24]. Authorities continued torelax monetary policy – interest rate further decreased andfell below 3% in mid-1999.
There is no consensus whether Malaysian capital restric-tions have been necessary, neither have they been effective.The main problem is the difficulty to separate the impact ofthese restrictions from the usual market developments.There are arguments that the vast majority of investors whowanted to withdraw from Malaysia had already withdrawnbefore September 1998, so the restrictions might not haveactually been necessary. On the other hand, as Edison andReinhart (2000) point out, the absence of speculative pres-sures on the ringgit, the exchange rate stability, sharpdecrease in interest rates, reviving economy, steady inflowof new FDI's, and absence of any parallel or black exchangemarket provide the arguments that restrictions has beenaccepted and probably effective.
4.3.4. Financial and Corporate SectorRestructuring
The consolidation of the financial system started inMarch 1998 and is continuing. The main components of
CASE Reports No. 39
Figure 4-22. Malaysia: Yearly inflation (%)
0
1
2
3
4
5
6
7
1994
M1
1994
M4
1994
M7
1994
M10
1995
M1
1995
M4
1995
M7
1995
M10
1996
M1
1996
M4
1996
M7
1996
M10
1997
M1
1997
M4
1997
M7
1997
M10
1998
M1
1998
M4
1998
M7
1998
M10
1999
M1
1999
M4
1999
M7
1999
M10
Source: IFS
Figure 4-23. Malaysia: Unemployment rate (%)
0
1
2
3
4
5
1994 1995 1996 1997 1998
Source: IMF
[24] In some countries, e.g. USA, large pension funds are prohibited by law to invest in securities below "investment standard" according to ratingagencies.
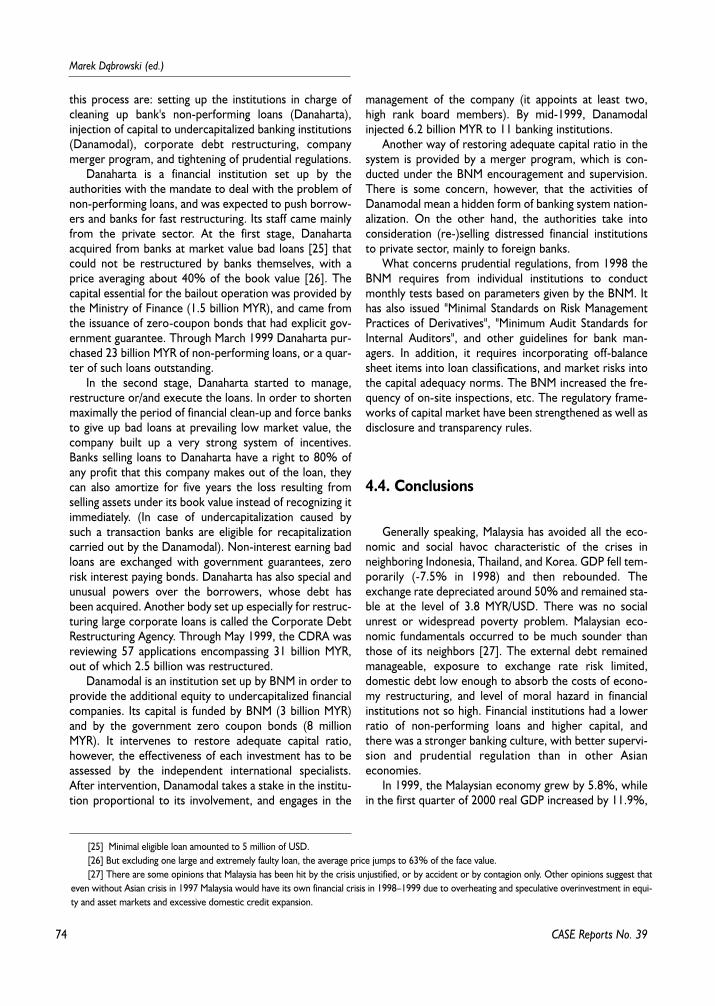
74
Marek D¹browski (ed.)
this process are: setting up the institutions in charge ofcleaning up bank's non-performing loans (Danaharta),injection of capital to undercapitalized banking institutions(Danamodal), corporate debt restructuring, companymerger program, and tightening of prudential regulations.
Danaharta is a financial institution set up by theauthorities with the mandate to deal with the problem ofnon-performing loans, and was expected to push borrow-ers and banks for fast restructuring. Its staff came mainlyfrom the private sector. At the first stage, Danahartaacquired from banks at market value bad loans [25] thatcould not be restructured by banks themselves, with aprice averaging about 40% of the book value [26]. Thecapital essential for the bailout operation was provided bythe Ministry of Finance (1.5 billion MYR), and came fromthe issuance of zero-coupon bonds that had explicit gov-ernment guarantee. Through March 1999 Danaharta pur-chased 23 billion MYR of non-performing loans, or a quar-ter of such loans outstanding.
In the second stage, Danaharta started to manage,restructure or/and execute the loans. In order to shortenmaximally the period of financial clean-up and force banksto give up bad loans at prevailing low market value, thecompany built up a very strong system of incentives.Banks selling loans to Danaharta have a right to 80% ofany profit that this company makes out of the loan, theycan also amortize for five years the loss resulting fromselling assets under its book value instead of recognizing itimmediately. (In case of undercapitalization caused bysuch a transaction banks are eligible for recapitalizationcarried out by the Danamodal). Non-interest earning badloans are exchanged with government guarantees, zerorisk interest paying bonds. Danaharta has also special andunusual powers over the borrowers, whose debt hasbeen acquired. Another body set up especially for restruc-turing large corporate loans is called the Corporate DebtRestructuring Agency. Through May 1999, the CDRA wasreviewing 57 applications encompassing 31 billion MYR,out of which 2.5 billion was restructured.
Danamodal is an institution set up by BNM in order toprovide the additional equity to undercapitalized financialcompanies. Its capital is funded by BNM (3 billion MYR)and by the government zero coupon bonds (8 millionMYR). It intervenes to restore adequate capital ratio,however, the effectiveness of each investment has to beassessed by the independent international specialists.After intervention, Danamodal takes a stake in the institu-tion proportional to its involvement, and engages in the
management of the company (it appoints at least two,high rank board members). By mid-1999, Danamodalinjected 6.2 billion MYR to 11 banking institutions.
Another way of restoring adequate capital ratio in thesystem is provided by a merger program, which is con-ducted under the BNM encouragement and supervision.There is some concern, however, that the activities ofDanamodal mean a hidden form of banking system nation-alization. On the other hand, the authorities take intoconsideration (re-)selling distressed financial institutionsto private sector, mainly to foreign banks.
What concerns prudential regulations, from 1998 theBNM requires from individual institutions to conductmonthly tests based on parameters given by the BNM. Ithas also issued "Minimal Standards on Risk ManagementPractices of Derivatives", "Minimum Audit Standards forInternal Auditors", and other guidelines for bank man-agers. In addition, it requires incorporating off-balancesheet items into loan classifications, and market risks intothe capital adequacy norms. The BNM increased the fre-quency of on-site inspections, etc. The regulatory frame-works of capital market have been strengthened as well asdisclosure and transparency rules.
4.4. Conclusions
Generally speaking, Malaysia has avoided all the eco-nomic and social havoc characteristic of the crises inneighboring Indonesia, Thailand, and Korea. GDP fell tem-porarily (-7.5% in 1998) and then rebounded. Theexchange rate depreciated around 50% and remained sta-ble at the level of 3.8 MYR/USD. There was no socialunrest or widespread poverty problem. Malaysian eco-nomic fundamentals occurred to be much sounder thanthose of its neighbors [27]. The external debt remainedmanageable, exposure to exchange rate risk limited,domestic debt low enough to absorb the costs of econo-my restructuring, and level of moral hazard in financialinstitutions not so high. Financial institutions had a lowerratio of non-performing loans and higher capital, andthere was a stronger banking culture, with better supervi-sion and prudential regulation than in other Asianeconomies.
In 1999, the Malaysian economy grew by 5.8%, whilein the first quarter of 2000 real GDP increased by 11.9%,
CASE Reports No. 39
[25] Minimal eligible loan amounted to 5 million of USD.[26] But excluding one large and extremely faulty loan, the average price jumps to 63% of the face value.[27] There are some opinions that Malaysia has been hit by the crisis unjustified, or by accident or by contagion only. Other opinions suggest that
even without Asian crisis in 1997 Malaysia would have its own financial crisis in 1998–1999 due to overheating and speculative overinvestment in equi-ty and asset markets and excessive domestic credit expansion.
75
The Episodes of Currency Crises in Latin...
and in the second quarter by 8.8%. FDI continued to flowin, inflation moderated to 1.5%, trade surplus remainedon the high level of 7.7 billion USD, and BNM's interna-tional reserves – at the level of 30 billion USD. The over-all risk-weighted capital ratio of the banking systemamounted to 12.6% with non-performing loan propor-tion equal to 6.4%. The cost of fiscal stimulus amountedto 5% of GDP, also less than projected. The exchangerate remains stable, but on somehow undervalued level[28], which gives good prospects for current account butmight put some inflationary pressure on the economy.Asset prices stand at around 60% of their pre-crisis level.The cost of restructuring of the banking sector totaled toabout 10% of GDP, which was less than expected
Contrary to the macroeconomic "soundness", micro-economic reforms have been very slow. The consolida-tion of the financial system has not been completed. UntilAugust 2000, Danaharta acquired, restructured and dis-posed a total 31.5 billion MYR of non-performing assetsand CDRA completed 27 restructuring cases, involving23.6 billion MYR. However, there are allegations, thatsome of the "restructuring" that take place is just a reshuf-fling of debt among subsidiaries in order to avoid insol-vency. In other cases a debt solution is obstructed by thepolitical connections of debtors. Although Malaysia is aleader in restructuring among post-crisis Asian countries,the failure to clean up the debt overhang can have seriousnegative consequences for the country.
The stock market has not yet resumed the role of afund-rising institution.
Malaysia is still maintaining a rather restrictive capitalaccount regime and because of that is probably not goingto fully regain investors' confidence any time soon.
Appendix: Chronology of the Malaysian1997–1998 Crisis
1997March 28, Malaysia central bank restricts loans to
property and stocks to head off a crisis. early-May, Japanese officials, concerned about the
decline of the yen, hinted that they might raise interestrate. Investors start gradual withdrawal from South EastAsian markets.
mid-May, The BNM defends ringgit with few days ofvery high interest rates.
July 2, Thai baht collapses and turmoil begins.July 8, Malaysian central bank, Bank Negara, has to
intervene aggressively to defend the ringgit. The inter-
vention works for a while (the currency slightly appreci-ates).
July 14, Malaysia central bank abandons the defense ofthe ringgit and engages in stabilizing domestic moneymarket with relatively loose monetary policy.
July 24, Ringgit hits 38-month low of 2.65 MYR/USD. July 26, Prime Minister Mahathir blames George Soros
and other "rogue speculators" for the attack on the ring-git.
September 4, Ringgit breaks through 3 MYR/USD. September 20, Mahathir tells the public, that specula-
tion is immoral and should be stopped. October 1, Mahathir repeats his call for tighter regu-
lation, or a total ban on forex trading. The ringgit falls 4%in less than 2 hours to a low of 3.4MYR/USD.
October 17, Malaysia tightens budget in effort to stopthe economy from sliding into recession.
December 5, Malaysia finally and radically changes itspolicy and imposes tough reforms in order to deal with acrisis. These include an 18% cut in government spending,restriction on large-volume import, on bank credit and instock market regulations. There were to be "no questionof bailout" for financially ailing companies.
1998 January-February, Several increases in BNM's inter-
vention interest rate were planned to stop the currencyfrom depreciating and restrict inflationary pressures
March, The severity of the crisis is gradually recog-nized and the fiscal policy changes to more expansionary.The fiscal package of 3 billion MYR (1% of GDP) isannounced and a drastic revision of federal budged aimsthe deficit of 2.6% of GDP.
July, Another additional fiscal package (7 billion MYR(2.5% of GDP)) announced in order to stimulate theeconomy.
January-August, Despite the austerity fiscal measuresand firm monetary policy the crisis and the capital outflowcontinue.
September 1, Malaysia introduces capital controls;financial investment can be repatriated only after a 1-yearperiod. Rental and profits from sales can be repatriated.
1999 February 5, Malaysia replaces one year holding period
with exit tax. Repatriation of principal and profits will besubjected to a maximum levy of 30%.
CASE Reports No. 39
[28] The estimates of current undervaluation (exchange rate of 3.8 MYR/USD) reach even 19%.
76
Marek D¹browski (ed.)
References
Annual Report on Exchange Rate Arrangement, IMF1996, 1997, 1998, 1999, 2000
Bank Negara of Malaysia (BNM), Annual Report, 1998,1999
Corsetti G., Pesenti P., Roubini N.(1998). ”WhatCaused the Asian Currency and Financial Crisis”, Bancad'Italia, Temi di discussione 343.
Claessens S., Djankov S., Lang L.(1998). ”East AsianCorporates: Growth, Financing and Risks over the LastDecade”. Mimeo, World Bank.
Dato' Shafie Mohd. Salleh (2000). Statement by theHon. Dato' Shafie Mohd. Salleh, Gov. of the Fund and theBank for Malaysia at the Joint Annual Discussion, IMF.
Delhaize P. (1999). ”Asia in Crisis”. John Wiley&Sons.Edison H.J., Reinhart C.M. (2000). ”Capital Controls
During Financial Crises: the Case of Malaysia and Thai-land”. Board of Governors of the FRS IFDP 662.
Edison H.J. (2000). ”Do Indicators of Financial CrisesWork? An Evaluation of an Early Warning System”. Boardof Governors of the Federal Reserve System IFDP 675.
Financial Times, 1996: 26-17 X; 1997: 19 V, 21-22 VI,26-27 VII, 8 X.
Gould D.M., Kamin S.B. (2000). ”The Impact of Mo-netary Policy on Exchange Rates During Financial Crises”.Board of Governors of the Federal Reserve System IFDP675
IMF (1999a). Malaysia, selected issues.IMF (1999b). Malaysia: Recent Economic Develop-
ment.IMF (2000). Recovery from the Asian Crisis and the
role of the IMF.Milesi-Ferretti G., Razin A. (1996). ”Current Account
Sustainability, Selected East Asian and Latin AmericaExperiences”. IMF WP 96/10.
Kamin S. (1999). ”The Current International FinancialCrisis, How Much is New?”. Journal of InternationalMoney and Finance, vol.18, no.4.
Krugman P. (1994). ”The Myth of Asia's Miracle”. For-eign Affairs, Nov.-Dec.
Krugman P. (1998). ”What Happened to Asia”. Mimeo.Sarel M. (1997). ”Growth and Productivity in ASEAN
Countries”. IMF WP 97/97.Sarno L., Taylor M.P. (1999). ”Moral Hazard, Asset
Price Bubbles, Capital Flows and East Asian Crisis, a FirstTest”. Journal of International Money and Finance, vol.18,no.4, 1999.
Stone M.R. (1998). ”Corporate Debt Restructuring inEast Asia: Some Lessons from International Experience”.IMF PPAA 98/13.
World Bank (1998). ”Responding to the East Asian Cri-sis”.
CASE Reports No. 39
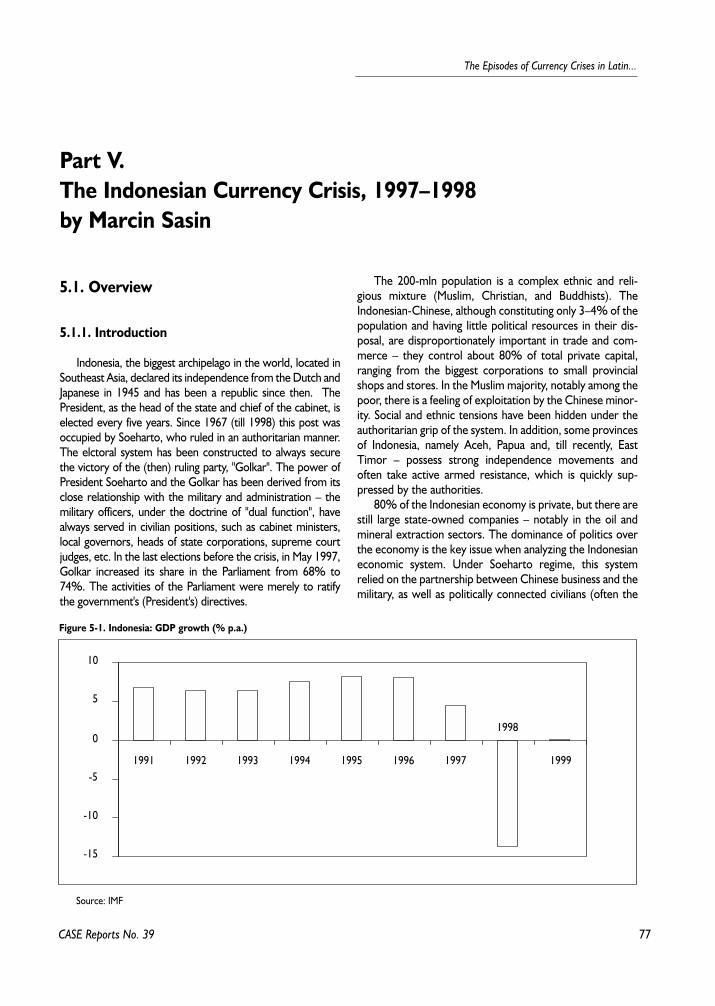
77
The Episodes of Currency Crises in Latin...
CASE Reports No. 39
5.1. Overview
5.1.1. Introduction
Indonesia, the biggest archipelago in the world, located inSoutheast Asia, declared its independence from the Dutch andJapanese in 1945 and has been a republic since then. ThePresident, as the head of the state and chief of the cabinet, iselected every five years. Since 1967 (till 1998) this post wasoccupied by Soeharto, who ruled in an authoritarian manner.The elctoral system has been constructed to always securethe victory of the (then) ruling party, "Golkar". The power ofPresident Soeharto and the Golkar has been derived from itsclose relationship with the military and administration – themilitary officers, under the doctrine of "dual function", havealways served in civilian positions, such as cabinet ministers,local governors, heads of state corporations, supreme courtjudges, etc. In the last elections before the crisis, in May 1997,Golkar increased its share in the Parliament from 68% to74%. The activities of the Parliament were merely to ratifythe government's (President's) directives.
The 200-mln population is a complex ethnic and reli-gious mixture (Muslim, Christian, and Buddhists). TheIndonesian-Chinese, although constituting only 3–4% of thepopulation and having little political resources in their dis-posal, are disproportionately important in trade and com-merce – they control about 80% of total private capital,ranging from the biggest corporations to small provincialshops and stores. In the Muslim majority, notably among thepoor, there is a feeling of exploitation by the Chinese minor-ity. Social and ethnic tensions have been hidden under theauthoritarian grip of the system. In addition, some provincesof Indonesia, namely Aceh, Papua and, till recently, EastTimor – possess strong independence movements andoften take active armed resistance, which is quickly sup-pressed by the authorities.
80% of the Indonesian economy is private, but there arestill large state-owned companies – notably in the oil andmineral extraction sectors. The dominance of politics overthe economy is the key issue when analyzing the Indonesianeconomic system. Under Soeharto regime, this systemrelied on the partnership between Chinese business and themilitary, as well as politically connected civilians (often the
Part V.The Indonesian Currency Crisis, 1997–1998by Marcin Sasin
Figure 5-1. Indonesia: GDP growth (% p.a.)
-15
-10
-5
0
5
10
1991 1992 1993 1994 1995 1996 1997
1998
1999
Source: IMF
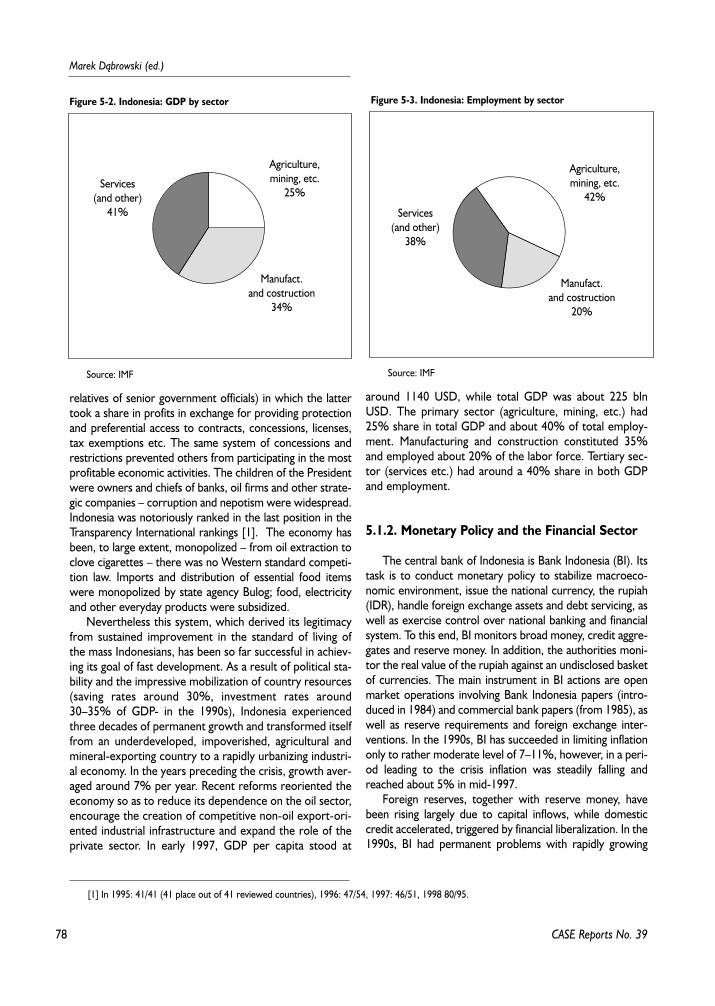
78
Marek D¹browski (ed.)
CASE Reports No. 39
relatives of senior government officials) in which the lattertook a share in profits in exchange for providing protectionand preferential access to contracts, concessions, licenses,tax exemptions etc. The same system of concessions andrestrictions prevented others from participating in the mostprofitable economic activities. The children of the Presidentwere owners and chiefs of banks, oil firms and other strate-gic companies – corruption and nepotism were widespread.Indonesia was notoriously ranked in the last position in theTransparency International rankings [1]. The economy hasbeen, to large extent, monopolized – from oil extraction toclove cigarettes – there was no Western standard competi-tion law. Imports and distribution of essential food itemswere monopolized by state agency Bulog; food, electricityand other everyday products were subsidized.
Nevertheless this system, which derived its legitimacyfrom sustained improvement in the standard of living ofthe mass Indonesians, has been so far successful in achiev-ing its goal of fast development. As a result of political sta-bility and the impressive mobilization of country resources(saving rates around 30%, investment rates around30–35% of GDP- in the 1990s), Indonesia experiencedthree decades of permanent growth and transformed itselffrom an underdeveloped, impoverished, agricultural andmineral-exporting country to a rapidly urbanizing industri-al economy. In the years preceding the crisis, growth aver-aged around 7% per year. Recent reforms reoriented theeconomy so as to reduce its dependence on the oil sector,encourage the creation of competitive non-oil export-ori-ented industrial infrastructure and expand the role of theprivate sector. In early 1997, GDP per capita stood at
around 1140 USD, while total GDP was about 225 blnUSD. The primary sector (agriculture, mining, etc.) had25% share in total GDP and about 40% of total employ-ment. Manufacturing and construction constituted 35%and employed about 20% of the labor force. Tertiary sec-tor (services etc.) had around a 40% share in both GDPand employment.
5.1.2. Monetary Policy and the Financial Sector
The central bank of Indonesia is Bank Indonesia (BI). Itstask is to conduct monetary policy to stabilize macroeco-nomic environment, issue the national currency, the rupiah(IDR), handle foreign exchange assets and debt servicing, aswell as exercise control over national banking and financialsystem. To this end, BI monitors broad money, credit aggre-gates and reserve money. In addition, the authorities moni-tor the real value of the rupiah against an undisclosed basketof currencies. The main instrument in BI actions are openmarket operations involving Bank Indonesia papers (intro-duced in 1984) and commercial bank papers (from 1985), aswell as reserve requirements and foreign exchange inter-ventions. In the 1990s, BI has succeeded in limiting inflationonly to rather moderate level of 7–11%, however, in a peri-od leading to the crisis inflation was steadily falling andreached about 5% in mid-1997.
Foreign reserves, together with reserve money, havebeen rising largely due to capital inflows, while domesticcredit accelerated, triggered by financial liberalization. In the1990s, BI had permanent problems with rapidly growing
[1] In 1995: 41/41 (41 place out of 41 reviewed countries), 1996: 47/54, 1997: 46/51, 1998 80/95.
Figure 5-2. Indonesia: GDP by sector
Agriculture,mining, etc.
25%
Manufact.and costruction
34%
Services(and other)
41%
Source: IMF
Figure 5-3. Indonesia: Employment by sector
Agriculture,mining, etc.
42%
Manufact.and costruction
20%
Services(and other)
38%
Source: IMF
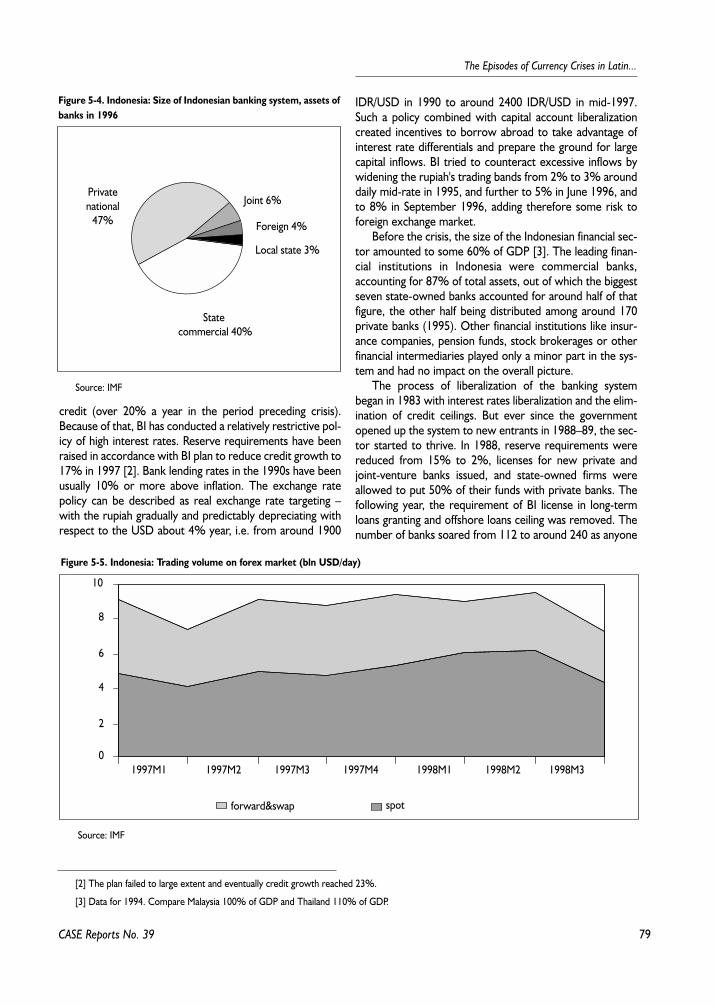
79
The Episodes of Currency Crises in Latin...
CASE Reports No. 39
credit (over 20% a year in the period preceding crisis).Because of that, BI has conducted a relatively restrictive pol-icy of high interest rates. Reserve requirements have beenraised in accordance with BI plan to reduce credit growth to17% in 1997 [2]. Bank lending rates in the 1990s have beenusually 10% or more above inflation. The exchange ratepolicy can be described as real exchange rate targeting –with the rupiah gradually and predictably depreciating withrespect to the USD about 4% year, i.e. from around 1900
IDR/USD in 1990 to around 2400 IDR/USD in mid-1997.Such a policy combined with capital account liberalizationcreated incentives to borrow abroad to take advantage ofinterest rate differentials and prepare the ground for largecapital inflows. BI tried to counteract excessive inflows bywidening the rupiah's trading bands from 2% to 3% arounddaily mid-rate in 1995, and further to 5% in June 1996, andto 8% in September 1996, adding therefore some risk toforeign exchange market.
Before the crisis, the size of the Indonesian financial sec-tor amounted to some 60% of GDP [3]. The leading finan-cial institutions in Indonesia were commercial banks,accounting for 87% of total assets, out of which the biggestseven state-owned banks accounted for around half of thatfigure, the other half being distributed among around 170private banks (1995). Other financial institutions like insur-ance companies, pension funds, stock brokerages or otherfinancial intermediaries played only a minor part in the sys-tem and had no impact on the overall picture.
The process of liberalization of the banking systembegan in 1983 with interest rates liberalization and the elim-ination of credit ceilings. But ever since the governmentopened up the system to new entrants in 1988–89, the sec-tor started to thrive. In 1988, reserve requirements werereduced from 15% to 2%, licenses for new private andjoint-venture banks issued, and state-owned firms wereallowed to put 50% of their funds with private banks. Thefollowing year, the requirement of BI license in long-termloans granting and offshore loans ceiling was removed. Thenumber of banks soared from 112 to around 240 as anyone
Figure 5-4. Indonesia: Size of Indonesian banking system, assets ofbanks in 1996
Joint 6%
Foreign 4%
Local state 3%
State commercial 40%
Privatenational
47%
Source: IMF
Figure 5-5. Indonesia: Trading volume on forex market (bln USD/day)
0
2
4
6
8
10
forward&swap spot
1997M1 1997M2 1997M3 1997M4 1998M1 1998M2 1998M3
Source: IMF
[2] The plan failed to large extent and eventually credit growth reached 23%.
[3] Data for 1994. Compare Malaysia 100% of GDP and Thailand 110% of GDP.
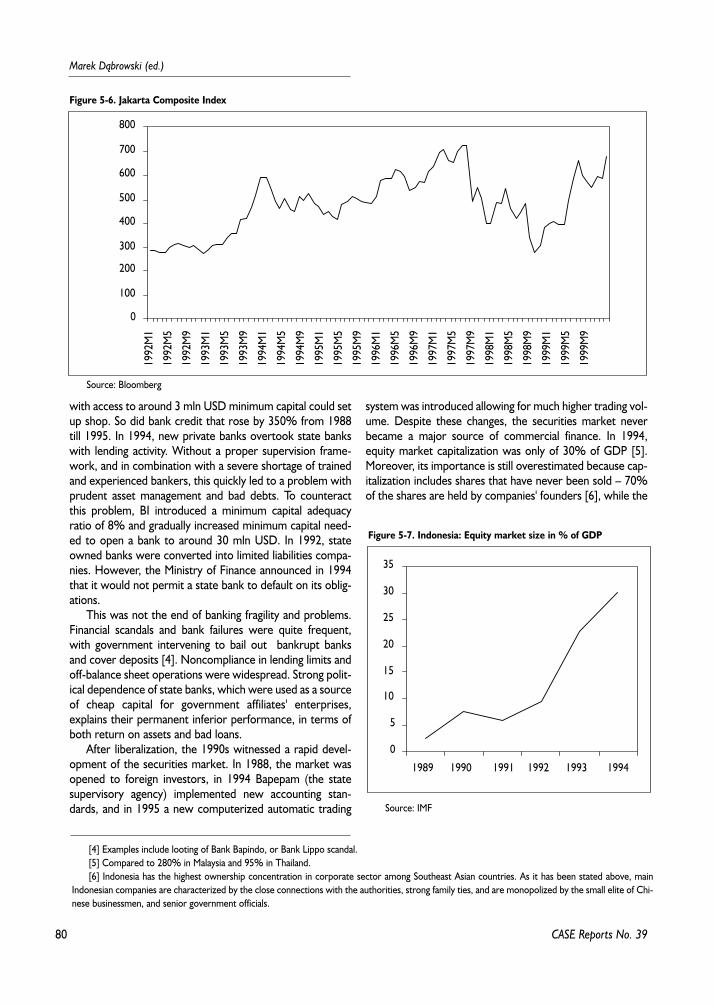
80
Marek D¹browski (ed.)
CASE Reports No. 39
with access to around 3 mln USD minimum capital could setup shop. So did bank credit that rose by 350% from 1988till 1995. In 1994, new private banks overtook state bankswith lending activity. Without a proper supervision frame-work, and in combination with a severe shortage of trainedand experienced bankers, this quickly led to a problem withprudent asset management and bad debts. To counteractthis problem, BI introduced a minimum capital adequacyratio of 8% and gradually increased minimum capital need-ed to open a bank to around 30 mln USD. In 1992, stateowned banks were converted into limited liabilities compa-nies. However, the Ministry of Finance announced in 1994that it would not permit a state bank to default on its oblig-ations.
This was not the end of banking fragility and problems.Financial scandals and bank failures were quite frequent,with government intervening to bail out bankrupt banksand cover deposits [4]. Noncompliance in lending limits andoff-balance sheet operations were widespread. Strong polit-ical dependence of state banks, which were used as a sourceof cheap capital for government affiliates' enterprises,explains their permanent inferior performance, in terms ofboth return on assets and bad loans.
After liberalization, the 1990s witnessed a rapid devel-opment of the securities market. In 1988, the market wasopened to foreign investors, in 1994 Bapepam (the statesupervisory agency) implemented new accounting stan-dards, and in 1995 a new computerized automatic trading
system was introduced allowing for much higher trading vol-ume. Despite these changes, the securities market neverbecame a major source of commercial finance. In 1994,equity market capitalization was only of 30% of GDP [5].Moreover, its importance is still overestimated because cap-italization includes shares that have never been sold – 70%of the shares are held by companies' founders [6], while the
Figure 5-7. Indonesia: Equity market size in % of GDP
0
5
10
15
20
25
30
35
1989 1990 1991 1992 1993 1994
Source: IMF
Figure 5-6. Jakarta Composite Index
0
100
200
300
400
500
600
700
800
1992
M1
1992
M5
1992
M9
1993
M1
1993
M5
1993
M9
1994
M1
1994
M5
1994
M9
1995
M1
1995
M5
1995
M9
1996
M1
1996
M5
1996
M9
1997
M1
1997
M5
1997
M9
1998
M1
1998
M5
1998
M9
1999
M1
1999
M5
1999
M9
Source: Bloomberg
[4] Examples include looting of Bank Bapindo, or Bank Lippo scandal.[5] Compared to 280% in Malaysia and 95% in Thailand.[6] Indonesia has the highest ownership concentration in corporate sector among Southeast Asian countries. As it has been stated above, main
Indonesian companies are characterized by the close connections with the authorities, strong family ties, and are monopolized by the small elite of Chi-nese businessmen, and senior government officials.
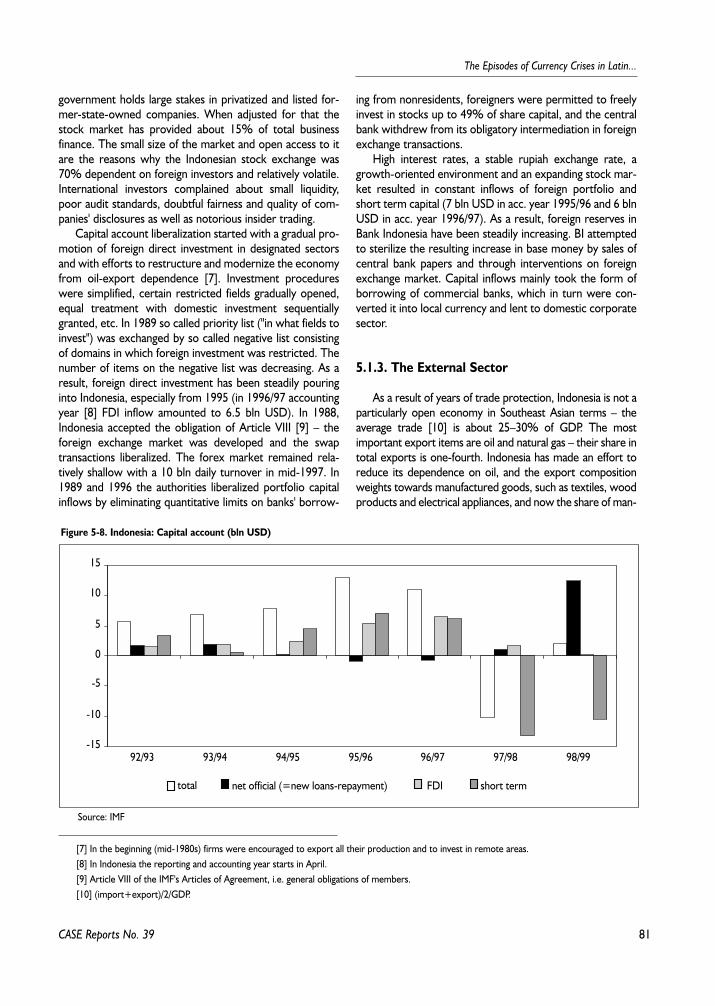
81
The Episodes of Currency Crises in Latin...
government holds large stakes in privatized and listed for-mer-state-owned companies. When adjusted for that thestock market has provided about 15% of total businessfinance. The small size of the market and open access to itare the reasons why the Indonesian stock exchange was70% dependent on foreign investors and relatively volatile.International investors complained about small liquidity,poor audit standards, doubtful fairness and quality of com-panies' disclosures as well as notorious insider trading.
Capital account liberalization started with a gradual pro-motion of foreign direct investment in designated sectorsand with efforts to restructure and modernize the economyfrom oil-export dependence [7]. Investment procedureswere simplified, certain restricted fields gradually opened,equal treatment with domestic investment sequentiallygranted, etc. In 1989 so called priority list ("in what fields toinvest") was exchanged by so called negative list consistingof domains in which foreign investment was restricted. Thenumber of items on the negative list was decreasing. As aresult, foreign direct investment has been steadily pouringinto Indonesia, especially from 1995 (in 1996/97 accountingyear [8] FDI inflow amounted to 6.5 bln USD). In 1988,Indonesia accepted the obligation of Article VIII [9] – theforeign exchange market was developed and the swaptransactions liberalized. The forex market remained rela-tively shallow with a 10 bln daily turnover in mid-1997. In1989 and 1996 the authorities liberalized portfolio capitalinflows by eliminating quantitative limits on banks' borrow-
ing from nonresidents, foreigners were permitted to freelyinvest in stocks up to 49% of share capital, and the centralbank withdrew from its obligatory intermediation in foreignexchange transactions.
High interest rates, a stable rupiah exchange rate, agrowth-oriented environment and an expanding stock mar-ket resulted in constant inflows of foreign portfolio andshort term capital (7 bln USD in acc. year 1995/96 and 6 blnUSD in acc. year 1996/97). As a result, foreign reserves inBank Indonesia have been steadily increasing. BI attemptedto sterilize the resulting increase in base money by sales ofcentral bank papers and through interventions on foreignexchange market. Capital inflows mainly took the form ofborrowing of commercial banks, which in turn were con-verted it into local currency and lent to domestic corporatesector.
5.1.3. The External Sector
As a result of years of trade protection, Indonesia is not aparticularly open economy in Southeast Asian terms – theaverage trade [10] is about 25–30% of GDP. The mostimportant export items are oil and natural gas – their share intotal exports is one-fourth. Indonesia has made an effort toreduce its dependence on oil, and the export compositionweights towards manufactured goods, such as textiles, woodproducts and electrical appliances, and now the share of man-
CASE Reports No. 39
[7] In the beginning (mid-1980s) firms were encouraged to export all their production and to invest in remote areas.[8] In Indonesia the reporting and accounting year starts in April.[9] Article VIII of the IMF's Articles of Agreement, i.e. general obligations of members.[10] (import+export)/2/GDP.
Figure 5-8. Indonesia: Capital account (bln USD)
-15
-10
-5
0
5
10
15
92/93 93/94 94/95 95/96 96/97 97/98 98/99
total net official (=new loans-repayment) FDI short term
Source: IMF
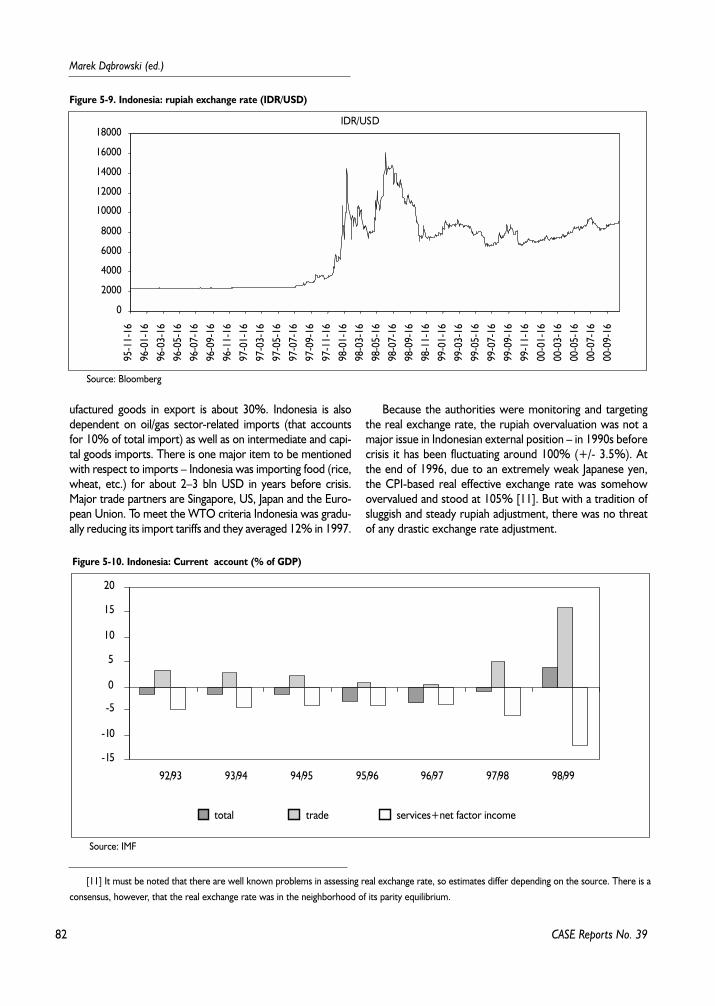
82
Marek D¹browski (ed.)
ufactured goods in export is about 30%. Indonesia is alsodependent on oil/gas sector-related imports (that accountsfor 10% of total import) as well as on intermediate and capi-tal goods imports. There is one major item to be mentionedwith respect to imports – Indonesia was importing food (rice,wheat, etc.) for about 2–3 bln USD in years before crisis.Major trade partners are Singapore, US, Japan and the Euro-pean Union. To meet the WTO criteria Indonesia was gradu-ally reducing its import tariffs and they averaged 12% in 1997.
Because the authorities were monitoring and targetingthe real exchange rate, the rupiah overvaluation was not amajor issue in Indonesian external position – in 1990s beforecrisis it has been fluctuating around 100% (+/- 3.5%). Atthe end of 1996, due to an extremely weak Japanese yen,the CPI-based real effective exchange rate was somehowovervalued and stood at 105% [11]. But with a tradition ofsluggish and steady rupiah adjustment, there was no threatof any drastic exchange rate adjustment.
CASE Reports No. 39
[11] It must be noted that there are well known problems in assessing real exchange rate, so estimates differ depending on the source. There is aconsensus, however, that the real exchange rate was in the neighborhood of its parity equilibrium.
Figure 5-9. Indonesia: rupiah exchange rate (IDR/USD)
IDR/USD
0
2000
4000
6000
8000
10000
12000
14000
16000
1800095
-11-
1696
-01-
1696
-03-
1696
-05-
1696
-07-
1696
-09-
1696
-11-
1697
-01-
1697
-03-
1697
-05-
1697
-07-
1697
-09-
1697
-11-
1698
-01-
1698
-03-
1698
-05-
1698
-07-
1698
-09-
1698
-11-
1699
-01-
1699
-03-
1699
-05-
1699
-07-
1699
-09-
1699
-11-
1600
-01-
1600
-03-
1600
-05-
1600
-07-
1600
-09-
16
Source: Bloomberg
Figure 5-10. Indonesia: Current account (% of GDP)
-15
-10
-5
0
5
10
15
20
92/93 93/94 94/95 95/96 96/97 97/98 98/99
total trade services+net factor income
Source: IMF
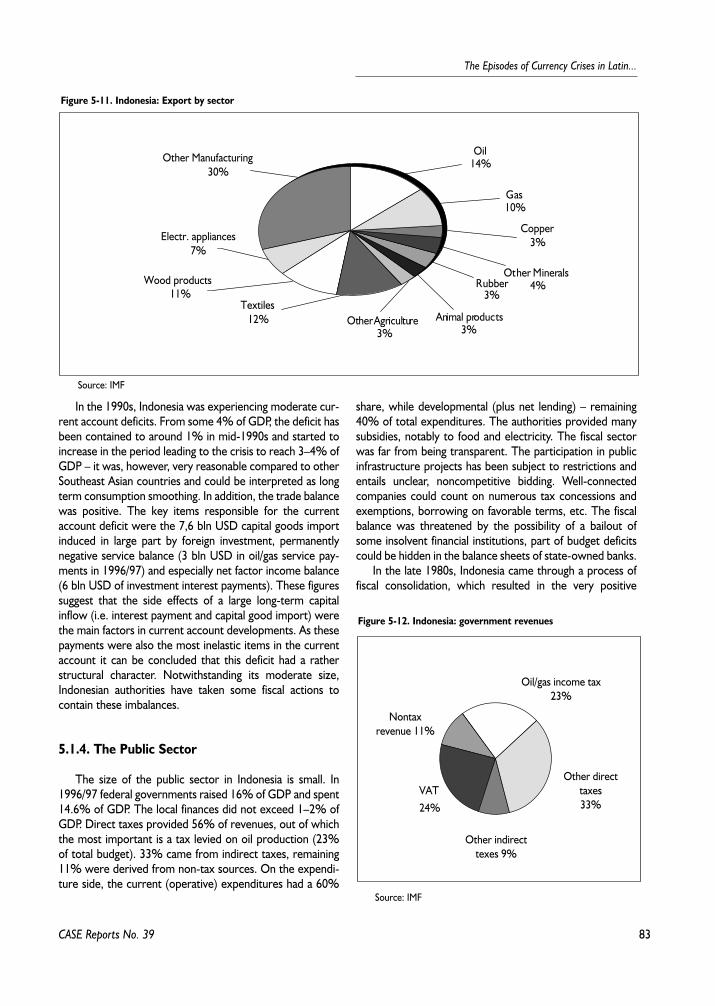
83
The Episodes of Currency Crises in Latin...
In the 1990s, Indonesia was experiencing moderate cur-rent account deficits. From some 4% of GDP, the deficit hasbeen contained to around 1% in mid-1990s and started toincrease in the period leading to the crisis to reach 3–4% ofGDP – it was, however, very reasonable compared to otherSoutheast Asian countries and could be interpreted as longterm consumption smoothing. In addition, the trade balancewas positive. The key items responsible for the currentaccount deficit were the 7,6 bln USD capital goods importinduced in large part by foreign investment, permanentlynegative service balance (3 bln USD in oil/gas service pay-ments in 1996/97) and especially net factor income balance(6 bln USD of investment interest payments). These figuressuggest that the side effects of a large long-term capitalinflow (i.e. interest payment and capital good import) werethe main factors in current account developments. As thesepayments were also the most inelastic items in the currentaccount it can be concluded that this deficit had a ratherstructural character. Notwithstanding its moderate size,Indonesian authorities have taken some fiscal actions tocontain these imbalances.
5.1.4. The Public Sector
The size of the public sector in Indonesia is small. In1996/97 federal governments raised 16% of GDP and spent14.6% of GDP. The local finances did not exceed 1–2% ofGDP. Direct taxes provided 56% of revenues, out of whichthe most important is a tax levied on oil production (23%of total budget). 33% came from indirect taxes, remaining11% were derived from non-tax sources. On the expendi-ture side, the current (operative) expenditures had a 60%
share, while developmental (plus net lending) – remaining40% of total expenditures. The authorities provided manysubsidies, notably to food and electricity. The fiscal sectorwas far from being transparent. The participation in publicinfrastructure projects has been subject to restrictions andentails unclear, noncompetitive bidding. Well-connectedcompanies could count on numerous tax concessions andexemptions, borrowing on favorable terms, etc. The fiscalbalance was threatened by the possibility of a bailout ofsome insolvent financial institutions, part of budget deficitscould be hidden in the balance sheets of state-owned banks.
In the late 1980s, Indonesia came through a process offiscal consolidation, which resulted in the very positive
CASE Reports No. 39
Figure 5-11. Indonesia: Export by sector
11%
Electr. appliances7%
Copper3%
Other Minerals4%Rubber
3%
Animal products3%
Other Agriculture3%
Oil14%
Gas10%
12%
Other Manufacturing30%
Textiles
Wood products
Source: IMF
Figure 5-12. Indonesia: government revenues
VAT24%
Oil/gas income tax23%
Other directtaxes33%
Nontaxrevenue 11%
Other indirecttexes 9%
Source: IMF
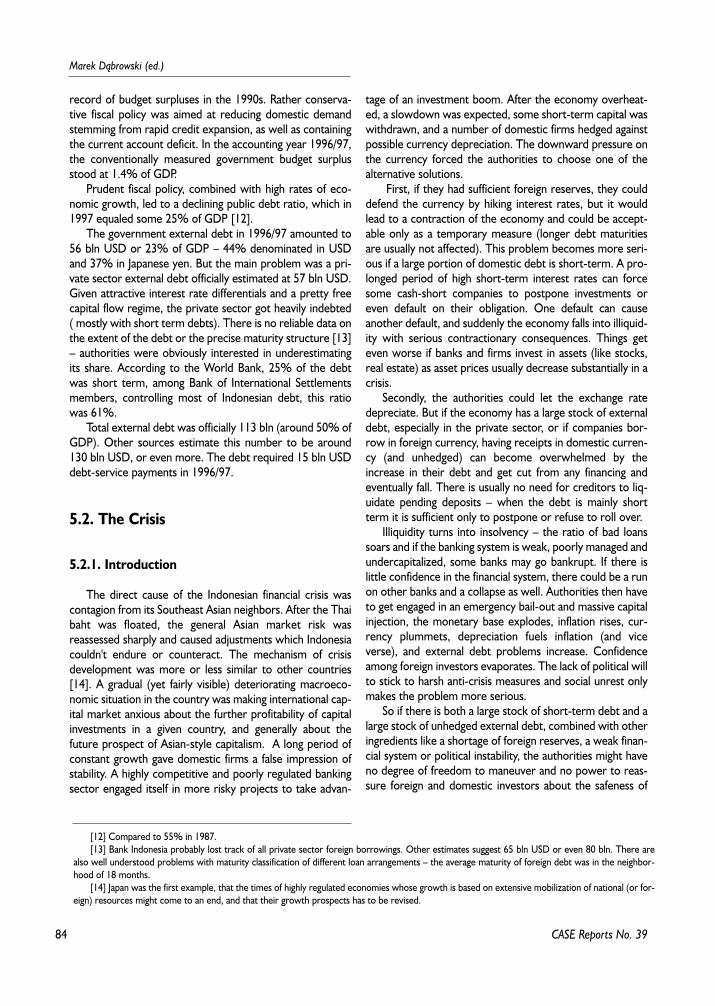
84
Marek D¹browski (ed.)
record of budget surpluses in the 1990s. Rather conserva-tive fiscal policy was aimed at reducing domestic demandstemming from rapid credit expansion, as well as containingthe current account deficit. In the accounting year 1996/97,the conventionally measured government budget surplusstood at 1.4% of GDP.
Prudent fiscal policy, combined with high rates of eco-nomic growth, led to a declining public debt ratio, which in1997 equaled some 25% of GDP [12].
The government external debt in 1996/97 amounted to56 bln USD or 23% of GDP – 44% denominated in USDand 37% in Japanese yen. But the main problem was a pri-vate sector external debt officially estimated at 57 bln USD.Given attractive interest rate differentials and a pretty freecapital flow regime, the private sector got heavily indebted( mostly with short term debts). There is no reliable data onthe extent of the debt or the precise maturity structure [13]– authorities were obviously interested in underestimatingits share. According to the World Bank, 25% of the debtwas short term, among Bank of International Settlementsmembers, controlling most of Indonesian debt, this ratiowas 61%.
Total external debt was officially 113 bln (around 50% ofGDP). Other sources estimate this number to be around130 bln USD, or even more. The debt required 15 bln USDdebt-service payments in 1996/97.
5.2. The Crisis
5.2.1. Introduction
The direct cause of the Indonesian financial crisis wascontagion from its Southeast Asian neighbors. After the Thaibaht was floated, the general Asian market risk wasreassessed sharply and caused adjustments which Indonesiacouldn't endure or counteract. The mechanism of crisisdevelopment was more or less similar to other countries[14]. A gradual (yet fairly visible) deteriorating macroeco-nomic situation in the country was making international cap-ital market anxious about the further profitability of capitalinvestments in a given country, and generally about thefuture prospect of Asian-style capitalism. A long period ofconstant growth gave domestic firms a false impression ofstability. A highly competitive and poorly regulated bankingsector engaged itself in more risky projects to take advan-
tage of an investment boom. After the economy overheat-ed, a slowdown was expected, some short-term capital waswithdrawn, and a number of domestic firms hedged againstpossible currency depreciation. The downward pressure onthe currency forced the authorities to choose one of thealternative solutions.
First, if they had sufficient foreign reserves, they coulddefend the currency by hiking interest rates, but it wouldlead to a contraction of the economy and could be accept-able only as a temporary measure (longer debt maturitiesare usually not affected). This problem becomes more seri-ous if a large portion of domestic debt is short-term. A pro-longed period of high short-term interest rates can forcesome cash-short companies to postpone investments oreven default on their obligation. One default can causeanother default, and suddenly the economy falls into illiquid-ity with serious contractionary consequences. Things geteven worse if banks and firms invest in assets (like stocks,real estate) as asset prices usually decrease substantially in acrisis.
Secondly, the authorities could let the exchange ratedepreciate. But if the economy has a large stock of externaldebt, especially in the private sector, or if companies bor-row in foreign currency, having receipts in domestic curren-cy (and unhedged) can become overwhelmed by theincrease in their debt and get cut from any financing andeventually fall. There is usually no need for creditors to liq-uidate pending deposits – when the debt is mainly shortterm it is sufficient only to postpone or refuse to roll over.
Illiquidity turns into insolvency – the ratio of bad loanssoars and if the banking system is weak, poorly managed andundercapitalized, some banks may go bankrupt. If there islittle confidence in the financial system, there could be a runon other banks and a collapse as well. Authorities then haveto get engaged in an emergency bail-out and massive capitalinjection, the monetary base explodes, inflation rises, cur-rency plummets, depreciation fuels inflation (and viceverse), and external debt problems increase. Confidenceamong foreign investors evaporates. The lack of political willto stick to harsh anti-crisis measures and social unrest onlymakes the problem more serious.
So if there is both a large stock of short-term debt and alarge stock of unhedged external debt, combined with otheringredients like a shortage of foreign reserves, a weak finan-cial system or political instability, the authorities might haveno degree of freedom to maneuver and no power to reas-sure foreign and domestic investors about the safeness of
CASE Reports No. 39
[12] Compared to 55% in 1987.[13] Bank Indonesia probably lost track of all private sector foreign borrowings. Other estimates suggest 65 bln USD or even 80 bln. There are
also well understood problems with maturity classification of different loan arrangements – the average maturity of foreign debt was in the neighbor-hood of 18 months.
[14] Japan was the first example, that the times of highly regulated economies whose growth is based on extensive mobilization of national (or for-eign) resources might come to an end, and that their growth prospects has to be revised.
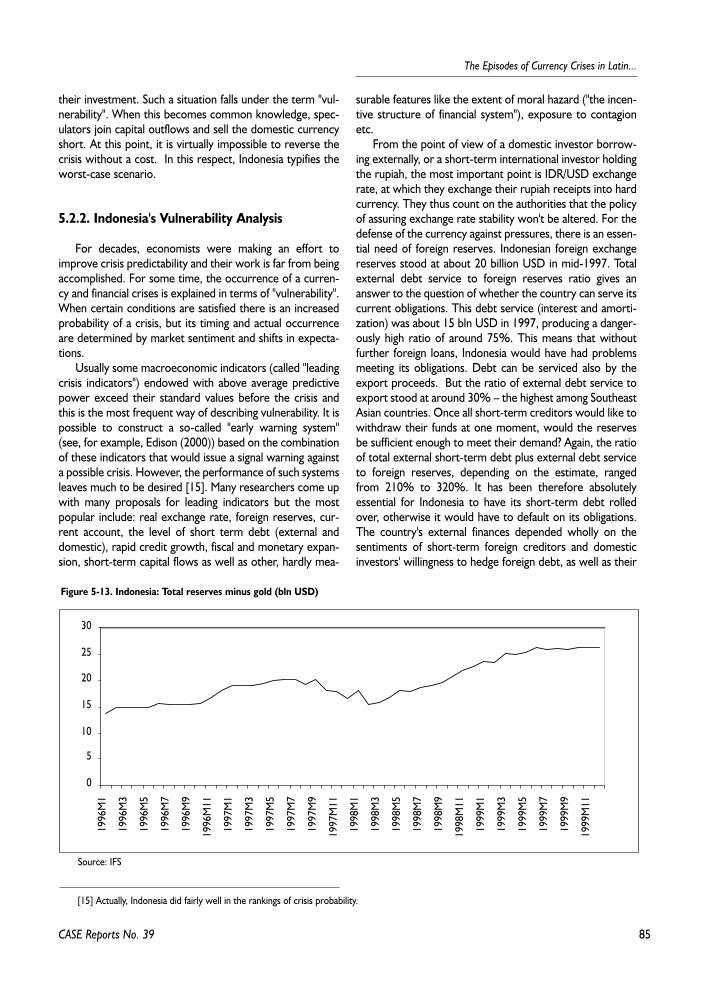
85
The Episodes of Currency Crises in Latin...
their investment. Such a situation falls under the term "vul-nerability". When this becomes common knowledge, spec-ulators join capital outflows and sell the domestic currencyshort. At this point, it is virtually impossible to reverse thecrisis without a cost. In this respect, Indonesia typifies theworst-case scenario.
5.2.2. Indonesia's Vulnerability Analysis
For decades, economists were making an effort toimprove crisis predictability and their work is far from beingaccomplished. For some time, the occurrence of a curren-cy and financial crises is explained in terms of "vulnerability".When certain conditions are satisfied there is an increasedprobability of a crisis, but its timing and actual occurrenceare determined by market sentiment and shifts in expecta-tions.
Usually some macroeconomic indicators (called "leadingcrisis indicators") endowed with above average predictivepower exceed their standard values before the crisis andthis is the most frequent way of describing vulnerability. It ispossible to construct a so-called "early warning system"(see, for example, Edison (2000)) based on the combinationof these indicators that would issue a signal warning againsta possible crisis. However, the performance of such systemsleaves much to be desired [15]. Many researchers come upwith many proposals for leading indicators but the mostpopular include: real exchange rate, foreign reserves, cur-rent account, the level of short term debt (external anddomestic), rapid credit growth, fiscal and monetary expan-sion, short-term capital flows as well as other, hardly mea-
surable features like the extent of moral hazard ("the incen-tive structure of financial system"), exposure to contagionetc.
From the point of view of a domestic investor borrow-ing externally, or a short-term international investor holdingthe rupiah, the most important point is IDR/USD exchangerate, at which they exchange their rupiah receipts into hardcurrency. They thus count on the authorities that the policyof assuring exchange rate stability won't be altered. For thedefense of the currency against pressures, there is an essen-tial need of foreign reserves. Indonesian foreign exchangereserves stood at about 20 billion USD in mid-1997. Totalexternal debt service to foreign reserves ratio gives ananswer to the question of whether the country can serve itscurrent obligations. This debt service (interest and amorti-zation) was about 15 bln USD in 1997, producing a danger-ously high ratio of around 75%. This means that withoutfurther foreign loans, Indonesia would have had problemsmeeting its obligations. Debt can be serviced also by theexport proceeds. But the ratio of external debt service toexport stood at around 30% – the highest among SoutheastAsian countries. Once all short-term creditors would like towithdraw their funds at one moment, would the reservesbe sufficient enough to meet their demand? Again, the ratioof total external short-term debt plus external debt serviceto foreign reserves, depending on the estimate, rangedfrom 210% to 320%. It has been therefore absolutelyessential for Indonesia to have its short-term debt rolledover, otherwise it would have to default on its obligations.The country's external finances depended wholly on thesentiments of short-term foreign creditors and domesticinvestors' willingness to hedge foreign debt, as well as their
CASE Reports No. 39
[15] Actually, Indonesia did fairly well in the rankings of crisis probability.
Figure 5-13. Indonesia: Total reserves minus gold (bln USD)
0
5
10
15
20
25
30
1996
M1
1996
M3
1996
M5
1996
M7
1996
M9
1996
M11
1997
M1
1997
M3
1997
M5
1997
M7
1997
M9
1997
M11
1998
M1
1998
M3
1998
M5
1998
M7
1998
M9
1998
M11
1999
M1
1999
M3
1999
M5
1999
M7
1999
M9
1999
M11
Source: IFS
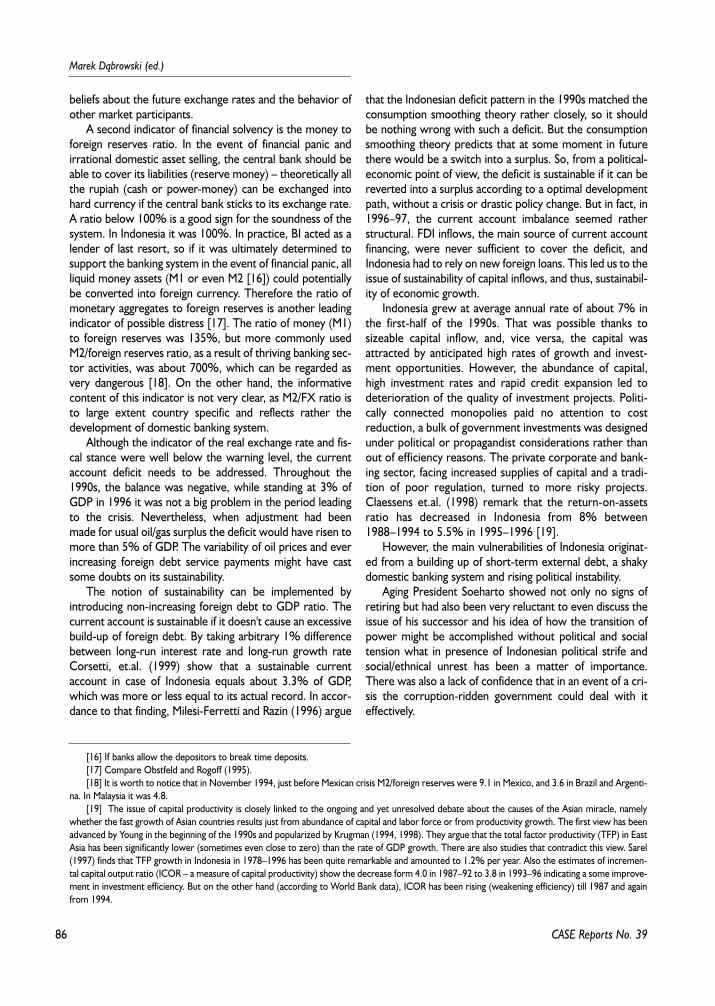
86
Marek D¹browski (ed.)
beliefs about the future exchange rates and the behavior ofother market participants.
A second indicator of financial solvency is the money toforeign reserves ratio. In the event of financial panic andirrational domestic asset selling, the central bank should beable to cover its liabilities (reserve money) – theoretically allthe rupiah (cash or power-money) can be exchanged intohard currency if the central bank sticks to its exchange rate.A ratio below 100% is a good sign for the soundness of thesystem. In Indonesia it was 100%. In practice, BI acted as alender of last resort, so if it was ultimately determined tosupport the banking system in the event of financial panic, allliquid money assets (M1 or even M2 [16]) could potentiallybe converted into foreign currency. Therefore the ratio ofmonetary aggregates to foreign reserves is another leadingindicator of possible distress [17]. The ratio of money (M1)to foreign reserves was 135%, but more commonly usedM2/foreign reserves ratio, as a result of thriving banking sec-tor activities, was about 700%, which can be regarded asvery dangerous [18]. On the other hand, the informativecontent of this indicator is not very clear, as M2/FX ratio isto large extent country specific and reflects rather thedevelopment of domestic banking system.
Although the indicator of the real exchange rate and fis-cal stance were well below the warning level, the currentaccount deficit needs to be addressed. Throughout the1990s, the balance was negative, while standing at 3% ofGDP in 1996 it was not a big problem in the period leadingto the crisis. Nevertheless, when adjustment had beenmade for usual oil/gas surplus the deficit would have risen tomore than 5% of GDP. The variability of oil prices and everincreasing foreign debt service payments might have castsome doubts on its sustainability.
The notion of sustainability can be implemented byintroducing non-increasing foreign debt to GDP ratio. Thecurrent account is sustainable if it doesn't cause an excessivebuild-up of foreign debt. By taking arbitrary 1% differencebetween long-run interest rate and long-run growth rateCorsetti, et.al. (1999) show that a sustainable currentaccount in case of Indonesia equals about 3.3% of GDP,which was more or less equal to its actual record. In accor-dance to that finding, Milesi-Ferretti and Razin (1996) argue
that the Indonesian deficit pattern in the 1990s matched theconsumption smoothing theory rather closely, so it shouldbe nothing wrong with such a deficit. But the consumptionsmoothing theory predicts that at some moment in futurethere would be a switch into a surplus. So, from a political-economic point of view, the deficit is sustainable if it can bereverted into a surplus according to a optimal developmentpath, without a crisis or drastic policy change. But in fact, in1996–97, the current account imbalance seemed ratherstructural. FDI inflows, the main source of current accountfinancing, were never sufficient to cover the deficit, andIndonesia had to rely on new foreign loans. This led us to theissue of sustainability of capital inflows, and thus, sustainabil-ity of economic growth.
Indonesia grew at average annual rate of about 7% inthe first-half of the 1990s. That was possible thanks tosizeable capital inflow, and, vice versa, the capital wasattracted by anticipated high rates of growth and invest-ment opportunities. However, the abundance of capital,high investment rates and rapid credit expansion led todeterioration of the quality of investment projects. Politi-cally connected monopolies paid no attention to costreduction, a bulk of government investments was designedunder political or propagandist considerations rather thanout of efficiency reasons. The private corporate and bank-ing sector, facing increased supplies of capital and a tradi-tion of poor regulation, turned to more risky projects.Claessens et.al. (1998) remark that the return-on-assetsratio has decreased in Indonesia from 8% between1988–1994 to 5.5% in 1995–1996 [19].
However, the main vulnerabilities of Indonesia originat-ed from a building up of short-term external debt, a shakydomestic banking system and rising political instability.
Aging President Soeharto showed not only no signs ofretiring but had also been very reluctant to even discuss theissue of his successor and his idea of how the transition ofpower might be accomplished without political and socialtension what in presence of Indonesian political strife andsocial/ethnical unrest has been a matter of importance.There was also a lack of confidence that in an event of a cri-sis the corruption-ridden government could deal with iteffectively.
CASE Reports No. 39
[16] If banks allow the depositors to break time deposits.[17] Compare Obstfeld and Rogoff (1995).[18] It is worth to notice that in November 1994, just before Mexican crisis M2/foreign reserves were 9.1 in Mexico, and 3.6 in Brazil and Argenti-
na. In Malaysia it was 4.8.[19] The issue of capital productivity is closely linked to the ongoing and yet unresolved debate about the causes of the Asian miracle, namely
whether the fast growth of Asian countries results just from abundance of capital and labor force or from productivity growth. The first view has beenadvanced by Young in the beginning of the 1990s and popularized by Krugman (1994, 1998). They argue that the total factor productivity (TFP) in EastAsia has been significantly lower (sometimes even close to zero) than the rate of GDP growth. There are also studies that contradict this view. Sarel(1997) finds that TFP growth in Indonesia in 1978–1996 has been quite remarkable and amounted to 1.2% per year. Also the estimates of incremen-tal capital output ratio (ICOR – a measure of capital productivity) show the decrease form 4.0 in 1987–92 to 3.8 in 1993–96 indicating a some improve-ment in investment efficiency. But on the other hand (according to World Bank data), ICOR has been rising (weakening efficiency) till 1987 and againfrom 1994.
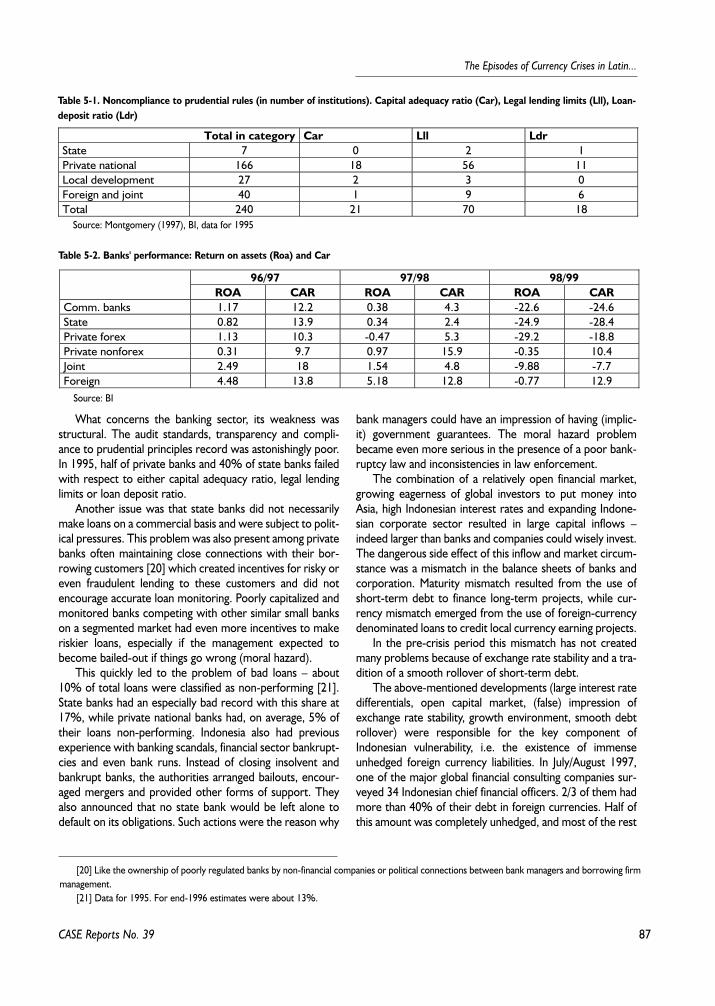
87
The Episodes of Currency Crises in Latin...
What concerns the banking sector, its weakness wasstructural. The audit standards, transparency and compli-ance to prudential principles record was astonishingly poor.In 1995, half of private banks and 40% of state banks failedwith respect to either capital adequacy ratio, legal lendinglimits or loan deposit ratio.
Another issue was that state banks did not necessarilymake loans on a commercial basis and were subject to polit-ical pressures. This problem was also present among privatebanks often maintaining close connections with their bor-rowing customers [20] which created incentives for risky oreven fraudulent lending to these customers and did notencourage accurate loan monitoring. Poorly capitalized andmonitored banks competing with other similar small bankson a segmented market had even more incentives to makeriskier loans, especially if the management expected tobecome bailed-out if things go wrong (moral hazard).
This quickly led to the problem of bad loans – about10% of total loans were classified as non-performing [21].State banks had an especially bad record with this share at17%, while private national banks had, on average, 5% oftheir loans non-performing. Indonesia also had previousexperience with banking scandals, financial sector bankrupt-cies and even bank runs. Instead of closing insolvent andbankrupt banks, the authorities arranged bailouts, encour-aged mergers and provided other forms of support. Theyalso announced that no state bank would be left alone todefault on its obligations. Such actions were the reason why
bank managers could have an impression of having (implic-it) government guarantees. The moral hazard problembecame even more serious in the presence of a poor bank-ruptcy law and inconsistencies in law enforcement.
The combination of a relatively open financial market,growing eagerness of global investors to put money intoAsia, high Indonesian interest rates and expanding Indone-sian corporate sector resulted in large capital inflows –indeed larger than banks and companies could wisely invest.The dangerous side effect of this inflow and market circum-stance was a mismatch in the balance sheets of banks andcorporation. Maturity mismatch resulted from the use ofshort-term debt to finance long-term projects, while cur-rency mismatch emerged from the use of foreign-currencydenominated loans to credit local currency earning projects.
In the pre-crisis period this mismatch has not createdmany problems because of exchange rate stability and a tra-dition of a smooth rollover of short-term debt.
The above-mentioned developments (large interest ratedifferentials, open capital market, (false) impression ofexchange rate stability, growth environment, smooth debtrollover) were responsible for the key component ofIndonesian vulnerability, i.e. the existence of immenseunhedged foreign currency liabilities. In July/August 1997,one of the major global financial consulting companies sur-veyed 34 Indonesian chief financial officers. 2/3 of them hadmore than 40% of their debt in foreign currencies. Half ofthis amount was completely unhedged, and most of the rest
CASE Reports No. 39
Table 5-1. Noncompliance to prudential rules (in number of institutions). Capital adequacy ratio (Car), Legal lending limits (Lll), Loan-deposit ratio (Ldr)
Total in category Car Lll LdrState 7 0 2 1Private national 166 18 56 11Local development 27 2 3 0Foreign and joint 40 1 9 6Total 240 21 70 18
Source: Montgomery (1997), BI, data for 1995
Table 5-2. Banks' performance: Return on assets (Roa) and Car
96/97 97/98 98/99ROA CAR ROA CAR ROA CAR
Comm. banks 1.17 12.2 0.38 4.3 -22.6 -24.6State 0.82 13.9 0.34 2.4 -24.9 -28.4Private forex 1.13 10.3 -0.47 5.3 -29.2 -18.8Private nonforex 0.31 9.7 0.97 15.9 -0.35 10.4Joint 2.49 18 1.54 4.8 -9.88 -7.7Foreign 4.48 13.8 5.18 12.8 -0.77 12.9
Source: BI
[20] Like the ownership of poorly regulated banks by non-financial companies or political connections between bank managers and borrowing firmmanagement.
[21] Data for 1995. For end-1996 estimates were about 13%.
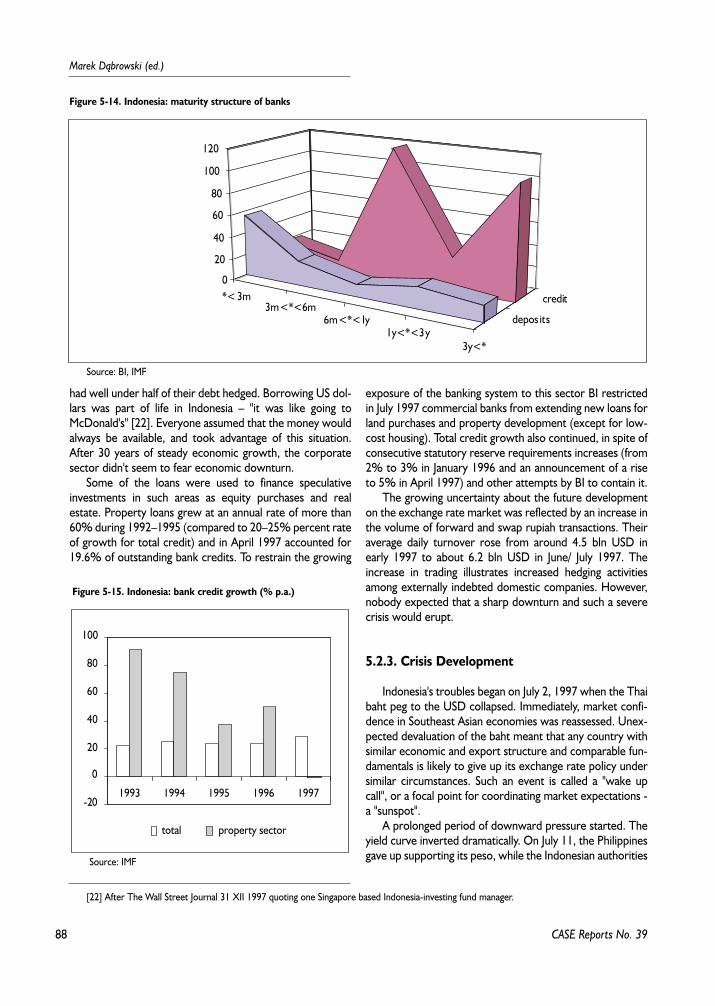
88
Marek D¹browski (ed.)
had well under half of their debt hedged. Borrowing US dol-lars was part of life in Indonesia – "it was like going toMcDonald's" [22]. Everyone assumed that the money wouldalways be available, and took advantage of this situation.After 30 years of steady economic growth, the corporatesector didn't seem to fear economic downturn.
Some of the loans were used to finance speculativeinvestments in such areas as equity purchases and realestate. Property loans grew at an annual rate of more than60% during 1992–1995 (compared to 20–25% percent rateof growth for total credit) and in April 1997 accounted for19.6% of outstanding bank credits. To restrain the growing
exposure of the banking system to this sector BI restrictedin July 1997 commercial banks from extending new loans forland purchases and property development (except for low-cost housing). Total credit growth also continued, in spite ofconsecutive statutory reserve requirements increases (from2% to 3% in January 1996 and an announcement of a riseto 5% in April 1997) and other attempts by BI to contain it.
The growing uncertainty about the future developmenton the exchange rate market was reflected by an increase inthe volume of forward and swap rupiah transactions. Theiraverage daily turnover rose from around 4.5 bln USD inearly 1997 to about 6.2 bln USD in June/ July 1997. Theincrease in trading illustrates increased hedging activitiesamong externally indebted domestic companies. However,nobody expected that a sharp downturn and such a severecrisis would erupt.
5.2.3. Crisis Development
Indonesia's troubles began on July 2, 1997 when the Thaibaht peg to the USD collapsed. Immediately, market confi-dence in Southeast Asian economies was reassessed. Unex-pected devaluation of the baht meant that any country withsimilar economic and export structure and comparable fun-damentals is likely to give up its exchange rate policy undersimilar circumstances. Such an event is called a "wake upcall", or a focal point for coordinating market expectations -a "sunspot".
A prolonged period of downward pressure started. Theyield curve inverted dramatically. On July 11, the Philippinesgave up supporting its peso, while the Indonesian authorities
CASE Reports No. 39
[22] After The Wall Street Journal 31 XII 1997 quoting one Singapore based Indonesia-investing fund manager.
Figure 5-14. Indonesia: maturity structure of banks
*<3m3m<*<6m
6m<*<1y1y<*<3y
3y<*
depos its
credit
0
20
40
60
80
100
120
Source: BI, IMF
Figure 5-15. Indonesia: bank credit growth (% p.a.)
-20
0
20
40
60
80
100
1993 1994 1995 1996 1997
total property sector
Source: IMF
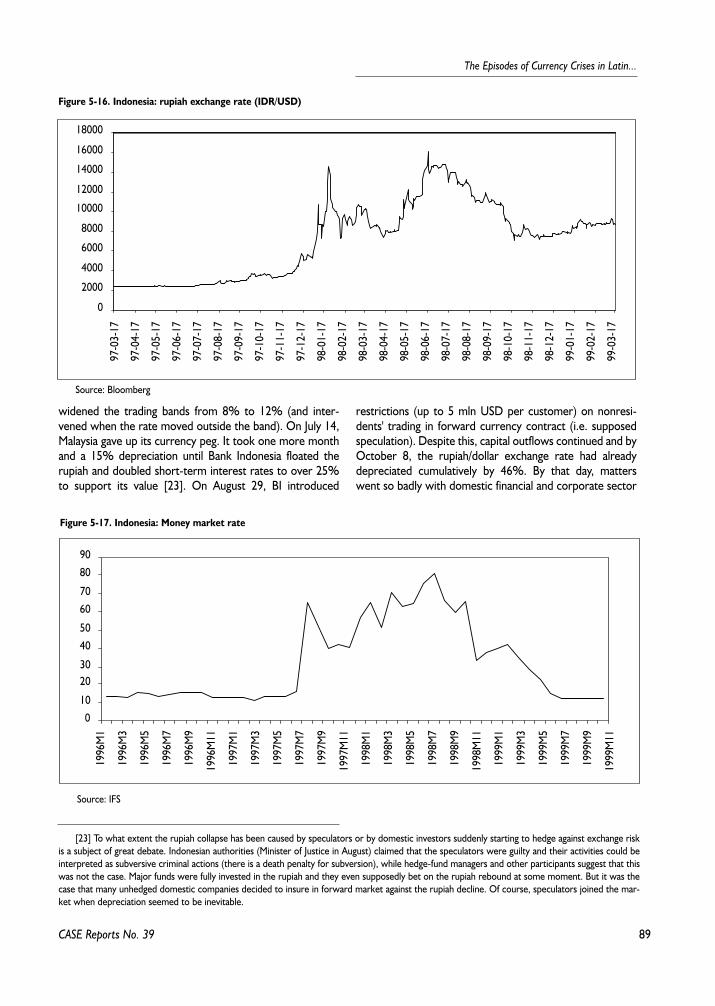
89
The Episodes of Currency Crises in Latin...
widened the trading bands from 8% to 12% (and inter-vened when the rate moved outside the band). On July 14,Malaysia gave up its currency peg. It took one more monthand a 15% depreciation until Bank Indonesia floated therupiah and doubled short-term interest rates to over 25%to support its value [23]. On August 29, BI introduced
restrictions (up to 5 mln USD per customer) on nonresi-dents' trading in forward currency contract (i.e. supposedspeculation). Despite this, capital outflows continued and byOctober 8, the rupiah/dollar exchange rate had alreadydepreciated cumulatively by 46%. By that day, matterswent so badly with domestic financial and corporate sector
CASE Reports No. 39
[23] To what extent the rupiah collapse has been caused by speculators or by domestic investors suddenly starting to hedge against exchange riskis a subject of great debate. Indonesian authorities (Minister of Justice in August) claimed that the speculators were guilty and their activities could beinterpreted as subversive criminal actions (there is a death penalty for subversion), while hedge-fund managers and other participants suggest that thiswas not the case. Major funds were fully invested in the rupiah and they even supposedly bet on the rupiah rebound at some moment. But it was thecase that many unhedged domestic companies decided to insure in forward market against the rupiah decline. Of course, speculators joined the mar-ket when depreciation seemed to be inevitable.
Figure 5-16. Indonesia: rupiah exchange rate (IDR/USD)
0
2000
4000
6000
8000
10000
12000
14000
16000
1800097
-03-
17
97-0
4-17
97-0
5-17
97-0
6-17
97-0
7-17
97-0
8-17
97-0
9-17
97-1
0-17
97-1
1-17
97-1
2-17
98-0
1-17
98-0
2-17
98-0
3-17
98-0
4-17
98-0
5-17
98-0
6-17
98-0
7-17
98-0
8-17
98-0
9-17
98-1
0-17
98-1
1-17
98-1
2-17
99-0
1-17
99-0
2-17
99-0
3-17
Source: Bloomberg
Figure 5-17. Indonesia: Money market rate
0
10
2030
40
50
60
70
80
90
1996
M1
1996
M3
1996
M5
1996
M7
1996
M9
1996
M11
1997
M1
1997
M3
1997
M5
1997
M7
1997
M9
1997
M11
1998
M1
1998
M3
1998
M5
1998
M7
1998
M9
1998
M11
1999
M1
1999
M3
1999
M5
1999
M7
1999
M9
1999
M11
Source: IFS
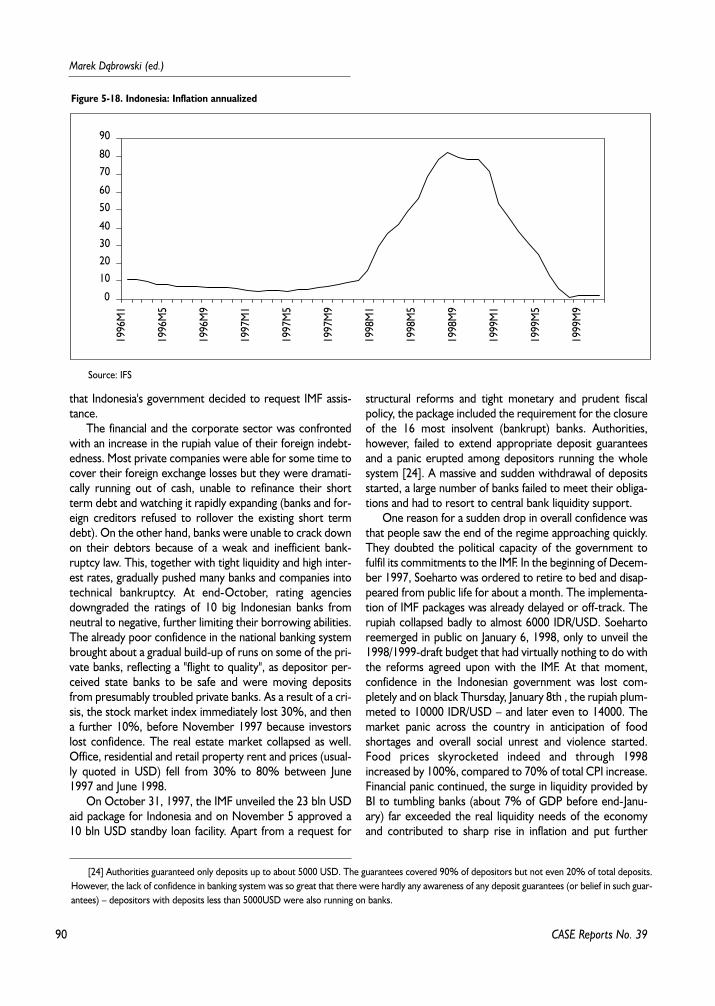
90
Marek D¹browski (ed.)
that Indonesia's government decided to request IMF assis-tance.
The financial and the corporate sector was confrontedwith an increase in the rupiah value of their foreign indebt-edness. Most private companies were able for some time tocover their foreign exchange losses but they were dramati-cally running out of cash, unable to refinance their shortterm debt and watching it rapidly expanding (banks and for-eign creditors refused to rollover the existing short termdebt). On the other hand, banks were unable to crack downon their debtors because of a weak and inefficient bank-ruptcy law. This, together with tight liquidity and high inter-est rates, gradually pushed many banks and companies intotechnical bankruptcy. At end-October, rating agenciesdowngraded the ratings of 10 big Indonesian banks fromneutral to negative, further limiting their borrowing abilities.The already poor confidence in the national banking systembrought about a gradual build-up of runs on some of the pri-vate banks, reflecting a "flight to quality", as depositor per-ceived state banks to be safe and were moving depositsfrom presumably troubled private banks. As a result of a cri-sis, the stock market index immediately lost 30%, and thena further 10%, before November 1997 because investorslost confidence. The real estate market collapsed as well.Office, residential and retail property rent and prices (usual-ly quoted in USD) fell from 30% to 80% between June1997 and June 1998.
On October 31, 1997, the IMF unveiled the 23 bln USDaid package for Indonesia and on November 5 approved a10 bln USD standby loan facility. Apart from a request for
structural reforms and tight monetary and prudent fiscalpolicy, the package included the requirement for the closureof the 16 most insolvent (bankrupt) banks. Authorities,however, failed to extend appropriate deposit guaranteesand a panic erupted among depositors running the wholesystem [24]. A massive and sudden withdrawal of depositsstarted, a large number of banks failed to meet their obliga-tions and had to resort to central bank liquidity support.
One reason for a sudden drop in overall confidence wasthat people saw the end of the regime approaching quickly.They doubted the political capacity of the government tofulfil its commitments to the IMF. In the beginning of Decem-ber 1997, Soeharto was ordered to retire to bed and disap-peared from public life for about a month. The implementa-tion of IMF packages was already delayed or off-track. Therupiah collapsed badly to almost 6000 IDR/USD. Soehartoreemerged in public on January 6, 1998, only to unveil the1998/1999-draft budget that had virtually nothing to do withthe reforms agreed upon with the IMF. At that moment,confidence in the Indonesian government was lost com-pletely and on black Thursday, January 8th , the rupiah plum-meted to 10000 IDR/USD – and later even to 14000. Themarket panic across the country in anticipation of foodshortages and overall social unrest and violence started.Food prices skyrocketed indeed and through 1998increased by 100%, compared to 70% of total CPI increase.Financial panic continued, the surge in liquidity provided byBI to tumbling banks (about 7% of GDP before end-Janu-ary) far exceeded the real liquidity needs of the economyand contributed to sharp rise in inflation and put further
CASE Reports No. 39
[24] Authorities guaranteed only deposits up to about 5000 USD. The guarantees covered 90% of depositors but not even 20% of total deposits.However, the lack of confidence in banking system was so great that there were hardly any awareness of any deposit guarantees (or belief in such guar-antees) – depositors with deposits less than 5000USD were also running on banks.
Figure 5-18. Indonesia: Inflation annualized
0
10203040
5060
7080
9019
96M
1
1996
M5
1996
M9
1997
M1
1997
M5
1997
M9
1998
M1
1998
M5
1998
M9
1999
M1
1999
M5
1999
M9
Source: IFS
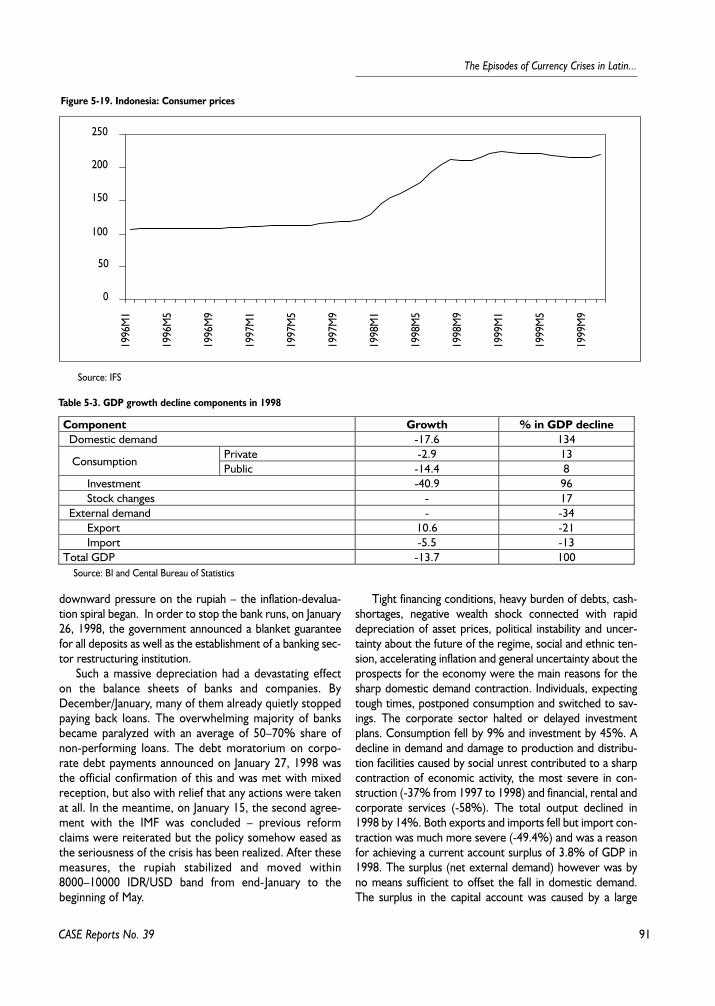
91
The Episodes of Currency Crises in Latin...
CASE Reports No. 39
downward pressure on the rupiah – the inflation-devalua-tion spiral began. In order to stop the bank runs, on January26, 1998, the government announced a blanket guaranteefor all deposits as well as the establishment of a banking sec-tor restructuring institution.
Such a massive depreciation had a devastating effecton the balance sheets of banks and companies. ByDecember/January, many of them already quietly stoppedpaying back loans. The overwhelming majority of banksbecame paralyzed with an average of 50–70% share ofnon-performing loans. The debt moratorium on corpo-rate debt payments announced on January 27, 1998 wasthe official confirmation of this and was met with mixedreception, but also with relief that any actions were takenat all. In the meantime, on January 15, the second agree-ment with the IMF was concluded – previous reformclaims were reiterated but the policy somehow eased asthe seriousness of the crisis has been realized. After thesemeasures, the rupiah stabilized and moved within8000–10000 IDR/USD band from end-January to thebeginning of May.
Tight financing conditions, heavy burden of debts, cash-shortages, negative wealth shock connected with rapiddepreciation of asset prices, political instability and uncer-tainty about the future of the regime, social and ethnic ten-sion, accelerating inflation and general uncertainty about theprospects for the economy were the main reasons for thesharp domestic demand contraction. Individuals, expectingtough times, postponed consumption and switched to sav-ings. The corporate sector halted or delayed investmentplans. Consumption fell by 9% and investment by 45%. Adecline in demand and damage to production and distribu-tion facilities caused by social unrest contributed to a sharpcontraction of economic activity, the most severe in con-struction (-37% from 1997 to 1998) and financial, rental andcorporate services (-58%). The total output declined in1998 by 14%. Both exports and imports fell but import con-traction was much more severe (-49.4%) and was a reasonfor achieving a current account surplus of 3.8% of GDP in1998. The surplus (net external demand) however was byno means sufficient to offset the fall in domestic demand.The surplus in the capital account was caused by a large
Figure 5-19. Indonesia: Consumer prices
0
50
100
150
200
25019
96M
1
1996
M5
1996
M9
1997
M1
1997
M5
1997
M9
1998
M1
1998
M5
1998
M9
1999
M1
1999
M5
1999
M9
Source: IFS
Table 5-3. GDP growth decline components in 1998
Component Growth % in GDP decline Domestic demand -17.6 134
Private -2.9 13 Consumption
Public -14.4 8 Investment -40.9 96 Stock changes - 17 External demand - -34 Export 10.6 -21 Import -5.5 -13Total GDP -13.7 100
Source: BI and Cental Bureau of Statistics
92
Marek D¹browski (ed.)
inflow of official aid, while the outflow of private capital wasnot reversed. Inflation escalated to the level of 80% in 1998in response to panic food buying, interrupted production,social violence and increased prices of import commodities.Unemployment rose from 5% to 28% at end-1998.
On March 10 1998, Soeharto was reelected to a 7th termin office. On May 4, the government announced sharp priceincrease of gasoline and other utilities. Widespread protestserupted, among them most importantly student-led anti-regime demonstrations calling for the President's resignation.The army cracked down on protesters. Embassies and for-eign companies evacuated non-essential staff. On May 19, stu-dents started parliamentary compound occupation. The stu-dent demonstrations seeking political reforms were accom-panied by rioting, widespread looting, destruction, crime, aswell as religious and ethnic conflicts. Anti-Chinese riotingdirected mainly at shopkeepers in small town resulted incomplete disruption of supply distribution channels and short-age of basic products. The general erosion of social orderwent out of control. Over 1000 dead were reported in theMay riots. The hard-won relative stability of the rupiah wasimmediately lost, runs on banks and massive deposit with-drawals started again, the currency crisis renewed and therupiah plunged to over 16000 IDR/USD. It took five monthsto bring it back under 10000 IDR/USD. On May 21, urged byhis affiliates, Soeharto resigned.
Changes in key positions in the administration con-tributed to delays in the implementation of economicreforms. With reference to that and to harsh economic cir-cumstances, the IMF rearranged its agreements withIndonesia towards easier conditionality. The situation start-ed to stabilize. Food security has been gradually restoredthrough emergency import and increased food subsidies.Monetary stability gradually returned around October 1998,inflationary pressure eased and the rupiah stabilized around9000 IDR/USD. Price levels also finally stabilized and thebeginning of 1999 saw some deflation. The sluggish processof financial system and corporate debt restructuring started.
5.3. Response to the Crisis
5.3.1. Introduction
When the crisis unfolded, market confidence in Indonesiadisappeared and domestic conditions started to deterioratequickly as economists and market participants came to theconclusion that the rescheduling of Indonesia's debt and therescue of the financial system would require the backing ofwestern governments and international institutions: "No one
would want to buy Indonesian debt if it was just Indonesiandebt" [25]. The Indonesian authorities also noticed that with-out additional backing and emergency loans the country wouldsoon default on its debt. So, the IMF assistance was requestedin October 1997 and the first Letter of Intent, aid package of23 bln USD and a 10 bln Standby arrangement was announcedin early November. The IMF, not expecting the seriousness ofthe crisis, insisted on tough monetary and fiscal policies as wellas economic reforms, including the closure of some bankruptbanks. These measures, however, only aggravated the bank-run problem. On the other hand, there was no political will toimplement the reforms. As result, confidence further col-lapsed. Indonesia and the IMF signed the second agreement inmid-January 1998. The hardships with implementation ofagreed reforms and civil unrest again threw the program off-track. The IMF has been several times threatening to postponeor suspend the aid. From the third letter of intent in April, andan agreement with the new government after the fall of Soe-harto, the IMF acknowledged the severe economic conditionsand approved the implementation of less stringent measures.In July 1998, the Standby agreement was replaced with anExtended Fund Facility program.
As of June 2000, the international aid commitment toIndonesia amounted to 50 bln USD: 12 bln from the IMF, 10 blnfrom multilateral financial institutions (like World Bank or AsianDevelopment Bank) and 15 bln from bilateral agreements andprograms (like Japanese Miyazawa plan). About half of thispackage, i.e. 22 bln USD, has already been disbursed.
5.3.2. Monetary Policy Response
The government responded to the first run on the rupi-ah in July/August 1997 with a drastic credit contraction. BIstopped repurchasing central banks certificates, decreasingthe supply of local currency in an effort to discourage mar-ket participants from exchanging the rupiah into hard cur-rency, interest rates rose from around 15% to 30%.Although official statistics do not show a sharp decline in for-eign reserves, part of the stock was probably tied down inforward contracts, so the usable reserves were actuallylower. From September 1997, the reserves started to shrinkmuch faster. Facing a deteriorating domestic situation, fromSeptember BI gradually cut yields on its commercial papers.
Monetary policy was being carried out in an environ-ment of high debt-equity ratios and overall financial systemdistress, which made a prudent policy of high interest ratesalmost impossible to implement. Eventually, the Indone-sian authorities had to resort to IMF help. One of the maingoals that the IMF program pursued was to restore marketconfidence. Based on the presumption that the Indonesianeconomy was suffering from structural weaknesses than
CASE Reports No. 39
[25] After The Financial Times 30 I 1998 quoting a regional economist of one major western banks branch in Jakarta.
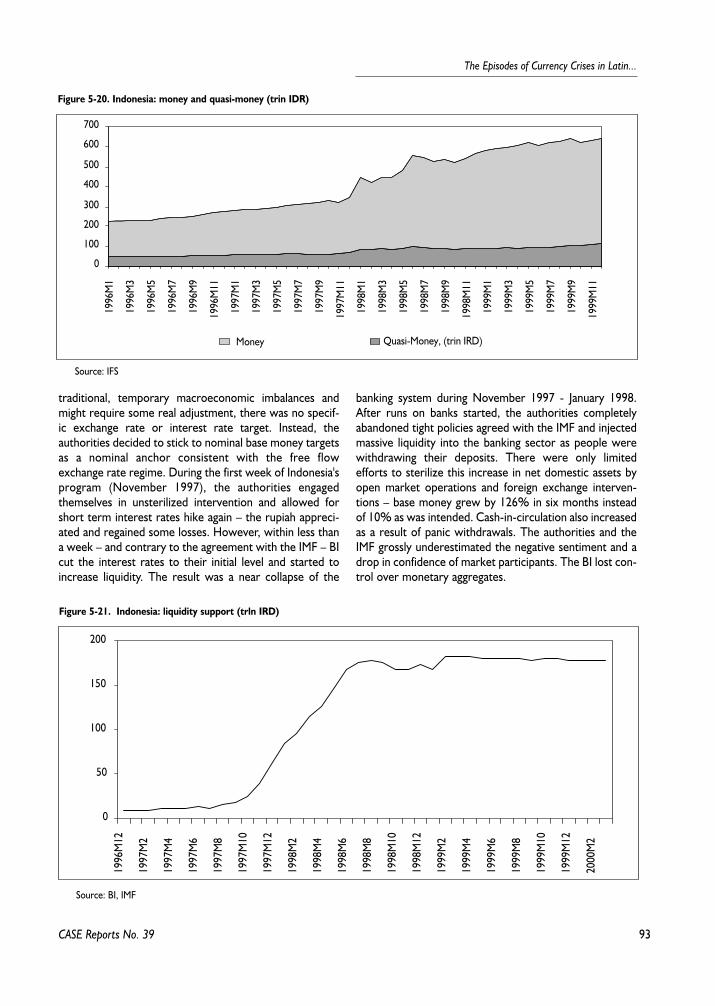
93
The Episodes of Currency Crises in Latin...
traditional, temporary macroeconomic imbalances andmight require some real adjustment, there was no specif-ic exchange rate or interest rate target. Instead, theauthorities decided to stick to nominal base money targetsas a nominal anchor consistent with the free flowexchange rate regime. During the first week of Indonesia'sprogram (November 1997), the authorities engagedthemselves in unsterilized intervention and allowed forshort term interest rates hike again – the rupiah appreci-ated and regained some losses. However, within less thana week – and contrary to the agreement with the IMF – BIcut the interest rates to their initial level and started toincrease liquidity. The result was a near collapse of the
banking system during November 1997 - January 1998.After runs on banks started, the authorities completelyabandoned tight policies agreed with the IMF and injectedmassive liquidity into the banking sector as people werewithdrawing their deposits. There were only limitedefforts to sterilize this increase in net domestic assets byopen market operations and foreign exchange interven-tions – base money grew by 126% in six months insteadof 10% as was intended. Cash-in-circulation also increasedas a result of panic withdrawals. The authorities and theIMF grossly underestimated the negative sentiment and adrop in confidence of market participants. The BI lost con-trol over monetary aggregates.
CASE Reports No. 39
Figure 5-20. Indonesia: money and quasi-money (trin IDR)
0
100
200
300
400
500
600
70019
96M
1
1996
M3
1996
M5
1996
M7
1996
M9
1996
M11
1997
M1
1997
M3
1997
M5
1997
M7
1997
M9
1997
M11
1998
M1
1998
M3
1998
M5
1998
M7
1998
M9
1998
M11
1999
M1
1999
M3
1999
M5
1999
M7
1999
M9
1999
M11
Money Quasi-Money, (trin IRD)
Source: IFS
Figure 5-21. Indonesia: liquidity support (trln IRD)
0
50
100
150
200
1996
M12
1997
M2
1997
M4
1997
M6
1997
M8
1997
M10
1997
M12
1998
M2
1998
M4
1998
M6
1998
M8
1998
M10
1998
M12
1999
M2
1999
M4
1999
M6
1999
M8
1999
M10
1999
M12
2000
M2
Source: BI, IMF
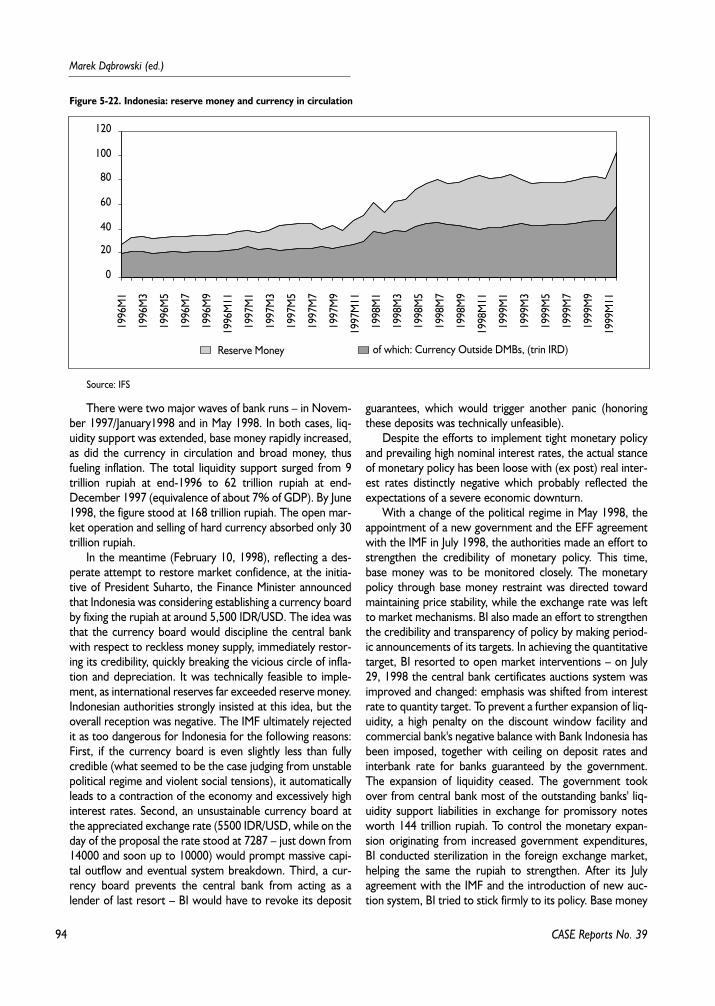
94
Marek D¹browski (ed.)
There were two major waves of bank runs – in Novem-ber 1997/January1998 and in May 1998. In both cases, liq-uidity support was extended, base money rapidly increased,as did the currency in circulation and broad money, thusfueling inflation. The total liquidity support surged from 9trillion rupiah at end-1996 to 62 trillion rupiah at end-December 1997 (equivalence of about 7% of GDP). By June1998, the figure stood at 168 trillion rupiah. The open mar-ket operation and selling of hard currency absorbed only 30trillion rupiah.
In the meantime (February 10, 1998), reflecting a des-perate attempt to restore market confidence, at the initia-tive of President Suharto, the Finance Minister announcedthat Indonesia was considering establishing a currency boardby fixing the rupiah at around 5,500 IDR/USD. The idea wasthat the currency board would discipline the central bankwith respect to reckless money supply, immediately restor-ing its credibility, quickly breaking the vicious circle of infla-tion and depreciation. It was technically feasible to imple-ment, as international reserves far exceeded reserve money.Indonesian authorities strongly insisted at this idea, but theoverall reception was negative. The IMF ultimately rejectedit as too dangerous for Indonesia for the following reasons:First, if the currency board is even slightly less than fullycredible (what seemed to be the case judging from unstablepolitical regime and violent social tensions), it automaticallyleads to a contraction of the economy and excessively highinterest rates. Second, an unsustainable currency board atthe appreciated exchange rate (5500 IDR/USD, while on theday of the proposal the rate stood at 7287 – just down from14000 and soon up to 10000) would prompt massive capi-tal outflow and eventual system breakdown. Third, a cur-rency board prevents the central bank from acting as alender of last resort – BI would have to revoke its deposit
guarantees, which would trigger another panic (honoringthese deposits was technically unfeasible).
Despite the efforts to implement tight monetary policyand prevailing high nominal interest rates, the actual stanceof monetary policy has been loose with (ex post) real inter-est rates distinctly negative which probably reflected theexpectations of a severe economic downturn.
With a change of the political regime in May 1998, theappointment of a new government and the EFF agreementwith the IMF in July 1998, the authorities made an effort tostrengthen the credibility of monetary policy. This time,base money was to be monitored closely. The monetarypolicy through base money restraint was directed towardmaintaining price stability, while the exchange rate was leftto market mechanisms. BI also made an effort to strengthenthe credibility and transparency of policy by making period-ic announcements of its targets. In achieving the quantitativetarget, BI resorted to open market interventions – on July29, 1998 the central bank certificates auctions system wasimproved and changed: emphasis was shifted from interestrate to quantity target. To prevent a further expansion of liq-uidity, a high penalty on the discount window facility andcommercial bank's negative balance with Bank Indonesia hasbeen imposed, together with ceiling on deposit rates andinterbank rate for banks guaranteed by the government.The expansion of liquidity ceased. The government tookover from central bank most of the outstanding banks' liq-uidity support liabilities in exchange for promissory notesworth 144 trillion rupiah. To control the monetary expan-sion originating from increased government expenditures,BI conducted sterilization in the foreign exchange market,helping the same the rupiah to strengthen. After its Julyagreement with the IMF and the introduction of new auc-tion system, BI tried to stick firmly to its policy. Base money
CASE Reports No. 39
Figure 5-22. Indonesia: reserve money and currency in circulation
0
20
40
60
80
100
12019
96M
1
1996
M3
1996
M5
1996
M7
1996
M9
1996
M11
1997
M1
1997
M3
1997
M5
1997
M7
1997
M9
1997
M11
1998
M1
1998
M3
1998
M5
1998
M7
1998
M9
1998
M11
1999
M1
1999
M3
1999
M5
1999
M7
1999
M9
1999
M11
Reserve Money of which: Currency Outside DMBs, (trin IRD)
Source: IFS
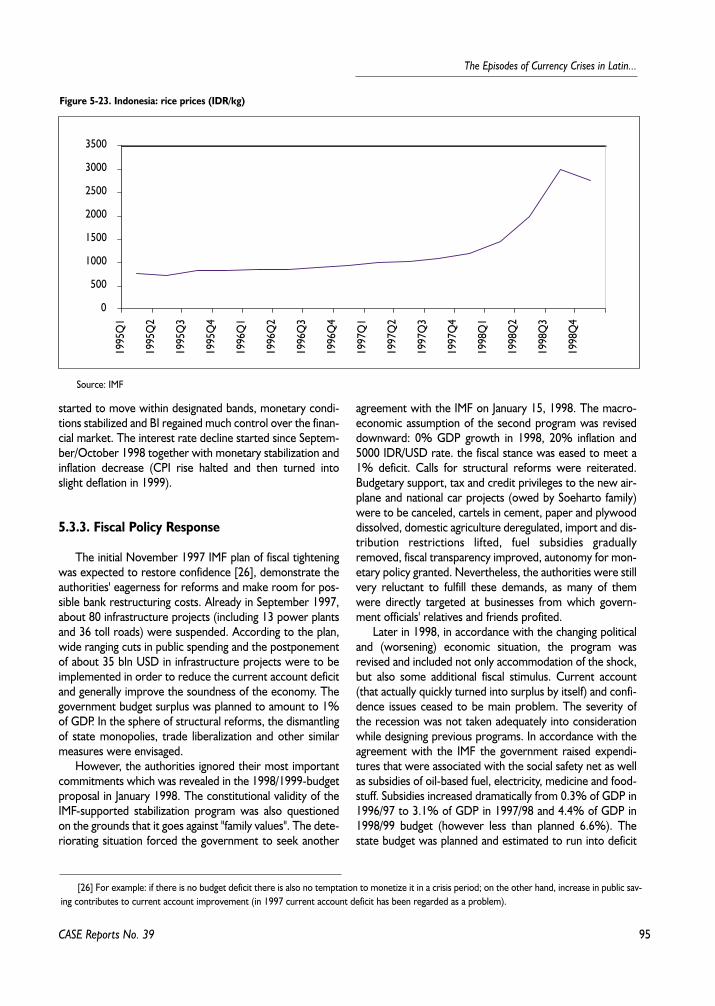
95
The Episodes of Currency Crises in Latin...
started to move within designated bands, monetary condi-tions stabilized and BI regained much control over the finan-cial market. The interest rate decline started since Septem-ber/October 1998 together with monetary stabilization andinflation decrease (CPI rise halted and then turned intoslight deflation in 1999).
5.3.3. Fiscal Policy Response
The initial November 1997 IMF plan of fiscal tighteningwas expected to restore confidence [26], demonstrate theauthorities' eagerness for reforms and make room for pos-sible bank restructuring costs. Already in September 1997,about 80 infrastructure projects (including 13 power plantsand 36 toll roads) were suspended. According to the plan,wide ranging cuts in public spending and the postponementof about 35 bln USD in infrastructure projects were to beimplemented in order to reduce the current account deficitand generally improve the soundness of the economy. Thegovernment budget surplus was planned to amount to 1%of GDP. In the sphere of structural reforms, the dismantlingof state monopolies, trade liberalization and other similarmeasures were envisaged.
However, the authorities ignored their most importantcommitments which was revealed in the 1998/1999-budgetproposal in January 1998. The constitutional validity of theIMF-supported stabilization program was also questionedon the grounds that it goes against "family values". The dete-riorating situation forced the government to seek another
agreement with the IMF on January 15, 1998. The macro-economic assumption of the second program was reviseddownward: 0% GDP growth in 1998, 20% inflation and5000 IDR/USD rate. the fiscal stance was eased to meet a1% deficit. Calls for structural reforms were reiterated.Budgetary support, tax and credit privileges to the new air-plane and national car projects (owed by Soeharto family)were to be canceled, cartels in cement, paper and plywooddissolved, domestic agriculture deregulated, import and dis-tribution restrictions lifted, fuel subsidies graduallyremoved, fiscal transparency improved, autonomy for mon-etary policy granted. Nevertheless, the authorities were stillvery reluctant to fulfill these demands, as many of themwere directly targeted at businesses from which govern-ment officials' relatives and friends profited.
Later in 1998, in accordance with the changing politicaland (worsening) economic situation, the program wasrevised and included not only accommodation of the shock,but also some additional fiscal stimulus. Current account(that actually quickly turned into surplus by itself) and confi-dence issues ceased to be main problem. The severity ofthe recession was not taken adequately into considerationwhile designing previous programs. In accordance with theagreement with the IMF the government raised expendi-tures that were associated with the social safety net as wellas subsidies of oil-based fuel, electricity, medicine and food-stuff. Subsidies increased dramatically from 0.3% of GDP in1996/97 to 3.1% of GDP in 1997/98 and 4.4% of GDP in1998/99 budget (however less than planned 6.6%). Thestate budget was planned and estimated to run into deficit
CASE Reports No. 39
[26] For example: if there is no budget deficit there is also no temptation to monetize it in a crisis period; on the other hand, increase in public sav-ing contributes to current account improvement (in 1997 current account deficit has been regarded as a problem).
Figure 5-23. Indonesia: rice prices (IDR/kg)
0
500
1000
1500
2000
2500
3000
3500
1995
Q1
1995
Q2
1995
Q3
1995
Q4
1996
Q1
1996
Q2
1996
Q3
1996
Q4
1997
Q1
1997
Q2
1997
Q3
1997
Q4
1998
Q1
1998
Q2
1998
Q3
1998
Q4
Source: IMF
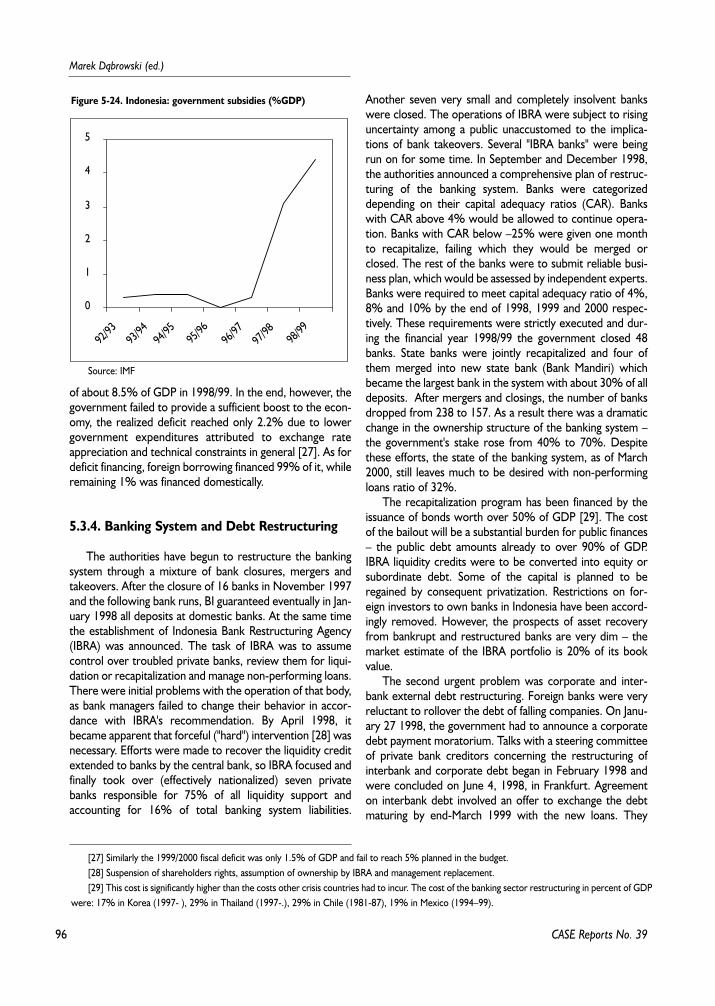
96
Marek D¹browski (ed.)
of about 8.5% of GDP in 1998/99. In the end, however, thegovernment failed to provide a sufficient boost to the econ-omy, the realized deficit reached only 2.2% due to lowergovernment expenditures attributed to exchange rateappreciation and technical constraints in general [27]. As fordeficit financing, foreign borrowing financed 99% of it, whileremaining 1% was financed domestically.
5.3.4. Banking System and Debt Restructuring
The authorities have begun to restructure the bankingsystem through a mixture of bank closures, mergers andtakeovers. After the closure of 16 banks in November 1997and the following bank runs, BI guaranteed eventually in Jan-uary 1998 all deposits at domestic banks. At the same timethe establishment of Indonesia Bank Restructuring Agency(IBRA) was announced. The task of IBRA was to assumecontrol over troubled private banks, review them for liqui-dation or recapitalization and manage non-performing loans.There were initial problems with the operation of that body,as bank managers failed to change their behavior in accor-dance with IBRA's recommendation. By April 1998, itbecame apparent that forceful ("hard") intervention [28] wasnecessary. Efforts were made to recover the liquidity creditextended to banks by the central bank, so IBRA focused andfinally took over (effectively nationalized) seven privatebanks responsible for 75% of all liquidity support andaccounting for 16% of total banking system liabilities.
Another seven very small and completely insolvent bankswere closed. The operations of IBRA were subject to risinguncertainty among a public unaccustomed to the implica-tions of bank takeovers. Several "IBRA banks" were beingrun on for some time. In September and December 1998,the authorities announced a comprehensive plan of restruc-turing of the banking system. Banks were categorizeddepending on their capital adequacy ratios (CAR). Bankswith CAR above 4% would be allowed to continue opera-tion. Banks with CAR below –25% were given one monthto recapitalize, failing which they would be merged orclosed. The rest of the banks were to submit reliable busi-ness plan, which would be assessed by independent experts.Banks were required to meet capital adequacy ratio of 4%,8% and 10% by the end of 1998, 1999 and 2000 respec-tively. These requirements were strictly executed and dur-ing the financial year 1998/99 the government closed 48banks. State banks were jointly recapitalized and four ofthem merged into new state bank (Bank Mandiri) whichbecame the largest bank in the system with about 30% of alldeposits. After mergers and closings, the number of banksdropped from 238 to 157. As a result there was a dramaticchange in the ownership structure of the banking system –the government's stake rose from 40% to 70%. Despitethese efforts, the state of the banking system, as of March2000, still leaves much to be desired with non-performingloans ratio of 32%.
The recapitalization program has been financed by theissuance of bonds worth over 50% of GDP [29]. The costof the bailout will be a substantial burden for public finances– the public debt amounts already to over 90% of GDP.IBRA liquidity credits were to be converted into equity orsubordinate debt. Some of the capital is planned to beregained by consequent privatization. Restrictions on for-eign investors to own banks in Indonesia have been accord-ingly removed. However, the prospects of asset recoveryfrom bankrupt and restructured banks are very dim – themarket estimate of the IBRA portfolio is 20% of its bookvalue.
The second urgent problem was corporate and inter-bank external debt restructuring. Foreign banks were veryreluctant to rollover the debt of falling companies. On Janu-ary 27 1998, the government had to announce a corporatedebt payment moratorium. Talks with a steering committeeof private bank creditors concerning the restructuring ofinterbank and corporate debt began in February 1998 andwere concluded on June 4, 1998, in Frankfurt. Agreementon interbank debt involved an offer to exchange the debtmaturing by end-March 1999 with the new loans. They
CASE Reports No. 39
[27] Similarly the 1999/2000 fiscal deficit was only 1.5% of GDP and fail to reach 5% planned in the budget.[28] Suspension of shareholders rights, assumption of ownership by IBRA and management replacement.[29] This cost is significantly higher than the costs other crisis countries had to incur. The cost of the banking sector restructuring in percent of GDP
were: 17% in Korea (1997- ), 29% in Thailand (1997-.), 29% in Chile (1981-87), 19% in Mexico (1994–99).
Figure 5-24. Indonesia: government subsidies (%GDP)
0
1
2
3
4
5
92/93
93/94
94/95 95
/9696
/9797
/98 98/99
Source: IMF
97
The Episodes of Currency Crises in Latin...
were backed by a full dollar guarantee of Bank Indonesiaand of maturities from one year (not more than 15% of thenew loans) to four years (at least 10% of the new loans) atan interest around 300 basis points above Libor. Foreignbanks committed to maintain trade financing as far as possi-ble. To eliminate a crunch in international trade paymentsand kick-start import/export activities, Bank Indonesia set-tled the trade arrears of commercial banks amounting tomore than 1 bln USD. Unlike with the banking system, theIndonesian government was reluctant to extend direct sup-port to the private sector, but preferred instead to providea government-supported umbrella for restructuring privatesector debt with some tax concessions and preferentialfinancing rates, but without any formal guarantees [30].
This was reflected in the scheme of corporate debtrestructuring agreed in Frankfurt. It provided a frameworkfor voluntary restructuring of external debt through directnegotiations between debtors and creditors with a supportand mediation of a new governmental body called theIndonesian Debt Restructuring Agency (INDRA) establishedin August 1998. Its task was to provide exchange rate guar-antees under condition that the agreement met certain con-ditions (a minimum eight years maturity and three yearsgrace period). INDRA would not guarantee payment, butonly the exchange rate and would supply foreign exchangeusing the best 20-day average rate before June 1999, with areset option if the rupiah appreciate more. The INDRAscheme was complemented by so called "Jakarta Initiative",i.e. the set of guidelines for debt restructuring workoutbased on a London approach [31]. In the meantime thenew, tough bankruptcy law took effect in August 1998, andthe reluctant companies had an additional incentive to joinINDRA-scheme. The market reactions and the experiencewith implementation are not too satisfactory. By February1999, some 120 companies with total debt of 18 bln USDwere registered to Jakarta Initiative. By July 2000, only 5 blnUSD has been rescheduled, i.e. not much more than 1% oftotal eligible debt. Numerous institutional and politicalobstacles and the failure of the legal system to pose a cred-ible threat to the debtors obstruct the process. The corpo-rate debt resolving continues, but its slow pace underminesthe economic recovery and market confidence in Indonesia.In December 2000, the IMF warned Indonesia of the possi-ble consequences and urged the authorities to deal with theproblem.
The stock market index hit an all-time low in September1998 but as soon as monetary and political conditions stabi-lized the market rebounded quickly as foreign investorstook advantage of unbelievably cheap equity prices [32].
The bourse reached pre-crisis levels in early 2000 but soonafter that, in the first month of 2000, lost 40% due to a pro-longed crisis and higher US interest rates. The propertymarket remains weak with a 35% vacancy rate in office realestate.
5.3.5. Prospects for the Future
In early 1999, new electoral laws were adopted and inJune the country's first free and honest elections wereheld. In contrast with the past, there was more than onecandidate for presidential post, which finally was won byAbdurrahman Wahid, an open-minded and relatively liber-al leader of the major Muslim organization. GDP grew aslight 0.1% in 1999 and is estimated to grow between 3%and 4% in 2000 and 4–5% in 2001. The rupiah graduallydepreciated from 6900 IDR in October 1999, right afterthe new elections, to around 9500–10000 IDR/USD inDecember 2000. Indonesia is still heavily dependent oninternational support. Failure to meet the IMF's and for-eign creditors' expectations can still have serious conse-quences but pressure from outside strengthens the pro-reform faction in the government. So, ironically, theauthorities (can) take advantage of the crisis to pushthrough some important reforms.
5.4. Conclusions
Indonesia is the most hard hit country among the EastAsian crisis' victims. GDP fell 14% in 1998 and only aftertwo years does it show any sign of recovery – it is going totake a long time until GDP growth returns to pre-crisis lev-els of 7%. As a result of the crisis, the political regime col-lapsed, social and ethnic tensions erupted, the country'sintegrity has been threatened and a poverty problememerged.
This paper tried to answer why this was the case. Theanswer is that Indonesia had probably the worst economicfundamentals of all the East Asian countries. The economywas ridden by corruption and monopolized. The weakfinancial system engaged itself in reckless credit expansion,dangerously risky investments or even quasi-criminal activi-ties. Overoptimistic corporate sector accustomed to theabundance of capital ceased completely to insure againsteconomic risk. Short-term external debt mounted, with apresumption that it would never have to be paid back and
CASE Reports No. 39
[30] This was similar to Mexican corporate debt restructuring framework called "Ficorca".[31] The London approach to debt resolution is a voluntary, non-binding framework in which creditors agree to keep credit facilities in place, seek
out-of-court solution and work together in good will.[32] In USD terms Indonesian shares were 12 times cheaper (!) in September 1998 than in June 1997 – this is what people call "the fire sale FDI".
98
Marek D¹browski (ed.)
that the exchange rate would be pegged forever. The quali-ty and efficiency of investment decreased.
The case of Indonesia speaks in favor of a view that thereis a relationship between fundamentals and (the severity of)a crisis. The course of Indonesia's development was defi-nitely unsustainable – at some point such a policy wouldhave to fail, so investors withdrew before the momentcame, as in the first generation theoretical crisis models.
On the other hand, had the financial panic not erupted,first in some other country (Thailand), Indonesia could fur-ther develop uninterruptedly – would need some econom-ic reform but, still, there was nothing about the economythat called for immediate collapse. What eventually broughtIndonesia down was self-fulfilling panic among internationalcreditors that drove them to cancel loans just because otherinvestors were doing the same. Such a situation is welldescribed by the second-generation-self-fulfilling-crisis the-oretical models.
The case of Indonesia (and more generally of the Asianfinancial crises) is neither unique, nor can it be fullyexplained by any of the two main theoretical views. Ratherit can be said that for some range of fundamentals, i.e. whenthe state of the economy worsens but not up to the pointwhen the collapse is inevitable – the country becomes vul-nerable to a crisis caused by self-fulfilling panic.
The Asian crisis calls for the reassessment of the notionof a "fundamental". It cannot be limited to easily measurable,"classic" macroeconomic variables such as fiscal deficit, mon-etary expansion, inadequate reserves or "political" factorslike unemployment or recession. This notion should bebroadened by such vogue ideas as 'credibility', "moral haz-ard", or strictly microeconomic factors, i.e. structure of thecorporate sector, strength of a financial system, etc. In thecase of Indonesia, these fundamentals were in a very badstate.
CASE Reports No. 39
99
The Episodes of Currency Crises in Latin...
Appendix 1: The chronology of theIndonesian crisis
1997May: Thai currency comes under speculative pressure.July: Thai, Malaysian, Philippine, and Indonesian curren-
cies all depreciate. August 14: Indonesia abolishes its system of a man-
aged exchange rate. The rupiah starts to depreciateSeptember 16: 15 government "mega-projects" are
postponed. October 8: Indonesia says it will ask the IMF for
financial assistance. October 31: Indonesia's IMF package is unveiled. It pro-
vides for more than 23 USD bln in aid. November 1: Sixteen banks are closed as first step in
IMF package, what causes panic and bank runs amongdepositors.
November 5: IMF approves a US$10 billion loan forIndonesia as part of the massive international package.
December 5: Soeharto takes 10 days rest after a 12-dayworld tour and misses ASEAN summit.
December 9-12: Finance Minister fails to negotiate thedebt rollover in Washington.
1998January 6: Indonesia unveils an expansionary 1998/99
budget, contrary to IMF demands of a budget surplus. Therupiah loses half its value over a five-day period.
January 9: Ratings agency Standard & Poor downgradesIndonesia's currency to "junk bond" status.
mid-January: More or less direct calls start to be madefor a change of the regime.
January 15: Soeharto signs a new IMF agreements. January till mid-February: Anti-Chinese food riots take
place in at least a dozen places throughout Indonesia.mid-January: All but 22 of the 286 companies listed on
the Jakarta stock exchange are technically bankrupt. Prop-erty companies are the worst.
January 27: Government announces a moratorium onrepaying debts and interest, and promises to guarantee alldeposits of commercial banks.
February: Soeharto proposal of a currency board isannounced, criticized and finally turned down.
February : Talks with a steering committee of privatebank creditors concerning the restructuring of interbankand corporate debt begin
March 10: Soeharto is re-elected to a seventh five-yearterm with Habibie as vice president.
May 4: Fuel prices are increased by up to 71 percent.Three days of riots follow.
May 9: Soeharto leaves for a week-long visit to Egypt. May 12: The army troops shoot four students at Jakarta
protest. May 13-14: Rioting spreads throughout Jakarta. Estimat-
ed 1,200 people die in two days. When Soeharto returnsfrom Egypt, he faces a flood of calls to resign.
May 21: Soeharto resigns and hands power to Habibie. June 4: Agreement concerning debt restructuring is
reached in Frankfurt.June 17: The rupiah again hits 17,000 against the dollar. July 29: The central bank certificates auctions system
was improved and changed in attempt to regain controlover monetary aggregates.
September 24: Paris Club reschedules $4.2 billion ofsovereign debt. Annual inflation rises to 82.4 percent in Sep-tember.
September 29: Indonesia strengthens bank recapitaliza-tion scheme.
October: Monetary stability gradually returns, inflation-ary pressure eases and the rupiah stabilizes around 9000IDR/USD.
November 10: Special session of the Parliament beginsto discuss election and political reforms.
1999March 13: Government closes 38 insolvent banks. June 7: Indonesia holds first democratic election since
1955.August 6: Finance Minister admits there were "irregular-
ities" in loan-recovery process. The scandal prompts IMFand World Bank to threaten loan suspension.
October 1: Indonesia announces seventh month ofdeflation, with annual inflation of 1.25 percent.
October 20: Wahid has been elected President.
CASE Reports No. 39
[33] This chronology wes much to "CNN Asia Now", October 1999 and "Inside Indonesia", report No. 54, April-June.
100
Marek D¹browski (ed.)
References
Annual report on exchange rate arrangement, IMF 1996,1997, 1998, 1999, 2000.
Bank Indonesia (BI), Annual report, 1997/98, 1999/99.Corsetti G., Pesenti P., Roubini N. (1998). "What Caused
the Asian Currency and Financial Crisis". Banca d'Italia, Temidi discussione 343.
Claessens S., Djankov S., Lang L. (1998). "East AsianCorporates: Growth, Financing and Risks over the LastDecade". Mimeo, World Bank.
CNN Asia Now, October 1999.Delhaize P. (1999). "Asia in Crisis". John Wiley&Sons.Edison H.J. (2000). "Do Indicators of Financial Crises
Work? An Evaluation of an Early Warning System". Board ofGovernors of the Federal Reserve System IFDP 675.
Enoch Ch. (2000). "Intervention in Banks During BankingCrises: the Experience of Indonesia". IMF PDP/00/2
Financial Times, 1994: 24 VI; 1995: 9 VI; 1997: 1-2 XI,24 XI; 1998: 17-18 I, 30 I, 1 VII.
Gould D.M., Kamin S.B. (2000). "The Impact of Mone-tary Policy on Exchange Rates During Financial Crises".Board of Governors of the Federal Reserve System IFDP675.
Inside Indonesia, report no 54, April-June 1998.IMF (1999). "Indonesia – statistical appendix".IMF (1999). "IMF-Supported Programs in Indonesia,
Korea and Thailand, a Preliminary Assessment". IMF Occa-sional Paper 178.
IMF (2000). "Recovery From the Asian Crisis and theRole of the IMF".
International Crisis Group (2000). "Crisis in Indonesia".Mimeo.
Milesi-Ferretti G., Razin A. (1996). "Current AccountSustainability, Selected East Asian and Latin America Experi-ences, IMF WP 96/10.
Montgomery J. (1997). "The Indonesian Financial Sys-tem: its Contribution to Economic Performance and KeyPolicy Issues". IMF WP/97/45.
Kamin S. (1999). "The Current International FinancialCrisis, How Much is New?". Journal of International Moneyand Finance, vol.18, no.4, 1999.
Krugman P. (1994). "The Myth of Asia's Miracle". ForeignAffairs, Nov.-Dec.
Krugman P. (1998). "What Happened to Asia". Mimeo.Obstfeld M., K. Rogoff (1995). "The Mirage of Fixed
Exchange Rates". Journal of Economic Perspectives 9,73–96.
Sarel M. (1997). "Growth and Productivity in ASEANCountries". IMF WP 97/97.
Sarno L., Taylor M.P. (1999). "Moral Hazard, Asset PriceBubbles, Capital Flows and East Asian Crisis, a First Test".Journal of International Money and Finance, vol.18, no.4,
1999.Stone M.R. (1998). "Corporate Debt Restructuring in
East Asia: Some Lessons from International Experience, IMFPPAA 98/13.
Transparency International, Annual report 1995, 1996,1997, 1998, mimeo.
Wall Street Journal, 1997: 31 XII, 1998: 9–10 I.World Bank (1998), Responding to the East Asian Crisis.
CASE Reports No. 39
101
The Episodes of Currency Crises in Latin...
CASE Reports No. 39
6.1. Was Korea Different?
6.1.1. Introduction
Financial crises' episodes of the 1990's differ from thoseof the 1980's in that recently they have occurred in coun-tries on their way to social and economic development. Theinitial success in implementing reforms, and the evidentprosperity for the future, encouraged foreign investors todiversify their portfolios towards emerging markets. Addi-tional capital inflows allows financing economic growth andspeeds up the process of integration with the global market.On the other hand, the same capital can cause troubleswhen it becomes an abrupt and sharp outflow. Why andwhen does it happen?
The group of countries that came under speculativeattack in 1997 in Southeast Asia can be roughly summa-rized within the above scenario. Yet the roots underlyingthe crisis in each country within the same group should betreated as country-specific. Of course, there were somecommon features among them, but in order to identifymain characteristics for an individual economy, a separateanalysis is required. This is even truer for South Korea(hereafter referred to as Korea) where strong macroeco-nomic performance until late 1997 did not let most ana-lysts foresee the crisis. Even the eruption of crises in coun-tries from the neighboring region, marked by the July Thaibath devaluation, did not downgrade the assessment givenby the international rating agencies to Korea.
This paper aims to explore the major factors lyingbehind the Korean financial crisis. It further looks at thesources of the crisis that took its roots in highly leveragedcompanies with a weak balance sheet, and a poor func-tioning banking system. It shows that while macroeco-nomic imbalances played a minor role, the close relation-ship among banks, corporations and the government cre-
ated problems, which resulted in numbers of bankruptciesand in the end led to the sharp and unexpected economicdownturn.
6.1.2. Background to the Crisis
The currency crisis, which erupted in Korea in the endof 1997 hardly fits the first or second-generation conceptu-al frameworks, where irresponsible government policiesand investors' panic play a crucial role. The sudden collapsealso cannot be solely attributed to the possible contagioneffect across the Asian countries facing similar problems atthat time. The 1997 Korean experience is an example,which confirms that financial crises occur not only whenmacroeconomic but also microeconomic indicators identifyvulnerabilities. Although indicators like GDP growth, infla-tion or fiscal balances are important measures of economicsoundness, healthy financial and corporate sectors are anessential prerequisite to a successful financial system dereg-ulation as well as liberalization of capital account.
In an oversimplification of the classification, the eco-nomic fundamentals can be divided into two broad cate-gories: macro and micro-economic. Looking solely at theformer, many failed to predict the 1997 Korean crisis. Thisis because at the onset of the crisis, macroeconomic funda-mentals in Korea remained relatively sound and did notshow many signs of vulnerability. Real GDP growth rateoscillated around 8 percent between 1994 and 1996. At thesame time, inflation measured by CPI was under controland averaged at 5.1 percent per annum. The price stabi-lization led to a gradual decline in nominal interest rates.The three-year corporate bond yields, declined from 16.2percent in 1992 to 11.9 percent in 1996. The consolidatedcentral government position was balanced or even in sur-plus and public debt was less than 10 percent of GDP in theend of 1996 [1].
Part VI.The South Korean Currency Crisis, 1997–1998by Monika B³aszkiewicz
[1] This number, however, can be misleading due to substantial quasi-fiscal burden in Korea arising from the governmental support to privately ownbanks. In this case large public expenditures did not appear on the general government balance sheet. Additionally, such a practice posed a moral haz-ard problem.
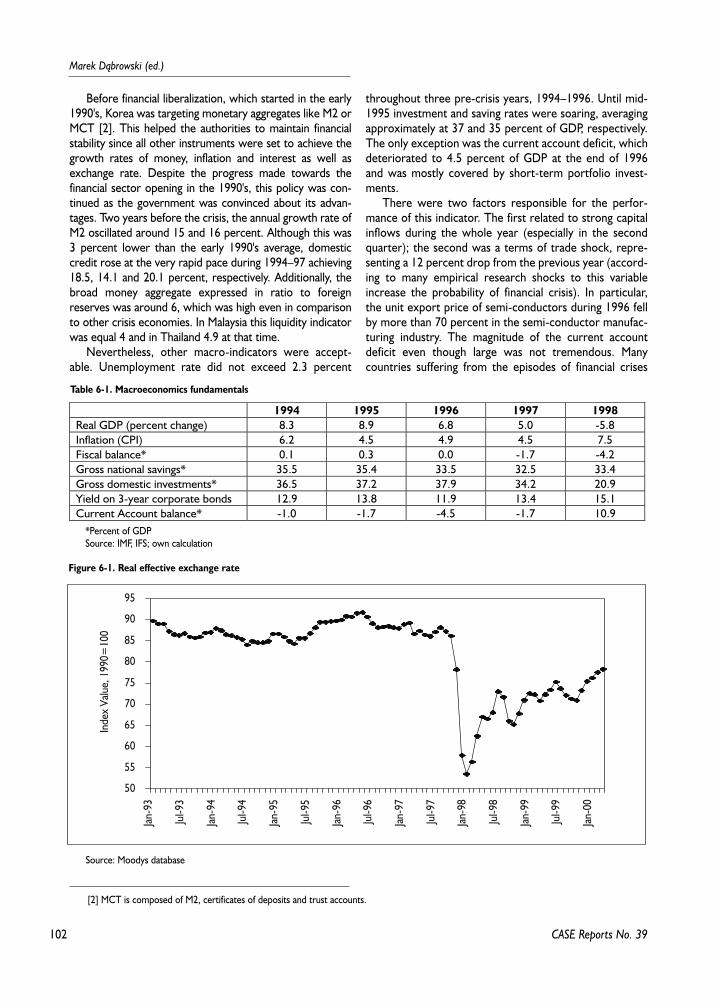
102
Marek D¹browski (ed.)
CASE Reports No. 39
Before financial liberalization, which started in the early1990's, Korea was targeting monetary aggregates like M2 orMCT [2]. This helped the authorities to maintain financialstability since all other instruments were set to achieve thegrowth rates of money, inflation and interest as well asexchange rate. Despite the progress made towards thefinancial sector opening in the 1990's, this policy was con-tinued as the government was convinced about its advan-tages. Two years before the crisis, the annual growth rate ofM2 oscillated around 15 and 16 percent. Although this was3 percent lower than the early 1990's average, domesticcredit rose at the very rapid pace during 1994–97 achieving18.5, 14.1 and 20.1 percent, respectively. Additionally, thebroad money aggregate expressed in ratio to foreignreserves was around 6, which was high even in comparisonto other crisis economies. In Malaysia this liquidity indicatorwas equal 4 and in Thailand 4.9 at that time.
Nevertheless, other macro-indicators were accept-able. Unemployment rate did not exceed 2.3 percent
throughout three pre-crisis years, 1994–1996. Until mid-1995 investment and saving rates were soaring, averagingapproximately at 37 and 35 percent of GDP, respectively.The only exception was the current account deficit, whichdeteriorated to 4.5 percent of GDP at the end of 1996and was mostly covered by short-term portfolio invest-ments.
There were two factors responsible for the perfor-mance of this indicator. The first related to strong capitalinflows during the whole year (especially in the secondquarter); the second was a terms of trade shock, repre-senting a 12 percent drop from the previous year (accord-ing to many empirical research shocks to this variableincrease the probability of financial crisis). In particular,the unit export price of semi-conductors during 1996 fellby more than 70 percent in the semi-conductor manufac-turing industry. The magnitude of the current accountdeficit even though large was not tremendous. Manycountries suffering from the episodes of financial crises
Figure 6-1. Real effective exchange rate
50
55
60
65
70
75
80
85
90
95
Jan-
93
Jul-9
3
Jan-
94
Jul-9
4
Jan-
95
Jul-9
5
Jan-
96
Jul-9
6
Jan-
97
Jul-9
7
Jan-
98
Jul-9
8
Jan-
99
Jul-9
9
Jan-
00
Inde
x Va
lue,
199
0=10
0
Source: Moodys database
[2] MCT is composed of M2, certificates of deposits and trust accounts.
Table 6-1. Macroeconomics fundamentals
1994 1995 1996 1997 1998Real GDP (percent change) 8.3 8.9 6.8 5.0 -5.8Inflation (CPI) 6.2 4.5 4.9 4.5 7.5Fiscal balance* 0.1 0.3 0.0 -1.7 -4.2Gross national savings* 35.5 35.4 33.5 32.5 33.4Gross domestic investments* 36.5 37.2 37.9 34.2 20.9Yield on 3-year corporate bonds 12.9 13.8 11.9 13.4 15.1Current Account balance* -1.0 -1.7 -4.5 -1.7 10.9
*Percent of GDPSource: IMF, IFS; own calculation
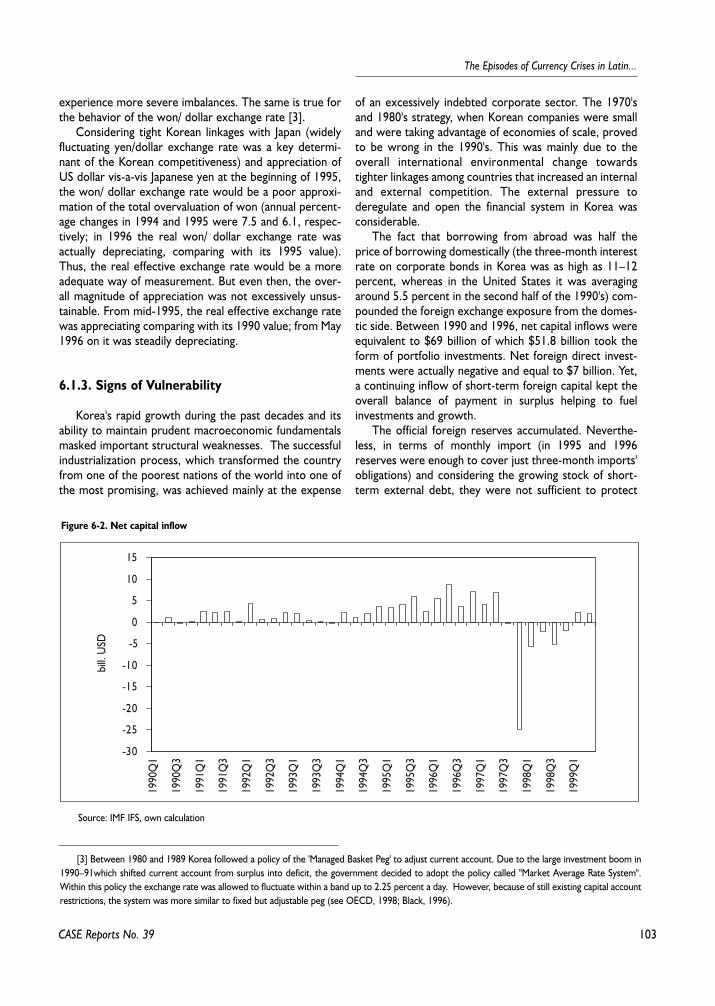
103
The Episodes of Currency Crises in Latin...
CASE Reports No. 39
experience more severe imbalances. The same is true forthe behavior of the won/ dollar exchange rate [3].
Considering tight Korean linkages with Japan (widelyfluctuating yen/dollar exchange rate was a key determi-nant of the Korean competitiveness) and appreciation ofUS dollar vis-a-vis Japanese yen at the beginning of 1995,the won/ dollar exchange rate would be a poor approxi-mation of the total overvaluation of won (annual percent-age changes in 1994 and 1995 were 7.5 and 6.1, respec-tively; in 1996 the real won/ dollar exchange rate wasactually depreciating, comparing with its 1995 value).Thus, the real effective exchange rate would be a moreadequate way of measurement. But even then, the over-all magnitude of appreciation was not excessively unsus-tainable. From mid-1995, the real effective exchange ratewas appreciating comparing with its 1990 value; from May1996 on it was steadily depreciating.
6.1.3. Signs of Vulnerability
Korea's rapid growth during the past decades and itsability to maintain prudent macroeconomic fundamentalsmasked important structural weaknesses. The successfulindustrialization process, which transformed the countryfrom one of the poorest nations of the world into one ofthe most promising, was achieved mainly at the expense
of an excessively indebted corporate sector. The 1970'sand 1980's strategy, when Korean companies were smalland were taking advantage of economies of scale, provedto be wrong in the 1990's. This was mainly due to theoverall international environmental change towardstighter linkages among countries that increased an internaland external competition. The external pressure toderegulate and open the financial system in Korea wasconsiderable.
The fact that borrowing from abroad was half theprice of borrowing domestically (the three-month interestrate on corporate bonds in Korea was as high as 11–12percent, whereas in the United States it was averagingaround 5.5 percent in the second half of the 1990's) com-pounded the foreign exchange exposure from the domes-tic side. Between 1990 and 1996, net capital inflows wereequivalent to $69 billion of which $51.8 billion took theform of portfolio investments. Net foreign direct invest-ments were actually negative and equal to $7 billion. Yet,a continuing inflow of short-term foreign capital kept theoverall balance of payment in surplus helping to fuelinvestments and growth.
The official foreign reserves accumulated. Neverthe-less, in terms of monthly import (in 1995 and 1996reserves were enough to cover just three-month imports'obligations) and considering the growing stock of short-term external debt, they were not sufficient to protect
[3] Between 1980 and 1989 Korea followed a policy of the 'Managed Basket Peg' to adjust current account. Due to the large investment boom in1990–91which shifted current account from surplus into deficit, the government decided to adopt the policy called "Market Average Rate System".Within this policy the exchange rate was allowed to fluctuate within a band up to 2.25 percent a day. However, because of still existing capital accountrestrictions, the system was more similar to fixed but adjustable peg (see OECD, 1998; Black, 1996).
Figure 6-2. Net capital inflow
-30
-25
-20
-15
-10
-5
0
5
10
15
1990
Q1
1990
Q3
1991
Q1
1991
Q3
1992
Q1
1992
Q3
1993
Q1
1993
Q3
1994
Q1
1994
Q3
1995
Q1
1995
Q3
1996
Q1
1996
Q3
1997
Q1
1997
Q3
1998
Q1
1998
Q3
1999
Q1
bill.
USD
Source: IMF IFS, own calculation
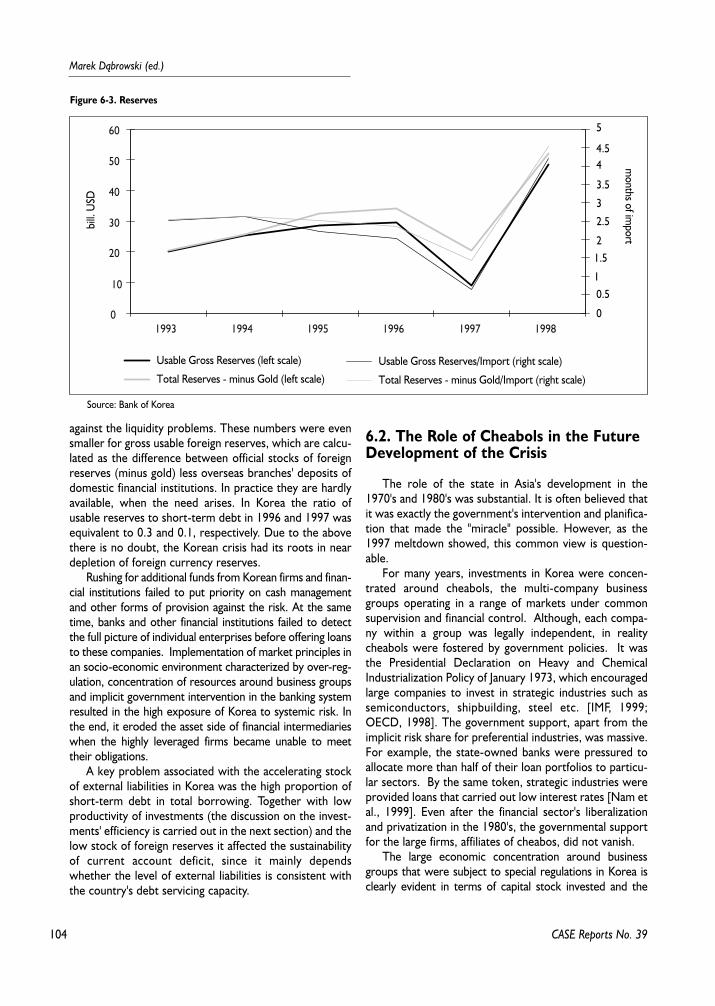
104
Marek D¹browski (ed.)
CASE Reports No. 39
against the liquidity problems. These numbers were evensmaller for gross usable foreign reserves, which are calcu-lated as the difference between official stocks of foreignreserves (minus gold) less overseas branches' deposits ofdomestic financial institutions. In practice they are hardlyavailable, when the need arises. In Korea the ratio ofusable reserves to short-term debt in 1996 and 1997 wasequivalent to 0.3 and 0.1, respectively. Due to the abovethere is no doubt, the Korean crisis had its roots in neardepletion of foreign currency reserves.
Rushing for additional funds from Korean firms and finan-cial institutions failed to put priority on cash managementand other forms of provision against the risk. At the sametime, banks and other financial institutions failed to detectthe full picture of individual enterprises before offering loansto these companies. Implementation of market principles inan socio-economic environment characterized by over-reg-ulation, concentration of resources around business groupsand implicit government intervention in the banking systemresulted in the high exposure of Korea to systemic risk. Inthe end, it eroded the asset side of financial intermediarieswhen the highly leveraged firms became unable to meettheir obligations.
A key problem associated with the accelerating stockof external liabilities in Korea was the high proportion ofshort-term debt in total borrowing. Together with lowproductivity of investments (the discussion on the invest-ments' efficiency is carried out in the next section) and thelow stock of foreign reserves it affected the sustainabilityof current account deficit, since it mainly dependswhether the level of external liabilities is consistent withthe country's debt servicing capacity.
6.2. The Role of Cheabols in the FutureDevelopment of the Crisis
The role of the state in Asia's development in the1970's and 1980's was substantial. It is often believed thatit was exactly the government's intervention and planifica-tion that made the "miracle" possible. However, as the1997 meltdown showed, this common view is question-able.
For many years, investments in Korea were concen-trated around cheabols, the multi-company businessgroups operating in a range of markets under commonsupervision and financial control. Although, each compa-ny within a group was legally independent, in realitycheabols were fostered by government policies. It wasthe Presidential Declaration on Heavy and ChemicalIndustrialization Policy of January 1973, which encouragedlarge companies to invest in strategic industries such assemiconductors, shipbuilding, steel etc. [IMF, 1999;OECD, 1998]. The government support, apart from theimplicit risk share for preferential industries, was massive.For example, the state-owned banks were pressured toallocate more than half of their loan portfolios to particu-lar sectors. By the same token, strategic industries wereprovided loans that carried out low interest rates [Nam etal., 1999]. Even after the financial sector's liberalizationand privatization in the 1980's, the governmental supportfor the large firms, affiliates of cheabos, did not vanish.
The large economic concentration around businessgroups that were subject to special regulations in Korea isclearly evident in terms of capital stock invested and the
Figure 6-3. Reserves
0
10
20
30
40
50
60
1993 1994 1995 1996 1997 1998
bill.
USD
Usable Gross Reserves/Import (right scale)Usable Gross Reserves (left scale)
Total Reserves - minus Gold/Import (right scale)Total Reserves - minus Gold (left scale)
5
4.54
3.5
3
2.5
21.5
10.5
0
months of im
port
Source: Bank of Korea
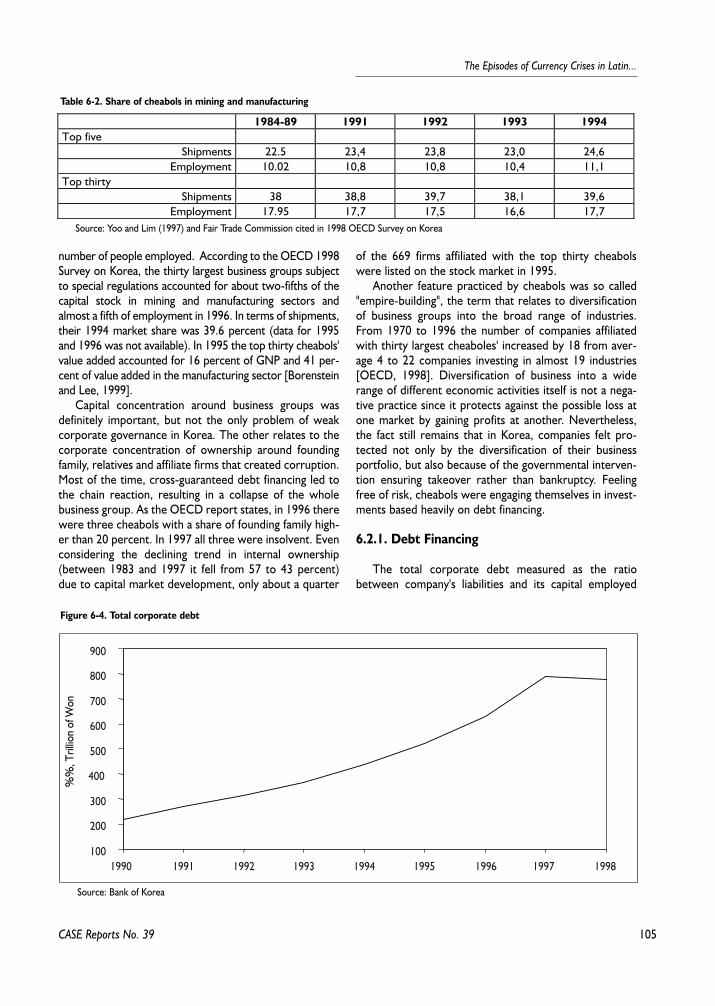
105
The Episodes of Currency Crises in Latin...
number of people employed. According to the OECD 1998Survey on Korea, the thirty largest business groups subjectto special regulations accounted for about two-fifths of thecapital stock in mining and manufacturing sectors andalmost a fifth of employment in 1996. In terms of shipments,their 1994 market share was 39.6 percent (data for 1995and 1996 was not available). In 1995 the top thirty cheabols'value added accounted for 16 percent of GNP and 41 per-cent of value added in the manufacturing sector [Borensteinand Lee, 1999].
Capital concentration around business groups wasdefinitely important, but not the only problem of weakcorporate governance in Korea. The other relates to thecorporate concentration of ownership around foundingfamily, relatives and affiliate firms that created corruption.Most of the time, cross-guaranteed debt financing led tothe chain reaction, resulting in a collapse of the wholebusiness group. As the OECD report states, in 1996 therewere three cheabols with a share of founding family high-er than 20 percent. In 1997 all three were insolvent. Evenconsidering the declining trend in internal ownership(between 1983 and 1997 it fell from 57 to 43 percent)due to capital market development, only about a quarter
of the 669 firms affiliated with the top thirty cheabolswere listed on the stock market in 1995.
Another feature practiced by cheabols was so called"empire-building", the term that relates to diversificationof business groups into the broad range of industries.From 1970 to 1996 the number of companies affiliatedwith thirty largest cheaboles' increased by 18 from aver-age 4 to 22 companies investing in almost 19 industries[OECD, 1998]. Diversification of business into a widerange of different economic activities itself is not a nega-tive practice since it protects against the possible loss atone market by gaining profits at another. Nevertheless,the fact still remains that in Korea, companies felt pro-tected not only by the diversification of their businessportfolio, but also because of the governmental interven-tion ensuring takeover rather than bankruptcy. Feelingfree of risk, cheabols were engaging themselves in invest-ments based heavily on debt financing.
6.2.1. Debt Financing
The total corporate debt measured as the ratiobetween company's liabilities and its capital employed
CASE Reports No. 39
Table 6-2. Share of cheabols in mining and manufacturing
1984-89 1991 1992 1993 1994Top five
Shipments 22.5 23,4 23,8 23,0 24,6Employment 10.02 10,8 10,8 10,4 11,1
Top thirtyShipments 38 38,8 39,7 38,1 39,6
Employment 17.95 17,7 17,5 16,6 17,7Source: Yoo and Lim (1997) and Fair Trade Commission cited in 1998 OECD Survey on Korea
Figure 6-4. Total corporate debt
100
200
300
400
500
600
700
800
900
1990 1991 1992 1993 1994 1995 1996 1997 1998
%%
, Tril
lion
of W
on
Source: Bank of Korea
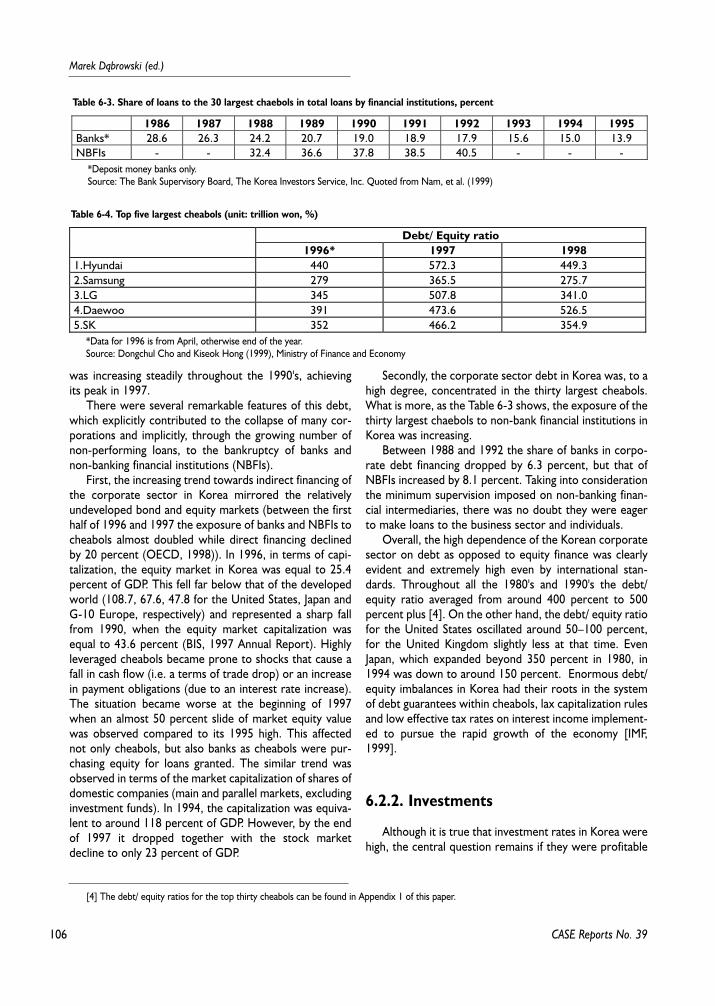
106
Marek D¹browski (ed.)
was increasing steadily throughout the 1990's, achievingits peak in 1997.
There were several remarkable features of this debt,which explicitly contributed to the collapse of many cor-porations and implicitly, through the growing number ofnon-performing loans, to the bankruptcy of banks andnon-banking financial institutions (NBFIs).
First, the increasing trend towards indirect financing ofthe corporate sector in Korea mirrored the relativelyundeveloped bond and equity markets (between the firsthalf of 1996 and 1997 the exposure of banks and NBFIs tocheabols almost doubled while direct financing declinedby 20 percent (OECD, 1998)). In 1996, in terms of capi-talization, the equity market in Korea was equal to 25.4percent of GDP. This fell far below that of the developedworld (108.7, 67.6, 47.8 for the United States, Japan andG-10 Europe, respectively) and represented a sharp fallfrom 1990, when the equity market capitalization wasequal to 43.6 percent (BIS, 1997 Annual Report). Highlyleveraged cheabols became prone to shocks that cause afall in cash flow (i.e. a terms of trade drop) or an increasein payment obligations (due to an interest rate increase).The situation became worse at the beginning of 1997when an almost 50 percent slide of market equity valuewas observed compared to its 1995 high. This affectednot only cheabols, but also banks as cheabols were pur-chasing equity for loans granted. The similar trend wasobserved in terms of the market capitalization of shares ofdomestic companies (main and parallel markets, excludinginvestment funds). In 1994, the capitalization was equiva-lent to around 118 percent of GDP. However, by the endof 1997 it dropped together with the stock marketdecline to only 23 percent of GDP.
Secondly, the corporate sector debt in Korea was, to ahigh degree, concentrated in the thirty largest cheabols.What is more, as the Table 6-3 shows, the exposure of thethirty largest chaebols to non-bank financial institutions inKorea was increasing.
Between 1988 and 1992 the share of banks in corpo-rate debt financing dropped by 6.3 percent, but that ofNBFIs increased by 8.1 percent. Taking into considerationthe minimum supervision imposed on non-banking finan-cial intermediaries, there was no doubt they were eagerto make loans to the business sector and individuals.
Overall, the high dependence of the Korean corporatesector on debt as opposed to equity finance was clearlyevident and extremely high even by international stan-dards. Throughout all the 1980's and 1990's the debt/equity ratio averaged from around 400 percent to 500percent plus [4]. On the other hand, the debt/ equity ratiofor the United States oscillated around 50–100 percent,for the United Kingdom slightly less at that time. EvenJapan, which expanded beyond 350 percent in 1980, in1994 was down to around 150 percent. Enormous debt/equity imbalances in Korea had their roots in the systemof debt guarantees within cheabols, lax capitalization rulesand low effective tax rates on interest income implement-ed to pursue the rapid growth of the economy [IMF,1999].
6.2.2. Investments
Although it is true that investment rates in Korea werehigh, the central question remains if they were profitable
CASE Reports No. 39
Table 6-3. Share of loans to the 30 largest chaebols in total loans by financial institutions, percent
1986 1987 1988 1989 1990 1991 1992 1993 1994 1995Banks* 28.6 26.3 24.2 20.7 19.0 18.9 17.9 15.6 15.0 13.9NBFIs - - 32.4 36.6 37.8 38.5 40.5 - - -
*Deposit money banks only.Source: The Bank Supervisory Board, The Korea Investors Service, Inc. Quoted from Nam, et al. (1999)
Table 6-4. Top five largest cheabols (unit: trillion won, %)
Debt/ Equity ratio1996* 1997 1998
1.Hyundai 440 572.3 449.32.Samsung 279 365.5 275.73.LG 345 507.8 341.04.Daewoo 391 473.6 526.55.SK 352 466.2 354.9
*Data for 1996 is from April, otherwise end of the year.Source: Dongchul Cho and Kiseok Hong (1999), Ministry of Finance and Economy
[4] The debt/ equity ratios for the top thirty cheabols can be found in Appendix 1 of this paper.
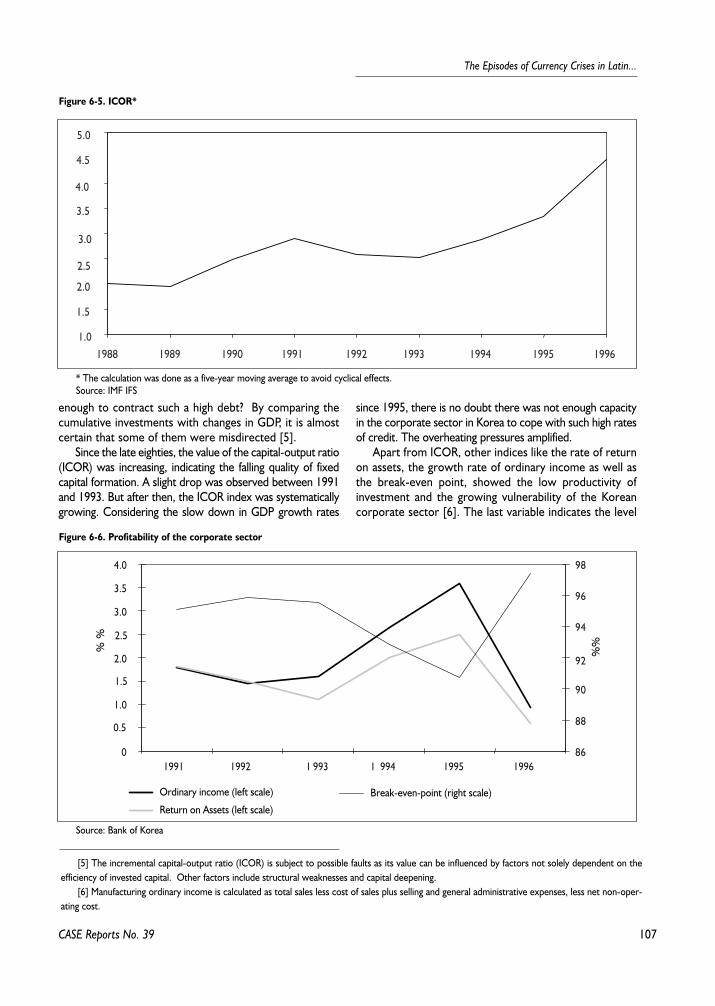
107
The Episodes of Currency Crises in Latin...
enough to contract such a high debt? By comparing thecumulative investments with changes in GDP, it is almostcertain that some of them were misdirected [5].
Since the late eighties, the value of the capital-output ratio(ICOR) was increasing, indicating the falling quality of fixedcapital formation. A slight drop was observed between 1991and 1993. But after then, the ICOR index was systematicallygrowing. Considering the slow down in GDP growth rates
since 1995, there is no doubt there was not enough capacityin the corporate sector in Korea to cope with such high ratesof credit. The overheating pressures amplified.
Apart from ICOR, other indices like the rate of returnon assets, the growth rate of ordinary income as well asthe break-even point, showed the low productivity ofinvestment and the growing vulnerability of the Koreancorporate sector [6]. The last variable indicates the level
CASE Reports No. 39
Figure 6-5. ICOR*
1.0
1.5
2.0
2.5
3.0
3.5
4.0
4.5
5.0
1988 1989 1990 1991 1992 1993 1994 1995 1996
* The calculation was done as a five-year moving average to avoid cyclical effects.Source: IMF IFS
[5] The incremental capital-output ratio (ICOR) is subject to possible faults as its value can be influenced by factors not solely dependent on theefficiency of invested capital. Other factors include structural weaknesses and capital deepening.
[6] Manufacturing ordinary income is calculated as total sales less cost of sales plus selling and general administrative expenses, less net non-oper-ating cost.
Figure 6-6. Profitability of the corporate sector
0
0.5
1.0
1.5
2.0
2.5
3.0
3.5
4.0
1991 1992 1 993 1 994 1995 1996
%
%
86
88
90
92
94
96
98
%
%
Break-even-point (right scale)Ordinary income (left scale)
Return on Assets (left scale)
Source: Bank of Korea
108
Marek D¹browski (ed.)
of cost of production just covered by income (the higherthe value of the break-even points, the higher the cost).
As the chart shows, from 1995 onwards, all three indi-cators – the break-even point, ordinary income andreturn on assets – demonstrated the falling profitability ofthe corporate sector.
The high leverage of the corporate sector and its inad-equate governance was an important, if not the major, fac-tor of Korea's ensuing collapse. The question to beanswered is why it was sustainable in the 1980's butturned into a collapse in the second half of the 1990's?The simplest answer lies probably in the unfavorablebehavior of the terms of trade, which significantly con-strained the cash flow of chaebols, the major exporters inKorea. But there were other factors like the appreciationof the US dollar vis-a-vis the Japanese yen at the beginningof 1995 that weakened the competitive position of firms.Furthermore, the collapse of Hanbo Steel Co. in January1997, the first big bankruptcy in decades, underminedinvestors' confidence that Korean firms were 'too big tofail'. This was followed by Moody's decision to lower thelong-term rating on three Korean banks, which had a sig-nificant exposure to Hanbo [Park, et. al, 1998]. The com-mon belief in the government willingness to bail out fallingcompanies disappeared together with the declining stockof foreign reserves.
Low-productivity of investments was mirrored in theburden of non-performing loans (NPLs) in the bankingsystem. In 1995 NPLs (included loans classified as sub-standard and doubtful) for commercial banks were equalto 5.1 percent of total loans raised. In 1997 it was already6 percent, according to the Financial Supervisory Service(cited by J. Fleming). Soon after the eruption of the crisisthe problem of NPLs in total loans magnified. In 1998 thepercentage number increased to 7.4. Although, these fig-ures are high, they maybe even higher since regularreports on NPLs have been available only recently.
6.3. Korean Financial System and itsLiberalization
Before the liberalization of the Korean financial sec-tor the early 1980's, the government had intervenedheavily to pursue its industrial objectives. As the reformsprogressed, several commercial banks and non-bankfinancial institutions were added to the system. Never-theless, the attempts to liberalize were only partiallysuccessful, still leaving many regulations in force (i.e. low
interest rate ceiling to increase profits and retain earn-ings for selected firms, commercial banks' lending topreferential sectors) [7].
The 1988 plan to deregulate the majority of bank andnon-bank's lending rates as well as interest rates onmoney market instruments was mostly reversed, becauseof pressures arising from earlier beneficiaries of the pref-erential access to low interest rates credit. On the otherhand, the second attempt to implement the plan in 1992was suppressed by the stock market slump [IMF, 1999].
The next phase of financial system reform took placein 1993 when the first democratically elected civilian gov-ernment came to power. The new government under thePresident Kim Young Sam was highly committed to finan-cial liberalization. There were two reasons for speedingup the process. One of them was the perspective of join-ing the OECD, the other was the growing ability of pri-vate and already credible firms to borrow funds fromabroad. However, most capital flows attracted by firmsthrough the stock market were not free from explicit orimplicit quantitative controls, with the exception of traderelated short-term financing [Dooley et al. 1999]. Duringthat time, large structural changes led to further rapidgrowth of non-banking financial institutions. As the Bankof Korea states, the market share of non-banking financialinstitutions in terms of Korean won deposits between1980 and 1998 increased from about 29 to 72 percent.The numbers for banking institutions (commercial andspecialized banks) were 71 and 28 percent, respectively[OECD, 1998]. The trend in loans and discounts was sim-ilar, increasing for NBFIs and falling for banks. Between1996 and 1997, the share of funds raised by the businesssector from non-banks to the total funds raised increasedby 10 percentage points, from 13.9 to 23.9 percent. Atthe same time borrowing from banks dropped from 14 to12,9 percent (Bank of Korea).
6.3.1. Non-banking Financial Institutions
In Korea, non-banking financial institutions can beroughly classified into five categories according to theirbusiness activities. These are: development, savings,investment, insurance, and other institutions (Bank ofKorea). The role they played in causing future deteriora-tion in the financial sector balance sheet was significantsince they were allowed greater freedom in their man-agement of assets and liabilities. What is more, they wereable to charge higher interest rates on their loans as wellas apply higher interest rates on their deposits. Regarding
CASE Reports No. 39
[7] Commercial banks in Korea were nationalized in the 1960's and since then the government was influencing the sectoral allocation of credit with
smaller or greater intensity [IMF; 1999].
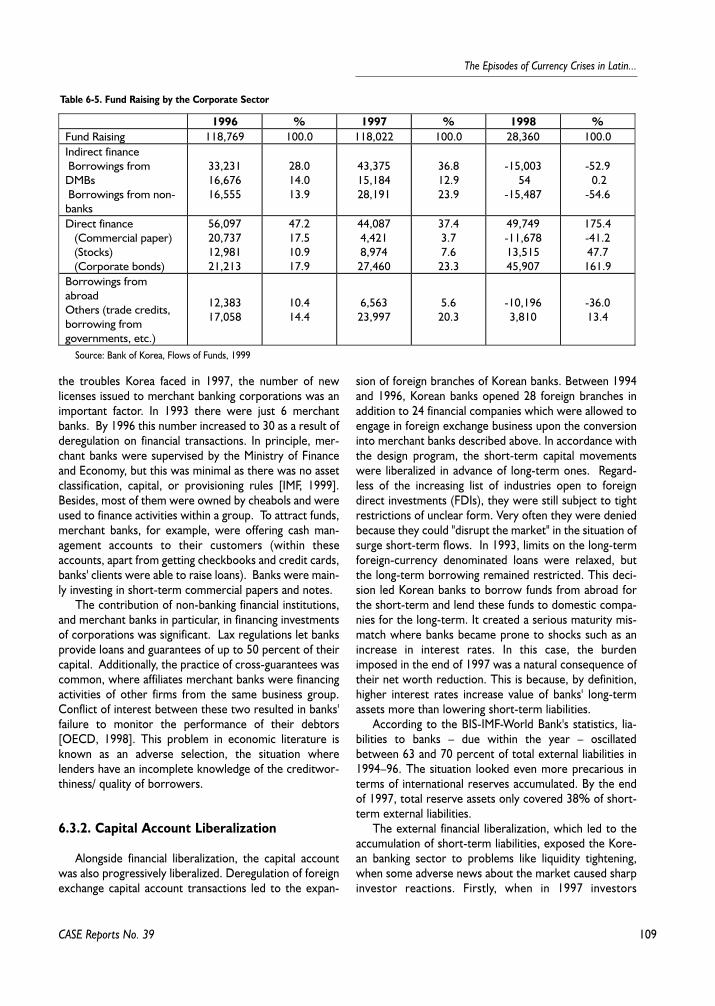
109
The Episodes of Currency Crises in Latin...
the troubles Korea faced in 1997, the number of newlicenses issued to merchant banking corporations was animportant factor. In 1993 there were just 6 merchantbanks. By 1996 this number increased to 30 as a result ofderegulation on financial transactions. In principle, mer-chant banks were supervised by the Ministry of Financeand Economy, but this was minimal as there was no assetclassification, capital, or provisioning rules [IMF, 1999].Besides, most of them were owned by cheabols and wereused to finance activities within a group. To attract funds,merchant banks, for example, were offering cash man-agement accounts to their customers (within theseaccounts, apart from getting checkbooks and credit cards,banks' clients were able to raise loans). Banks were main-ly investing in short-term commercial papers and notes.
The contribution of non-banking financial institutions,and merchant banks in particular, in financing investmentsof corporations was significant. Lax regulations let banksprovide loans and guarantees of up to 50 percent of theircapital. Additionally, the practice of cross-guarantees wascommon, where affiliates merchant banks were financingactivities of other firms from the same business group.Conflict of interest between these two resulted in banks'failure to monitor the performance of their debtors[OECD, 1998]. This problem in economic literature isknown as an adverse selection, the situation wherelenders have an incomplete knowledge of the creditwor-thiness/ quality of borrowers.
6.3.2. Capital Account Liberalization
Alongside financial liberalization, the capital accountwas also progressively liberalized. Deregulation of foreignexchange capital account transactions led to the expan-
sion of foreign branches of Korean banks. Between 1994and 1996, Korean banks opened 28 foreign branches inaddition to 24 financial companies which were allowed toengage in foreign exchange business upon the conversioninto merchant banks described above. In accordance withthe design program, the short-term capital movementswere liberalized in advance of long-term ones. Regard-less of the increasing list of industries open to foreigndirect investments (FDIs), they were still subject to tightrestrictions of unclear form. Very often they were deniedbecause they could "disrupt the market" in the situation ofsurge short-term flows. In 1993, limits on the long-termforeign-currency denominated loans were relaxed, butthe long-term borrowing remained restricted. This deci-sion led Korean banks to borrow funds from abroad forthe short-term and lend these funds to domestic compa-nies for the long-term. It created a serious maturity mis-match where banks became prone to shocks such as anincrease in interest rates. In this case, the burdenimposed in the end of 1997 was a natural consequence oftheir net worth reduction. This is because, by definition,higher interest rates increase value of banks' long-termassets more than lowering short-term liabilities.
According to the BIS-IMF-World Bank's statistics, lia-bilities to banks – due within the year – oscillatedbetween 63 and 70 percent of total external liabilities in1994–96. The situation looked even more precarious interms of international reserves accumulated. By the endof 1997, total reserve assets only covered 38% of short-term external liabilities.
The external financial liberalization, which led to theaccumulation of short-term liabilities, exposed the Kore-an banking sector to problems like liquidity tightening,when some adverse news about the market caused sharpinvestor reactions. Firstly, when in 1997 investors
CASE Reports No. 39
Table 6-5. Fund Raising by the Corporate Sector
1996 % 1997 % 1998 %Fund Raising 118,769 100.0 118,022 100.0 28,360 100.0Indirect finance Borrowings fromDMBs Borrowings from non-banks
33,23116,67616,555
28.014.013.9
43,37515,18428,191
36.812.923.9
-15,003 54
-15,487
-52.9 0.2
-54.6
Direct finance (Commercial paper) (Stocks) (Corporate bonds)
56,09720,73712,98121,213
47.217.510.917.9
44,0874,4218,974
27,460
37.43.77.6
23.3
49,749-11,67813,51545,907
175.4-41.247.7
161.9Borrowings fromabroadOthers (trade credits,borrowing fromgovernments, etc.)
12,38317,058
10.414.4
6,56323,997
5.620.3
-10,1963,810
-36.013.4
Source: Bank of Korea, Flows of Funds, 1999
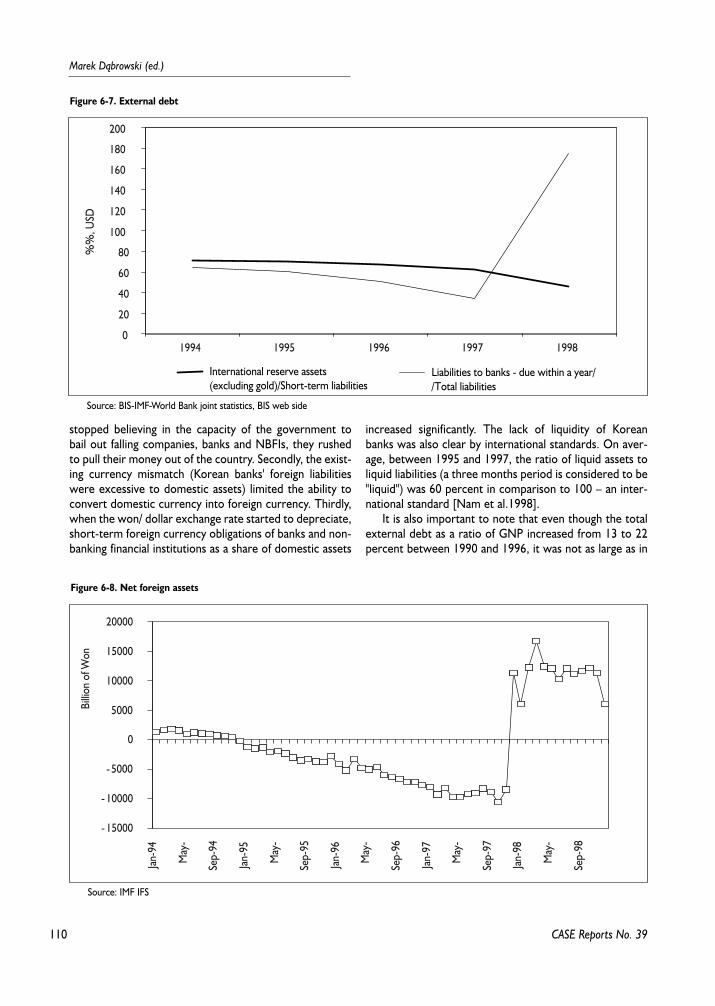
110
Marek D¹browski (ed.)
stopped believing in the capacity of the government tobail out falling companies, banks and NBFIs, they rushedto pull their money out of the country. Secondly, the exist-ing currency mismatch (Korean banks' foreign liabilitieswere excessive to domestic assets) limited the ability toconvert domestic currency into foreign currency. Thirdly,when the won/ dollar exchange rate started to depreciate,short-term foreign currency obligations of banks and non-banking financial institutions as a share of domestic assets
increased significantly. The lack of liquidity of Koreanbanks was also clear by international standards. On aver-age, between 1995 and 1997, the ratio of liquid assets toliquid liabilities (a three months period is considered to be"liquid") was 60 percent in comparison to 100 – an inter-national standard [Nam et al.1998].
It is also important to note that even though the totalexternal debt as a ratio of GNP increased from 13 to 22percent between 1990 and 1996, it was not as large as in
CASE Reports No. 39
Figure 6-7. External debt
0
20
40
60
80
100
120
140
160
180
200
1994 1995 1996 1997 1998
%%
, USD
Liabilities to banks - due within a year//Total liabilities
International reserve assets(excluding gold)/Short-term liabilities
Source: BIS-IMF-World Bank joint statistics, BIS web side
Figure 6-8. Net foreign assets
-15000
-10000
-5000
0
5000
10000
15000
20000
Jan-
94
May
-
Sep-
94
Jan-
95
May
-
Sep-
95
Jan-
96
May
-
Sep-
96
Jan-
97
May
-
Sep-
97
Jan-
98
May
-
Sep-
98
Billio
n of
Won
Source: IMF IFS
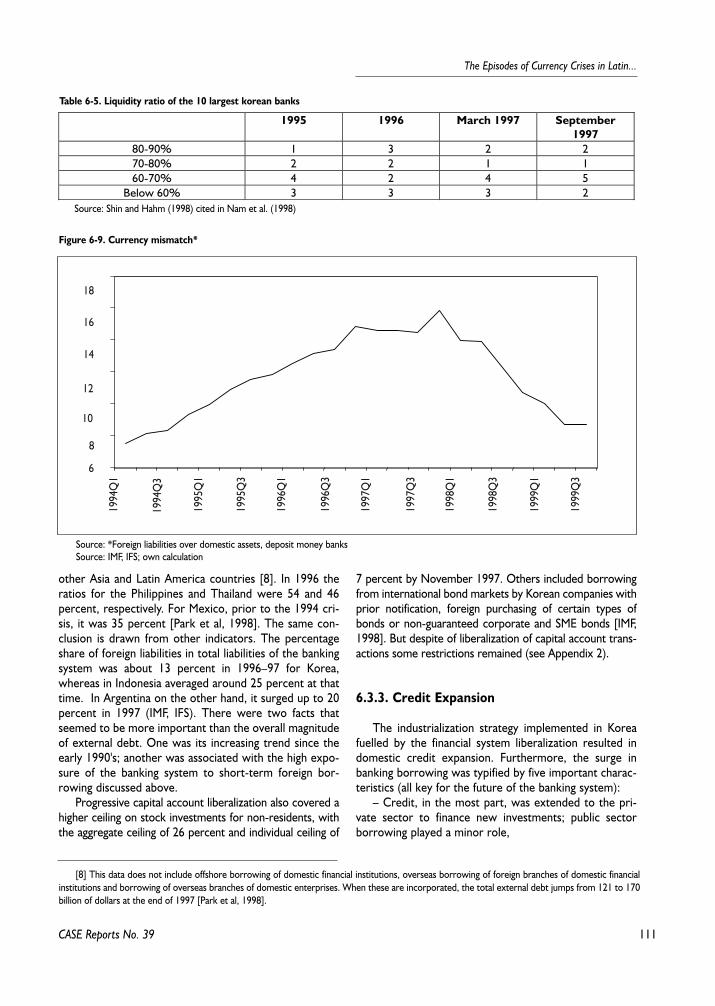
111
The Episodes of Currency Crises in Latin...
other Asia and Latin America countries [8]. In 1996 theratios for the Philippines and Thailand were 54 and 46percent, respectively. For Mexico, prior to the 1994 cri-sis, it was 35 percent [Park et al, 1998]. The same con-clusion is drawn from other indicators. The percentageshare of foreign liabilities in total liabilities of the bankingsystem was about 13 percent in 1996–97 for Korea,whereas in Indonesia averaged around 25 percent at thattime. In Argentina on the other hand, it surged up to 20percent in 1997 (IMF, IFS). There were two facts thatseemed to be more important than the overall magnitudeof external debt. One was its increasing trend since theearly 1990's; another was associated with the high expo-sure of the banking system to short-term foreign bor-rowing discussed above.
Progressive capital account liberalization also covered ahigher ceiling on stock investments for non-residents, withthe aggregate ceiling of 26 percent and individual ceiling of
7 percent by November 1997. Others included borrowingfrom international bond markets by Korean companies withprior notification, foreign purchasing of certain types ofbonds or non-guaranteed corporate and SME bonds [IMF,1998]. But despite of liberalization of capital account trans-actions some restrictions remained (see Appendix 2).
6.3.3. Credit Expansion
The industrialization strategy implemented in Koreafuelled by the financial system liberalization resulted indomestic credit expansion. Furthermore, the surge inbanking borrowing was typified by five important charac-teristics (all key for the future of the banking system):
– Credit, in the most part, was extended to the pri-vate sector to finance new investments; public sectorborrowing played a minor role,
CASE Reports No. 39
Table 6-5. Liquidity ratio of the 10 largest korean banks
1995 1996 March 1997 September1997
80-90% 1 3 2 270-80% 2 2 1 160-70% 4 2 4 5
Below 60% 3 3 3 2Source: Shin and Hahm (1998) cited in Nam et al. (1998)
Figure 6-9. Currency mismatch*
6
8
10
12
14
16
18
19
94Q
1
19
94Q
3
19
95Q
1
19
95Q
3
1996
Q1
1996
Q3
1997
Q1
19
97Q
3
19
98Q
1
19
98Q
3
1999
Q1
1999
Q3
Source: *Foreign liabilities over domestic assets, deposit money banksSource: IMF, IFS; own calculation
[8] This data does not include offshore borrowing of domestic financial institutions, overseas borrowing of foreign branches of domestic financialinstitutions and borrowing of overseas branches of domestic enterprises. When these are incorporated, the total external debt jumps from 121 to 170billion of dollars at the end of 1997 [Park et al, 1998].
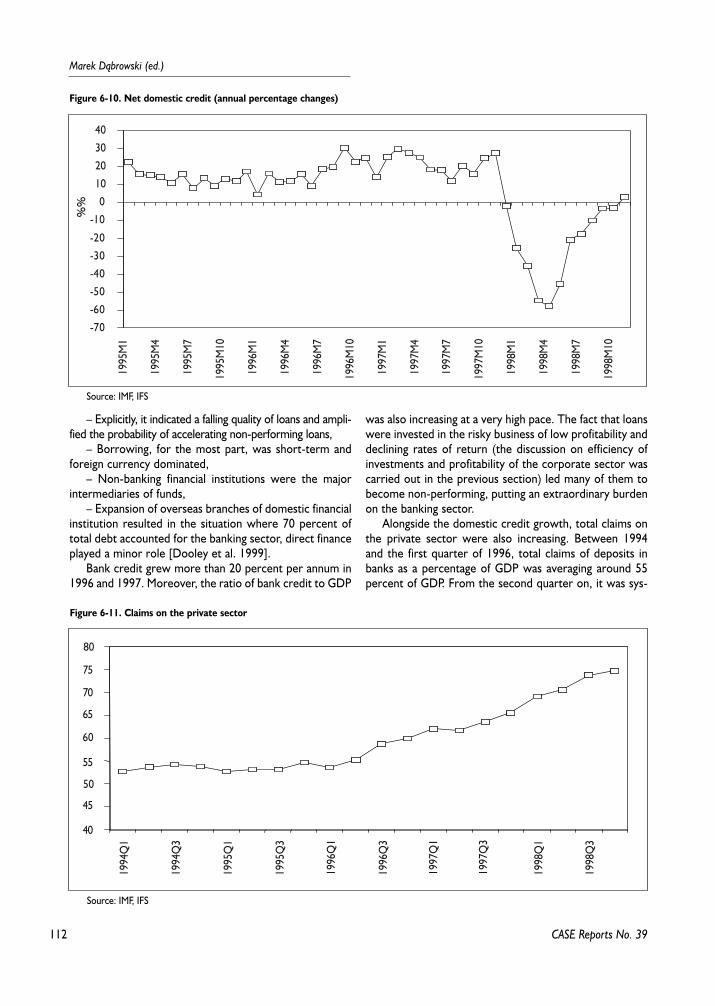
112
Marek D¹browski (ed.)
– Explicitly, it indicated a falling quality of loans and ampli-fied the probability of accelerating non-performing loans,
– Borrowing, for the most part, was short-term andforeign currency dominated,
– Non-banking financial institutions were the majorintermediaries of funds,
– Expansion of overseas branches of domestic financialinstitution resulted in the situation where 70 percent oftotal debt accounted for the banking sector, direct financeplayed a minor role [Dooley et al. 1999].
Bank credit grew more than 20 percent per annum in1996 and 1997. Moreover, the ratio of bank credit to GDP
was also increasing at a very high pace. The fact that loanswere invested in the risky business of low profitability anddeclining rates of return (the discussion on efficiency ofinvestments and profitability of the corporate sector wascarried out in the previous section) led many of them tobecome non-performing, putting an extraordinary burdenon the banking sector.
Alongside the domestic credit growth, total claims onthe private sector were also increasing. Between 1994and the first quarter of 1996, total claims of deposits inbanks as a percentage of GDP was averaging around 55percent of GDP. From the second quarter on, it was sys-
CASE Reports No. 39
Figure 6-10. Net domestic credit (annual percentage changes)
-70
-60
-50
-40
-30
-20
-10
0
10
20
30
4019
95M
1
1995
M4
1995
M7
1995
M10
1996
M1
1996
M4
1996
M7
1996
M10
1997
M1
1997
M4
1997
M7
1997
M10
1998
M1
1998
M4
1998
M7
1998
M10
%%
Source: IMF, IFS
Figure 6-11. Claims on the private sector
40
45
50
55
60
65
70
75
80
19
94Q
1
19
94Q
3
19
95Q
1
19
95Q
3
19
96Q
1
19
96Q
3
19
97Q
1
19
97Q
3
19
98Q
1
19
98Q
3
Source: IMF, IFS
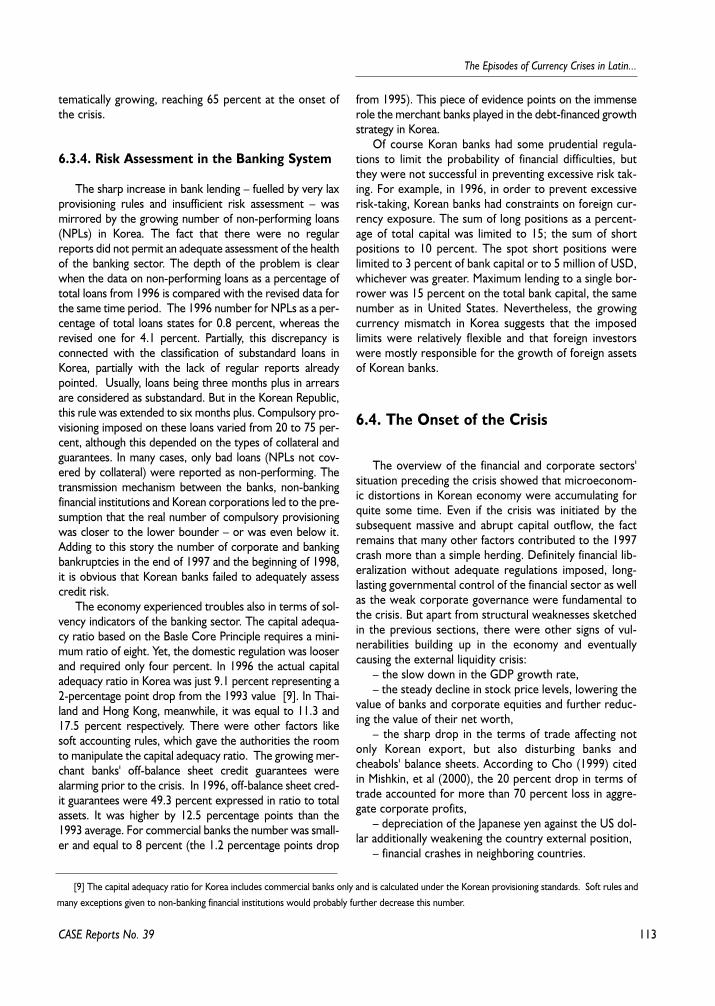
113
The Episodes of Currency Crises in Latin...
tematically growing, reaching 65 percent at the onset ofthe crisis.
6.3.4. Risk Assessment in the Banking System
The sharp increase in bank lending – fuelled by very laxprovisioning rules and insufficient risk assessment – wasmirrored by the growing number of non-performing loans(NPLs) in Korea. The fact that there were no regularreports did not permit an adequate assessment of the healthof the banking sector. The depth of the problem is clearwhen the data on non-performing loans as a percentage oftotal loans from 1996 is compared with the revised data forthe same time period. The 1996 number for NPLs as a per-centage of total loans states for 0.8 percent, whereas therevised one for 4.1 percent. Partially, this discrepancy isconnected with the classification of substandard loans inKorea, partially with the lack of regular reports alreadypointed. Usually, loans being three months plus in arrearsare considered as substandard. But in the Korean Republic,this rule was extended to six months plus. Compulsory pro-visioning imposed on these loans varied from 20 to 75 per-cent, although this depended on the types of collateral andguarantees. In many cases, only bad loans (NPLs not cov-ered by collateral) were reported as non-performing. Thetransmission mechanism between the banks, non-bankingfinancial institutions and Korean corporations led to the pre-sumption that the real number of compulsory provisioningwas closer to the lower bounder – or was even below it.Adding to this story the number of corporate and bankingbankruptcies in the end of 1997 and the beginning of 1998,it is obvious that Korean banks failed to adequately assesscredit risk.
The economy experienced troubles also in terms of sol-vency indicators of the banking sector. The capital adequa-cy ratio based on the Basle Core Principle requires a mini-mum ratio of eight. Yet, the domestic regulation was looserand required only four percent. In 1996 the actual capitaladequacy ratio in Korea was just 9.1 percent representing a2-percentage point drop from the 1993 value [9]. In Thai-land and Hong Kong, meanwhile, it was equal to 11.3 and17.5 percent respectively. There were other factors likesoft accounting rules, which gave the authorities the roomto manipulate the capital adequacy ratio. The growing mer-chant banks' off-balance sheet credit guarantees werealarming prior to the crisis. In 1996, off-balance sheet cred-it guarantees were 49.3 percent expressed in ratio to totalassets. It was higher by 12.5 percentage points than the1993 average. For commercial banks the number was small-er and equal to 8 percent (the 1.2 percentage points drop
from 1995). This piece of evidence points on the immenserole the merchant banks played in the debt-financed growthstrategy in Korea.
Of course Koran banks had some prudential regula-tions to limit the probability of financial difficulties, butthey were not successful in preventing excessive risk tak-ing. For example, in 1996, in order to prevent excessiverisk-taking, Korean banks had constraints on foreign cur-rency exposure. The sum of long positions as a percent-age of total capital was limited to 15; the sum of shortpositions to 10 percent. The spot short positions werelimited to 3 percent of bank capital or to 5 million of USD,whichever was greater. Maximum lending to a single bor-rower was 15 percent on the total bank capital, the samenumber as in United States. Nevertheless, the growingcurrency mismatch in Korea suggests that the imposedlimits were relatively flexible and that foreign investorswere mostly responsible for the growth of foreign assetsof Korean banks.
6.4. The Onset of the Crisis
The overview of the financial and corporate sectors'situation preceding the crisis showed that microeconom-ic distortions in Korean economy were accumulating forquite some time. Even if the crisis was initiated by thesubsequent massive and abrupt capital outflow, the factremains that many other factors contributed to the 1997crash more than a simple herding. Definitely financial lib-eralization without adequate regulations imposed, long-lasting governmental control of the financial sector as wellas the weak corporate governance were fundamental tothe crisis. But apart from structural weaknesses sketchedin the previous sections, there were other signs of vul-nerabilities building up in the economy and eventuallycausing the external liquidity crisis:
– the slow down in the GDP growth rate, – the steady decline in stock price levels, lowering the
value of banks and corporate equities and further reduc-ing the value of their net worth,
– the sharp drop in the terms of trade affecting notonly Korean export, but also disturbing banks andcheabols' balance sheets. According to Cho (1999) citedin Mishkin, et al (2000), the 20 percent drop in terms oftrade accounted for more than 70 percent loss in aggre-gate corporate profits,
– depreciation of the Japanese yen against the US dol-lar additionally weakening the country external position,
– financial crashes in neighboring countries.
CASE Reports No. 39
[9] The capital adequacy ratio for Korea includes commercial banks only and is calculated under the Korean provisioning standards. Soft rules andmany exceptions given to non-banking financial institutions would probably further decrease this number.
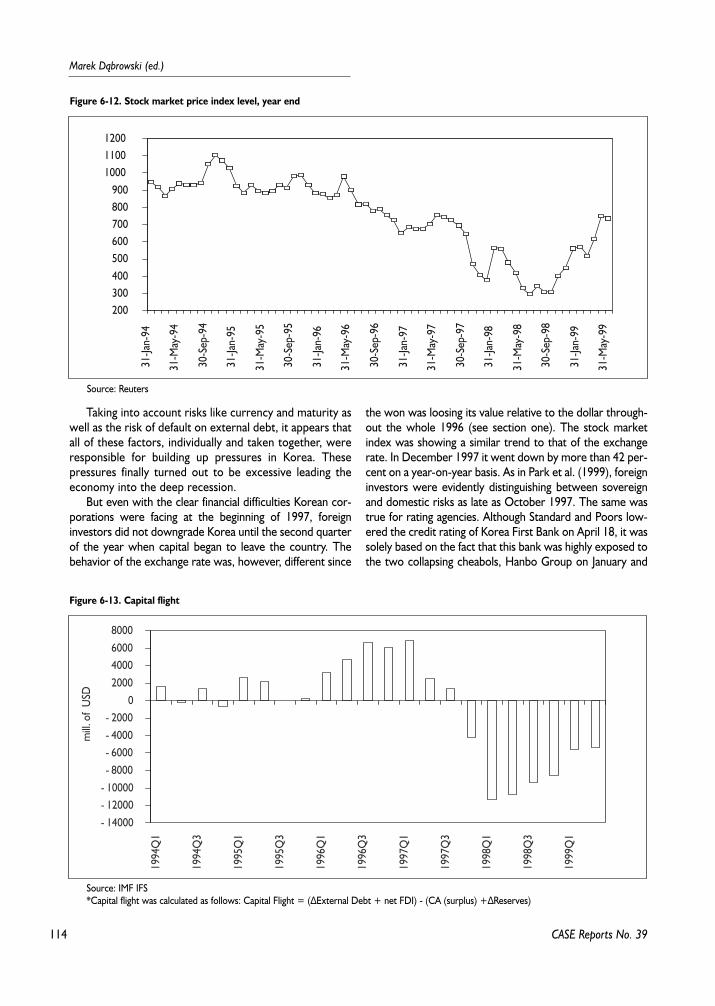
114
Marek D¹browski (ed.)
Taking into account risks like currency and maturity aswell as the risk of default on external debt, it appears thatall of these factors, individually and taken together, wereresponsible for building up pressures in Korea. Thesepressures finally turned out to be excessive leading theeconomy into the deep recession.
But even with the clear financial difficulties Korean cor-porations were facing at the beginning of 1997, foreigninvestors did not downgrade Korea until the second quarterof the year when capital began to leave the country. Thebehavior of the exchange rate was, however, different since
the won was loosing its value relative to the dollar through-out the whole 1996 (see section one). The stock marketindex was showing a similar trend to that of the exchangerate. In December 1997 it went down by more than 42 per-cent on a year-on-year basis. As in Park et al. (1999), foreigninvestors were evidently distinguishing between sovereignand domestic risks as late as October 1997. The same wastrue for rating agencies. Although Standard and Poors low-ered the credit rating of Korea First Bank on April 18, it wassolely based on the fact that this bank was highly exposed tothe two collapsing cheabols, Hanbo Group on January and
CASE Reports No. 39
Figure 6-12. Stock market price index level, year end
200300400500600700800900
100011001200
31-Ja
n-94
31-M
ay-9
4
30-S
ep-9
4
31-Ja
n-95
31-M
ay-9
5
30-S
ep-9
5
31-Ja
n-96
31-M
ay-9
6
30-S
ep-9
6
31-Ja
n-97
31-M
ay-9
7
30-S
ep-9
7
31-Ja
n-98
31-M
ay-9
8
30-S
ep-9
8
31-Ja
n-99
31-M
ay-9
9
Source: Reuters
Figure 6-13. Capital flight
- 14000- 12000- 10000- 8000- 6000- 4000- 2000
02000400060008000
1994
Q1
1994
Q3
1995
Q1
1995
Q3
1996
Q1
1996
Q3
1997
Q1
1997
Q3
1998
Q1
1998
Q3
1999
Q1
mill.
of
USD
Source: IMF IFS*Capital flight was calculated as follows: Capital Flight = (∆External Debt + net FDI) - (CA (surplus) +∆Reserves)
115
The Episodes of Currency Crises in Latin...
CASE Reports No. 39
Sammi Steel on March. The sovereign credit rating was stillset at AA- level and did not decline until October.
As in many other events of financial (banking) crises, it isextremely difficult to assess which model would be the mostsuitable one for Korea. The scenario of speculative attacksdue to expected currency depreciation couldn't facilitate therun on Korea simply because the existence of tight regula-tions on currency forwards backed by corresponding cur-rent account transactions and the absence of currencyfutures market made this framework impossible [Mishkin, etal, 2000]. It was rather a consequence of creditors' herdingbehavior to withdraw their loans. The fact that Korea had ahigh level of short-term debt and only moderate interna-tional reserves favors this scenario. In retrospect however,and regarding the structural weakness of financial and cor-porate sectors this panic could be judged as rational.
The set of macroeconomic indicators developed to mea-sure the probability of financial crises would blur the true pic-ture about the health of Korean economy. Here the problemis deeper and goes back to the early 1990's when the financialliberalization eased restrictions on short-term capital flowsbut left long-term ones in force. Together with the govern-ment's reluctance to give up its influence in most sectors ofthe economy, a series of bankruptcies of corporations under-mined investors' confidence in the quality of their assets.Thus, the Korean crisis was a result of interactions betweenfinancial and corporate sectors which failed to set prudentialgovernance rules. The role the government played in calm-ing down the market was also of considerable importancesince the policy was misdirected and instead of ceasing, itfuelled the crisis. The harsh tone and desperate announce-ments concerning good prospects of the economy gave awarning sign to investors. The fact that the authorities werebailing out collapsing corporations and banks raised doubtsabout the solvency of the whole economy. When the govern-ment announced the stock of official reserves at the end ofNovember, the market confidence about the magnitude ofusable foreign reserves was undermined and caused a furtherdecline in the stock market index (regarding the course ofevents in Korea at the end of the 1997, see the overview ofthe chronology of selected news from the financial marketspresented in Appendix 3).
6.5. The 1998 Recession and 1999Recovery
6.5.1. The IMF Intervention in Asia
On November 20, 1997 the exchange rate band waswidened from 2.5 to 10 percent. The day after, the gov-ernment asked the International Monetary Fund to lend
support. On December 4, the IMF's Executive Boardapproved a Stand-By Arrangement with Korea of $21 bil-lion over the next three years based on the assumption ofthe GDP growth in 1998 of 2.5 percent. The World Bankand the Asian Development Bank provided an additional$14 billion as well as technical assistance. Individual coun-tries agreed on another $22 billion as a second line ofdefense credit. The total sum granted to Korea was equalto $58.4 billion, but the disbursement of money wasbased on certain conditions:
1. comprehensive financial sector restructuring with aclear exit policy, strong market and supervisory discipline,and independence of the central bank. Nine merchantbanks were suspended; two commercial banks were cap-italised by the government; all commercial banks wererequired to submit plans for recapitalization,
2. the bases for corporate income and VAT widened inorder to bear the costs of financial restructuring (fiscalmeasures were equivalent to about 2 percent of GDP andwere consisted with the balance budget target),
3. an end to close the relationships between govern-ment, banks and corporations as well as an improvementin accounting (corporate financial statements had to beprepared on the consolidated basis), auditing (certificationof external auditor) and disclosure standards,
4. the implementation of trade and capital account lib-eralization measures (liberalization of FDIs flows andopening money, bond and equity markets to capitalinflows),
5. labor market reforms,6. the publication and dissemination of key economic
and financial data (IMF on line service).Nevertheless, the announcement of the program did
not help to stabilize the exchange rate and the usablegross reserves fell to 8.9 billion US dollars at the end ofDecember 1997. In the last quarter of the 1997, net cap-ital outflows were observed ($24.9 billion compared to $7billion of inflows in the corresponding period of 1996).This was greater than the IMF initially expected (the pro-gram assumed net outflows of $11.1 billion in December1997 and net inflows of $3.3 billion in 1998). Revision ofthe program was necessary, but even then it failed to pre-dict the total net capital outflows of $14.8 billion in 1998.
The IMF prescriptions for crisis management may be asource of concern given the long-term adjustment condi-tions imposed, but the role of the Korean government isalso questionable. As the government was injecting capitalto falling companies, investors did not really believe in itscommitment to market restructuring. As a result, theexchange rate dropped by 40 percent between Decem-ber 7 and 14, the stock market declined by 17 percentduring December 3–10. It was the sharpest reductionsince the beginning of October. As the crisis accelerated,the defense of the won became impossible and the
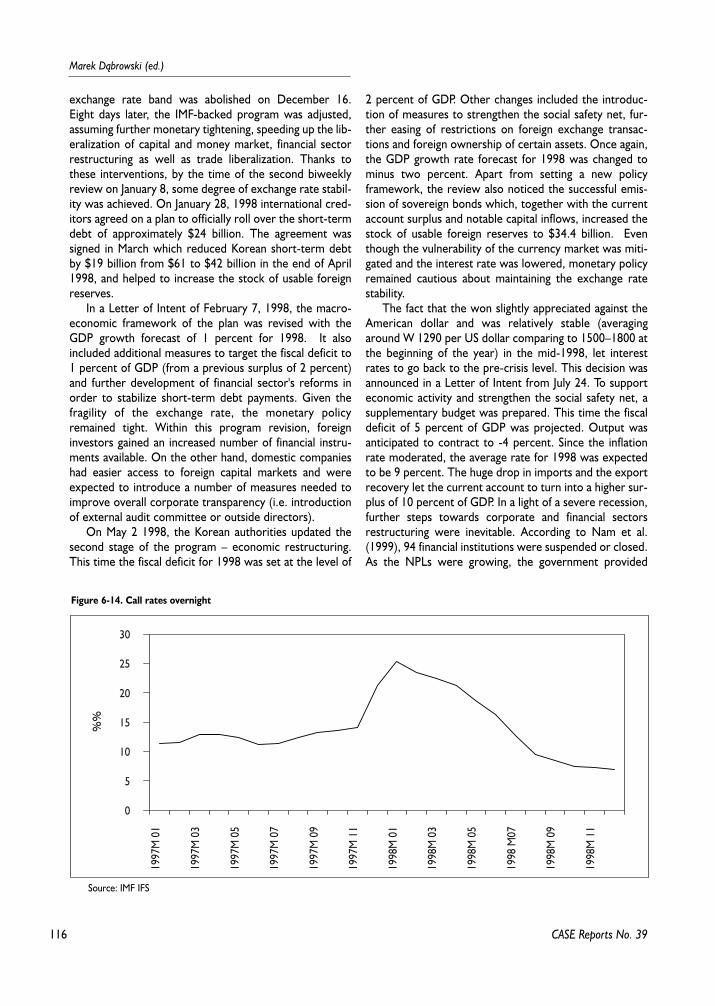
116
Marek D¹browski (ed.)
exchange rate band was abolished on December 16.Eight days later, the IMF-backed program was adjusted,assuming further monetary tightening, speeding up the lib-eralization of capital and money market, financial sectorrestructuring as well as trade liberalization. Thanks tothese interventions, by the time of the second biweeklyreview on January 8, some degree of exchange rate stabil-ity was achieved. On January 28, 1998 international cred-itors agreed on a plan to officially roll over the short-termdebt of approximately $24 billion. The agreement wassigned in March which reduced Korean short-term debtby $19 billion from $61 to $42 billion in the end of April1998, and helped to increase the stock of usable foreignreserves.
In a Letter of Intent of February 7, 1998, the macro-economic framework of the plan was revised with theGDP growth forecast of 1 percent for 1998. It alsoincluded additional measures to target the fiscal deficit to1 percent of GDP (from a previous surplus of 2 percent)and further development of financial sector's reforms inorder to stabilize short-term debt payments. Given thefragility of the exchange rate, the monetary policyremained tight. Within this program revision, foreigninvestors gained an increased number of financial instru-ments available. On the other hand, domestic companieshad easier access to foreign capital markets and wereexpected to introduce a number of measures needed toimprove overall corporate transparency (i.e. introductionof external audit committee or outside directors).
On May 2 1998, the Korean authorities updated thesecond stage of the program – economic restructuring.This time the fiscal deficit for 1998 was set at the level of
2 percent of GDP. Other changes included the introduc-tion of measures to strengthen the social safety net, fur-ther easing of restrictions on foreign exchange transac-tions and foreign ownership of certain assets. Once again,the GDP growth rate forecast for 1998 was changed tominus two percent. Apart from setting a new policyframework, the review also noticed the successful emis-sion of sovereign bonds which, together with the currentaccount surplus and notable capital inflows, increased thestock of usable foreign reserves to $34.4 billion. Eventhough the vulnerability of the currency market was miti-gated and the interest rate was lowered, monetary policyremained cautious about maintaining the exchange ratestability.
The fact that the won slightly appreciated against theAmerican dollar and was relatively stable (averagingaround W 1290 per US dollar comparing to 1500–1800 atthe beginning of the year) in the mid-1998, let interestrates to go back to the pre-crisis level. This decision wasannounced in a Letter of Intent from July 24. To supporteconomic activity and strengthen the social safety net, asupplementary budget was prepared. This time the fiscaldeficit of 5 percent of GDP was projected. Output wasanticipated to contract to -4 percent. Since the inflationrate moderated, the average rate for 1998 was expectedto be 9 percent. The huge drop in imports and the exportrecovery let the current account to turn into a higher sur-plus of 10 percent of GDP. In a light of a severe recession,further steps towards corporate and financial sectorsrestructuring were inevitable. According to Nam et al.(1999), 94 financial institutions were suspended or closed.As the NPLs were growing, the government provided
CASE Reports No. 39
Figure 6-14. Call rates overnight
0
5
10
15
20
25
30
199
7M 0
1
199
7M 0
3
199
7M 0
5
199
7M 0
7
199
7M 0
9
199
7M 1
1
199
8M 0
1
199
8M 0
3
199
8M 0
5
199
8 M
07
199
8M 0
9
199
8M 1
1
%%
Source: IMF IFS
117
The Episodes of Currency Crises in Latin...
support of 41 billion won (10 percent of GDP) for theirdisposal as well as for banks' restructuring. In result mostof Korean banks achieved capital adequacy ratio between10 and 13 percent.
An acceleration of the recession was so abrupt thatthe GDP growth rate was once again corrected to -5 per-cent in August 1998. A supplementary budget was intro-duced to increase expenditure needed for restructuringdistressed sectors. However, the exchange market stabil-ity allowed further reductions in the overnight call rate,from 25 percent at the beginning of the year to 8.5 per-cent at the end of September. This help disturbed com-panies and reduced the number of bankruptcies from3000 to 1400 during the same period [Nam et al., 1999].
6.5.2. Macroeconomic Environment after theCrisis
After the eruption of the crisis, Korea moved into asevere recession which was not expected even by theIMF staff. As indicated above, the growth forecasts wererevised downward, along with almost all the otherrestructuring program's elements. The fiscal deficit wasalso adjusted in order to accommodate weaker econom-ic activity and costs of financial restructuring. High inter-est rates (reaching 25 percent in January 1998) necessaryto achieve exchange rate stabilization imposed a high bur-den on the real sector. In the first half of 1998, the grossdomestic product plunged to -5.3 percent comparing tothe year before and declined to 6.7 percent during thewhole year. The reduction in output was mostly theresult of a sharp reduction in domestic demand. Theannual percentage changes in private and public con-sumption were equal to -9.6 and -0.1, respectively. Thegross fixed capital formation dropped by 21 percent, andwas probably the most responsible factor of the total out-put squeeze. Exports had declined by 13 percent, yet theslide in import was sharper and equal 22 percent. Thisresulted in the current account surplus of 10.9 percent ofGDP in 1998. The unemployment rate jumped to 6.3 per-cent during the 1st half of the year and reached 6.8 per-cent at the end of the year (during the pre-crisis period itdid not exceed 3 percent). The consolidated central gov-ernment budget was in deficit of 4 percent of GDP com-paring to the pre-crisis surplus (the initial IMF programassumed 0.2 percent surplus). The annual CPI inflation inthe first quarter of the year reached 8.9 percent, but inthe last quarter was down to 3.9 percent, which waslower than before the crisis.
The 1998 recession seemed to be over in 1999 withsome signs of stability visible already in the second-half of1998 which helped to fuel investments. In the third quar-ter of 1999, gross fixed capital formation increased by 4.8
percent compared to its 1998 level. GDP growth boomedand exceeded 10 percent at the end of 1999 – supportedby a monetary and fiscal policy expansion. The fact thatshort-term interest rates were cut from 23–25 percent to5 percent significantly diminished the costs of borrowing.Low interest rates also helped banks and cheabols to bearthe costs of debt restructuring. The budget deficit wasreduced to 3 percent of GDP. The growth in importsreduced the current account surplus to around 6 percentof GDP. The exchange rate was stable oscillating aroundW1200 per US dollar. Nevertheless, there was a couple ofexceptions to this impressive recovery. One of them wasan unemployment rate of 6.3 percent, which despite ofdeceleration was still in a sharp contrast to the pre-crisisaverage; the other was the collapse of the Daewoo groupin the middle of the year.
6.6. Conclusions
The financial turmoil which erupted in Korea in 1997did not really fit into any group of theoretical models offinancial crisis existing in the economic literature at thattime. It is just recently when researches tried do developso-called third generation models with new sets of funda-mentals. Broadly speaking, they aggregate macro andmicroeconomic indicators of economic soundness.
The Korean case is a good example of the greatimportance of complex reforms once the economy isswitching from the centralized to market governance.The healthy macroeconomic background is a prerequi-site, but the high rates of growth, on their own, are not asafeguard of the long-lasting economic success.
In the Korean Republic, highly leveraged cheabolswere vulnerable to shocks like a collapse in investor con-fidence. Inadequate liberalization instead of hosting long-term capital welcomed short-term inflows. Additionally,and even more importantly, cheabols were not efficientand facilitated family connections. Tight relationshipsamong cheabols, banks and the government made thetransparency of financial and corporate sectors virtuallyimpossible. Even if, on average. the prudential rules onbanks in Korea were similar to those in western coun-tries, existing exceptions created a scope for choosing the"regain strategy". The number of financial instrumentsavailable increased once the financial sector was liberal-ized, and made the government attempt to control thestock of foreign capital ineffective.
In the last Letter of Intent dated August 13, 2000which finished the IMF intervention in Korea, the mem-bers of the IMF Executive Board stressed the impressiveKorean rebound from the 1997 crisis. They said it waspossible due to "supportive macroeconomic policies and
CASE Reports No. 39
118
Marek D¹browski (ed.)
the competitive exchange rate; a wide range of structuralreforms that addressed the weaknesses that contributedto the 1997 crisis and increased market orientation; afavorable external environment; and an improvement inconfidence resulting from both the implementation ofstrong economic policies and the recovery and build-up inforeign exchange reserves".
Despite the changes however, there is still a lot to bedone especially in the area of structural reforms. In thespecial joint report the IMF and Korean Governmentagreed on major policies regarding further financial andcorporate sectors restructuring in Korea. They identifiedat least a few problems, which despite the progress madein both sectors need to be solved. Bearing in mind all thereasons for the financial crisis in Korea, a number of themare key. Ongoing policy plans of the financial sectorinclude the following measures:
– while still being the owner of some commercialbanks the government will let banks to operate on a fullycommercial basis and will not be involved in the day-to-day management,
– public funds should be only used to the extent nec-essary to facilitate the liquidation of failed institutions andrestructuring of weak but viable banks,
– financial transactions between affiliated companiesor between institutions and their shareholders are con-fined to transactions in assets for which market priceexist,
– all related party transactions will be disclosed inaudited accounts and reported to FSC,
– exposures of commercial banks, merchant banks,specialized and development banks in excess of the new20 percent or 25 percent limits will be subject to pro-gressive reduction.
Further corporate sector restructuring consists ofpreparation of the consolidated statements assessing theoverall financial structure as well as Daewoo resolution.Others encompass further improvements in financialtransparency and accountability (Financial SupervisoryService) [10].
In spite of all this, the latest news from Seoul is notoptimistic. The unsuccessful auction of Daewoo groupundermined investor confidence and was immediatelymirrored in the stock market decline. Additionally, thescale of corporate indebtedness before the crisis was sogreat that two years time after the crisis South Korea'sconglomerates are still uanble to overcome it. Theprogress towards reducing bad loans has not beenobserved yet; the target of cutting the debt-to-equityratio in the end of 1999 to 200 percent was not achieved.
This begs the question about the efficiency and the
speed of reforms carried out in the country. Indeed, onecan question the IMF restructuring program applied inKorea, which failed to foresee the deepness of the crisisand caused the sharp output downturn, but in the light ofcurrent episodes one can also ask if the imposed condi-tionality was severe enough to bring about 'the secondmiracle.
CASE Reports No. 39
[10] Information about elements of banking system and corporate restructuring during 1998–99 can be found in Appendix 4.
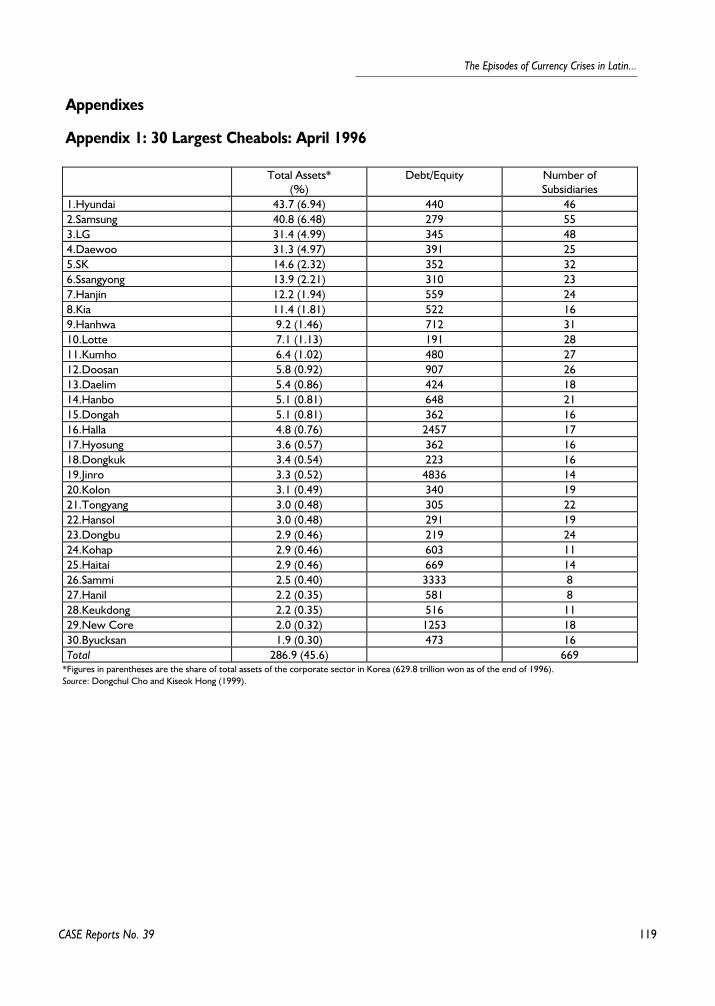
119
The Episodes of Currency Crises in Latin...
CASE Reports No. 39
Appendixes
Appendix 1: 30 Largest Cheabols: April 1996
Total Assets*(%)
Debt/Equity Number ofSubsidiaries
1.Hyundai 43.7 (6.94) 440 462.Samsung 40.8 (6.48) 279 553.LG 31.4 (4.99) 345 484.Daewoo 31.3 (4.97) 391 255.SK 14.6 (2.32) 352 326.Ssangyong 13.9 (2.21) 310 237.Hanjin 12.2 (1.94) 559 248.Kia 11.4 (1.81) 522 169.Hanhwa 9.2 (1.46) 712 3110.Lotte 7.1 (1.13) 191 2811.Kumho 6.4 (1.02) 480 2712.Doosan 5.8 (0.92) 907 2613.Daelim 5.4 (0.86) 424 1814.Hanbo 5.1 (0.81) 648 2115.Dongah 5.1 (0.81) 362 1616.Halla 4.8 (0.76) 2457 1717.Hyosung 3.6 (0.57) 362 1618.Dongkuk 3.4 (0.54) 223 1619.Jinro 3.3 (0.52) 4836 1420.Kolon 3.1 (0.49) 340 1921.Tongyang 3.0 (0.48) 305 2222.Hansol 3.0 (0.48) 291 1923.Dongbu 2.9 (0.46) 219 2424.Kohap 2.9 (0.46) 603 1125.Haitai 2.9 (0.46) 669 1426.Sammi 2.5 (0.40) 3333 827.Hanil 2.2 (0.35) 581 828.Keukdong 2.2 (0.35) 516 1129.New Core 2.0 (0.32) 1253 1830.Byucksan 1.9 (0.30) 473 16Total 286.9 (45.6) 669
*Figures in parentheses are the share of total assets of the corporate sector in Korea (629.8 trillion won as of the end of 1996).Source: Dongchul Cho and Kiseok Hong (1999).
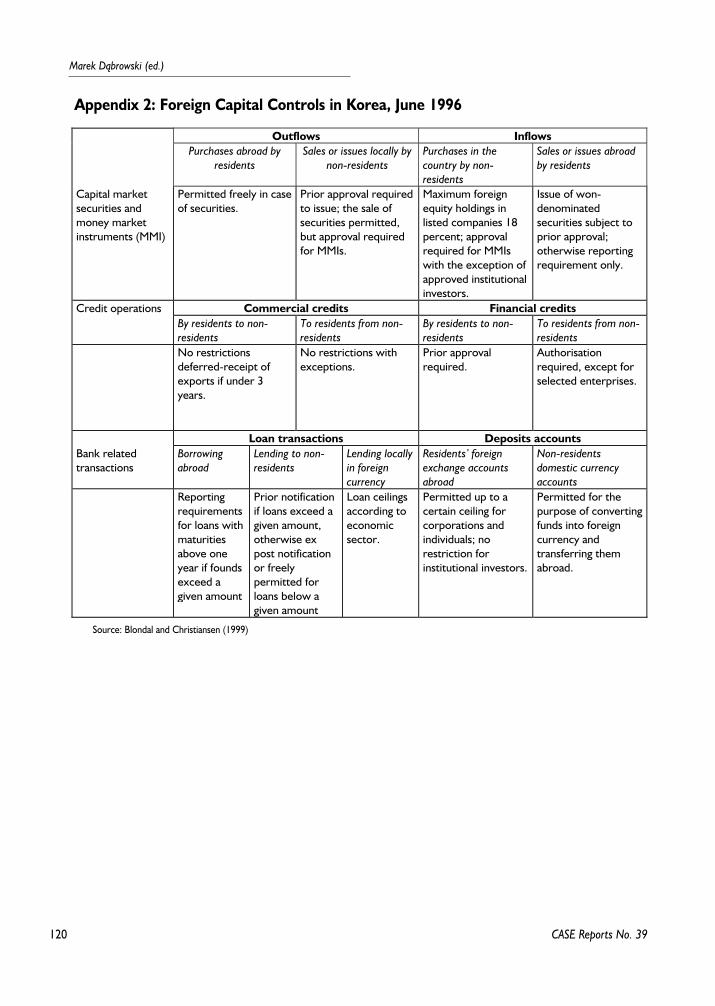
120
Marek D¹browski (ed.)
CASE Reports No. 39
Appendix 2: Foreign Capital Controls in Korea, June 1996
Outflows InflowsPurchases abroad by
residentsSales or issues locally by
non-residentsPurchases in thecountry by non-residents
Sales or issues abroadby residents
Capital marketsecurities andmoney marketinstruments (MMI)
Permitted freely in caseof securities.
Prior approval requiredto issue; the sale ofsecurities permitted,but approval requiredfor MMIs.
Maximum foreignequity holdings inlisted companies 18percent; approvalrequired for MMIswith the exception ofapproved institutionalinvestors.
Issue of won-denominatedsecurities subject toprior approval;otherwise reportingrequirement only.
Credit operations Commercial credits Financial creditsBy residents to non-residents
To residents from non-residents
By residents to non-residents
To residents from non-residents
No restrictionsdeferred-receipt ofexports if under 3years.
No restrictions withexceptions.
Prior approvalrequired.
Authorisationrequired, except forselected enterprises.
Loan transactions Deposits accountsBank relatedtransactions
Borrowingabroad
Lending to non-residents
Lending locallyin foreigncurrency
Residents’ foreignexchange accountsabroad
Non-residentsdomestic currencyaccounts
Reportingrequirementsfor loans withmaturitiesabove oneyear if foundsexceed agiven amount
Prior notificationif loans exceed agiven amount,otherwise expost notificationor freelypermitted forloans below agiven amount
Loan ceilingsaccording toeconomicsector.
Permitted up to acertain ceiling forcorporations andindividuals; norestriction forinstitutional investors.
Permitted for thepurpose of convertingfunds into foreigncurrency andtransferring themabroad.
Source: Blondal and Christiansen (1999)
121
The Episodes of Currency Crises in Latin...
– In January 1997, the 14th largest conglomerate HanboSteel Co. went bankrupt. The long-term rating of threeKorean banks with the high exposure to Hanbo was low-ered. Yet, the sovereign risk for Korea did not deteriorate,indicated the clear separation of the sovereign rating andrating related to the private financial institutions' problem,
– Between March and April there were further defaultsincluding those of the top thirty chebols including SammiSteel on March 19 and Jinro Group on April 21. In spite ofthat, there were no signs of broader problems,
– In July the Kia Motors asked its creditors for the work-out agreement on its debt of $8 billion to avoid receiver-ship,
– In August, in spite of the intervention, the NationalBank of Korea was not able to defend the exchange rate atthe level of W 900 per US dollar. At the same time the gov-ernment announced its readiness to guarantee foreign cur-rency liabilities of Korea's financial institutions. This materi-alized on the October 14, when the government injectedwith money Korea First Bank and some other merchantbanks,
– At the beginning of October, various credit ratingagencies downgraded Korea (S&P, Euromoney, Moody),because of the governmental decisions to rescue KoreaFirst Bank and undertake Kia Motors,
– On October 27, Bloomberg said the free fall of Kore-an won raised the concern the country would need the IMFassistance, but the government denied it,
– On October 29, to attract foreign investors Koreannewspapers announced the bond market would be openedfrom 1998. Nonetheless, it did not prevent the currencyfrom further depreciation,
– On October 30, the foreign press suspected that theBank of Korea official reserves of 30 billion dollars did notinclude dollars borrowed through forward market transac-tions as the Korean government ordered banks to stop sav-ing dollars,
– November 8, government accused foreign press ofmaking unjustified rumours about Korea and asked to stopto destabilize the market. Ironically, investors seemed notto believe this statement,
– November 18, Bank of Korea made emergency loansto 5 major commercial banks worth $1 billion, however stilldenied it would need the IMF assistance,
– November 20, the band was widened from 2.5 to 10percent daily,
– November 21, the Minister of Finance and the Econ-omy announced it would ask a rescue package from the IMF,
– December 4, IMF Executive Board approved a $21 bil-lion stand-by credit for Korea which together with the
World Bank, ADB and individual government loans consti-tuted $58 billion.
CASE Reports No. 39
Appendix 3: Chronology of the Korean Crisis, 1997
122
Marek D¹browski (ed.)
Banking System Restructuring
In the banking sector, a credit crunch resulted from high-er interest rates that increased the stock of non-performingloans (net domestic credit of the banking system droppedby 50 percent on the annual basis). At the end of March1998, the ratio of loans being three months plus in arrearsto total loans was 16.9 percent for banks and 14.5 percentfor all financial institutions (Sang- Loh Kim; 1998). In orderto deal with this problem, in April 1998 an independentsupervisory authority was established to apply internationalprudential standards. Additionally, to help banks resolvingbad loans government committed W32.5 trillion to theNPLs' Resolution Fund and planned to resolve W100 trillionof bad loans via auctions, capital increase or subordinatedbond issues. Five banks were shut down as well as 16 mer-chant banks in 1998. The Korea First Bank and the SeoulBank had been nationalized after they repealed 87.5 percentof their stock.
The Financial Supervisory Commission (FSC) set a mini-mum target for capital adequacy ratios according with theBIS standard for banks and merchant banking corporationsto be achieved by the end of 2000. Together with the Min-istry of Finance measures on improving the disclosure,accounting and accounting standards were introduced(accounting of securities was going to be based on the mar-ket instead of the book value). Starting from July 1, loans ofat least three months in arrears but less than 6 months werecategorized as non-performing. Prompt corrective actionsystem was introduced imposing recommendations, mea-sures and orders on the unsound financial institutions (i.e.banks with the capital adequacy ratio lower than 8 percentminimum).
Corporate Restructuring
Corporate restructuring in Korea proceded on two sep-arate tracks. One was a debt workout for the smallercheabols and other large corporations; the other included apackage for the top five cheabols. Reform bills were passedby the National Assembly in February 1998 and among oth-ers included:
– Tax Exemption and Reduction Control Act – taxbreaks for company restructuring were provided,
– Bank Act – the limit on bank ownership of a corpora-tion's equity increased from 10 to 15 percent, or higher withFinancial Supervisory Commission (FSC) approval,
– Corporation Tax Act – non-deductibility of interest on"excessive" debt was moved from 2002 to 2000,
– Foreign Direct Investment and Foreign Capital Induce-ment Act – takeovers of non-strategic companies by foreigninvestors without government approval were allowed. For-eign investors could acquire 33 percent of shares withoutboard approval (23 percent increase compared to the pre-crisis limit),
– Antitrust and Fair Trade Act – new cross guaranteeswere prohibited. Elimination of existed cross guaranteeswas planed by March 2000,
– Financial Supervisory Committee maintained relativelylax rules on accounting for restructured debt in order tohelp Korean banks to negotiate substantial rate reductionsand conversions of debt into equity or low-yield convertiblebonds [Mako, 1999].
CASE Reports No. 39
Appendix 4: Banking System and Corporate Restructuring
123
The Episodes of Currency Crises in Latin...
References
Agenor P. , J. Aizenman (1999). "Financial Sector Ineffi-ciencies and Co-ordination Failures. Implication for CrisisManagement". NBER Working Paper No. 7446, December1999.
Balino T., et al. (1999). "The Korean Financial Crisis of1997 – A Strategy of Financial Sector Reform". Internation-al Monetary Fund, Working Paper No. 28.
Bank For International Settlements, Annual Report1997, 1998.
Bank of Korea, various issues, http://www.bok.or.krBlondal S., H. Christiansen (1999). "The Recent Experi-
ence With Capital Flows to Emerging Market Economies".OECD, Working Paper No. 3.
Cailloux J., S. Griffith-Jones (1999). "Global CapitalFlows to East Asia. Surges and Reversals, Institute forDevelopment Studies". University of Sussex, November.
Chong Nam, Joon-Kyung Kim, Yeongjae Kang, SungWook Joh, and Jun-Il Kim, Corporate Governance in Korea,OECD Conference on Corporate Governance in Asia: AComparative Perspective, March 1999.
Corsetti, et al. (1998). "What Caused the Asian Currencyand Financial Crisis?". Part I: Macroeconomic Review, NBERWorking Paper No. 6833, http://www.nber.org/papers
Dooley M.P., S. Inseok (2000). "Private Inflows whenCrises are Anticipated: A Case Study of Korea".
Financial Supervisory Service, Monthly Review, Volume INo. 8., August 2000 http://www.fss.or.kr
Hahm Joon-Ho and Mishkin F. S. (2000). "Causes of theKorean Financial Crisis: Lessons for Policy". NBER WorkingPaper No. 7483.
International Monetary Fund, International Financial Sta-tistic, various issues.
Kaminsky G., C. Reinhart (1996). "The Twin Crises: theCauses of Banking and Balance of Payments Problems".International Finance Discussion Paper No. 544, Board ofGovernors of the Federal Reserve, March.
Lane, et al (1999). "IMF-Supported Programs in Indone-sia, Korea, and Thailand. A Preliminary Assessment". Inter-national Monetary Fund, Occasional Paper No. 178, Wash-ington.
Mako W.P. (1999). "Corporate Restructuring in Koreaand Thailand". OECD Conference on Corporate Gover-nance in Asia: A Comparative Perspective.
Mishkin F.S. (1996). "Understanding Financial Crisis:Developing Country Perspective". NBER, Working PaperNo. 5600.
OECD Economic Surveys, 1997–1998, Korea.Park D., C. Rhee (1998). "Currency Crisis in Korea:
How Has Is Been Aggravated".Sang-Loh Kim (2000). "Current Trends and Prospects of
Korean Economy and its Restructuring".
Yoon Je Cho, Changyong Rhee (1999). "Macroeconom-ic Views of the East Asian Crisis: A Comparison". Paper pre-pared for the World Bank Conference, "Asian CorporateRecovery: Corporate Governance and Role of Govern-ments", Bangkok, Thailand.
CASE Reports No. 39
125
The Episodes of Currency Crises in Latin...
The comparison of the four papers on the 1997–1998financial crises in Asia clearly indicates that Korea, Thailand,Malaysia and Indonesia fall in the group of relativelyhomogenous economies.
1. After the Second World War, all these countries werecharacterized as under-developed economies. They man-aged to change this situation due to very high rates of eco-nomic activity accompanied by very high investment andsaving rates. The civilization leap might not have beenachieved without the prominent role of the state. As theyears passed, government interference in economic lifegradually diminished but still remains relatively strong. In amarket economy, the government used to significantly influ-ence the investment allocation and consequently determinethe development of the selected branches of economy.Therefore, it had to target the specific financial instrumentsin order to push the private sector into the preferred areaof economic activity. As a result, the Asian economies arecharacterized by strong interdependence of the private sec-tor and government spheres.
2. The aspiration for high and sustainable rates of eco-nomic growth forced all the countries to liberalize theirdomestic financial markets. As a result of financial marketliberalization, accompanied by weak regulation, the newlyestablished financial intermediaries engaged excessively infinancing projects characterized by high branch and creditconcentration. Then the Asian countries became increasing-ly aware about the high costs of not participating in global-ization of the world economy. Due to very specific andstructural reasons, they liberalized short-term capital flowsfar before liberalization of FDI and long-term capital flows.The method of liberalization of both the financial marketsand capital accounts significantly contributed to the scopeand intensity of the Asian crisis.
3. The extreme state interference in economic lifecaused excessive concentration of market power and own-
ership. The powerful, family-owned conglomerates werecharacterized by unbelievably high rates of economicexpansion accompanied by insufficient improvement in pro-ductivity. The low economic efficiency was caused by anumber of factors. The most important is the imperfectorganizational structure (e.g. in Korea – the role played bychairman office), weak corporate governance, excessiveoutput diversification (preventing conglomerates fromeffective competition in a few carefully chosen branches)and growing domestic and foreign competition. Moreover,the Asian countries experienced a relatively slow process ofdemocratization. With high ownership concentration,intensive state interference in economic life and youngdemocratic institutions, the countries exhibited poor trans-parency of public finance and government relationships withprivate sector.
4. The strong desire to preserve the existing structureof ownership led conglomerates to finance their rapidexpansion through credits from financial markets with anegligible role played by capital markets. In the presence ofweak financial regulation and high rates of economicgrowth, such a practice was responsible for conglomerates'uncontrolled indebtedness on the domestic market andexcessive credit risk concentration in the financial sector.Moreover, liberalization of the capital account allowed firmsto incur new debts on international financial markets andcontinue their economic expansion. Many companiesfinanced their activity as if they didn't face hard budget con-straint. As a result, the share of FDI and long-term invest-ments in total foreign debt was small but the ratio of debtto equity and ratio of short-term foreign debt to foreignofficial reserves reached high and unsustainable levels.
5. Imperfect and opaque markets emerged as a result ofthe state interference in the economy and high concentra-tion of private ownership. Under such conditions, investors(especially foreign ones) couldn't obtain all the necessaryinformation for a correct risk assessment. Moreover, there
CASE Reports No. 39
Comments to Papers on Asian Crisesby Jerzy Pruski*
* The £ód¿ University
126
Marek D¹browski (ed.)
is some evidence that even the conglomerates were unable,at least to some extent, to assess the total risk of their rapidexpansion.
6. The analysis of the main features of the Asianeconomies leads to the conclusion that ineffective micro-economic foundations, coupled with opqaue markets, andthe resulting asymmetry of information were responsible forthe 1997–1998 financial crises. That line of reasoning is sup-ported by the fact that Korea, Malaysia, Thailand andIndonesia demonstrated good economic performance interms of the GDP growth, inflation, unemployment andpublic finance deficit. The relatively high current accountdeficits were the only exception to overall positive macro-economic picture.
7. However, in the second half of the 1990's, globaliza-tion and higher openness exposed the Asian economies tohigher competition, appreciation of local currencies anddeterioration of terms of trade. Global markets severelyverified the microeconomic efficiency of industrial corpora-tions and financial institutions and, to some extent,improved the transparency of particular markets.
8. The above remarks emphasize the role of structuralfactors and microeconomic inefficiencies as the main rea-sons behind the financial crises in Asia. In general, the situa-tion should improve, due to deep structural and institution-al reforms. However, the positive effects of supply-sidereforms usually require long time. But it is known that theAsian countries recovered from crisis quickly and since thentheir economies have performed surprisingly well. Econo-mists have explained many aspects of financial crisis, but nodoubt there is still enormous scope for additional researchwork.
CASE Reports No. 39
Recommended