Full Terms & Conditions of access and use can be found athttp://www.tandfonline.com/action/journalInformation?journalCode=ttrv20
Download by: [65.115.226.28] Date: 02 February 2016, At: 14:20
Transport Reviews
ISSN: 0144-1647 (Print) 1464-5327 (Online) Journal homepage: http://www.tandfonline.com/loi/ttrv20
Bikeshare: A Review of Recent Literature
Elliot Fishman
To cite this article: Elliot Fishman (2016) Bikeshare: A Review of Recent Literature, TransportReviews, 36:1, 92-113, DOI: 10.1080/01441647.2015.1033036
To link to this article: http://dx.doi.org/10.1080/01441647.2015.1033036
Published online: 24 Apr 2015.
Submit your article to this journal
Article views: 2075
View related articles
View Crossmark data
Citing articles: 4 View citing articles
Bikeshare: A Review of Recent Literature
ELLIOT FISHMAN§
Department of Human Geography and Spatial Planning, Faculty of Geosciences, Utrecht
University, Heidelberglaan 2, 3584 CS Utrecht, Room 404, PO Box 80115, 3508 TC Utrecht, The
Netherlands
(Received 12 November 2014; revised 18 March 2015; accepted 19 March 2015)
ABSTRACT The number of cities offering bikeshare has increased rapidly, from just a handful in the
late 1990s to over 800 currently. This paper provides a review of recent bikeshare literature. Several
themes have begun to emerge from studies examining bikeshare. Convenience is the major motivator
for bikeshare use. Financial savings has been found to motivate those on a low income and the dis-
tance one lives from a docking station is an important predictor for bikeshare membership. In a range
of countries, it has been found that just under 50% of bikeshare members use the system less than
once a month. Men use bikeshare more than women, but the imbalance is not as dramatic as
private bike riding (at least in low cycling countries). Commuting is the most common trip
purpose for annual members. Users are less likely than private cyclists to wear helmets, but in
countries with mandatory helmet legislation, usage levels have suffered. Bikeshare users appear
less likely to be injured than private bike riders. Future directions include integration with e-
bikes, GPS (global positioning system), dockless systems and improved public transport integration.
Greater research is required to quantify the impacts of bikeshare, in terms of mode choice, emissions,
congestion and health.
1. Introduction
Bikeshare has grown rapidly in the past decade. Although the concept has beenaround since the 1960s, the number of cities offering bikeshare has increased fromjust a handful in the late 1990s to over 800 at the time of publication (Meddin &DeMaio, 2015). Contemporary bikeshare programmes (BSPs) refer to the provisionof bikes, which can be picked up and dropped off at self-serving docking stations.Typically, trips are of a short duration (less than 30 min). The bicycles usuallycontain technologies that allow the programme operator to track their dockingstation location and some are equipped with a global positioning system (GPS)(Davis, 2014). Payment is usually by credit card, and this also acts as a form of secur-ity and eliminates the anonymity that led to the demise of earlier, less technologi-cally advanced BSPs (DeMaio, 2009; Shaheen, Guzman, & Zhang, 2010).
The global growth of BSPs has spurred an enthusiastic response from transportresearchers, which has led to a burgeoning of papers examining bikeshare. Who
§
Current address: Institute for Sensible Transport, 3 Nicholson Street, East Brunswick, Melbourne, VIC3057, Australia. Email: [email protected]
Transport Reviews, 2016Vol. 36, No. 1, 92–113, http://dx.doi.org/10.1080/01441647.2015.1033036
# 2015 Taylor & Francis
Dow
nloa
ded
by [
65.1
15.2
26.2
8] a
t 14:
20 0
2 Fe
brua
ry 2
016
uses bikeshare and why? What factors prevent others from choosing bikeshareand what might encourage them to do so? What impact has bikeshare had onreducing car use? What do the data tell us about bikeshare and road safety?This paper sets out to capture critical themes emerging from recently publishedliterature on these and other bikeshare topics. The overall aim is to provideresearchers, bikeshare operators and government policy-makers with a distilla-tion of the salient findings from bikeshare research. It is hoped such a paperwill enhance the capacity of the rapidly growing bikeshare sector to capitaliseon recent research, thereby enhancing the performance of new and existing BSPs.
1.1. Review of the Literature
This review of the English language bikeshare literature encompasses recentresearch from North America, Asia, Europe and Australia. The emphasis is onpapers published since 2013, as earlier papers of relevance are included in a syn-thesis of bikeshare literature published by this journal (Fishman, Washington, &Haworth, 2013). Relevant papers were collected via a scan of Scopus andGoogle Scholar databases, using the search terms ‘Bicycle sharing’, ‘Bikeshare’,‘Public bicycle’ and ‘Public bike’, conducted between May and October 2014. Asthe following section shows, bikeshare activity is strongest in China, but there isa relative paucity of bikeshare research in Asia and this review reflects this imbal-ance.
This paper reviews research across a range of bikeshare topics, including itsdocumented history and growth, usage patterns, user preferences and demo-graphics. Research examining barriers to bikeshare are also reviewed, as well asthe little research that has taken placing assessing the impacts of bikeshare.Fleet rebalancing research is touched upon, followed by a synthesis of futuredirections for the bikeshare industry and critical gaps in knowledge and prioritiesfor researchers. The review highlights current limitations in bikeshare knowledge,and these are particularly evident in the areas of rebalancing, sampling of non-bikeshare users and the impacts on bikeshare. These issues are especially impor-tant given that a central motive for the development of bikeshare is sustainabletransport outcomes, yet no standard methodology has been established toenable operators and researchers to accurately and consistently measure theimpact BSPs have on car use, climate change, congestion or public health.Finally, some researchers have taken the opportunity provided by automatedbikeshare data collection to analyse temporal and spatial relationships and thisis not captured in the current review. Rather, coverage of this work is includedin a separate paper in this Special Issue.
1.2. Policy Context
Many cities during the post-Second World War period became increasinglydependent on the private automobile (Fishman & Brennan, 2010). An increasingrecognition of the negative impacts of car use has emerged over recent years, interms of congestion, air and noise pollution, safety, climate change and reductionsin physical activity. This has spurred a growing interest in urban cycling generally(Fishman, 2014; Handy, van Wee, & Kroesen, 2014). It is this policy context, com-bined with increasingly affordable payment and tracking technologies, that hasprovided the platform for the extraordinary growth of bikeshare.
Bikeshare 93
Dow
nloa
ded
by [
65.1
15.2
26.2
8] a
t 14:
20 0
2 Fe
brua
ry 2
016

2. History and Recent Growth
In 1965 Witte Fietsen (White Bikes) was launched in Amsterdam (Davis, 2014).This programme consisted of white painted bicycles on the street, free forpeople to use. The total absence of security mechanisms led to theft and vandal-ism, and a rapid demise of Witte Fietsen (DeMaio, 2009). Bikeshare, as aconcept, experienced little growth after the failure of the White Bike programme,until technological advancements emerged designed to reduce the threat of vand-alism and theft.
2.1. Generations of Bikeshare
Some researchers have categorised the evolution of bikeshare systems into four‘generations’ (Parkes, Marsden, Shaheen, & Cohen, 2013). The White Bike pro-gramme described above is known as a first-generation bikeshare ‘system’,characterised by no payment or security functions. Second-generation pro-grammes involved a coin deposit system (similar to trolleys at a supermarket orairport). The first large-scale second-generation programme launched in Copen-hagen in 1995, but the anonymity exposed the system to theft (DeMaio, 2009).The problems experienced by these first two generations of bikeshare led to thedevelopment of third-generation systems, which are characterised by dedicateddocking stations (in which bicycles are picked up and returned), as well as auto-mated credit card payment and other technologies to allow the tracking of thebicycles (Shaheen, Cohen, & Martin, 2013). It is these elements, in combinationwith growing public policy interest in cycling (Pucher & Buehler, 2012), thathave enabled the rapid growth of BSPs globally (Shaheen & Guzman, 2011).The features of fourth-generation systems are not quite so clear, but are said topotentially include dockless systems, easier installation, power assistance andtransit smartcard integration (Parkes et al., 2013).
2.2. Bikeshare’s Recent Growth
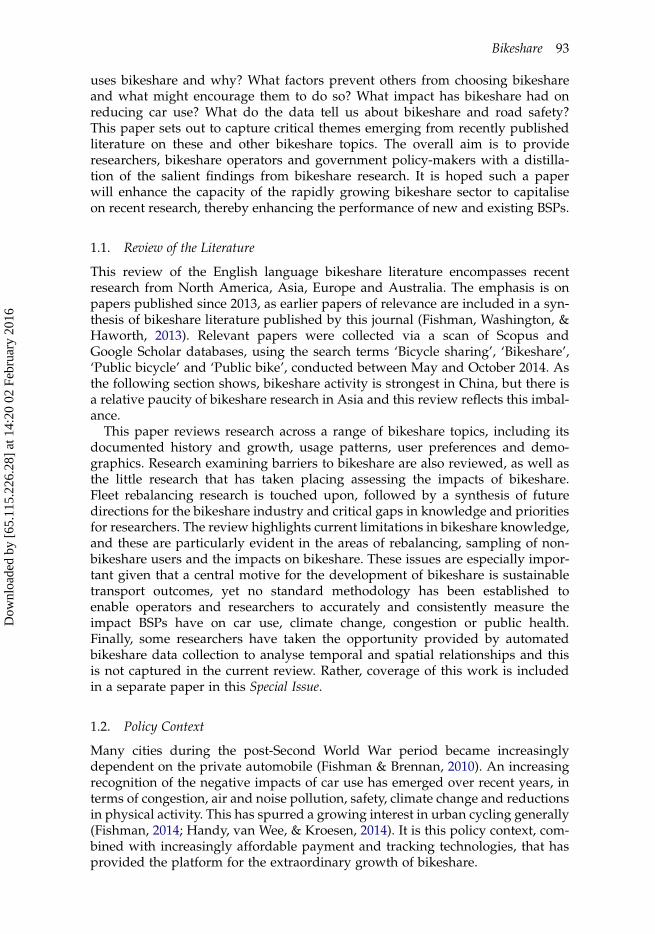
In the past decade, the number of cities operating a BSP has increased from 13 in2004 to 855 as of 2014, as illustrated in Figure 1. The global bikeshare fleet is esti-mated at 946 000 bicycles, of which 750 500 are in China (Meddin & DeMaio,2015). China also has more than double the number of bikeshare systems as thenext closest country, at 237, compared to 114 in Italy and 113 in Spain. The USA,a relative latecomer to bikeshare, has 54 cities offering bikeshare (Meddin &DeMaio, 2015).
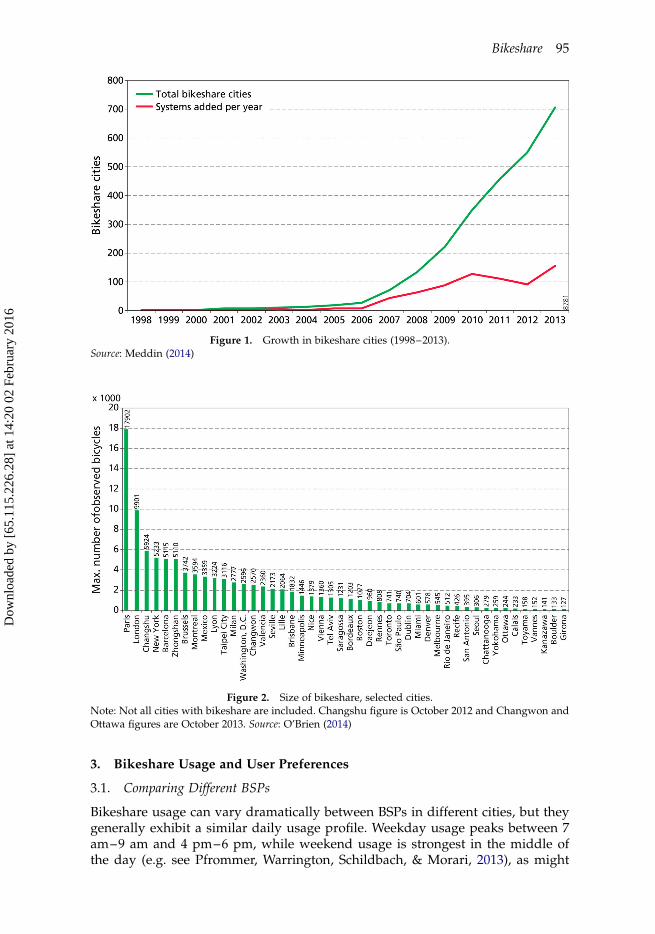
In 2010, Oliver O’Brien began visualising bikeshare activity in different cities,making this available via the website http://oobrien.com/bikesharemap/. Thisbecame the most efficient method of examining the number of bikes availableand the number of bikes in use. Interestingly, an analysis of these data revealsthat the number of bikes available is often considerably lower than what bikeshareoperators report. Figure 2 uses data collected via the aforementioned bikesharemap for selected cities, showing the maximum number of observed bicycles. Euro-pean systems tend to be larger than North American systems and some havesuggested that this may be due to a tendency for European systems to be totallyor largely funded through advertising, as well as cycling participation beinghigher in most European countries (Parkes et al., 2013).
94 E. Fishman
Dow
nloa
ded
by [
65.1
15.2
26.2
8] a
t 14:
20 0
2 Fe
brua
ry 2
016
3. Bikeshare Usage and User Preferences
3.1. Comparing Different BSPs
Bikeshare usage can vary dramatically between BSPs in different cities, but theygenerally exhibit a similar daily usage profile. Weekday usage peaks between 7am–9 am and 4 pm–6 pm, while weekend usage is strongest in the middle ofthe day (e.g. see Pfrommer, Warrington, Schildbach, & Morari, 2013), as might
Figure 1. Growth in bikeshare cities (1998–2013).Source: Meddin (2014)
Figure 2. Size of bikeshare, selected cities.Note: Not all cities with bikeshare are included. Changshu figure is October 2012 and Changwon andOttawa figures are October 2013. Source: O’Brien (2014)
Bikeshare 95
Dow
nloa
ded
by [
65.1
15.2
26.2
8] a
t 14:
20 0
2 Fe
brua
ry 2
016
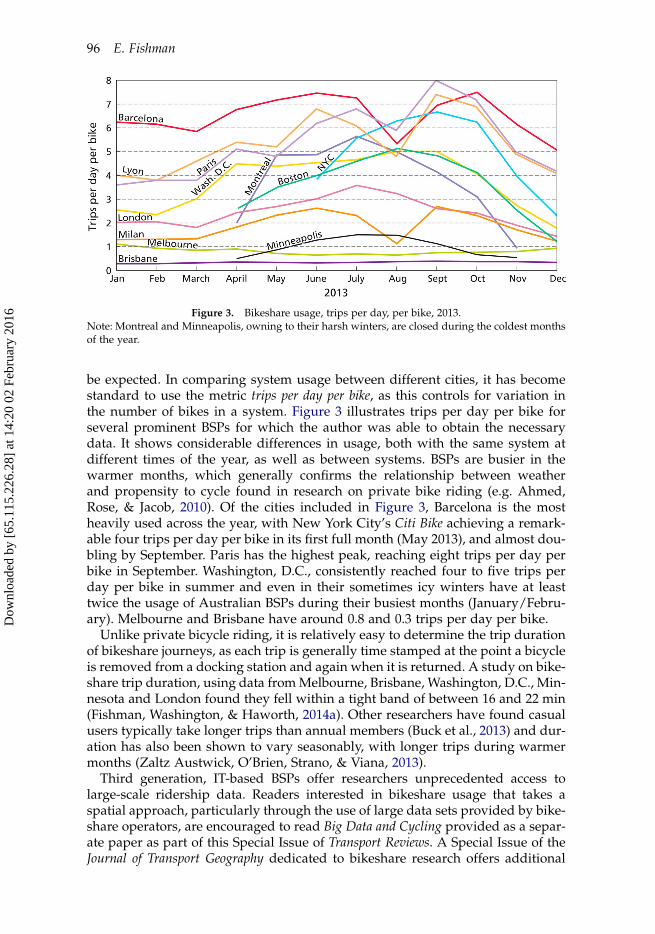
be expected. In comparing system usage between different cities, it has becomestandard to use the metric trips per day per bike, as this controls for variation inthe number of bikes in a system. Figure 3 illustrates trips per day per bike forseveral prominent BSPs for which the author was able to obtain the necessarydata. It shows considerable differences in usage, both with the same system atdifferent times of the year, as well as between systems. BSPs are busier in thewarmer months, which generally confirms the relationship between weatherand propensity to cycle found in research on private bike riding (e.g. Ahmed,Rose, & Jacob, 2010). Of the cities included in Figure 3, Barcelona is the mostheavily used across the year, with New York City’s Citi Bike achieving a remark-able four trips per day per bike in its first full month (May 2013), and almost dou-bling by September. Paris has the highest peak, reaching eight trips per day perbike in September. Washington, D.C., consistently reached four to five trips perday per bike in summer and even in their sometimes icy winters have at leasttwice the usage of Australian BSPs during their busiest months (January/Febru-ary). Melbourne and Brisbane have around 0.8 and 0.3 trips per day per bike.
Unlike private bicycle riding, it is relatively easy to determine the trip durationof bikeshare journeys, as each trip is generally time stamped at the point a bicycleis removed from a docking station and again when it is returned. A study on bike-share trip duration, using data from Melbourne, Brisbane, Washington, D.C., Min-nesota and London found they fell within a tight band of between 16 and 22 min(Fishman, Washington, & Haworth, 2014a). Other researchers have found casualusers typically take longer trips than annual members (Buck et al., 2013) and dur-ation has also been shown to vary seasonably, with longer trips during warmermonths (Zaltz Austwick, O’Brien, Strano, & Viana, 2013).
Third generation, IT-based BSPs offer researchers unprecedented access tolarge-scale ridership data. Readers interested in bikeshare usage that takes aspatial approach, particularly through the use of large data sets provided by bike-share operators, are encouraged to read Big Data and Cycling provided as a separ-ate paper as part of this Special Issue of Transport Reviews. A Special Issue of theJournal of Transport Geography dedicated to bikeshare research offers additional
Figure 3. Bikeshare usage, trips per day, per bike, 2013.Note: Montreal and Minneapolis, owning to their harsh winters, are closed during the coldest monthsof the year.
96 E. Fishman
Dow
nloa
ded
by [
65.1
15.2
26.2
8] a
t 14:
20 0
2 Fe
brua
ry 2
016
insights into spatial examinations of bikeshare (e.g. Corcoran & Li, 2014; Corcoran,Li, Rohde, Charles-Edwards, & Mateo-Babiano, 2014; Faghih-Imani, Eluru, El-Geneidy, Rabbat, & Haq, 2014; Goodman & Cheshire, 2014; Vogel et al., 2014).These works as well as future research capitalising on GPS embedded in newBSP hardware offer promising opportunities to examine geospatial and temporalbikeshare usage patterns, potentially providing new insights into route choice andother usage characteristics.
3.2. User Preferences
The motivations and preferences for using bikeshare is an area of interest toresearchers, policy-makers as well as BSP operators. As many BSPs requirethose signing up for a monthly or annual membership to provide an emailaddress, operators have been able to gauge the views of members with relativeease, via emailed online surveys. This section provides a review of literatureregarding the results of these activities.
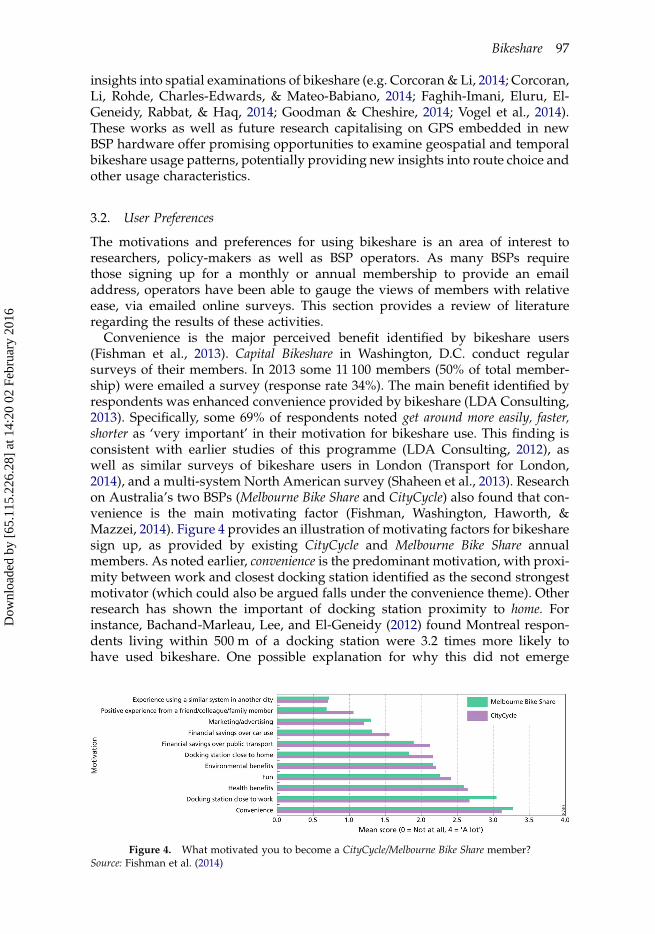
Convenience is the major perceived benefit identified by bikeshare users(Fishman et al., 2013). Capital Bikeshare in Washington, D.C. conduct regularsurveys of their members. In 2013 some 11 100 members (50% of total member-ship) were emailed a survey (response rate 34%). The main benefit identified byrespondents was enhanced convenience provided by bikeshare (LDA Consulting,2013). Specifically, some 69% of respondents noted get around more easily, faster,shorter as ‘very important’ in their motivation for bikeshare use. This finding isconsistent with earlier studies of this programme (LDA Consulting, 2012), aswell as similar surveys of bikeshare users in London (Transport for London,2014), and a multi-system North American survey (Shaheen et al., 2013). Researchon Australia’s two BSPs (Melbourne Bike Share and CityCycle) also found that con-venience is the main motivating factor (Fishman, Washington, Haworth, &Mazzei, 2014). Figure 4 provides an illustration of motivating factors for bikesharesign up, as provided by existing CityCycle and Melbourne Bike Share annualmembers. As noted earlier, convenience is the predominant motivation, with proxi-mity between work and closest docking station identified as the second strongestmotivator (which could also be argued falls under the convenience theme). Otherresearch has shown the important of docking station proximity to home. Forinstance, Bachand-Marleau, Lee, and El-Geneidy (2012) found Montreal respon-dents living within 500 m of a docking station were 3.2 times more likely tohave used bikeshare. One possible explanation for why this did not emerge
Figure 4. What motivated you to become a CityCycle/Melbourne Bike Share member?Source: Fishman et al. (2014)
Bikeshare 97
Dow
nloa
ded
by [
65.1
15.2
26.2
8] a
t 14:
20 0
2 Fe
brua
ry 2
016
from the Australian research is that the docking station catchment is overwhel-mingly located in employment rather than residential districts (Fishman et al.,2014).
Saving money has also been found to be a motivating factor for members ofsome BSPs (though a weak motivation in Figure 4). For low income members ofCapital Bikeshare, over 70% of respondents note saving money on transport is animportant sign-up motivation (LDA Consulting, 2013). In a related finding froma London study, bikeshare members who were residents of poorer areas hadhigher trip rates than members of more affluent suburbs (Ogilvie & Goodman,2012). One possible reason why financial savings did not feature as a strong motiv-ation for Australian BSP members may be because they had a vastly higherincome than the general population (Fishman, Washington, Haworth, &Watson, 2015).
3.2.1. User frequency. One of the somewhat surprising findings from investi-gations on BSP user frequency is that, on the whole, members are not particularlyfrequent bikeshare users. In London, almost half (49%) of members responding toa Transport for London survey reported not having used the service once in thepast month (Transport for London, 2014). In Washington, D.C., some 21%female Capital Bikeshare members reported no rides in a typical month, comparedto 13% for men (Buck et al., 2013). In an Australian study, almost half (46%) ofannual members recorded no trips in the previous month and only 14% use thesystem everyday (Fishman et al., 2014).
Based on the above data, it appears that many bikeshare subscribers may viewbikeshare as an occasional adjunct to their primary and secondary transportmodes. In focus group discussions with bikeshare members, a commonly reportedmotivation for signing up was a desire to show support for the governmentdecision to initiate a BSP (Fishman, Washington, & Haworth, 2012a) and thismay help explain why around half of members report no usage in the previousmonth.
3.2.2. Trip purpose. The most common trip purpose for bikeshare appears to besomewhat dependent on the type of user. For instance, a survey of Capital Bikeshareusers in Washington, D.C. which reveals 43% of long-term members last trip waswork related, whereas this drops to 2% for short-term users (Buck et al., 2013).Similarly, in London, 52% of respondents of an annual member survey reportthat their last trip was commuting to/from work, with no other trip purposeaccounting for more than 10% (Transport for London, 2014). The day the surveywas taken is not identified and this may influence results, as a weekend surveydistribution is likely to show higher levels of social trips. In Brisbane, 65% of City-Cycle casual users report that their main trip purpose for their last CityCyclejourney was ‘leisure or sightseeing’, whereas for long-term subscribers, only14% recorded this as the purpose of their last trip. Long-term users are muchmore likely to report using CityCycle for work trips (Roy Morgan Research,2013). Among the most detailed description of bikeshare trip purpose, LDA Con-sulting (2013) identified that trip purpose can vary by residential location, age,gender, ethnicity and whether the member has a car available for their use.Women were found to be more likely to report making errands by bikeshare,whereas men were more likely to report commute trips by bikeshare (LDA Con-sulting, 2013).
98 E. Fishman
Dow
nloa
ded
by [
65.1
15.2
26.2
8] a
t 14:
20 0
2 Fe
brua
ry 2
016
3.2.3. Voluntary helmet use and bikeshare. A consistent theme emerging from theliterature on bikeshare and helmets is that in jurisdictions in which helmet useis voluntary, bikeshare users are less likely to wear a helmet than a private bikerider in the same city. For instance, an observational study has found US bikeshareriders are four times less likely to wear a helmet than private bike riders in thesame cities, controlling for age and gender (Fischer et al., 2012). In London, 16%of bikeshare riders wear helmets, compared to 64% for those on private bikes(Goodman, Green, & Woodcock, 2014). A recent study in New York City foundsome 85% Citi Bike users do not wear a helmet (Basch, Zagnit, Rajan, Ethan, &Basch, 2014) and 45% of Capital Bikeshare surveyed members report neverwearing a helmet (LDA Consulting, 2013). Interestingly, helmet use appears tovary considerably depending on whether the bikeshare user is a long-term orshort-term subscriber. For instance, in a study by Buck et al. (2013), 94% ofshort-term subscribers did not wear a helmet, compared to 63% for long-term sub-scribers. An explanation for this difference might be that short-term subscribersmay be more likely to take spontaneous trips, in which they did not have ahelmet with them. Previous research has revealed a reluctance to carry a helmeton the chance they will use bikeshare spontaneously at some point during theday (Fishman et al., 2012a).
3.2.4. Demographics of bikeshare users. The demographics of bikeshare users havebecome a common focus of attention for bikeshare operators and researchers. Theissues examined include gender and income mix relative to the underlying popu-lation averages, as well as ethnicity and education status. Much of this researchhas revealed common trends; users tend to be of higher average income (e.g.Fishman et al., 2015; Lewis, 2011; Woodcock, Tainio, Cheshire, O’Brien, &Goodman, 2014), and education status (e.g. Fishman et al., 2014; LDA Consulting,2013; Shaheen et al., 2013) and engaged in full-time or part-time work (Woodcocket al., 2014).
Buck et al. (2013) carried out one of the few studies that set out to specificallyexamine demographic differences between bikeshare users and other cyclists.The authors collected data on Capital Bikeshare users (short- and long-term subscri-bers) as well as regular cyclists in the same geographic area (Washington, D.C.).The authors found that in comparison to regular bicycle riders, bikeshare userswere more likely to be female, younger and own fewer cars and bicycles.Capital Bikeshare users were likely to have lower mean household incomes com-pared to regular cyclists (US$81 920 compared to US$93 180). Interestingly,however, and something not reported in the Buck et al. study, median householdincome for the general population in the Washington, D.C. area is US$64 267(United States Census Bureau, 2013). This suggests both bikeshare users andgeneral bicycle riders have higher incomes than the general Washington, D.C.population, though it is possible response bias contributes to this difference. Astudy by Goodman and Cheshire (2014) found that users of the London BSPwere disproportionately wealthy when the programme began in 2010. As the pro-gramme matured, however, the proportion of users from deprived areas increasedfrom 6% to 12% between 2010 and 2013. The increase in usage fees in January 2013,however, has, according to Goodman and Cheshire (2014) resulted in a reductionin the level of casual use from those residing in the most economically deprivedareas of London.
Bikeshare 99
Dow
nloa
ded
by [
65.1
15.2
26.2
8] a
t 14:
20 0
2 Fe
brua
ry 2
016
The ethnicity of bikeshare users has been documented in some North Americanprogrammes as well as in London. The results show some substantial differencesbetween bikeshare users and the general population. For instance, only 3% ofCapital Bikeshare members are African-American, compared to 8% for generalbicycle riders in the D.C. area (Buck et al., 2013), despite African-Americansmaking up some 50% of the Washington, D.C. population (United States CensusBureau, 2013). Members of London’s BSP have been found to differ demographi-cally from the general London population. Some 88% of respondents to a Trans-port for London identified as being white (Transport for London, 2014),compared to 55% for the general London population (Office of National Statistics,2014). Many BSPs do not cover the full residential area of the city, and this mayoffer an explanation for the demographic biases of bikeshare users.
In terms of bicycle ownership, Buck et al. (2013) found only 29% of Capital Bike-share members owned a bicycle, compared to 94% for general bicycle riders. Astudy using snowballing sampling in Montreal, Canada, found those owning abike were less frequent users of bikeshare (Bachand-Marleau et al., 2012). Interest-ingly, the same study found those possessing a driver’s licence had 1.5 timesgreater odds of using bikeshare.
Several studies have identified a relationship between gender and bikeshareusage. One US commentator has suggested bikeshare does not have the samelevel of gender disparity as general cycling in North America (Goodyear, 2013),although no report details were offered allowing the reader to verify thenumbers provided in the online piece. In countries with low levels of generalcycling, such as the UK, the USA and Australia, between 65% and 90% ofcycling trips are by men (Pucher & Buehler, 2012), while in strong cyclingcountries such as the Netherlands, women cycle more than men (Harms, Berto-lini, & Brommelstroet, 2013). Unsurprisingly therefore, BSPs in countries withlow cycling usage have lower levels of female participation. For instance, lessthan 20% of trips by registered users of the London BSP are by women(Goodman & Cheshire, 2014), though this proportion rises slightly whenlooking at casual users. Interestingly, female participation rises substantially fortrips that start or finish in a park, possibly suggesting a desire among femalesto avoid motorised traffic routes in London and a recreational rather than com-muting trip purpose. Previous research has found that women have a strongerpreference for traffic free riding (Johnson, Charlton, & Oxley, 2010). A study ofAustralia’s bikeshare members has found that women account for 23% and40% of annual members in Melbourne and Brisbane, respectively, but it is notclear what accounts for the discrepancy between the two (Fishman et al., 2014).Nevertheless, the proportion of female CityCycle members is greater than forprivate bike riding in Australia (Pucher, Greaves, & Garrard, 2010). Dublin’s bike-share gender split is 22% female (Murphy & Usher, 2015). In one of the fewstudies of short-term bikeshare users, Buck et al. (2013) found that in interceptsurveys of Capital Bikeshare users, the gender split was even. The authorsexpressed doubts as to whether the survey method was valid for calculating agender difference. In an annual member survey of the same programme 55%of respondents were male, which is broadly in line with the intercept surveyresults (Buck et al., 2013).
In summary, bikeshare uses are on average disproportionately of higher edu-cation and income, more likely to be male and white. The gender disparity doesappear to be smaller, however, than for private bike riding.
100 E. Fishman
Dow
nloa
ded
by [
65.1
15.2
26.2
8] a
t 14:
20 0
2 Fe
brua
ry 2
016
4. Barriers to Bikeshare
There is a paucity of research examining barriers to bikeshare, in large partbecause of the difficulty associated with data collection. As identified previously,long-term bikeshare subscribers typically provide an email address as part of themembership sign-up process. No such access is available when gauging the viewsof those with no known association with bikeshare, and this is compounded by thefact that levels of interest in participating in bikeshare research is lower than forthose who have used bikeshare (Fishman, 2014). Nevertheless, a critical need toexamine barriers to bikeshare exists, both to improve system attractiveness inthose with disappointing usage as well as for informing the design of futureBSPs. The following section documents the key finding from the limited researchgauging the views without a known connection with bikeshare.
4.1. Convenience and Safety Concerns
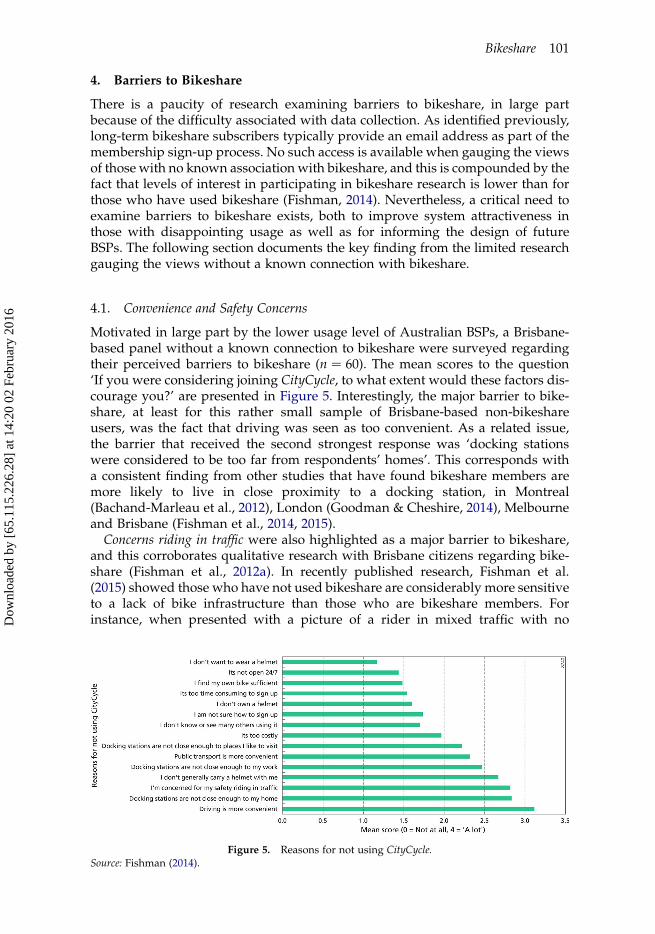
Motivated in large part by the lower usage level of Australian BSPs, a Brisbane-based panel without a known connection to bikeshare were surveyed regardingtheir perceived barriers to bikeshare (n ¼ 60). The mean scores to the question‘If you were considering joining CityCycle, to what extent would these factors dis-courage you?’ are presented in Figure 5. Interestingly, the major barrier to bike-share, at least for this rather small sample of Brisbane-based non-bikeshareusers, was the fact that driving was seen as too convenient. As a related issue,the barrier that received the second strongest response was ‘docking stationswere considered to be too far from respondents’ homes’. This corresponds witha consistent finding from other studies that have found bikeshare members aremore likely to live in close proximity to a docking station, in Montreal(Bachand-Marleau et al., 2012), London (Goodman & Cheshire, 2014), Melbourneand Brisbane (Fishman et al., 2014, 2015).
Concerns riding in traffic were also highlighted as a major barrier to bikeshare,and this corroborates qualitative research with Brisbane citizens regarding bike-share (Fishman et al., 2012a). In recently published research, Fishman et al.(2015) showed those who have not used bikeshare are considerably more sensitiveto a lack of bike infrastructure than those who are bikeshare members. Forinstance, when presented with a picture of a rider in mixed traffic with no
Figure 5. Reasons for not using CityCycle.Source: Fishman (2014).
Bikeshare 101
Dow
nloa
ded
by [
65.1
15.2
26.2
8] a
t 14:
20 0
2 Fe
brua
ry 2
016
bicycle infrastructure, 60% of non-BSP members said they felt ‘Very unsafe’, com-pared to about 40% for bikeshare members (Fishman et al., 2015). Consistent withthis finding, Faghih-Imani et al. (2014) found docking stations integrated with thesurrounding bicycle infrastructure network were busier.
4.2. Mandatory Helmet Legislation
Helmets have emerged as a contentious issue for bikeshare (Basch, Ethan, Rajan,Samayoa-Kozlowsky, & Basch, 2013). In jurisdictions in which helmet use is man-dated by law, such as Melbourne and Brisbane, helmets have prominently fea-tured in bikeshare commentary (Fishman, 2012; Queensland ParliamentaryCommittee, 2013), and have been implicated in the significantly lower usagelevels than other cities (Fishman et al., 2013; O’Brien, Cheshire, & Batty, 2014;Queensland Parliamentary Committee, 2013; Rissel, 2011; Traffix Group, 2012).Indeed Tel Aviv and Mexico City repealed their mandatory helmet law, as apre-emptive move to boost usage levels (Flegenheimer, 2013). It is interesting tonote, however, that in the results illustrated in Figure 5, drawn from a samplewith very low levels of cycling participation (of any kind), helmets did notfeature as a major barrier to bikeshare. A distillation of the limited literature onthis issue appears to suggest that for those who do not ride a bike, there areother, more important barriers to riding than mandatory helmet legislation(Fishman et al., 2015). For those that ride regularly, the requirement to carry ahelmet has been shown to have a negative effect on bikeshare (Alta Bike Share,2011; Alta Planning + Design, 2012; Fishman, 2014; Traffix Group, 2012). This issupported by what might be considered a naturalistic experiment (though theBSP operators did not call it as such), in which freely available helmets wereplaced on CityCycle bikes, and a significant increase in casual usage was recorded(Fishman et al., 2013), although this period coincided with the introduction of amore favourable pricing structure, it suggests increasing immediate access tohelmets at the point of departure may help reduce the barrier presented by man-datory helmet legislation.
In a customer satisfaction survey of CityCycle subscribers, one in three subscri-bers reported not wishing to re-subscribe (Roy Morgan Research, 2013), comparedto 11% for London bikeshare members (Transport for London, 2014). When askedwhy they will not be renewing their subscription, 11% cited mandatory helmetlaws as the main reason and a further 9% called for the removal of the helmetlaws (Roy Morgan Research, 2013). Members of Melbourne Bike Share and CityCycleboth reported using bikeshare less due to mandatory helmet legislation (Fishman& Schepers, 2014).
The lower than expected usage of CityCycle has prompted a ParliamentaryCommittee to recommend
a 24 month trial which exempts cyclists aged 16 years and over from themandatory helmet road use when riding in parks, on footpaths, andshared/cycle paths and on roads with a speed limit of 60km/h or less.(Queensland Parliamentary Committee, 2013, p. xvii)
Seattle launched a BSP known as Pronto in 2014 and users are required to complywith a pre-existing mandatory helmet law. According to the operators’ website,free helmets are available at docking stations. The feasibility study for Seattle’s
102 E. Fishman
Dow
nloa
ded
by [
65.1
15.2
26.2
8] a
t 14:
20 0
2 Fe
brua
ry 2
016
BSP estimated a 30% reduction in usage due to the mandatory helmet laws (AltaPlanning + Design, 2012), although it was not clear how this figure was deter-mined. Issues related to the voluntary use of helmets are discussed in Section 3.2.3.
4.3. Sign-Up Process
The speed and ease with which people are able to sign up to a BSP can have animpact on likelihood of using the programme. The vast majority of third-gener-ation BSPs allow prospective users to sign up on the spot, with a credit card.Where this is not the case, users and would-be users have reported the lack ofimmediate sign-up is a barrier to usage (Fishman et al., 2012a).
This section documents the experience of CityCycle, which is among the fewthird-generation BSPs in English-speaking countries not to offer automatedsign-up at docking stations.
The Brisbane City Council commissioned a survey of registered CityCycle users(Roy Morgan Research, 2013), emailed to 13 495 long- and short-term subscriberswith a response rate of 11.5%. The results showed that one in three CityCycle usersreport not wishing to re-subscribe, with the complex subscription process noted asone of the key reasons short-term subscribers are not repeat CityCycle users. More-over, the complex subscription process was highlighted by 54% of short-term localsubscribers as the main area requiring improvement, many of whom noted theywould not return as CityCycle users (Roy Morgan Research, 2013). The CityCycleexperience offers an important lesson for bikeshare planners. Users and would-be users value bikeshare’s spontaneity (Fishman et al., 2012a) and policiesshould seek to minimise hurdles associated with becoming bikeshare users.
In summary, the major barriers to bikeshare relate to a lack of convenience andcompetitive advantage with other modes, safety concerns and anything thatimpedes spontaneity. There is a critical paucity of research with large samplesof non-BSP members and this needs to be addressed in order to better understandhow bikeshare can be tailored to be more attractive to those who do not currentlyview it as a viable option. For a more detailed account of barriers to bikeshare,with an emphasis on the Australian context, readers are encouraged to seeFishman et al. (2014a).
5. Bikeshare: Evaluating the Impacts
There are a number of purported benefits of bikeshare, including travel timesaving, connection with public transport, health, air and noise pollution benefits(Shaheen et al., 2013). Added to these is the possibility that bikeshare may serveto normalise the image of cycling (Goodman et al., 2014). Implicit in many of thebenefits associated with bikeshare is an assumption that bikeshare is used toreplace trips previously made by car, yet the data suggest this is seldom thecase (Fishman et al., 2014; Midgley, 2011). This section examines the few studiesthat have evaluated the impacts of bikeshare, covering the impacts on car use,health and safety.
5.1. Car Use Reduction/Mode Substitution
A consistent theme to emerge from the literature on the mode bikeshare replaces(mode substitution) is that most of the trips are replacing trips formerly made by
Bikeshare 103
Dow
nloa
ded
by [
65.1
15.2
26.2
8] a
t 14:
20 0
2 Fe
brua
ry 2
016
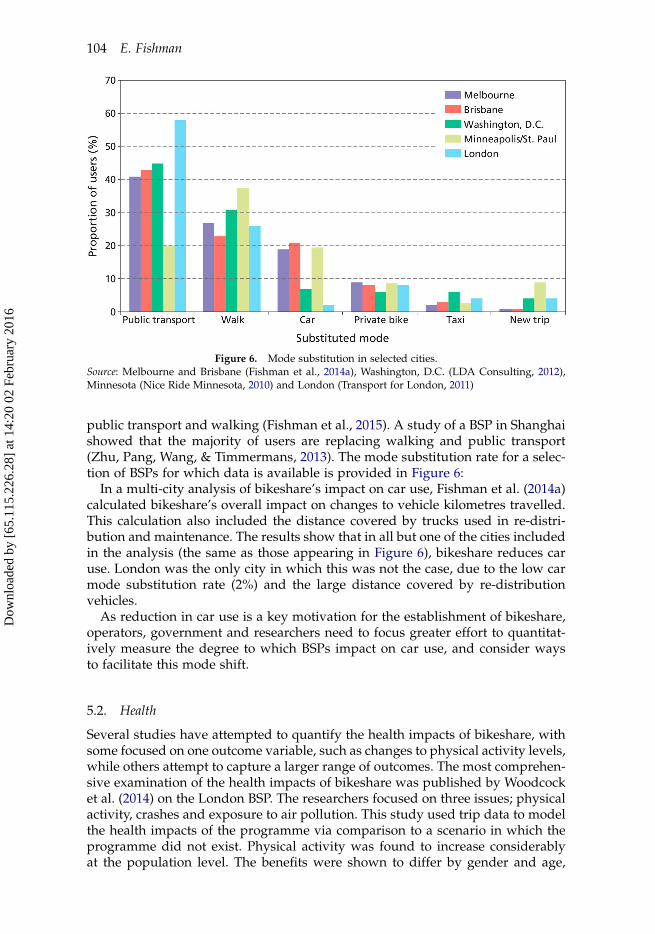
public transport and walking (Fishman et al., 2015). A study of a BSP in Shanghaishowed that the majority of users are replacing walking and public transport(Zhu, Pang, Wang, & Timmermans, 2013). The mode substitution rate for a selec-tion of BSPs for which data is available is provided in Figure 6:
In a multi-city analysis of bikeshare’s impact on car use, Fishman et al. (2014a)calculated bikeshare’s overall impact on changes to vehicle kilometres travelled.This calculation also included the distance covered by trucks used in re-distri-bution and maintenance. The results show that in all but one of the cities includedin the analysis (the same as those appearing in Figure 6), bikeshare reduces caruse. London was the only city in which this was not the case, due to the low carmode substitution rate (2%) and the large distance covered by re-distributionvehicles.
As reduction in car use is a key motivation for the establishment of bikeshare,operators, government and researchers need to focus greater effort to quantitat-ively measure the degree to which BSPs impact on car use, and consider waysto facilitate this mode shift.
5.2. Health
Several studies have attempted to quantify the health impacts of bikeshare, withsome focused on one outcome variable, such as changes to physical activity levels,while others attempt to capture a larger range of outcomes. The most comprehen-sive examination of the health impacts of bikeshare was published by Woodcocket al. (2014) on the London BSP. The researchers focused on three issues; physicalactivity, crashes and exposure to air pollution. This study used trip data to modelthe health impacts of the programme via comparison to a scenario in which theprogramme did not exist. Physical activity was found to increase considerablyat the population level. The benefits were shown to differ by gender and age,
Figure 6. Mode substitution in selected cities.Source: Melbourne and Brisbane (Fishman et al., 2014a), Washington, D.C. (LDA Consulting, 2012),Minnesota (Nice Ride Minnesota, 2010) and London (Transport for London, 2011)
104 E. Fishman
Dow
nloa
ded
by [
65.1
15.2
26.2
8] a
t 14:
20 0
2 Fe
brua
ry 2
016
with men’s major benefit coming from reductions in ischaemic heart disease,whereas women were more likely to benefit in terms of reductions in depression.In relation to crashes, the results of the study suggest that on balance, the pro-gramme delivers more benefit than harm, although the effects are not uniformfor all age groups or gender. Interestingly, the researchers found that morebenefit would be gained if users were older, as older people have fewer healthylife years to lose. Conversely, when a young person crashes, they have manymore healthy life years at risk. It is important to note, however, that an olderperson is less likely to fully recover from the same crash that involves ayounger person, that is, older people are more vulnerable (Li, Braver, & Chen,2003). When the researchers applied the general crash risk for all cycling incentral London, they found a negative health impact for women, due to thegreater fatality rate among female cyclists in London. In terms of air pollution,the study found that while cycling routes typically have slightly lower levels ofair pollution (PM2.5), the higher ventilation rate means that on balance, there islittle impact of the BSP on air pollution exposure (Woodcock et al., 2014).Overall, the researchers conclude that the greatest health benefit would comefrom seeing an increase in middle-aged and older people using the scheme.
In another study, Fuller, Gauvin, Morency, Kestens, and Drouin (2013) con-ducted a cross-sectional telephone survey with some 2500 individuals beforeand after the implementation of the BIXI BSP in Montreal, to determine the poten-tial mode shift and health benefit of the programme. Although the impacts weremodest, the authors were able to conclude that BIXI was associated with a shifttowards active transport.
In the first multi-city analysis of the physical activity impacts of bikeshare,Fishman, Washington, and Haworth (2014b) estimated changes in physicalactivity due to bikeshare in Melbourne, Brisbane, Washington, D.C., Londonand Minneapolis/St. Paul. The results suggest an average of 60% of bikesharetrips replace sedentary modes, but when bikeshare replaces walking, a netreduction in physical activity results. Overall, however, bikeshare was found tohave a positive impact of physical activity, leading to an additional 74 millionminutes of physical activity in London, through to 1.4 million minutes of physicalactivity in Minneapolis/St. Paul, for 2012 (Fishman et al., 2014b).
5.3. Road Traffic Injury and Bikeshare
Perceptions of safety (a lack of) have been established as a major issue for bicycleuse generally, in Australia (Fishman, Washington, & Haworth, 2012b), the UK(Horton, Rosen, & Cox, 2007) and the USA (Gardner, 2002). There is growing inter-est in the safety issues related to bikeshare, including a somewhat volatile debatethat straddles the academic and mainstream media, sparked in part by an articlepublished in the American Journal of Public Health (Graves et al., 2014). Graveset al. assessed hospital injury data from five US cities with BSPs and fivewithout, during a 24-month period before BSP implementation and also for a12-month period post implementation. The non-bikeshare cities essentiallyacted as a control. What the researchers found but failed to include in their discus-sion of the results was that there was a dramatic reduction in the total number ofhospital-recorded injuries in the bikeshare cities, post implementation. Figure 7uses data collected by Graves et al. (2014) to illustrate the reduction in recordedinjuries in bikeshare cities compared to a slight increase in control cities.
Bikeshare 105
Dow
nloa
ded
by [
65.1
15.2
26.2
8] a
t 14:
20 0
2 Fe
brua
ry 2
016
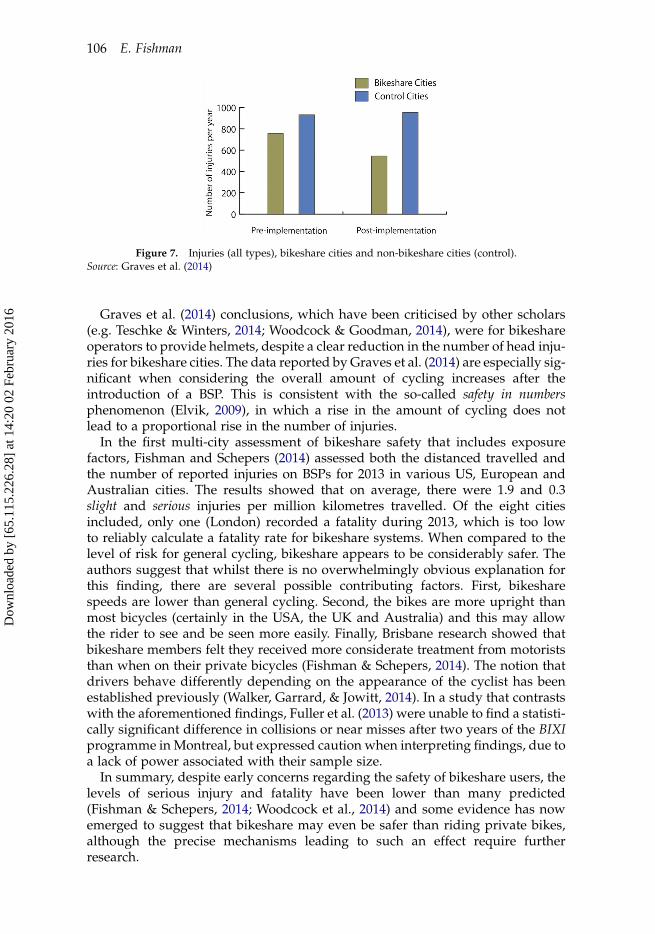
Graves et al. (2014) conclusions, which have been criticised by other scholars(e.g. Teschke & Winters, 2014; Woodcock & Goodman, 2014), were for bikeshareoperators to provide helmets, despite a clear reduction in the number of head inju-ries for bikeshare cities. The data reported by Graves et al. (2014) are especially sig-nificant when considering the overall amount of cycling increases after theintroduction of a BSP. This is consistent with the so-called safety in numbersphenomenon (Elvik, 2009), in which a rise in the amount of cycling does notlead to a proportional rise in the number of injuries.
In the first multi-city assessment of bikeshare safety that includes exposurefactors, Fishman and Schepers (2014) assessed both the distanced travelled andthe number of reported injuries on BSPs for 2013 in various US, European andAustralian cities. The results showed that on average, there were 1.9 and 0.3slight and serious injuries per million kilometres travelled. Of the eight citiesincluded, only one (London) recorded a fatality during 2013, which is too lowto reliably calculate a fatality rate for bikeshare systems. When compared to thelevel of risk for general cycling, bikeshare appears to be considerably safer. Theauthors suggest that whilst there is no overwhelmingly obvious explanation forthis finding, there are several possible contributing factors. First, bikesharespeeds are lower than general cycling. Second, the bikes are more upright thanmost bicycles (certainly in the USA, the UK and Australia) and this may allowthe rider to see and be seen more easily. Finally, Brisbane research showed thatbikeshare members felt they received more considerate treatment from motoriststhan when on their private bicycles (Fishman & Schepers, 2014). The notion thatdrivers behave differently depending on the appearance of the cyclist has beenestablished previously (Walker, Garrard, & Jowitt, 2014). In a study that contrastswith the aforementioned findings, Fuller et al. (2013) were unable to find a statisti-cally significant difference in collisions or near misses after two years of the BIXIprogramme in Montreal, but expressed caution when interpreting findings, due toa lack of power associated with their sample size.
In summary, despite early concerns regarding the safety of bikeshare users, thelevels of serious injury and fatality have been lower than many predicted(Fishman & Schepers, 2014; Woodcock et al., 2014) and some evidence has nowemerged to suggest that bikeshare may even be safer than riding private bikes,although the precise mechanisms leading to such an effect require furtherresearch.
Figure 7. Injuries (all types), bikeshare cities and non-bikeshare cities (control).Source: Graves et al. (2014)
106 E. Fishman
Dow
nloa
ded
by [
65.1
15.2
26.2
8] a
t 14:
20 0
2 Fe
brua
ry 2
016
6. Rebalancing
Rebalancing refers to bikeshare operators moving bicycles across the network, tomaintain a reasonable distribution across docking stations (Fishman, 2014). Theneed for rebalancing is caused when ‘tidal flows’ of bikeshare trips move fromor to certain areas of a city, such as from residential to commercial zones inmorning peak hour. This leads to some stations being completely full whileothers are empty, and this can lead to a lack of reliability for the user andreduced satisfaction (e.g. Transport for London, 2014), as well as significantcosts imposed on operators to manually redistribute the fleet (Fishman et al.,2014a). These twin issues have spurred a diverse range of investigations into effec-tive measures to improve fleet redistribution. Researchers have documented vari-ation between BSPs in different cities regarding the proportion of docking spotsthat are full or empty (O’Brien et al., 2014) and this may provide a basis uponwhich cities can begin to reduce the number of docking stations suffering fromdistribution issues. Rebalancing is a burgeoning sub-topic within bikeshareresearch. Some researchers have examined the factors associated with higherand lower levels of docking station activity (e.g. Faghih-Imani et al., 2014),finding that weather and the presence of restaurants have a predictable impactof station activity. Other researchers have also identified a relationship betweenweather and station activity (Rudloff & Lackner, 2013); however, inclementweather is much more likely to impact on casual users than members with a com-muting function. Other work has examined the impact of topography on stationactivity (e.g. Frade & Ribeiro, 2014; Jurdak, 2013). Parkes et al. (2013) suggest alter-ing the price to achieve rebalancing objectives may increasingly be employed as anoption to resolve fleet distribution issues.
Some have investigated the effectiveness of providing users with incentives toredistribute bikes, using complex mathematical modelling (e.g. Fricker & Gast,2014), although in the case of Fricker and Gast (2014) a lack of real-world data col-lection and the omission of factors known to influence docking station activity (e.g.density) reduces the reliability of the findings. Pfrommer et al. (2013) used historicaldata on the London BSP to model the effectiveness of employing trucks for redis-tribution as well as the impact of introducing price incentives to the user to mitigatefleet imbalance. The results suggest that while price incentives may be sufficienton weekends, usage patterns on weekdays are such that a combination of operatorand user redistribution is required to maintain an adequate level of service.
This brief introduction to research examining bikeshare redistribution hasidentified that this is a burgeoning area of research focused on tackling the twinproblems of user inconvenience and large operator costs, both of which areincurred when a system is unbalanced. The challenge will be to integrate user pre-ference and behaviour data with appropriate mathematical modelling techniquesto test the effectiveness of solutions, ideally with the cooperation of a bikeshareoperator. New insights from the field of behaviour economics (Thaler & Sunstein,2008) may enhance incentive opportunities for users to redistribute bicyclesagainst typical tidal flows.
7. Future Directions
Bikeshare has rapidly emerged as a transport option in an increasing number ofcities and as this trend continues, in parallel with technological advancement, a
Bikeshare 107
Dow
nloa
ded
by [
65.1
15.2
26.2
8] a
t 14:
20 0
2 Fe
brua
ry 2
016
number of future directions appear likely. This section briefly highlights somepossible directions for bikeshare in the future as well as emerging research priori-ties.
7.1. GPS and Dockless Systems
As GPS becomes increasingly affordable, it appears likely that in the near future,the benefits will outweigh the costs for BSP operators to install them across theirbikeshare fleet. Indeed Copenhagen’s new BSP, established in 2014, already has aGPS-embedded fleet as well as on-board tablet computer and Wi-Fi hotspot func-tionality. Some researchers (e.g. Parkes et al., 2013) have identified that GPS mayreduce the need for physical docks and at least one US-based operator (SocialBi-cycles) operates systems in which on-board solar-powered GPS replaces dockingstations. Apart from the obvious security benefits, GPS may assist bikeshare oper-ators by providing a ‘geo-fence’, detecting when a bicycle has moved outside agiven area (Parkes et al., 2013). Operators may also use GPS to assist with the chal-lenging task of re-distributing bicycles across their fleet via the use of real-timetracking. Users may benefit by enhanced real-time information on bicycle avail-ability. The automated data collection offered through GPS provides new oppor-tunities for data analysis, which may not only be useful for bikeshare operators tounderstand how their system is being used, but also from a wider transport plan-ning perspective. Openly available GeoJSON data files may assist governmentsplan and evaluate bicycle route usage and effectiveness. These geographic datasets will help build on the impressive work that has begun using start and enddocking station locations provided by non-GPS1 BSPs (see e.g. Beecham &Wood, 2014; Zaltz Austwick et al., 2013).
7.2. E-bikes and Bikeshare
The growth of bikeshare noted earlier has coincided with a similarly rapid growthin e-bike performance, affordability and usage. In recent years a number of citieshave launched BSPs that offer electric assistance, known as pedelecs2 (e-bike-share). These cities include the European capitals of Copenhagen (n ¼ 250, with1860 planned by mid-2015) (Mulligan, 2014, GoBike Numbers: Personal com-munication) and Madrid with 1560 bicycles (BiciMAD, 2014), as well as ahandful of small Italian cities (Meddin, E-bikes and bikeshare: Personal communi-cation, October 13, 2014). There are currently over 14 e-BSPs in Italy as well as onein Stuttgart and at least two in Japan (Meddin, E-bikes and bikeshare: Personalcommunication, October 13, 2014). Barcelona and Milan both plan to introducee-bikeshare as part of their existing systems in 2015 (Meddin, 2014, E-bikes andbikeshare: Personal communication, October 8). A university-based e-BSP hasbeen trialled in the USA (Langford, Cherry, Yoon, Worley, & Smith, 2013).
E-bikeshare offers the potential to increase the attractiveness of bikeshare tothose who may not have previously seen it as an option. Longer trips, challengingtopography, excessive heat and other factors associated with physical exertion canact as barriers to transport cycling generally (Heinen, van Wee, & Maat, 2010). Fur-thermore, many bikeshare cities have experienced re-balancing issues associatedwith the city’s topography. It is typical for users to ride downhill and show a reluc-tance to return bicycles to stations located at a higher elevation (Jurdak, 2013). E-bikes may assist in reducing this flow imbalance. Some cities (e.g. Brisbane) have
108 E. Fishman
Dow
nloa
ded
by [
65.1
15.2
26.2
8] a
t 14:
20 0
2 Fe
brua
ry 2
016

avoided placing docking stations in hilly suburbs, on the assumption that it willcause redistribution issues. E-bikeshare may therefore assist both users as wellas bikeshare operators and may be especially applicable in hilly, hot or dispersedcities.
7.3. Future Research Priorities
A number of critical bikeshare research priorities are evident from this review. Theneed to develop more efficient methods of fleet rebalancing presents researcherswith a complex analytical challenge. The data captured by modern bikesharesystems have already started to offer researchers a platform to embark on thischallenge. This work is still in its embryonic stages and needs to better utilisethe principles of behavioural economics, to incentivise users to rebalance, lower-ing the need for fleet rebalancing by operators.
There is a paucity of research with large numbers of people who are not bike-share users. Such studies are of critical importance to bikeshare user growth, par-ticularly in underused systems. The reaction of drivers to bikeshare users isanother little researched area, but early investigations indicate that drivers mayreact differently to bikeshare riders than general cyclists, but more work applyingquantitative methods (e.g. ultrasonic measurement of overtaking distance) isrequired to better understand whether awareness and behaviour of drivers dodiffer in the presence of a bikeshare user and, if so, why. Such research mayhave important implications for road safety. Researchers also need to developstandard, justifiable tools to measure the impacts of bikeshare, in terms ofclimate change, congestion, air and noise quality, as well as health and timesavings. These are the purported benefits of bikeshare, yet little has been estab-lished to create a comparable methodology for quantifying these benefits. Asnoted in this review, no country has the bikeshare scale of China, yet researchactivity does not reflect this. A much greater focus on Chinese bikeshare needsto occur, as the sheer scale of their systems may provide important insights notjust for China but for bikeshare generally. Finally, an international bikeshareresearch and data centre, supported by governments, universities and the bike-share industry, would help coordinate research leading to improved researchand transport outcomes.
8. Conclusions
Few predicted bikeshare’s rapid rise. The research community has been quick toexamine the spectrum of issues associated with bikeshare, including user prefer-ences and demographics, usage rates and geospatial visualisations, safety, redis-tribution options and technological innovation.
The key themes emerging from this review of recent literature are threefold.First, bikeshare users have demographic characteristics that differ from thegeneral population. Users are more likely to be White (in the USA and Londonat least), male, have higher average incomes and education and more likely tolive and work in the inner city, close to or within the BSP catchment area.Second, the literature consistently finds that convenience is the major factor motiv-ating bikeshare users to sign up and corroborates with the concept of perceived use-fulness found by other researchers (e.g. Wolf & Seebauer, 2014 in their examinationof e-bike ownership). This finding can be used by those evaluating existing or
Bikeshare 109
Dow
nloa
ded
by [
65.1
15.2
26.2
8] a
t 14:
20 0
2 Fe
brua
ry 2
016
planning new BSPs; ensuring the value proposition provided by bikeshare is com-petitive with other transport options can enhance ridership. Third, bikeshare’sperformance in replacing motor vehicle trips has been less than most expectedand future efforts to transfer trips previously done by car to bikeshare will helpunderpin the potential benefits of bikeshare.
Given the speed with which bikeshare literature has developed over the last twoyears, not every paper and topic has been covered in this review. Several impor-tant topics have been omitted and these include bikeshare and public transportintegration, different models of provision (e.g. advertising/sponsorship vs. tax-payer funded) as well as big data analysis and geospatial visualisations(covered in a separate article of this Special Issue).
Disclosure statement
No potential conflict of interest was reported by the author.
Notes
1. These typically use Radio Frequency ID tags to log bikes leaving and returning to docking stations.
2. Pedelecs offer electrical assistance only when the rider is pedaling, with a cut-off after a certainspeed is reached, typically no more than 25 km/h.
References
Ahmed, F., Rose, G., & Jacob, C. (2010). Impact of weather on commuter cyclist behaviour and implications forclimate change adaptation. Paper presented at the Australasian Transport Research Forum, Canberra.
Alta Bike Share. (2011). Melbourne Bike Share survey. Melbourne: Author.Alta Planning + Design. (2012). King County bike share business plan. Prepared for the bike share partner-
ship Seattle. Retrieved from http://pugetsoundbikeshare.org/wp-content/uploads/2012/07/KCBS_Business_Plan_FINAL.pdf
Bachand-Marleau, J., Lee, B. H. Y., & El-Geneidy, A. M. (2012). Better understanding of factors influen-cing likelihood of using shared bicycle systems and frequency of use. Transportation Research Record:Journal of the Transportation Research Board, 2314, 66–71. doi:10.3141/2314–09
Basch, C. H., Ethan, D., Rajan, S., Samayoa-Kozlowsky, S., & Basch, C. E. (2013). Helmet use amongusers of the Citi bike bicycle-sharing program: A pilot study in New York City. Journal of CommunityHealth, 39(3), 503–507. doi:10.1007/s10900-013-9785-7
Basch, C. H., Zagnit, E. A., Rajan, S., Ethan, D., & Basch, C. E. (2014). Helmet use among cyclists inNew York City. Journal of Community Health, 39(5), 956–958. doi:10.1007/s10900-014-9836-8
Beecham, R., & Wood, J. (2014). Characterising group-cycling journeys using interactive graphics.Transportation Research Part C: Emerging Technologies. doi:10.1016/j.trc.2014.03.007
BiciMAD. (2014). What Is BiciMAD. Retrieved October 8, 2014, from http://www.bicimad.com/que.html
Buck, D., Buehler, R., Happ, P., Rawls, B., Chung, P., & Borecki, N. (2013). Are bikeshare users differentfrom regular cyclists? Transportation Research Record: Journal of the Transportation Research Board,2387(1), 112–119.
Corcoran, J., & Li, T. (2014). Spatial analytical approaches in public bicycle sharing programs. Journal of
Transport Geography. doi:10.1016/j.jtrangeo.2014.09.005Corcoran, J., Li, T., Rohde, D., Charles-Edwards, E., & Mateo-Babiano, D. (2014). Spatio-temporal pat-
terns of a public bicycle sharing program: The effect of weather and calendar events. Journal of Trans-
port Geography. doi:10.1016/j.jtrangeo.2014.09.003Davis, L. S. (2014). Rolling along the last mile: Bike-sharing programs blossom nationwide. Planning,
80(5), 10–16.DeMaio, P. (2009). Bike-sharing: History, impacts, models of provision, & future. Journal of Public Trans-
portation, 12(4), 41–56.
110 E. Fishman
Dow
nloa
ded
by [
65.1
15.2
26.2
8] a
t 14:
20 0
2 Fe
brua
ry 2
016
Elvik, R. (2009). The non-linearity of risk and the promotion of environmentally sustainable transport.Accident Analysis & Prevention, 41(4), 849–855.
Faghih-Imani, A., Eluru, N., El-Geneidy, A. M., Rabbat, M., & Haq, U. (2014). How land-use and urbanform impact bicycle flows: Evidence from the bicycle-sharing system (BIXI) in Montreal. Journal of
Transport Geography, 41, 306–314.Fischer, C. M., Sanchez, C. E., Pittman, M., Milzman, D., Volz, K. A., Huang, H., . . . Sanchez, L. D.
(2012). Prevalence of bicycle helmet use by users of public bikeshare programs. Annals of Emergency
Medicine, 60(2), 228–231.Fishman, E. (2012). Fixing Australian bike share goes beyond helmet laws. Retrieved June 26, 2013, from
https://theconversation.edu.au/fixing-australian-bike-share-goes-beyond-helmet-laws-10229Fishman, E. (2014). Bikeshare: Barriers, facilitators and impacts on car use (PhD thesis by publication).
Queensland University of Technology, Brisbane.Fishman, E., & Brennan. (2010). Oil vulnerability in Melbourne. Melbourne: Institute for Sensible Trans-
port.Fishman, E., & Schepers, J. P. (2014). Global bike share: What the data tells us about safety. Paper presented at
the International Cycling Safety Conference, Goteborg, Sweden.Fishman, E., Washington, S., & Haworth, N. (2012a). Barriers and facilitators to public bicycle scheme
use: A qualitative approach. Transportation Research Part F — Traffic Psychology and Behaviour, 15(6),686–698.
Fishman, E., Washington, S., & Haworth, N. (2012b). Understanding the fear of bicycle riding in Aus-tralia. Journal of the Australasian College of Road Safety, 23(3), 19–27.
Fishman, E., Washington, S., & Haworth, N. (2013). Bike share: A synthesis of the literature. Transport
Reviews, 33(2), 148–165. doi:10.1080/01441647.2013.775612Fishman, E., Washington, S., & Haworth, N. (2014a). Bike share’s impact on car use: Evidence from the
United States, Great Britain, and Australia. Transportation Research Part D: Transport & Environment,31(7). doi:10.1016/j.trd.2014.05.013
Fishman, E., Washington, S., & Haworth, N. (2014b). Bike share’s impact on physical activity: Evidencefrom the United States, Great Britain, and Australia. Journal of Transport & Health. doi:10.1016/j.jth.2015.03.004
Fishman, E., Washington, S., Haworth, N., & Mazzei, A. (2014). Barriers to bikesharing: An analysisfrom Melbourne and Brisbane. Journal of Transport Geography, 41, 325–337.
Fishman, E., Washington, S., Haworth, N., & Watson, A. (2015). Factors influencing bike share member-ship: An analysis of Melbourne and Brisbane. Transportation Research Part A, 71, 17–30.
Flegenheimer, M. (2013). Bike-share system for New York is built with ideas from around the world.New York Times. Retrieved from http://www.nytimes.com/2013/05/22/nyregion/a-bike-share-system-for-new-york-built-from-ideas-around-the-world.html?_r=1&
Frade, I., & Ribeiro, A. (2014). Bicycle sharing systems demand. Procedia — Social and Behavioral Sciences,111, 518–527.
Fricker, C., & Gast, N. (2014). Incentives and redistribution in homogeneous bike-sharing systems withstations of finite capacity. EURO Journal on Transportation and Logistics, 1–31. doi:10.1007/s13676-014-0053-5
Fuller, D., Gauvin, L., Morency, P., Kestens, Y., & Drouin, L. (2013). The impact of implementing a publicbicycle share program on the likelihood of collisions and near misses in Montreal, Canada. Preventive
Medicine, 57(6), 920–924.Gardner, G. (2002). The trends that are shaping our future. New York, NY: W.W. Norton.Goodman, A., & Cheshire, J. (2014). Inequalities in the London bicycle sharing system revisited:
Impacts of extending the scheme to poorer areas but then doubling prices. Journal of Transport Geogra-phy, 41, 272–279. doi:10.1016/j.jtrangeo.2014.04.004
Goodman, A., Green, J., & Woodcock, J. (2014). The role of bicycle sharing systems in normalising theimage of cycling: An observational study of London cyclists. Journal of Transport & Health, 1(1), 5–8.
Goodyear, S. (2013). Bike-share is key to closing the cycling gender gap. The Atlantic Monthly. Retrievedfrom http://www.theatlanticcities.com/commute/2013/08/bike-share-may-be-one-key-closing-cycling-gender-gap/6580/
Graves, J. M., Pless, B., Moore, L., Nathens, A. B., Hunte, G., & Rivara, F. P. (2014). Public bicycle shareprograms and head injuries. American Journal of Public Health, e1–e6. doi:10.2105/AJPH.2014.302012
Handy, S., van Wee, B., & Kroesen, M. (2014). Promoting cycling for transport: Research needs and chal-lenges. Transport Reviews, 34(1), 4–24.
Harms, L., Bertolini, L., & Brommelstroet, M. (2013). Social and spatial differentiation of bicycle use patterns
in the Netherlands. Paper presented at the 13th WCTR, Rio de Janeiro, Brazil.
Bikeshare 111
Dow
nloa
ded
by [
65.1
15.2
26.2
8] a
t 14:
20 0
2 Fe
brua
ry 2
016
Heinen, E., van Wee, B., & Maat, K. (2010). Commuting by bicycle: An overview of the literature. Trans-port Reviews, 30(1), 59–96. doi:10.1080/01441640903187001
Horton, D., Rosen, P., & Cox, P. (2007). Cycling and society. Farnham: Ashgate.Johnson, M., Charlton, J., & Oxley, J. (2010). The application of a naturalistic driving method to inves-
tigate on-road cyclist behaviour: A feasibility study. Road & Transport Research: A Journal of Australianand New Zealand Research and Practice, 19(2), 32–41.
Jurdak, R. (2013). The impact of cost and network topology on urban mobility: A study of public bicycleusage in 2 U.S. cities. PLoS ONE, 8(11), e79396.
Langford, B. C., Cherry, C., Yoon, T., Worley, S., & Smith, D. (2013). North America’s first E-bikeshare.Transportation Research Record: Journal of the Transportation Research Board, 2387(1), 120–128.
LDA Consulting. (2012). Capital bikeshare 2011 member survey report. Washington, DC: Author.LDA Consulting. (2013). 2013 Capital bikeshare member survey report. Washington, DC: Commissioned
by Capital Bikeshare. Retrieved from http://capitalbikeshare.com/assets/pdf/CABI-2013SurveyReport.pdf
Lewis, T. (2011). Has London’s cycle hire scheme been a capital idea? The Guardian. Retrievedfrom http://www.guardian.co.uk/uk/bike-blog/2011/jul/10/boris-bikes-hire-scheme-london?commentpage=all — start-of-comments
Li, G., Braver, E. R., & Chen, L. H. (2003). Fragility versus excessive crash involvement as determinantsof high death rates per vehicle-mile of travel among older drivers. Accident Analysis and Prevention,35(2), 227–235.
Meddin, R. (2014). Bikeshare cities 1998–2013: Dataset provided to author.Meddin, R., & DeMaio, P. (2015). The bike-sharing world map. Retrieved January 26, 2014, from http://
www.bikesharingworld.comMidgley, P. (2011). Bicycle-sharing schemes: Enhancing sustainable mobility in urban areas. New York, NY:
United Nations. Retrieved from http://www.un.org/esa/dsd/resources/res_pdfs/csd-19/Background-Paper8-P.Midgley-Bicycle.pdf
Murphy, E., & Usher, J. (2015). The role of bicycle-sharing in the city: Analysis of the Irish experience.International Journal of Sustainable Transportation, 9(2), 116–125. doi:10.1080/15568318.2012.748855
Nice Ride Minnesota. (2010). Nice Ride Minnesota Survey November 2010. Retrieved June 20, 2011, fromhttp://appv3.sgizmo.com/reportsview/?key=102593-416326-6d13ea0276ea0822c9f59f4411b6c779
O’Brien, O. (2014). Bicycle sharing systems — global trends in size (Working Papers Series). London: UCLCentre for Advanced Spatial Analysis. Retrieved from http://www.bartlett.ucl.ac.uk/casa/pdf/paper196.pdf
O’Brien, O., Cheshire, J., & Batty, M. (2014). Mining bicycle sharing data for generating insights intosustainable transport systems. Journal of Transport Geography, 34, 262–273. doi:10.1016/j.jtrangeo.2013.06.007
Office of National Statistics. (2014). National statistics from United Kingdom Government. Retrievedfrom https://http://www.gov.uk/government/statistics/announcements
Ogilvie, D., & Goodman, A. (2012). Inequities in usage of a public bicycle sharing scheme: Socio-demo-graphic predictors of uptake and usage of the London (UK) cycle hire scheme. Preventive Medicine,55(1), 40–45. doi:10.1016/j.ypmed.2012.05.002
Parkes, S. D., Marsden, G., Shaheen, S. A., & Cohen, A. P. (2013). Understanding the diffusion of publicbikesharing systems: Evidence from Europe and North America. Journal of Transport Geography, 31,94–103.
Pfrommer, J., Warrington, J., Schildbach, G., & Morari, M. (2013). Dynamic vehicle redistribution andonline price incentives in shared mobility systems. arXiv preprint arXiv:1304.3949.
Pucher, J., Greaves, S., & Garrard, J. (2010). Cycling down under: A comparative analysis of bicyclingtrends and policies in Sydney and Melbourne. Journal of Transport Geography, 19(2), 332–345.
Pucher, J. E., & Buehler, R. E. (2012). City cycling. Cambridge, MA: MIT Press.Queensland Parliamentary Committee. (2013). A new direction for cycling in Queensland. Brisbane:
Queensland Government. Retrieved from http://www.parliament.qld.gov.au/documents/tableOffice/TabledPapers/2013/5413T4163.pdf
Rissel, C. (2011). Have helmet laws put the skids on Australia’s bike share scheme? Retrieved from http://theconversation.com/have-helmet-laws-put-the-skids-on-australias-bike-share-scheme-2703
Roy Morgan Research. (2013). Brisbane City Council citycycle customer satisfaction research. Brisbane:Commissioned by Brisbane City Council.
Rudloff, C., & Lackner, B. (2013). Modeling demand for bicycle sharing system–neighboring stations as asource for demand and a reason for structural breaks. Paper presented at the Transportation ResearchBoard Annual Meeting 2013, Washington, DC.
112 E. Fishman
Dow
nloa
ded
by [
65.1
15.2
26.2
8] a
t 14:
20 0
2 Fe
brua
ry 2
016
Shaheen, S., Cohen, A. P., & Martin, E. W. (2013). Public bikesharing in North America: Early operatorunderstanding and emerging trends. Transportation Research Record: Journal of the Transportation
Research Board, 2387, 83–92. doi:10.3141/2387-10Shaheen, S., & Guzman, S. (2011). Worldwide bikesharing. Access Magazine, University of California.Shaheen, S., Guzman, S., & Zhang, H. (2010). Bikesharing in Europe, the Americas, and Asia. Transpor-
tation Research Record: Journal of the Transportation Research Board, 2143, 159–167. doi:10.3141/2143-20Teschke, K., & Winters, M. (2014). Letter to Editor, American Journal of Public Health. Retrieved from
http://cyclingincities-spph.sites.olt.ubc.ca/files/2014/06/Graves-AJPH-as-submitted.pdfThaler, R. H., & Sunstein, C. R. (2008). Nudge: Improving decisions about health, wealth, and happiness. Cam-
bridge, MA: Yale University Press.Traffix Group. (2012). Evaluation of Melbourne bike share. Melbourne: Traffix Group for VicRoads.Transport for London. (2011). Barclays Cycle Hire customer satisfaction and usage — wave 2. London:
London.Transport for London. (2014). Barclays Cycle Hire customer satisfaction and usage survey: Members
only. London: London. Retrieved from http://www.tfl.gov.uk/cdn/static/cms/documents/barclays-cycle-hire-css-and-usage-members-q3-2013-14.pdf
United States Census Bureau. (2013). State and County QuickFacts. Retrieved June 13, 2013, from http://quickfacts.census.gov/qfd/states/11000.html
Vogel, M., Hamon, R., Lozenguez, G., Merchez, L., Abry, P., Barnier, J., . . . Robardet, C. (2014). Frombicycle sharing system movements to users: A typology of Velo’v cyclists in Lyon based on large-scale behavioural dataset. Journal of Transport Geography, 41, 280–291. doi:10.1016/j.jtrangeo.2014.07.005
Walker, I., Garrard, I., & Jowitt, F. (2014). The influence of a bicycle commuter’s appearance on drivers’overtaking proximities: An on-road test of bicyclist stereotypes, high-visibility clothing and safetyaids in the United Kingdom. Accident Analysis & Prevention, 64, 69–77. doi:10.1016/j.aap.2013.11.007
Wolf, A., & Seebauer, S. (2014). Technology adoption of electric bicycles: A survey among early adop-ters. Transportation Research Part A: Policy and Practice, 69, 196–211. doi:10.1016/j.tra.2014.08.007
Woodcock, J., & Goodman, A. (2014). Hard evidence: Do bikeshare schemes lead to more head injuries amongcyclists? Retrieved from http://theconversation.com/hard-evidence-do-bikeshare-schemes-lead-to-more-head-injuries-among-cyclists-30135
Woodcock, J., Tainio, M., Cheshire, J., O’Brien, O., & Goodman, A. (2014). Health effects of the Londonbicycle sharing system: Health impact modelling study. BMJ, 348. doi:10.1136/bmj.g425
Zaltz Austwick, M., O’Brien, O., Strano, E., & Viana, M. (2013). The structure of spatial networks andcommunities in bicycle sharing systems. PLoS ONE, 8(9), e74685.
Zhu, W., Pang, Y., Wang, D., & Timmermans, H. (2013). Travel behavior change after the introduction of
public bicycle systems: Case study in Minhang District, Shanghai. Paper presented at the TransportationResearch Board, 92nd Annual Meeting, Washington, DC.
Bikeshare 113
Dow
nloa
ded
by [
65.1
15.2
26.2
8] a
t 14:
20 0
2 Fe
brua
ry 2
016
Recommended


![Vol. 1947 64] I Recent Literature 475](https://img.dokumen.tips/doc/110x75/61dda5e58c1ab377a0081d14/vol-1947-64-i-recent-literature-475.jpg)