
Bank of IrelandCredit PresentationJune 2018
2018


Bank of Ireland Overview
2
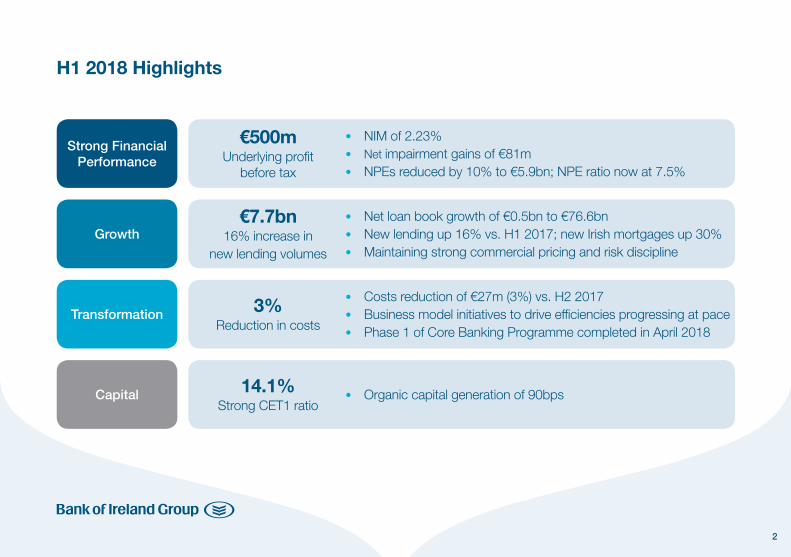
H1 2018 Highlights
Strong Financial Performance
• NIM of 2.23%• Net impairment gains of €81m• NPEs reduced by 10% to €5.9bn; NPE ratio now at 7.5%
€500mUnderlying profit
before tax
Growth
Transformation
Capital
• Net loan book growth of €0.5bn to €76.6bn• New lending up 16% vs. H1 2017; new Irish mortgages up 30%• Maintaining strong commercial pricing and risk discipline
• Costs reduction of €27m (3%) vs. H2 2017• Business model initiatives to drive efficiencies progressing at pace• Phase 1 of Core Banking Programme completed in April 2018
• Organic capital generation of 90bps
€7.7bn16% increase in
new lending volumes
3%Reduction in costs
14.1%Strong CET1 ratio
3
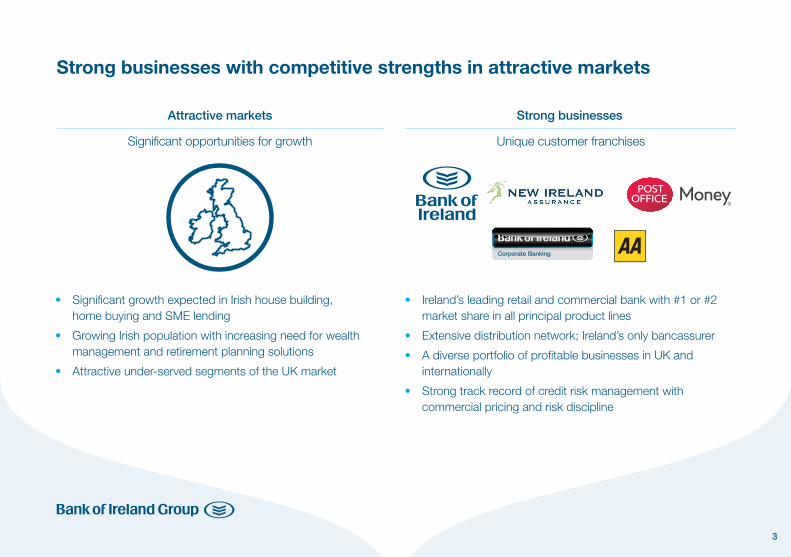
Strong businesses with competitive strengths in attractive markets
• Significant growth expected in Irish house building, home buying and SME lending
• Growing Irish population with increasing need for wealth management and retirement planning solutions
• Attractive under-served segments of the UK market
• Ireland’s leading retail and commercial bank with #1 or #2 market share in all principal product lines
• Extensive distribution network; Ireland’s only bancassurer
• A diverse portfolio of profitable businesses in UK and internationally
• Strong track record of credit risk management with commercial pricing and risk discipline
Attractive markets Strong businesses
Corporate Banking
Significant opportunities for growth Unique customer franchises
4
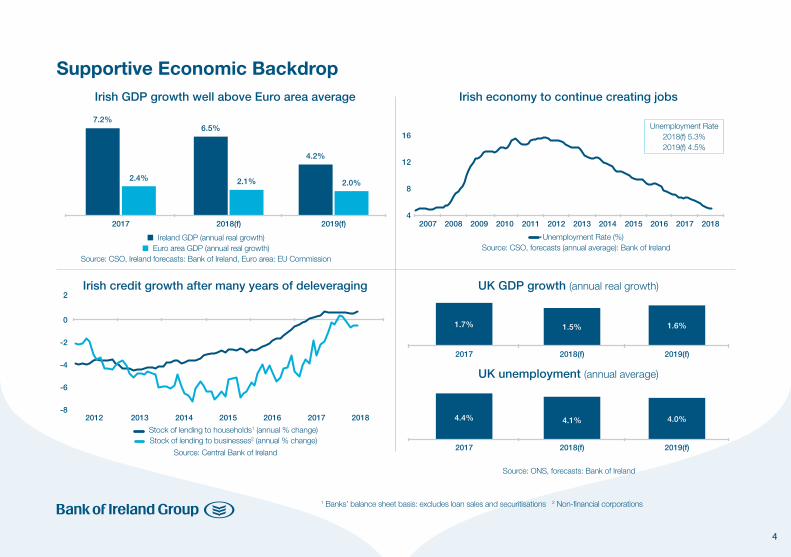
Irish GDP growth well above Euro area average Irish economy to continue creating jobs
Irish credit growth after many years of deleveraging UK GDP growth (annual real growth)
UK unemployment (annual average)
Supportive Economic Backdrop
2017
2017
2017
2018(f)
2018(f)
2018(f)
2019(f)
2019(f)
2019(f)
2015 2016 2017 20182012 2013 2014
n Ireland GDP (annual real growth)n Euro area GDP (annual real growth)
Source: CSO, Ireland forecasts: Bank of Ireland, Euro area: EU Commission
Stock of lending to households1 (annual % change) Stock of lending to businesses2 (annual % change)
Source: Central Bank of Ireland
Source: ONS, forecasts: Bank of Ireland
2007 2011 20152009 2013 20172008 2012 20162010 2014 2018
Unemployment Rate (%)Source: CSO, forecasts (annual average): Bank of Ireland
-4
4
12
-6
-8
-2
8
16
2
0
1 Banks’ balance sheet basis: excludes loan sales and securitisations 2 Non-financial corporations
7.2%6.5%
2.1%2.4%2.0%
4.2%
Unemployment Rate2018(f) 5.3%2019(f) 4.5%
1.7%
4.4%
1.5%
4.1%
1.6%
4.0%
5
Serve Customers Brilliantly
Grow Sustainable Profits
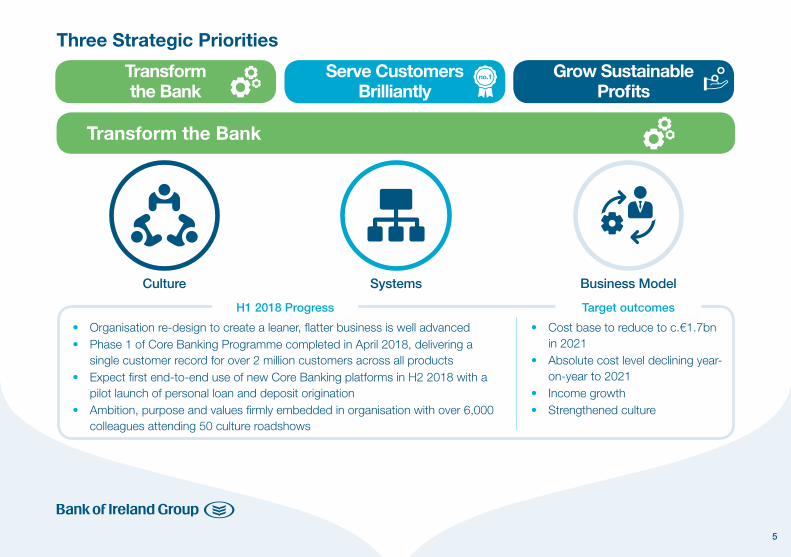
Transform the Bank
Three Strategic Priorities
Transform the Bank
Culture Systems Business Model
H1 2018 Progress
• Organisation re-design to create a leaner, flatter business is well advanced• Phase 1 of Core Banking Programme completed in April 2018, delivering a
single customer record for over 2 million customers across all products• Expect first end-to-end use of new Core Banking platforms in H2 2018 with a
pilot launch of personal loan and deposit origination• Ambition, purpose and values firmly embedded in organisation with over 6,000
colleagues attending 50 culture roadshows
• Cost base to reduce to c.€1.7bn in 2021
• Absolute cost level declining year-on-year to 2021
• Income growth• Strengthened culture
Target outcomes
6
H1 2018 Progress
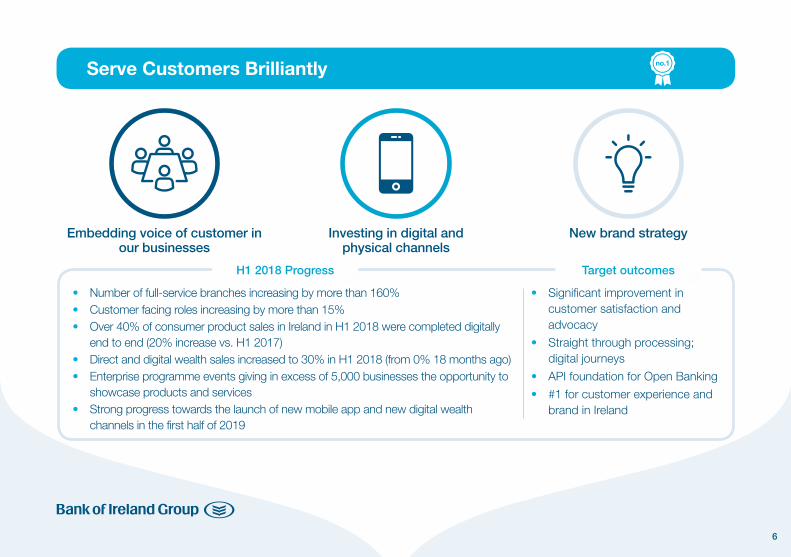
• Number of full-service branches increasing by more than 160%• Customer facing roles increasing by more than 15%• Over 40% of consumer product sales in Ireland in H1 2018 were completed digitally
end to end (20% increase vs. H1 2017)• Direct and digital wealth sales increased to 30% in H1 2018 (from 0% 18 months ago)• Enterprise programme events giving in excess of 5,000 businesses the opportunity to
showcase products and services• Strong progress towards the launch of new mobile app and new digital wealth
channels in the first half of 2019
• Significant improvement in customer satisfaction and advocacy
• Straight through processing; digital journeys
• API foundation for Open Banking
• #1 for customer experience and brand in Ireland
Target outcomes
Serve Customers Brilliantly
Embedding voice of customer in our businesses
Investing in digital and physical channels
New brand strategy
7
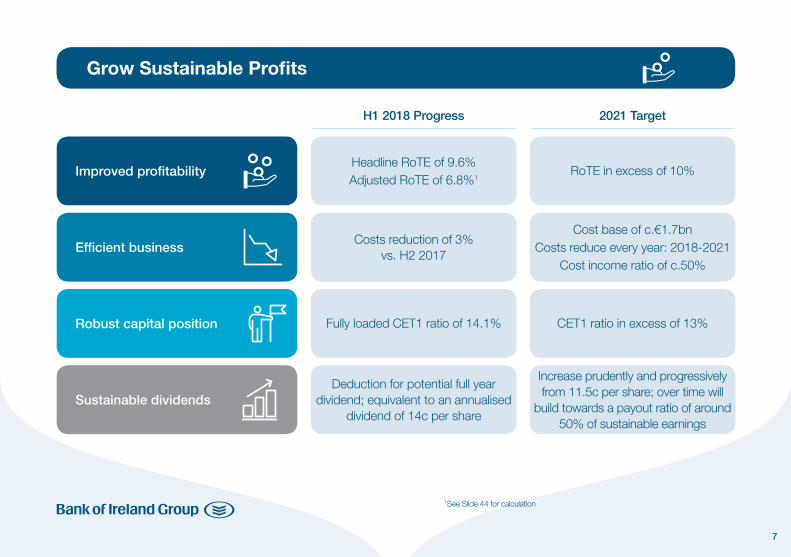
Grow Sustainable Profits
Improved profitability
Efficient business
Robust capital position
Sustainable dividends
H1 2018 Progress 2021 Target
Headline RoTE of 9.6%Adjusted RoTE of 6.8%1
Costs reduction of 3% vs. H2 2017
Fully loaded CET1 ratio of 14.1%
Deduction for potential full year dividend; equivalent to an annualised
dividend of 14c per share
RoTE in excess of 10%
Cost base of c.€1.7bnCosts reduce every year: 2018-2021
Cost income ratio of c.50%
CET1 ratio in excess of 13%
Increase prudently and progressively from 11.5c per share; over time will
build towards a payout ratio of around 50% of sustainable earnings
1See Slide 44 for calculation
Operating Performance
9
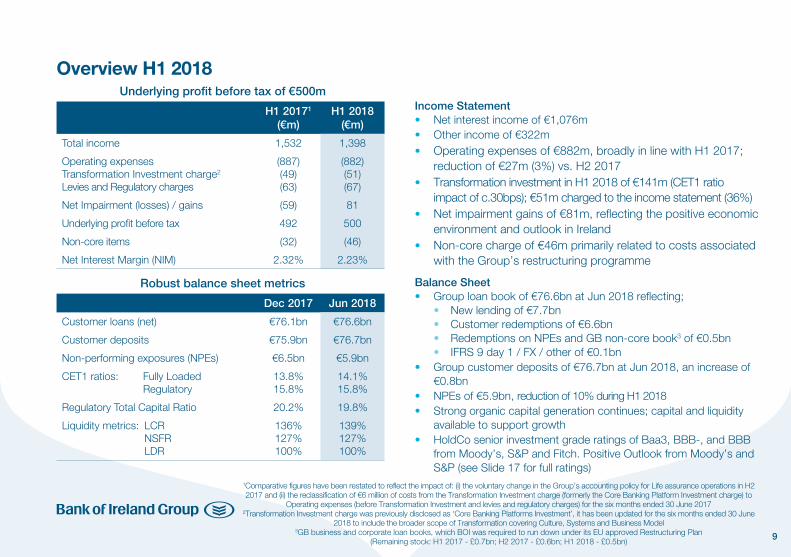
Income Statement• Net interest income of €1,076m• Other income of €322m• Operating expenses of €882m, broadly in line with H1 2017;
reduction of €27m (3%) vs. H2 2017 • Transformation investment in H1 2018 of €141m (CET1 ratio
impact of c.30bps); €51m charged to the income statement (36%)• Net impairment gains of €81m, reflecting the positive economic
environment and outlook in Ireland• Non-core charge of €46m primarily related to costs associated
with the Group’s restructuring programme
Balance Sheet• Group loan book of €76.6bn at Jun 2018 reflecting; • New lending of €7.7bn • Customer redemptions of €6.6bn • Redemptions on NPEs and GB non-core book3 of €0.5bn • IFRS 9 day 1 / FX / other of €0.1bn• Group customer deposits of €76.7bn at Jun 2018, an increase of
€0.8bn• NPEs of €5.9bn, reduction of 10% during H1 2018• Strong organic capital generation continues; capital and liquidity
available to support growth• HoldCo senior investment grade ratings of Baa3, BBB-, and BBB
from Moody’s, S&P and Fitch. Positive Outlook from Moody’s and S&P (see Slide 17 for full ratings)
Underlying profit before tax of €500m
Robust balance sheet metrics
1Comparative figures have been restated to reflect the impact of: (i) the voluntary change in the Group’s accounting policy for Life assurance operations in H2 2017 and (ii) the reclassification of €6 million of costs from the Transformation Investment charge (formerly the Core Banking Platform Investment charge) to
Operating expenses (before Transformation Investment and levies and regulatory charges) for the six months ended 30 June 20172Transformation Investment charge was previously disclosed as ‘Core Banking Platforms Investment’, it has been updated for the six months ended 30 June
2018 to include the broader scope of Transformation covering Culture, Systems and Business Model3GB business and corporate loan books, which BOI was required to run down under its EU approved Restructuring Plan
(Remaining stock: H1 2017 - £0.7bn; H2 2017 - £0.6bn; H1 2018 - £0.5bn)
Overview H1 2018
H1 20171
(€m)H1 2018
(€m)
Total income 1,532 1,398
Operating expensesTransformation Investment charge2
Levies and Regulatory charges
(887)(49)(63)
(882)(51)(67)
Net Impairment (losses) / gains (59) 81
Underlying profit before tax 492 500
Non-core items (32) (46)
Net Interest Margin (NIM) 2.32% 2.23%
Dec 2017 Jun 2018
Customer loans (net) €76.1bn €76.6bn
Customer deposits €75.9bn €76.7bn
Non-performing exposures (NPEs) €6.5bn €5.9bn
CET1 ratios: Fully Loaded Regulatory
13.8% 15.8%
14.1% 15.8%
Regulatory Total Capital Ratio 20.2% 19.8%
Liquidity metrics: LCR NSFR LDR
136% 127%100%
139%127%100%

10
Loan book growth of €0.5bn
Group loan book movement
Dec 17 Loan Book
New Lending Redemptions Redemptions on NPEs, GB
non-core1
IFRS 9 Day 1 / FX / Other
Jun 18 Loan Book
€76.1bn
€7.2bn €7.1bn
New lending / redemption volumes
n New Lending n Redemptions
H1 2017 H1 2018
• Net loan book growth of €0.5bn to €76.6bn • New lending of €7.7bn, an increase of 16% vs. H1 2017 • Group redemptions of €7.1bn, in line with H1 2017 • Expect to re-enter Irish mortgage broker market in
H2 2018 • Expect further loan book growth in H2 2018, while
maintaining strong commercial pricing and risk discipline
• Retail Ireland: €2.7bn • Mortgage new lending of €1.0bn, up 30% on 2017;
market share of 28% • SME new lending of €1.4bn • Consumer new lending of €0.2bn
• Retail UK: £2.6bn • Mortgage new lending of £1.6bn, up 25% on 2017 • SME new lending of £0.1bn • Consumer new lending of £0.9bn (H1 2017: £0.5bn)
• Corporate Banking: €2.1bn • Property Finance new lending of €0.6bn • Corporate Ireland new lending of €0.5bn • Corporate UK new lending of €0.5bn • Acquisition Finance new lending of €0.5bn
1GB business and corporate loan books, which BOI was required to run down under its EU approved Restructuring Plan (Remaining stock: H1 2017 - £0.7bn; H2 2017 - £0.6bn; H1 2018 - £0.5bn)
€7.7bn
€76.6bn
€6.6bn
Total €7.1bn
€0.5bn €0.1bn
€7.7bn€6.6bn
+16%
11
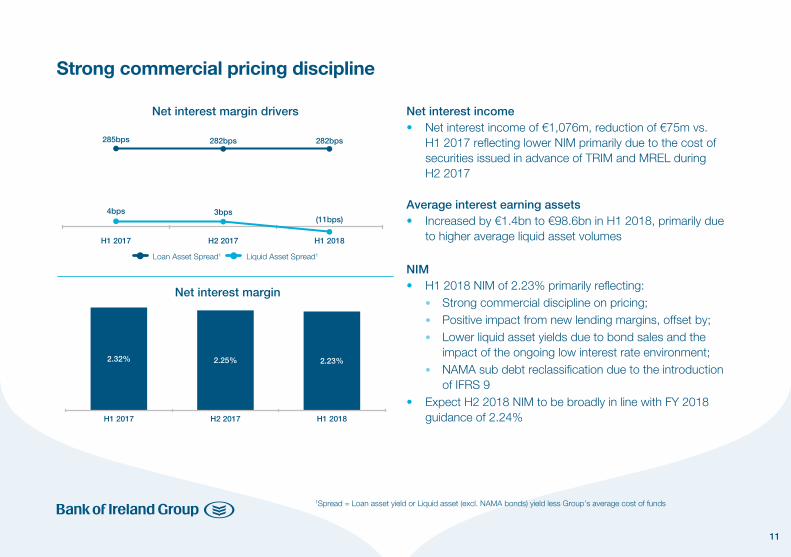
2.25% 2.23%
H1 2017 H2 2017 H1 2018
2.32%
Strong commercial pricing discipline
Net interest margin drivers
Net interest margin
Net interest income• Net interest income of €1,076m, reduction of €75m vs.
H1 2017 reflecting lower NIM primarily due to the cost of securities issued in advance of TRIM and MREL during H2 2017
Average interest earning assets• Increased by €1.4bn to €98.6bn in H1 2018, primarily due
to higher average liquid asset volumes
NIM• H1 2018 NIM of 2.23% primarily reflecting: • Strong commercial discipline on pricing; • Positive impact from new lending margins, offset by; • Lower liquid asset yields due to bond sales and the
impact of the ongoing low interest rate environment; • NAMA sub debt reclassification due to the introduction
of IFRS 9• Expect H2 2018 NIM to be broadly in line with FY 2018
guidance of 2.24%
1Spread = Loan asset yield or Liquid asset (excl. NAMA bonds) yield less Group’s average cost of funds
Loan Asset Spread1 Liquid Asset Spread1
H2 2017 H1 2018H1 2017
4bps 3bps(11bps)
285bps 282bps 282bps
12
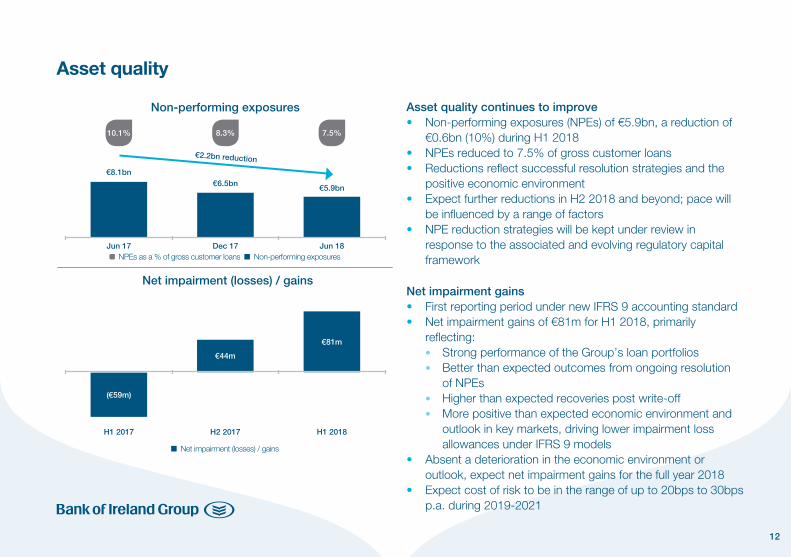
Asset quality continues to improve• Non-performing exposures (NPEs) of €5.9bn, a reduction of
€0.6bn (10%) during H1 2018• NPEs reduced to 7.5% of gross customer loans• Reductions reflect successful resolution strategies and the
positive economic environment • Expect further reductions in H2 2018 and beyond; pace will
be influenced by a range of factors• NPE reduction strategies will be kept under review in
response to the associated and evolving regulatory capital framework
Net impairment gains • First reporting period under new IFRS 9 accounting standard• Net impairment gains of €81m for H1 2018, primarily
reflecting: • Strong performance of the Group’s loan portfolios • Better than expected outcomes from ongoing resolution
of NPEs • Higher than expected recoveries post write-off • More positive than expected economic environment and
outlook in key markets, driving lower impairment loss allowances under IFRS 9 models
• Absent a deterioration in the economic environment or outlook, expect net impairment gains for the full year 2018
• Expect cost of risk to be in the range of up to 20bps to 30bps p.a. during 2019-2021
Asset quality
€8.1bn
(€59m)
€6.5bn
€2.2bn reduction
€44m
€81m
€5.9bn
Non-performing exposures
Net impairment (losses) / gains
Jun 17
H1 2017
Dec 17
H2 2017
Jun 18
H1 2018
10.1% 8.3% 7.5%
NPEs as a % of gross customer loans n Non-performing exposures
n Net impairment (losses) / gains
13
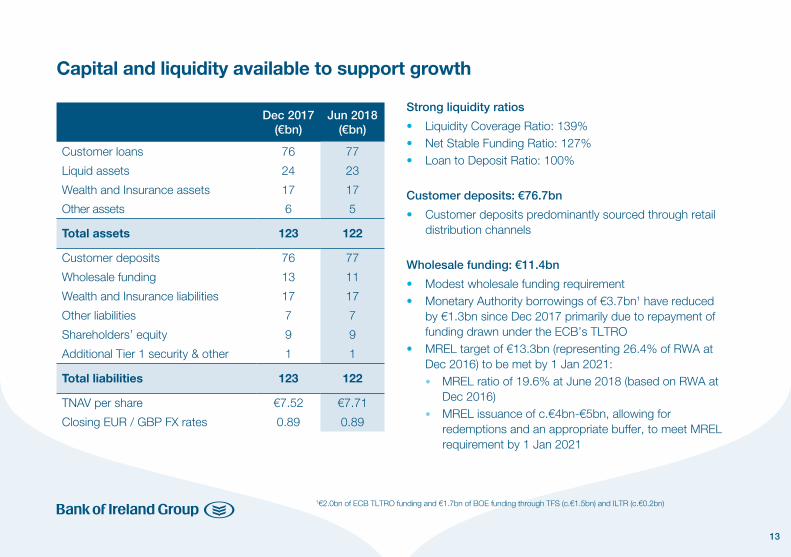
Capital and liquidity available to support growth
Strong liquidity ratios
• Liquidity Coverage Ratio: 139%• Net Stable Funding Ratio: 127%• Loan to Deposit Ratio: 100%
Customer deposits: €76.7bn
• Customer deposits predominantly sourced through retail distribution channels
Wholesale funding: €11.4bn
• Modest wholesale funding requirement• Monetary Authority borrowings of €3.7bn1 have reduced
by €1.3bn since Dec 2017 primarily due to repayment of funding drawn under the ECB’s TLTRO
• MREL target of €13.3bn (representing 26.4% of RWA at Dec 2016) to be met by 1 Jan 2021:
• MREL ratio of 19.6% at June 2018 (based on RWA at Dec 2016)
• MREL issuance of c.€4bn-€5bn, allowing for redemptions and an appropriate buffer, to meet MREL requirement by 1 Jan 2021
1€2.0bn of ECB TLTRO funding and €1.7bn of BOE funding through TFS (c.€1.5bn) and ILTR (c.€0.2bn)
Dec 2017(€bn)
Jun 2018(€bn)
Customer loans 76 77
Liquid assets 24 23
Wealth and Insurance assets 17 17
Other assets 6 5
Total assets 123 122
Customer deposits 76 77
Wholesale funding 13 11
Wealth and Insurance liabilities 17 17
Other liabilities 7 7
Shareholders’ equity 9 9
Additional Tier 1 security & other 1 1
Total liabilities 123 122
TNAV per share €7.52 €7.71
Closing EUR / GBP FX rates 0.89 0.89

14
H2 2018 outlook
• Net loan book growth while maintaining commercial pricing and risk discipline
• NIM to be broadly in line with FY 2018 guidance of 2.24%
• Operating expenses to continue to reduce
• Absent a deterioration in the economic environment or outlook, expect net impairment gains for the full year 2018
• Expect further reductions in NPEs
• Continue to generate strong organic capital
Income growthTransformation of cost base
Capital generation, investment and return

Capital & MREL
16
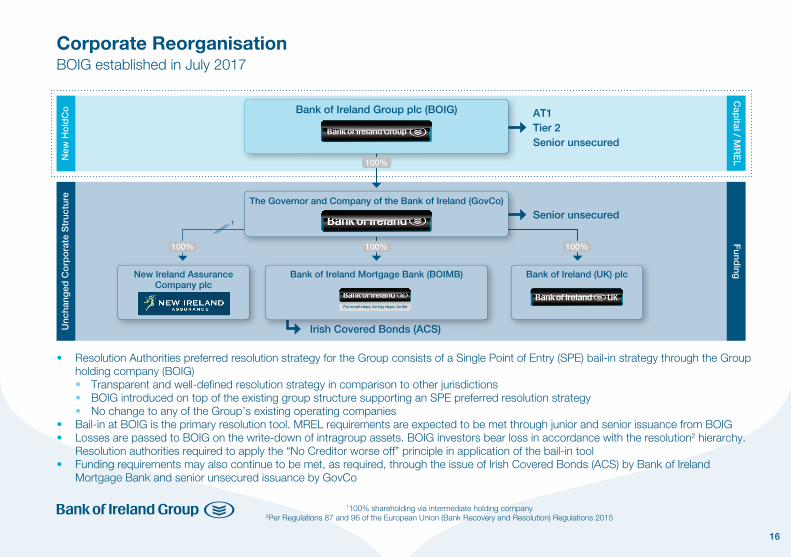
• Resolution Authorities preferred resolution strategy for the Group consists of a Single Point of Entry (SPE) bail-in strategy through the Group holding company (BOIG)
• Transparent and well-defined resolution strategy in comparison to other jurisdictions • BOIG introduced on top of the existing group structure supporting an SPE preferred resolution strategy • No change to any of the Group’s existing operating companies• Bail-in at BOIG is the primary resolution tool. MREL requirements are expected to be met through junior and senior issuance from BOIG• Losses are passed to BOIG on the write-down of intragroup assets. BOIG investors bear loss in accordance with the resolution2 hierarchy.
Resolution authorities required to apply the “No Creditor worse off” principle in application of the bail-in tool• Funding requirements may also continue to be met, as required, through the issue of Irish Covered Bonds (ACS) by Bank of Ireland
Mortgage Bank and senior unsecured issuance by GovCo
New
Ho
ldC
oC
apital / M
RE
LU
ncha
nged
Co
rpo
rate
Str
uctu
reF
unding
Senior unsecured
Bank of Ireland Group plc (BOIG)
Irish Covered Bonds (ACS)
The Governor and Company of the Bank of Ireland (GovCo)
New Ireland Assurance Company plc
Bank of Ireland (UK) plc
100%
100% 100% 100%
1100% shareholding via intermediate holding company2Per Regulations 87 and 96 of the European Union (Bank Recovery and Resolution) Regulations 2015
1
AT1Tier 2Senior unsecured
Bank of Ireland Mortgage Bank (BOIMB)
Corporate ReorganisationBOIG established in July 2017
17
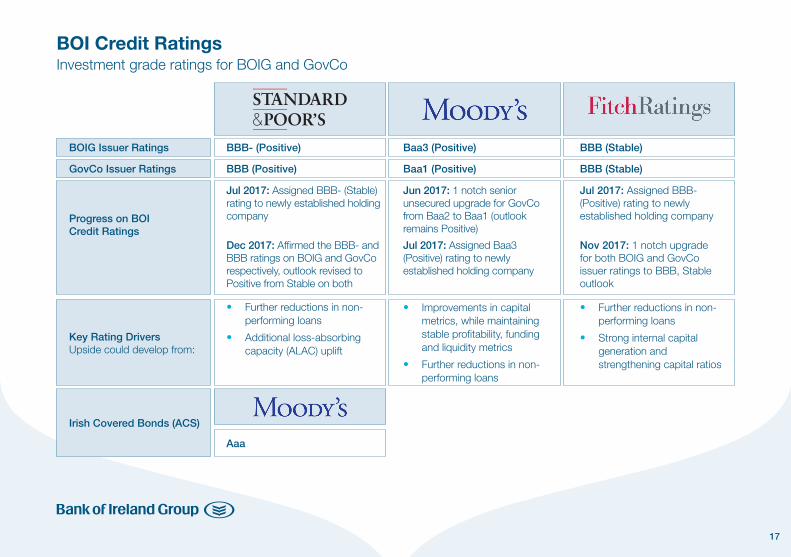
BOIG Issuer Ratings
Irish Covered Bonds (ACS)
GovCo Issuer Ratings
Progress on BOI Credit Ratings
Key Rating Drivers Upside could develop from:
BBB- (Positive)
BBB (Positive)
Aaa
Jul 2017: Assigned BBB- (Stable) rating to newly established holding company
Dec 2017: Affirmed the BBB- and BBB ratings on BOIG and GovCo respectively, outlook revised to Positive from Stable on both
• Further reductions in non-performing loans
• Additional loss-absorbing capacity (ALAC) uplift
Baa3 (Positive)
Baa1 (Positive)
Jun 2017: 1 notch senior unsecured upgrade for GovCo from Baa2 to Baa1 (outlook remains Positive)
Jul 2017: Assigned Baa3 (Positive) rating to newly established holding company
• Improvements in capital metrics, while maintaining stable profitability, funding and liquidity metrics
• Further reductions in non-performing loans
• Further reductions in non-performing loans
• Strong internal capital generation and strengthening capital ratios
BBB (Stable)
BBB (Stable)
Jul 2017: Assigned BBB- (Positive) rating to newly established holding company
Nov 2017: 1 notch upgrade for both BOIG and GovCo issuer ratings to BBB, Stable outlook
BOI Credit RatingsInvestment grade ratings for BOIG and GovCo
18
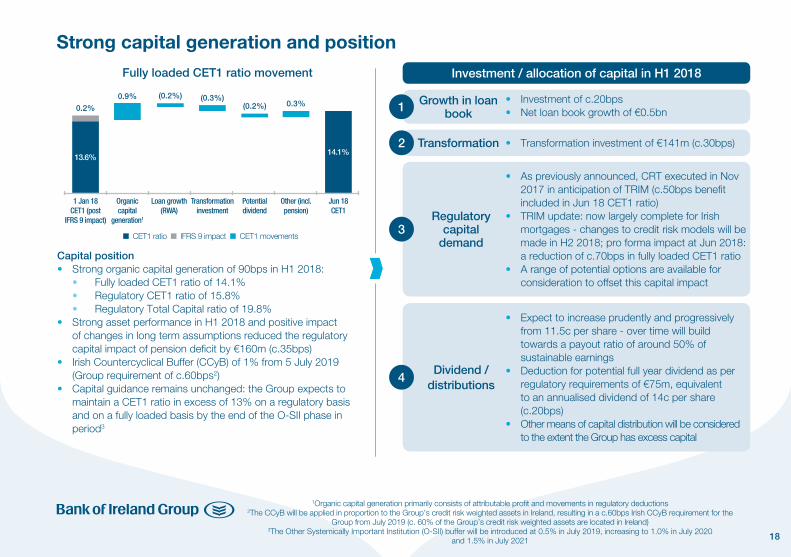
Capital position• Strong organic capital generation of 90bps in H1 2018: • Fully loaded CET1 ratio of 14.1% • Regulatory CET1 ratio of 15.8% • Regulatory Total Capital ratio of 19.8%• Strong asset performance in H1 2018 and positive impact
of changes in long term assumptions reduced the regulatory capital impact of pension deficit by €160m (c.35bps)
• Irish Countercyclical Buffer (CCyB) of 1% from 5 July 2019 (Group requirement of c.60bps2)
• Capital guidance remains unchanged: the Group expects to maintain a CET1 ratio in excess of 13% on a regulatory basis and on a fully loaded basis by the end of the O-SII phase in period3
Strong capital generation and position
Transformation investment
1 Jan 18 CET1 (post
IFRS 9 impact)
Loan growth (RWA)
Organic capital
generation1
13.6%
(0.2%) 0.3%(0.2%)0.9%
0.2%
Potential dividend
Other (incl. pension)
(0.3%)
Jun 18 CET1
Fully loaded CET1 ratio movement
14.1%
Investment / allocation of capital in H1 2018
Growth in loan book
Transformation
Regulatory capital
demand
Dividend /distributions
• Investment of c.20bps • Net loan book growth of €0.5bn
• Transformation investment of €141m (c.30bps)
• As previously announced, CRT executed in Nov 2017 in anticipation of TRIM (c.50bps benefit included in Jun 18 CET1 ratio)
• TRIM update: now largely complete for Irish mortgages - changes to credit risk models will be made in H2 2018; pro forma impact at Jun 2018: a reduction of c.70bps in fully loaded CET1 ratio
• A range of potential options are available for consideration to offset this capital impact
• Expect to increase prudently and progressively from 11.5c per share - over time will build towards a payout ratio of around 50% of sustainable earnings
• Deduction for potential full year dividend as per regulatory requirements of €75m, equivalent to an annualised dividend of 14c per share (c.20bps)
• Other means of capital distribution will be considered to the extent the Group has excess capital
1
2
3
4
1Organic capital generation primarily consists of attributable profit and movements in regulatory deductions2The CCyB will be applied in proportion to the Group’s credit risk weighted assets in Ireland, resulting in a c.60bps Irish CCyB requirement for the
Group from July 2019 (c. 60% of the Group’s credit risk weighted assets are located in Ireland)3The Other Systemically Important Institution (O-SII) buffer will be introduced at 0.5% in July 2019, increasing to 1.0% in July 2020
and 1.5% in July 2021
n CET1 ratio n IFRS 9 impact n CET1 movements
19
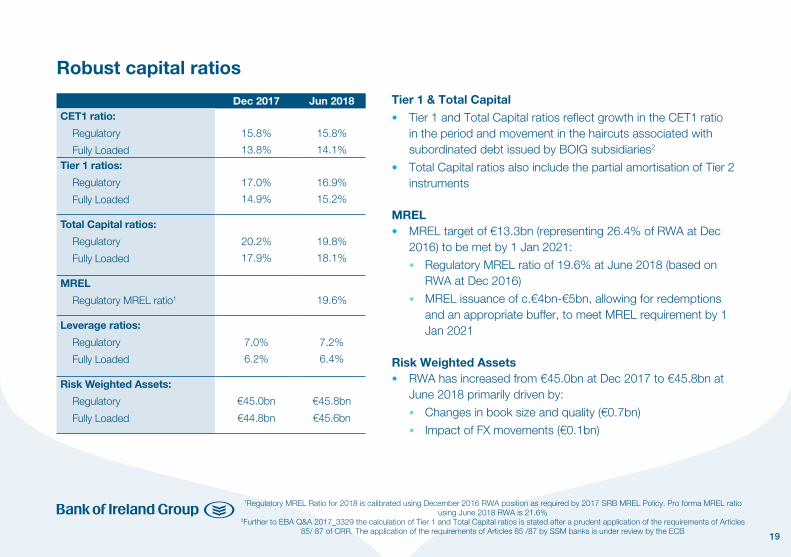
Robust capital ratios
Dec 2017 Jun 2018CET1 ratio:
Regulatory
Fully Loaded
15.8%
13.8%
15.8%
14.1%Tier 1 ratios:
Regulatory
Fully Loaded
17.0%
14.9%
16.9%
15.2%
Total Capital ratios:
Regulatory
Fully Loaded
20.2%
17.9%
19.8%
18.1%
MREL
Regulatory MREL ratio1 19.6%
Leverage ratios:
Regulatory
Fully Loaded
7.0%
6.2%
7.2%
6.4%
Risk Weighted Assets:
Regulatory
Fully Loaded
€45.0bn
€44.8bn
€45.8bn
€45.6bn
Tier 1 & Total Capital• Tier 1 and Total Capital ratios reflect growth in the CET1 ratio
in the period and movement in the haircuts associated with subordinated debt issued by BOIG subsidiaries2
• Total Capital ratios also include the partial amortisation of Tier 2 instruments
MREL• MREL target of €13.3bn (representing 26.4% of RWA at Dec
2016) to be met by 1 Jan 2021:
• Regulatory MREL ratio of 19.6% at June 2018 (based on RWA at Dec 2016)
• MREL issuance of c.€4bn-€5bn, allowing for redemptions and an appropriate buffer, to meet MREL requirement by 1 Jan 2021
Risk Weighted Assets• RWA has increased from €45.0bn at Dec 2017 to €45.8bn at
June 2018 primarily driven by:
• Changes in book size and quality (€0.7bn)
• Impact of FX movements (€0.1bn)
1Regulatory MREL Ratio for 2018 is calibrated using December 2016 RWA position as required by 2017 SRB MREL Policy. Pro forma MREL ratio using June 2018 RWA is 21.6%
2Further to EBA Q&A 2017_3329 the calculation of Tier 1 and Total Capital ratios is stated after a prudent application of the requirements of Articles 85/ 87 of CRR. The application of the requirements of Articles 85 /87 by SSM banks is under review by the ECB

20
Capital Guidance• The Group expects to maintain a CET1 ratio in excess of 13% on a regulatory basis and on a fully loaded basis by the end of the O-SII
phase-in period2 in July 2021. This includes meeting applicable regulatory capital requirements plus an appropriate management buffer
Regulatory Capital Requirements• A minimum CET1 ratio of 8.625% on a regulatory basis from 1 Jan 2018, includes: • A Pillar 1 requirement of 4.5%, a Pillar 2 requirement (P2R) of 2.25% and a capital conservation buffer for 2018 of 1.875%• The FPC (UK) has set the UK CCyB at 0.5% from June 2018 and 1% from November 2018• The CBI (ROI) announced its intention to increase the CCyB in Ireland from 0% to 1.0%, effective from 5 July 2019• The Systemic Risk Buffer under Article 133 CRD IV is currently not implemented in Irish law but may be introduced at the discretion of
the Minister for Finance• Pillar 2 Guidance (P2G) is not disclosed in accordance with regulatory preference
1CCyB could be set in excess of 2.50% in exceptional circumstances. A change in the CCyB could also be implemented in less than 12 months in exceptional circumstances
2The Other Systemically Important Institution (O-SII) buffer will be introduced at 0.5% in July 2019, increasing to 1.0% in July 2020 and 1.5% in July 2021
Regulatory Capital Requirements Pro forma CET1 Regulatory Capital Requirements Set by Range 2017 2018 2019 2020 2021
Pillar 1 – CET1Pillar 2 Requirement (P2R) – reviewed annuallyCapital Conservation Buffer (CCB)
CRRSSMCRD
4.5%
2.5%
4.5%2.25%1.25%
4.5%2.25%1.875%
4.5%2.25%2.5%
4.5%2.25%2.5%
4.5%2.25%2.5%
Countercyclical buffer (CCyB)1
Ireland (c.60% of RWA)UK (c.30% of RWA)US and other (c.10% of RWA)
CBIFPC (UK)Fed/Various
0% – 2.50%0% – 2.50%0% – 2.50%
–––
–0.3%
–
0.6%0.3%
–
0.6%0.3%
–
0.6%0.3%
-
O-SII buffer2
Systemic Risk Buffer – IrelandCBIMinister for Finance
0% – 2.00%0% – 3.00%
–N/A
–N/A
0.5%N/A
1%N/A
1.5%N/A
Pro forma Minimum CET1 Regulatory Requirements 8.0% 8.925% 10.65% 11.15% 11.65%
Pillar 2 Guidance (P2G) – reviewed annually Not disclosed in line with regulatory preference
21
-0.86%4
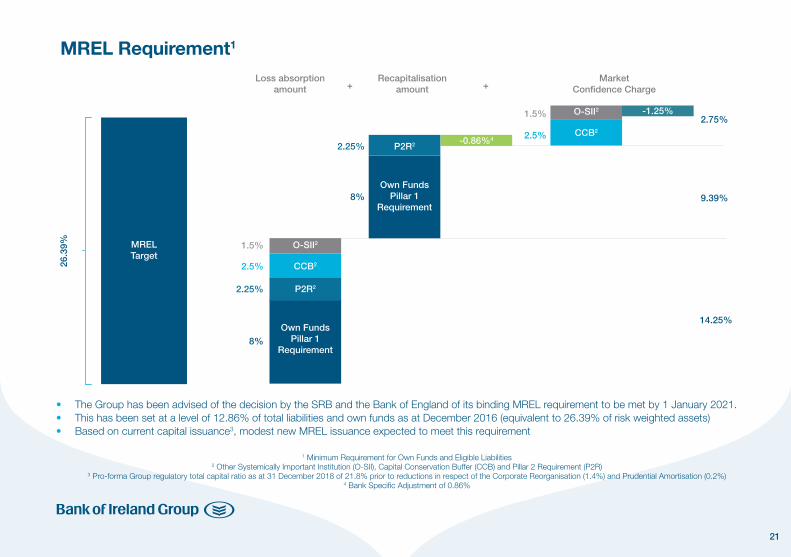
• The Group has been advised of the decision by the SRB and the Bank of England of its binding MREL requirement to be met by 1 January 2021. • This has been set at a level of 12.86% of total liabilities and own funds as at December 2016 (equivalent to 26.39% of risk weighted assets) • Based on current capital issuance3, modest new MREL issuance expected to meet this requirement
MREL Requirement1
26.3
9%
2.75%
9.39%
14.25%
Loss absorption amount
Recapitalisation amount
Market Confidence Charge ++
MRELTarget
P2R2
Own Funds Pillar 1
Requirement
O-SII2 -1.25%
CCB2
O-SII2
CCB2
P2R2
Own Funds Pillar 1
Requirement8%
2.25%
8%
2.25%2.5%
1.5%
2.5%
1.5%
1 Minimum Requirement for Own Funds and Eligible Liabilities2 Other Systemically Important Institution (O-SII), Capital Conservation Buffer (CCB) and Pillar 2 Requirement (P2R)
3 Pro-forma Group regulatory total capital ratio as at 31 December 2018 of 21.8% prior to reductions in respect of the Corporate Reorganisation (1.4%) and Prudential Amortisation (0.2%)4 Bank Specific Adjustment of 0.86%
22
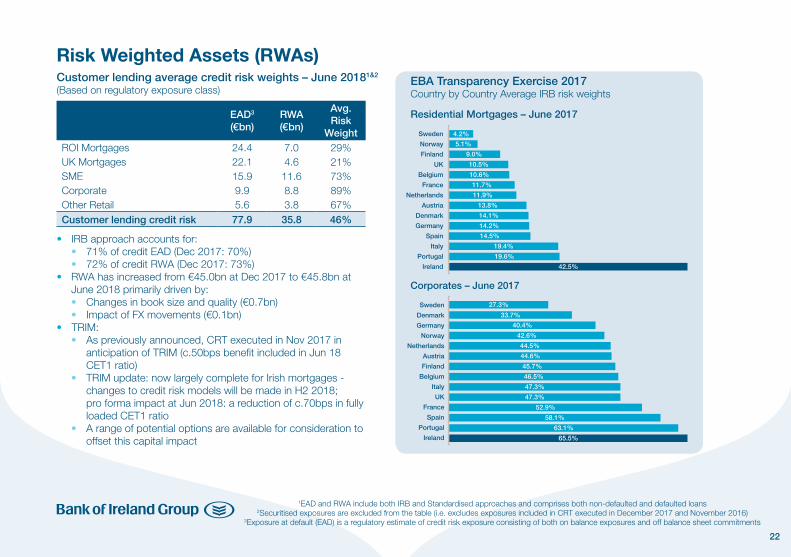
1EAD and RWA include both IRB and Standardised approaches and comprises both non-defaulted and defaulted loans 2Securitised exposures are excluded from the table (i.e. excludes exposures included in CRT executed in December 2017 and November 2016)
3Exposure at default (EAD) is a regulatory estimate of credit risk exposure consisting of both on balance exposures and off balance sheet commitments
Risk Weighted Assets (RWAs)Customer lending average credit risk weights – June 20181&2
(Based on regulatory exposure class)
• IRB approach accounts for: • 71% of credit EAD (Dec 2017: 70%) • 72% of credit RWA (Dec 2017: 73%)• RWA has increased from €45.0bn at Dec 2017 to €45.8bn at
June 2018 primarily driven by: • Changes in book size and quality (€0.7bn) • Impact of FX movements (€0.1bn)• TRIM: • As previously announced, CRT executed in Nov 2017 in
anticipation of TRIM (c.50bps benefit included in Jun 18 CET1 ratio)
• TRIM update: now largely complete for Irish mortgages - changes to credit risk models will be made in H2 2018; pro forma impact at Jun 2018: a reduction of c.70bps in fully loaded CET1 ratio
• A range of potential options are available for consideration to offset this capital impact
EAD3
(€bn)RWA(€bn)
Avg. Risk
WeightROI MortgagesUK MortgagesSMECorporateOther Retail
24.422.115.99.95.6
7.04.611.68.83.8
29%21%73%89%67%
Customer lending credit risk 77.9 35.8 46%
Corporates – June 2017
EBA Transparency Exercise 2017Country by Country Average IRB risk weights
Sweden
Norway
Finland
UK
Belgium
France
Netherlands
Austria
Denmark
Germany
Spain
Italy
Portugal
Ireland
Residential Mortgages – June 2017
4.2%
5.1%
9.0%
10.5%
10.6%
11.7%
11.9%
13.8%
14.1%
14.2%
14.5%
19.4%
19.6%
42.5%
Sweden
Denmark
Germany
Norway
Netherlands
Austria
Finland
Belgium
Italy
UK
France
Spain
Portugal
Ireland
27.3%
33.7%
40.4%
42.6%
44.5%
44.6%
45.7%
46.5%
47.3%
47.3%
52.9%
58.1%
63.1%
65.5%
23
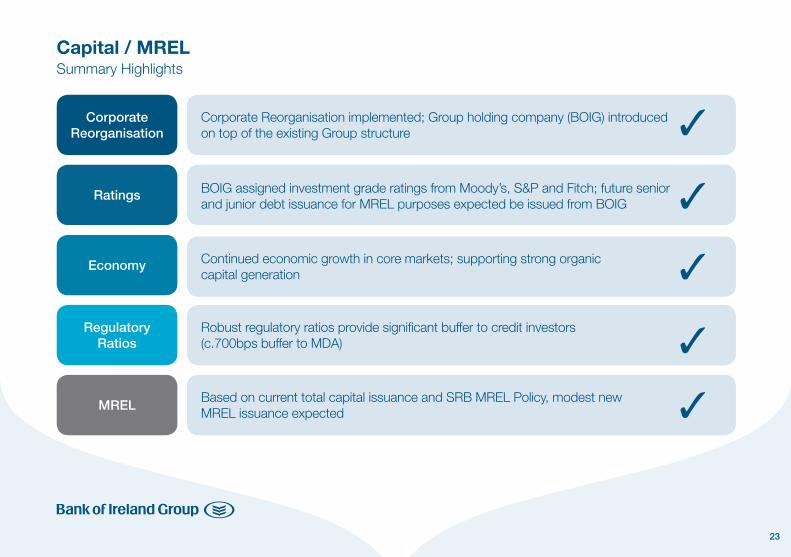
Capital / MREL Summary Highlights
Corporate Reorganisation implemented; Group holding company (BOIG) introduced on top of the existing Group structure
BOIG assigned investment grade ratings from Moody’s, S&P and Fitch; future senior and junior debt issuance for MREL purposes expected be issued from BOIG
Continued economic growth in core markets; supporting strong organic capital generation
Robust regulatory ratios provide significant buffer to credit investors (c.700bps buffer to MDA)
Based on current total capital issuance and SRB MREL Policy, modest new MREL issuance expected
Corporate Reorganisation
Economy
Ratings
Regulatory Ratios
MREL

Additional Information
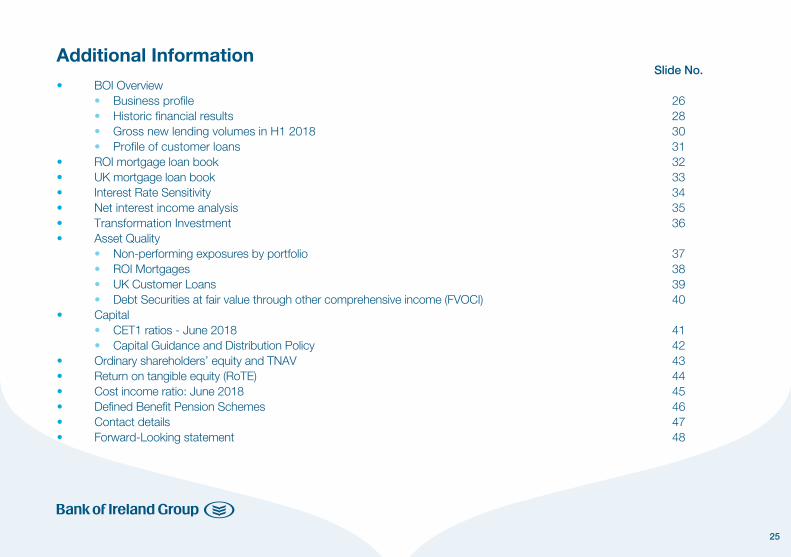
25
Additional Information Slide No.• BOI Overview • Business profile 26 • Historic financial results 28 • Gross new lending volumes in H1 2018 30 • Profile of customer loans 31• ROI mortgage loan book 32 • UK mortgage loan book 33• Interest Rate Sensitivity 34• Net interest income analysis 35• Transformation Investment 36• Asset Quality • Non-performing exposures by portfolio 37 • ROI Mortgages 38 • UK Customer Loans 39 • Debt Securities at fair value through other comprehensive income (FVOCI) 40• Capital • CET1 ratios - June 2018 41 • Capital Guidance and Distribution Policy 42• Ordinary shareholders’ equity and TNAV 43• Return on tangible equity (RoTE) 44• Cost income ratio: June 2018 45• Defined Benefit Pension Schemes 46• Contact details 47• Forward-Looking statement 48
26
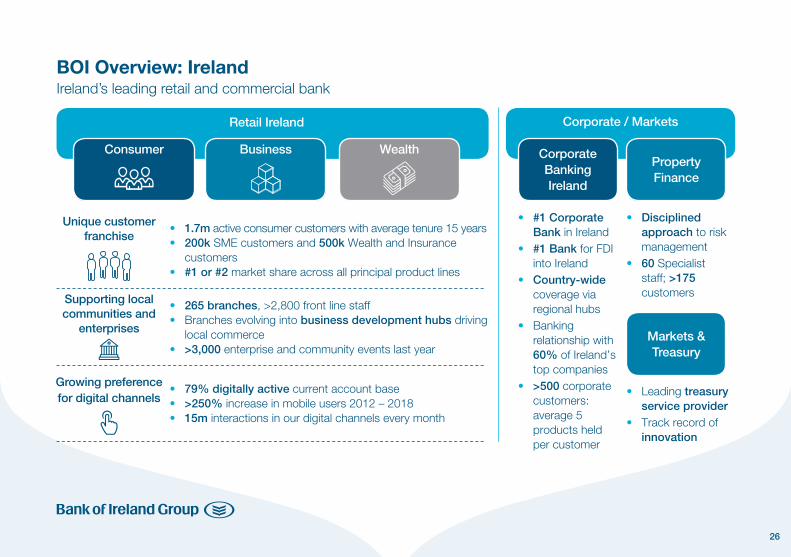
BOI Overview: IrelandIreland’s leading retail and commercial bank
Consumer
Unique customer franchise
Supporting local communities and
enterprises
Growing preference for digital channels
Business Wealth Corporate Banking Ireland
Property Finance
Markets & Treasury
Retail Ireland Corporate / Markets
• 1.7m active consumer customers with average tenure 15 years• 200k SME customers and 500k Wealth and Insurance
customers• #1 or #2 market share across all principal product lines
• 265 branches, >2,800 front line staff• Branches evolving into business development hubs driving
local commerce• >3,000 enterprise and community events last year
• 79% digitally active current account base • >250% increase in mobile users 2012 – 2018• 15m interactions in our digital channels every month
• #1 Corporate Bank in Ireland
• #1 Bank for FDI into Ireland
• Country-wide coverage via regional hubs
• Banking relationship with 60% of Ireland’s top companies
• >500 corporate customers: average 5 products held per customer
• Disciplined approach to risk management
• 60 Specialist staff; >175 customers
• Leading treasury service provider
• Track record of innovation
27
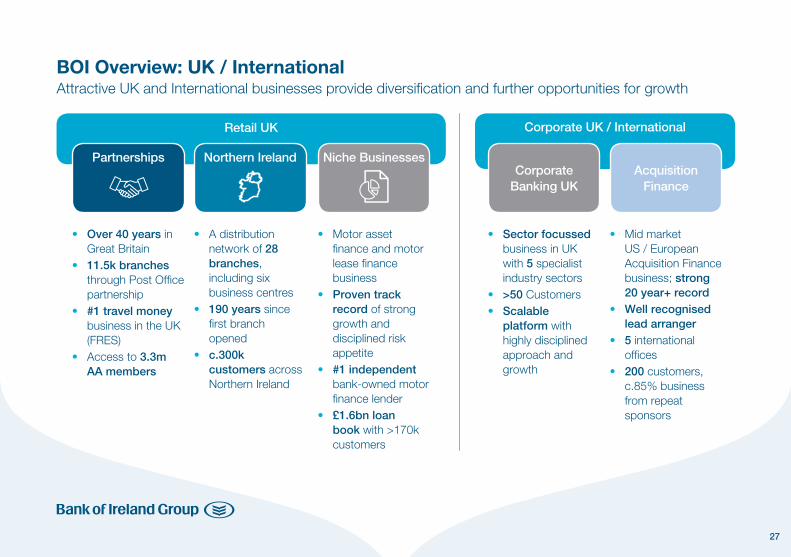
BOI Overview: UK / InternationalAttractive UK and International businesses provide diversification and further opportunities for growth
Partnerships Northern Ireland Niche BusinessesCorporate
Banking UKAcquisition
Finance
Retail UK Corporate UK / International
• Sector focussed business in UK with 5 specialist industry sectors
• >50 Customers• Scalable
platform with highly disciplined approach and growth
• Over 40 years in Great Britain
• 11.5k branches through Post Office partnership
• #1 travel money business in the UK (FRES)
• Access to 3.3m AA members
• Mid market US / European Acquisition Finance business; strong 20 year+ record
• Well recognised lead arranger
• 5 international offices
• 200 customers, c.85% business from repeat sponsors
• A distribution network of 28 branches, including six business centres
• 190 years since first branch opened
• c.300k customers across Northern Ireland
• Motor asset finance and motor lease finance business
• Proven track record of strong growth and disciplined risk appetite
• #1 independent bank-owned motor finance lender
• £1.6bn loan book with >170k customers
28
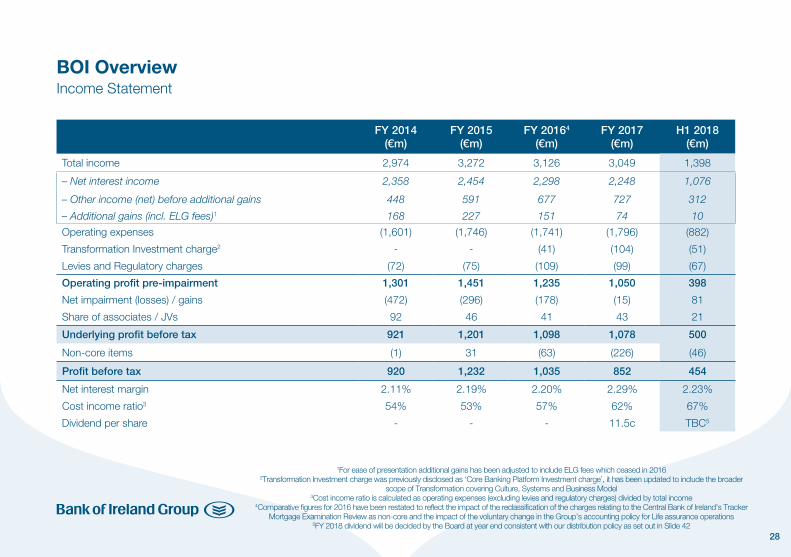
BOI OverviewIncome Statement
FY 2014(€m)
FY 2015(€m)
FY 20164
(€m)FY 2017
(€m)H1 2018
(€m)
Total income 2,974 3,272 3,126 3,049 1,398
– Net interest income 2,358 2,454 2,298 2,248 1,076
– Other income (net) before additional gains 448 591 677 727 312
– Additional gains (incl. ELG fees)1 168 227 151 74 10
Operating expenses (1,601) (1,746) (1,741) (1,796) (882)
Transformation Investment charge2 - - (41) (104) (51)
Levies and Regulatory charges (72) (75) (109) (99) (67)
Operating profit pre-impairment 1,301 1,451 1,235 1,050 398
Net impairment (losses) / gains (472) (296) (178) (15) 81
Share of associates / JVs 92 46 41 43 21
Underlying profit before tax 921 1,201 1,098 1,078 500
Non-core items (1) 31 (63) (226) (46)
Profit before tax 920 1,232 1,035 852 454
Net interest margin 2.11% 2.19% 2.20% 2.29% 2.23%
Cost income ratio3 54% 53% 57% 62% 67%
Dividend per share - - - 11.5c TBC5
1For ease of presentation additional gains has been adjusted to include ELG fees which ceased in 20162Transformation Investment charge was previously disclosed as ‘Core Banking Platform Investment charge’, it has been updated to include the broader
scope of Transformation covering Culture, Systems and Business Model3Cost income ratio is calculated as operating expenses (excluding levies and regulatory charges) divided by total income
4Comparative figures for 2016 have been restated to reflect the impact of the reclassification of the charges relating to the Central Bank of Ireland’s Tracker Mortgage Examination Review as non-core and the impact of the voluntary change in the Group’s accounting policy for Life assurance operations
5FY 2018 dividend will be decided by the Board at year end consistent with our distribution policy as set out in Slide 42
29
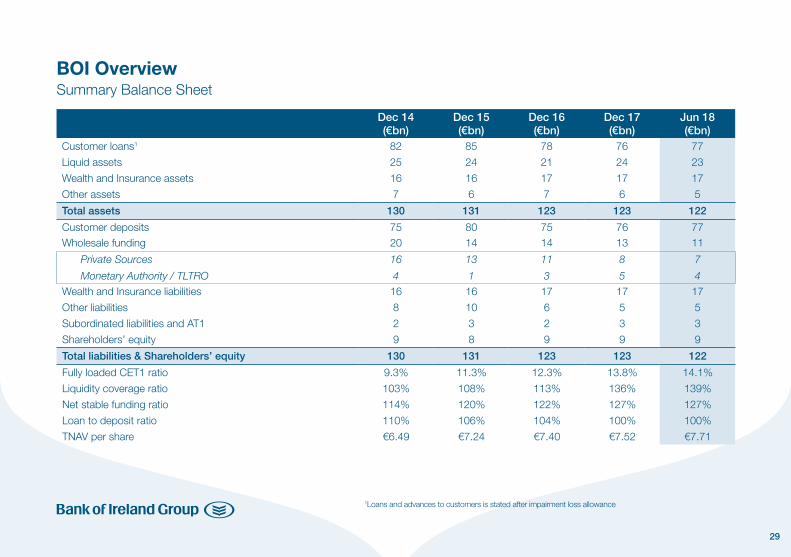
BOI OverviewSummary Balance Sheet
1Loans and advances to customers is stated after impairment loss allowance
Dec 14(€bn)
Dec 15(€bn)
Dec 16(€bn)
Dec 17(€bn)
Jun 18(€bn)
Customer loans1 82 85 78 76 77
Liquid assets 25 24 21 24 23
Wealth and Insurance assets 16 16 17 17 17
Other assets 7 6 7 6 5
Total assets 130 131 123 123 122
Customer deposits 75 80 75 76 77Wholesale funding
Private Sources
Monetary Authority / TLTRO
20
16
4
14
13
1
14
11
3
13
8
5
11
7
4
Wealth and Insurance liabilities 16 16 17 17 17
Other liabilities 8 10 6 5 5
Subordinated liabilities and AT1 2 3 2 3 3
Shareholders’ equity 9 8 9 9 9
Total liabilities & Shareholders’ equity 130 131 123 123 122
Fully loaded CET1 ratio 9.3% 11.3% 12.3% 13.8% 14.1%
Liquidity coverage ratio 103% 108% 113% 136% 139%
Net stable funding ratio 114% 120% 122% 127% 127%
Loan to deposit ratio 110% 106% 104% 100% 100%
TNAV per share €6.49 €7.24 €7.40 €7.52 €7.71

30
€0.5bn
€1.4bn
€0.3bn
€0.4bn
€0.7bn
€1.9bn
Corporate Banking
€0.6bn
€0.5bn
€0.5bn
€0.5bn
€2.1bn
H1 2017 H1 2018 H1 2018H1 2017 H1 2017 H1 2018
£1.9bn
Retail UK
£1.3bn
£1.6bn
£0.1bn £0.1bn
£0.5bn£0.9bn
Retail Ireland
€2.7bn€2.5bn
€0.8bn €1.0bn
€1.5bn
€0.2bn€0.2bn
n Mortgages n Consumer n Business Banking n Property n Corporate Ireland n Acquisition Finance n Corporate UK
Gross new lending volumes in H1 2018
£2.6bn
31
Composition (Jun 2018)ROI
(€bn)UK
(€bn)RoW(€bn)
Total(€bn)
Total(%)
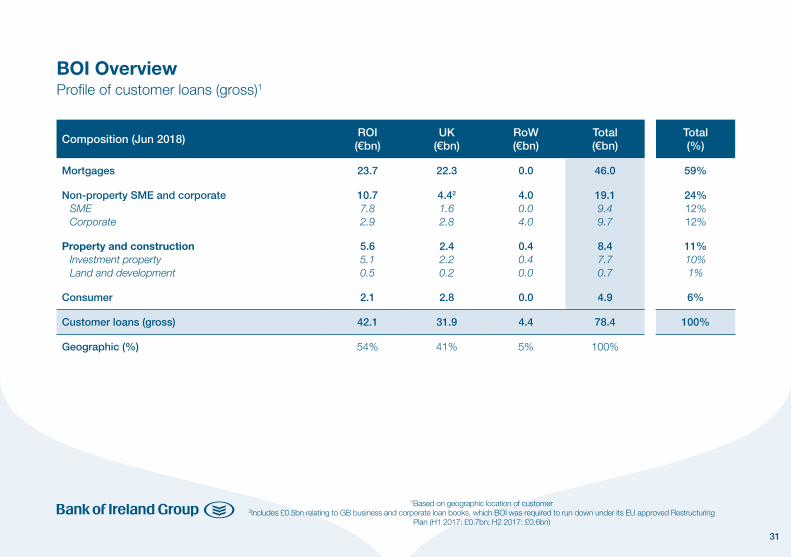
Mortgages 23.7 22.3 0.0 46.0 59%
Non-property SME and corporateSME Corporate
10.77.82.9
4.42
1.62.8
4.00.04.0
19.19.49.7
24%12%12%
Property and constructionInvestment property Land and development
5.65.10.5
2.42.20.2
0.40.40.0
8.47.70.7
11%10%1%
Consumer 2.1 2.8 0.0 4.9 6%
Customer loans (gross) 42.1 31.9 4.4 78.4 100%
Geographic (%) 54% 41% 5% 100%
BOI OverviewProfile of customer loans (gross)1
1Based on geographic location of customer 2Includes £0.5bn relating to GB business and corporate loan books, which BOI was required to run down under its EU approved Restructuring
Plan (H1 2017: £0.7bn; H2 2017: £0.6bn)

32
New Lending volumes and Market Share
LTV profile• Average LTV of 61% on existing mortgage stock at June
2018 (Dec 17: 63%, Dec 16: 72%)• Average LTV of 73% on new mortgages in H1 2018
(Dec 17: 69%2, Dec 16: 67%2)
Tracker mortgages• €9.8bn or 94% of trackers at June 18 are on a capital and
interest repayment basis• 79% of trackers are Owner Occupier mortgages; 21% of
trackers are Buy to Let mortgages• Loan asset spread on ECB tracker mortgages was c.66bps3
in H1 2018
Pricing strategy• Fixed rate led mortgage pricing strategy which provides value,
certainty and stability to our customers and to the Group • Fixed rate products accounted for c.92% of our new lending
in H1 2018, up from c.30% in 2014
Distribution strategy• Market share of 28% in H1 2018 in line with H2 2017 • Expect to re-enter the Irish mortgage broker market in H2
2018
Wider proposition• 7 in 10 ROI customers who take out a new mortgage take out
a life assurance policy through BOI Group• 3 in 10 ROI customers who take out a new mortgage take out
a general insurance policy through BOI Group with insurance partners
ROI Mortgages (gross)€24.3bn €24.1bn €23.7bn
Jun 18Dec 16 Dec 17n Tracker n Variable Rates n Fixed Rates
€11.8bn
€7.2bn
€5.3bn €7.3bn €8.6bn
€5.8bn €4.7bn
€10.9bn €10.4bn
ROI Mortgages: €23.7bn
H1 2018n New Lending Volumes1 Market Share
€1.0bn
H1 2017
€0.8bn
H2 2017
€1.2bn
H1 2016
€0.6bn
H2 2016
€0.8bn
27%
24%26%
28%28%
1Excluding portfolio acquisitions (H1 2016 - €0.1bn; H2 2016 - €0.1bn; H1 2017 - Nil; H2 2017 - €0.1bn; H1 2018 - Nil)2LTV on new business includes the impact of the portfolio acquisitions
3Average customer pay rate of 109bps less Group average cost of funds in H1 2018 of 43bps

33
LTV profile
• Average LTV of 61% on existing stock at June 2018 (Dec 17: 62%, Dec 16: 62%)
• Average LTV of 69% on new UK mortgages in H1 2018 (2017: 72%, 2016: 71%)
UK Mortgages: £19.8bn/€22.3bn
UK Mortgages (gross)
UK Mortgages New Lending volumes
UK Mortgages (gross)
£2.2bn
Dec 17
FY 2017
Jun 18
H1 2018
Jun 18Dec 16Dec 16
FY 2016
Dec 17
n Tracker n Variable Rates n Fixed Rates n Standard n Buy to let n Self certified
£8.5bn
£2.0bn
£9.6bn £10.0bn
£1.9bn
£7.4bn
£4.0bn
£7.5bn
£3.3bn £3.0bn
£7.7bn
£10.8bn£7.9bn
£2.8bn
£10.6bn£7.1bn
£3.2bn
£6.7bn
£1.6bn
£10.2bn
£20.4bn£20.4bn £20.0bn£20.0bn £19.8bn £19.8bn
34
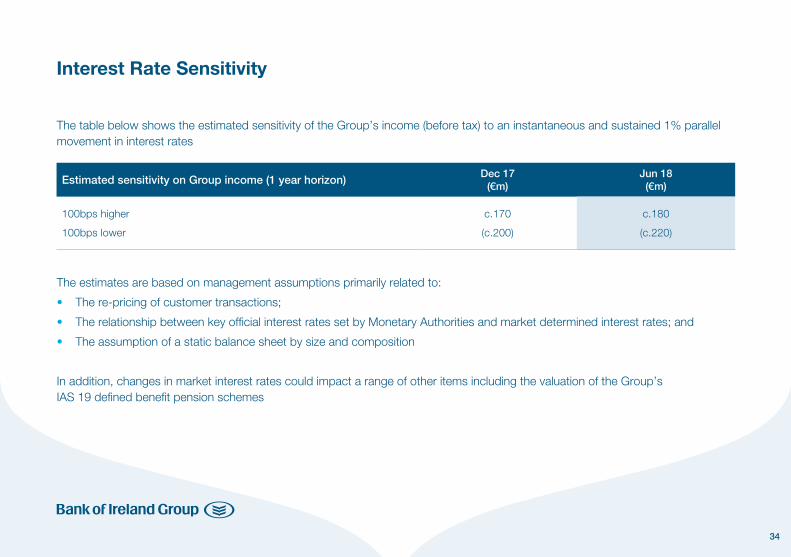
Interest Rate Sensitivity
The table below shows the estimated sensitivity of the Group’s income (before tax) to an instantaneous and sustained 1% parallel movement in interest rates
The estimates are based on management assumptions primarily related to:
• The re-pricing of customer transactions;
• The relationship between key official interest rates set by Monetary Authorities and market determined interest rates; and
• The assumption of a static balance sheet by size and composition
In addition, changes in market interest rates could impact a range of other items including the valuation of the Group’s IAS 19 defined benefit pension schemes
Estimated sensitivity on Group income (1 year horizon) Dec 17 (€m)
Jun 18 (€m)
100bps higher
100bps lower
c.170
(c.200)
c.180
(c.220)
35
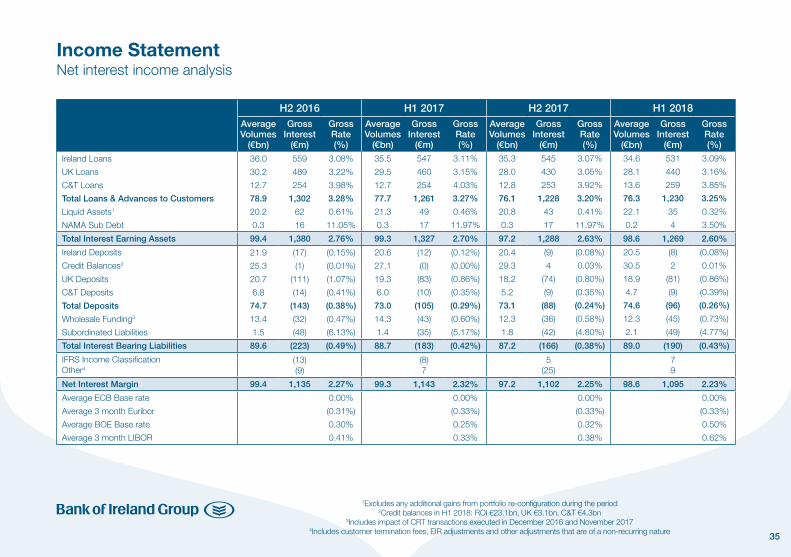
H2 2016 H1 2017 H2 2017 H1 2018Average Volumes
(€bn)
Gross Interest
(€m)
Gross Rate(%)
Average Volumes
(€bn)
Gross Interest
(€m)
Gross Rate(%)
Average Volumes
(€bn)
Gross Interest
(€m)
Gross Rate(%)
Average Volumes
(€bn)
Gross Interest
(€m)
Gross Rate(%)
Ireland Loans
UK Loans
C&T Loans
Total Loans & Advances to Customers
Liquid Assets1
NAMA Sub Debt
36.0
30.2
12.7
78.9
20.2
0.3
559
489
254
1,302
62
16
3.08%
3.22%
3.98%
3.28%
0.61%
11.05%
35.5
29.5
12.7
77.7
21.3
0.3
547
460
254
1,261
49
17
3.11%
3.15%
4.03%
3.27%
0.46%
11.97%
35.3
28.0
12.8
76.1
20.8
0.3
545
430
253
1,228
43
17
3.07%
3.05%
3.92%
3.20%
0.41%
11.97%
34.6
28.1
13.6
76.3
22.1
0.2
531
440
259
1,230
35
4
3.09%
3.16%
3.85%
3.25%
0.32%
3.50%
Total Interest Earning Assets 99.4 1,380 2.76% 99.3 1,327 2.70% 97.2 1,288 2.63% 98.6 1,269 2.60%
Ireland Deposits
Credit Balances2
UK Deposits
C&T Deposits
Total Deposits
Wholesale Funding3
Subordinated Liabilities
21.9
25.3
20.7
6.8
74.7
13.4
1.5
(17)
(1)
(111)
(14)
(143)
(32)
(48)
(0.15%)
(0.01%)
(1.07%)
(0.41%)
(0.38%)
(0.47%)
(6.13%)
20.6
27.1
19.3
6.0
73.0
14.3
1.4
(12)
(0)
(83)
(10)
(105)
(43)
(35)
(0.12%)
(0.00%)
(0.86%)
(0.35%)
(0.29%)
(0.60%)
(5.17%)
20.4
29.3
18.2
5.2
73.1
12.3
1.8
(9)
4
(74)
(9)
(88)
(36)
(42)
(0.08%)
0.03%
(0.80%)
(0.35%)
(0.24%)
(0.58%)
(4.80%)
20.5
30.5
18.9
4.7
74.6
12.3
2.1
(8)
2
(81)
(9)
(96)
(45)
(49)
(0.08%)
0.01%
(0.86%)
(0.39%)
(0.26%)
(0.73%)
(4.77%)
Total Interest Bearing Liabilities 89.6 (223) (0.49%) 88.7 (183) (0.42%) 87.2 (166) (0.38%) 89.0 (190) (0.43%)
IFRS Income ClassificationOther4
(13)(9)
(8)7
5(25)
79
Net Interest Margin 99.4 1,135 2.27% 99.3 1,143 2.32% 97.2 1,102 2.25% 98.6 1,095 2.23%
Average ECB Base rate
Average 3 month Euribor
Average BOE Base rate
Average 3 month LIBOR
0.00%
(0.31%)
0.30%
0.41%
0.00%
(0.33%)
0.25%
0.33%
0.00%
(0.33%)
0.32%
0.38%
0.00%
(0.33%)
0.50%
0.62%
Income StatementNet interest income analysis
1Excludes any additional gains from portfolio re-configuration during the period2Credit balances in H1 2018: ROI €23.1bn, UK €3.1bn, C&T €4.3bn
3Includes impact of CRT transactions executed in December 2016 and November 20174Includes customer termination fees, EIR adjustments and other adjustments that are of a non-recurring nature
36
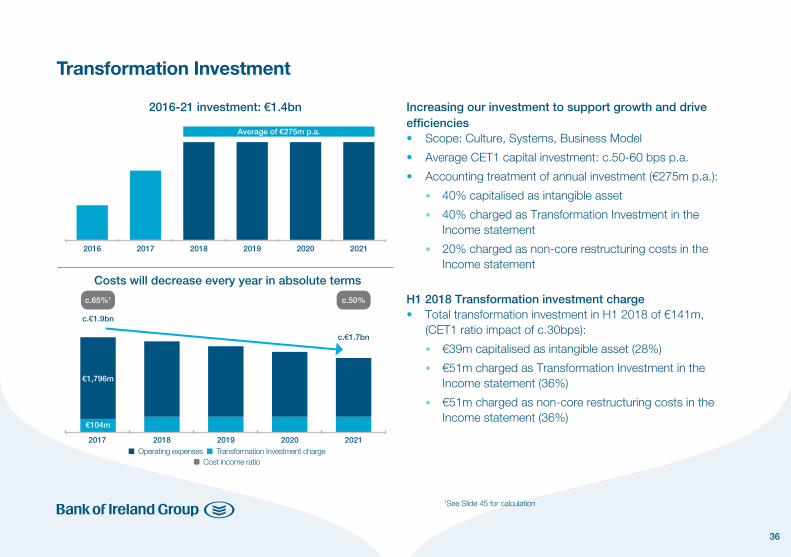
Increasing our investment to support growth and drive efficiencies• Scope: Culture, Systems, Business Model
• Average CET1 capital investment: c.50-60 bps p.a.
• Accounting treatment of annual investment (€275m p.a.):
• 40% capitalised as intangible asset
• 40% charged as Transformation Investment in the Income statement
• 20% charged as non-core restructuring costs in the Income statement
H1 2018 Transformation investment charge• Total transformation investment in H1 2018 of €141m,
(CET1 ratio impact of c.30bps):
• €39m capitalised as intangible asset (28%)
• €51m charged as Transformation Investment in the Income statement (36%)
• €51m charged as non-core restructuring costs in the Income statement (36%)
Transformation Investment
Average of €275m p.a.
€1,796m
€104m
c.€1.7bn
c.€1.9bn
2016-21 investment: €1.4bn
Costs will decrease every year in absolute terms
2016 2017 2018 2019 2020 2021
2017 2018 2019 2020 2021
c.65%1 c.50%
n Operating expenses n Transformation Investment charge Cost income ratio
1See Slide 45 for calculation

37
Composition (Jun 18) Advances(€bn)
Non-performing exposures
(€bn)
Non-performing exposures as %
of advances
Impairment loss allowance
(€bn)
Impairment loss allowance as % of
non-performing exposuresResidential Mortgages – Republic of Ireland– UKNon-property SME and Corporate– Republic of Ireland SME– UK SME– CorporateProperty and construction– Investment property– Land and developmentConsumer
46.023.722.319.17.81.69.78.47.70.74.9
3.02.50.51.51.10.10.31.31.20.10.1
6.4%10.5%2.2%7.9%14.4%6.9%2.7%
15.3%14.9%20.2%2.1%
0.60.50.10.80.50.10.20.60.50.10.1
20%20%13%52%47%44%73%46%45%52%
132%
Total loans and advances to customers 78.4 5.9 7.5% 2.1 36%
Composition (Dec 17) Advances(€bn)
Non-performing exposures
(€bn)
Non-performing exposures as %
of advances
Impairment loss allowance
(€bn)
Impairment loss allowance as % of
non-performing exposuresResidential Mortgages – Republic of Ireland– UKNon-property SME and Corporate– Republic of Ireland SME– UK SME– CorporateProperty and construction– Investment property– Land and developmentConsumer
46.724.122.618.78.21.78.88.88.30.54.3
3.02.60.41.71.30.10.31.71.50.20.1
6.6%11.0%1.9%8.9%15.4%8.6%3.0%
19.1%17.9%39.4%2.1%
0.70.60.10.90.60.10.20.70.60.10.1
23%24%14%49%46%42%69%44%43%55%98%
Total loans and advances to customers 78.5 6.5 8.3% 2.4 36%
Non-performing exposures by portfolio

38
>90 days arrears
• Bank of Ireland is significantly below the industry average for both Owner Occupier (28% of industry average) and Buy to Let (28% of industry average)
>720 days arrears
• Bank of Ireland is significantly below the industry average for both Owner Occupier (25% of industry average) and Buy to Let (19% of industry average)
ROI MortgagesArrears performance 4 times better than Industry Average
Owner Occupier Buy to letOwner Occupier Buy to let
Industry Average
4.9%
Industry Average
13.4%
1.2% 2.6%
>720 days arrears1
>90 days arrears1
Owner Occupier Buy to letOwner Occupier Buy to let
Industry Average
7.9%
Industry Average
18.0%
2.2%5.0%
1As at March 2018, based on number of accounts, industry average excluding BOI
39
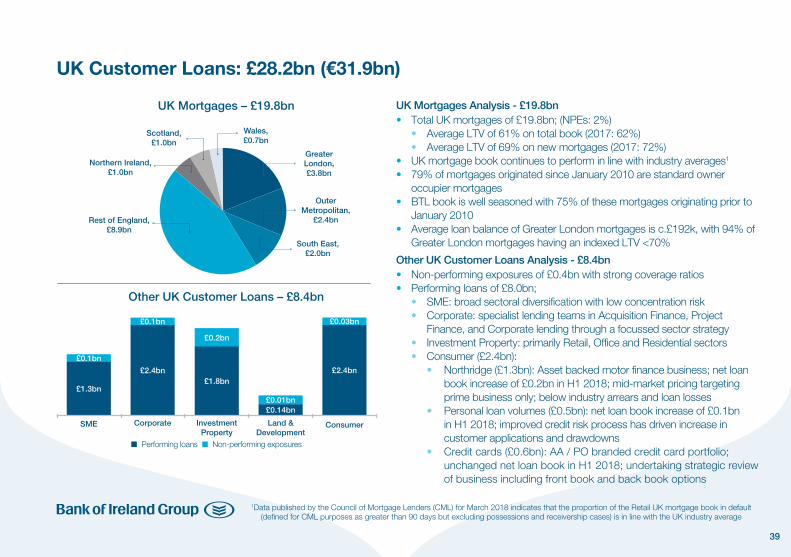
UK Mortgages Analysis - £19.8bn• Total UK mortgages of £19.8bn; (NPEs: 2%) • Average LTV of 61% on total book (2017: 62%) • Average LTV of 69% on new mortgages (2017: 72%)• UK mortgage book continues to perform in line with industry averages1
• 79% of mortgages originated since January 2010 are standard owner occupier mortgages
• BTL book is well seasoned with 75% of these mortgages originating prior to January 2010
• Average loan balance of Greater London mortgages is c.£192k, with 94% of Greater London mortgages having an indexed LTV <70%
Other UK Customer Loans Analysis - £8.4bn• Non-performing exposures of £0.4bn with strong coverage ratios• Performing loans of £8.0bn; • SME: broad sectoral diversification with low concentration risk • Corporate: specialist lending teams in Acquisition Finance, Project
Finance, and Corporate lending through a focussed sector strategy • Investment Property: primarily Retail, Office and Residential sectors • Consumer (£2.4bn): • Northridge (£1.3bn): Asset backed motor finance business; net loan
book increase of £0.2bn in H1 2018; mid-market pricing targeting prime business only; below industry arrears and loan losses
• Personal loan volumes (£0.5bn): net loan book increase of £0.1bn in H1 2018; improved credit risk process has driven increase in customer applications and drawdowns
• Credit cards (£0.6bn): AA / PO branded credit card portfolio; unchanged net loan book in H1 2018; undertaking strategic review of business including front book and back book options
UK Customer Loans: £28.2bn (€31.9bn)
1Data published by the Council of Mortgage Lenders (CML) for March 2018 indicates that the proportion of the Retail UK mortgage book in default (defined for CML purposes as greater than 90 days but excluding possessions and receivership cases) is in line with the UK industry average
n Performing loans n Non-performing exposures
Other UK Customer Loans – £8.4bn
UK Mortgages – £19.8bn
Scotland, £1.0bn
Northern Ireland, £1.0bn
Rest of England, £8.9bn
Wales, £0.7bn
Outer Metropolitan,
£2.4bn
Greater London, £3.8bn
South East, £2.0bn
SME Investment Property
Corporate Land & Development
Consumer
£1.3bn£1.8bn
£0.14bn£0.01bn
£2.4bn
£0.1bn
£0.2bn
£2.4bn
£0.03bn£0.1bn
40
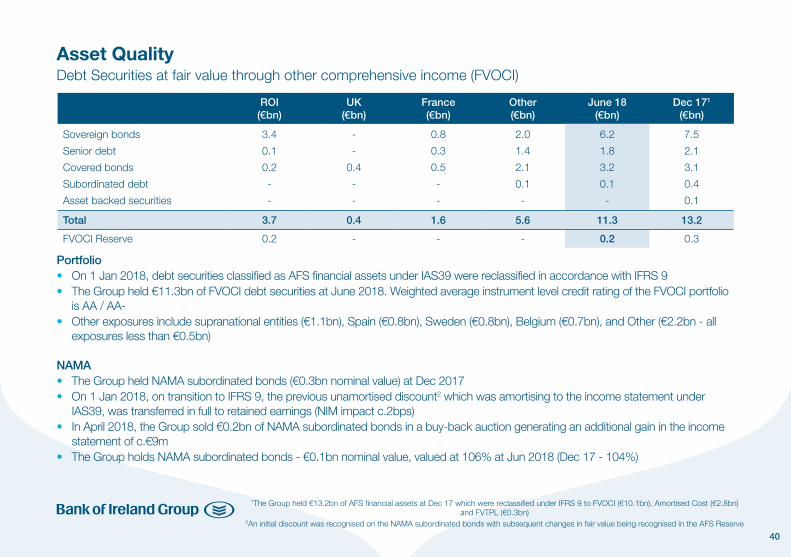
Portfolio• On 1 Jan 2018, debt securities classified as AFS financial assets under IAS39 were reclassified in accordance with IFRS 9• The Group held €11.3bn of FVOCI debt securities at June 2018. Weighted average instrument level credit rating of the FVOCI portfolio
is AA / AA-• Other exposures include supranational entities (€1.1bn), Spain (€0.8bn), Sweden (€0.8bn), Belgium (€0.7bn), and Other (€2.2bn - all
exposures less than €0.5bn)
NAMA • The Group held NAMA subordinated bonds (€0.3bn nominal value) at Dec 2017• On 1 Jan 2018, on transition to IFRS 9, the previous unamortised discount2 which was amortising to the income statement under
IAS39, was transferred in full to retained earnings (NIM impact c.2bps)• In April 2018, the Group sold €0.2bn of NAMA subordinated bonds in a buy-back auction generating an additional gain in the income
statement of c.€9m• The Group holds NAMA subordinated bonds - €0.1bn nominal value, valued at 106% at Jun 2018 (Dec 17 - 104%)
Asset QualityDebt Securities at fair value through other comprehensive income (FVOCI)
ROI(€bn)
UK(€bn)
France(€bn)
Other(€bn)
June 18(€bn)
Dec 171
(€bn)
Sovereign bonds
Senior debt
Covered bonds
Subordinated debt
Asset backed securities
3.4
0.1
0.2
-
-
-
-
0.4
-
-
0.8
0.3
0.5
-
-
2.0
1.4
2.1
0.1
-
6.2
1.8
3.2
0.1
-
7.5
2.1
3.1
0.4
0.1
Total 3.7 0.4 1.6 5.6 11.3 13.2
FVOCI Reserve 0.2 - - - 0.2 0.3
1The Group held €13.2bn of AFS financial assets at Dec 17 which were reclassified under IFRS 9 to FVOCI (€10.1bn), Amortised Cost (€2.8bn) and FVTPL (€0.3bn)
2An initial discount was recognised on the NAMA subordinated bonds with subsequent changes in fair value being recognised in the AFS Reserve
41
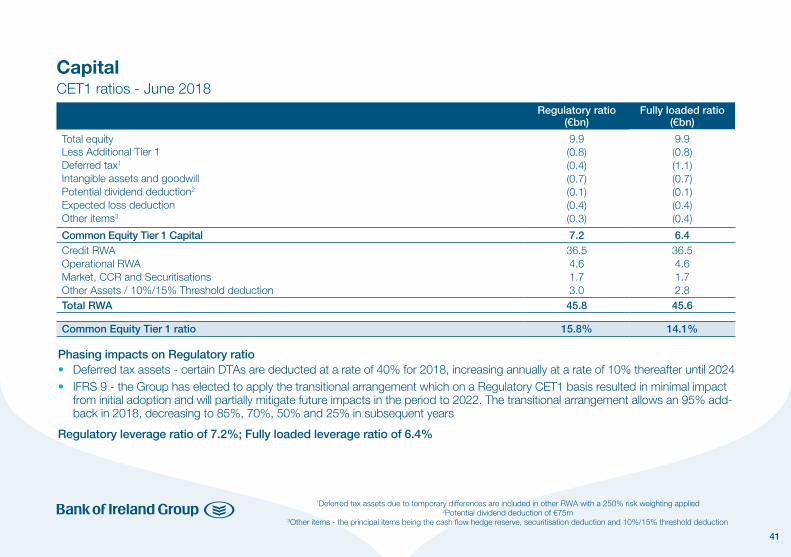
Phasing impacts on Regulatory ratio• Deferred tax assets - certain DTAs are deducted at a rate of 40% for 2018, increasing annually at a rate of 10% thereafter until 2024• IFRS 9 - the Group has elected to apply the transitional arrangement which on a Regulatory CET1 basis resulted in minimal impact
from initial adoption and will partially mitigate future impacts in the period to 2022. The transitional arrangement allows an 95% add-back in 2018, decreasing to 85%, 70%, 50% and 25% in subsequent years
Regulatory leverage ratio of 7.2%; Fully loaded leverage ratio of 6.4%
CapitalCET1 ratios - June 2018
1Deferred tax assets due to temporary differences are included in other RWA with a 250% risk weighting applied2Potential dividend deduction of €75m
3Other items - the principal items being the cash flow hedge reserve, securitisation deduction and 10%/15% threshold deduction
Regulatory ratio(€bn)
Fully loaded ratio(€bn)
Total equityLess Additional Tier 1Deferred tax1
Intangible assets and goodwillPotential dividend deduction2
Expected loss deductionOther items3
9.9(0.8)(0.4)(0.7)(0.1)(0.4)(0.3)
9.9(0.8)(1.1)(0.7)(0.1)(0.4)(0.4)
Common Equity Tier 1 Capital 7.2 6.4Credit RWAOperational RWAMarket, CCR and SecuritisationsOther Assets / 10%/15% Threshold deduction
36.54.61.73.0
36.54.61.72.8
Total RWA 45.8 45.6
Common Equity Tier 1 ratio 15.8% 14.1%

42
Capital Guidance and Distribution Policy
Capital Guidance
Distribution Policy
H1 2018 Position
• The Group expects to maintain a CET1 ratio in excess of 13% on a regulatory basis and on a fully loaded basis by the end of the O-SII phase-in period1
• This includes meeting applicable regulatory capital requirements plus an appropriate management buffer
• Regulatory rules require that a deduction is made at the half year in respect of potential dividends; in that regard the Group has made a deduction of €75m (c.20bps) in arriving at its CET1 ratio of 14.1% which is equivalent to an annualised dividend per share of 14c
• The Group recommenced the payment of dividends with a payment of €124m equivalent to 11.5c per share in respect of the 2017 financial year
• The Group expects that dividends will increase on a prudent and progressive basis and, over time, will build towards a payout ratio of around 50% of sustainable earnings
• Dividend level and rate of progression will reflect, amongst other things: • Strength of the Group’s capital and capital generation; • Board’s assessment of growth and investment opportunities available; • Any capital the Group retains to cover uncertainties; and • Any impact from the evolving regulatory and accounting environments • Other means of capital distribution will be considered to the extent the Group has excess capital
1The Other Systemically Important Institution (O-SII) buffer will be introduced at 0.5% in July 2019, increasing to 1.0% in July 2020 and 1.5% in July 2021
43
Ordinary shareholders’ equity and TNAV
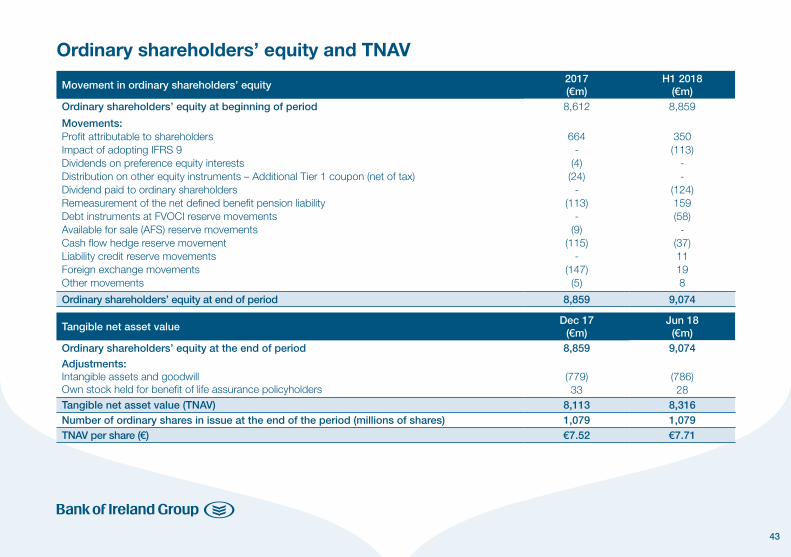
Movement in ordinary shareholders’ equity2017(€m)
H1 2018(€m)
Ordinary shareholders’ equity at beginning of period 8,612 8,859
Movements:Profit attributable to shareholdersImpact of adopting IFRS 9Dividends on preference equity interestsDistribution on other equity instruments – Additional Tier 1 coupon (net of tax)Dividend paid to ordinary shareholdersRemeasurement of the net defined benefit pension liability Debt instruments at FVOCI reserve movementsAvailable for sale (AFS) reserve movementsCash flow hedge reserve movementLiability credit reserve movementsForeign exchange movementsOther movements
664-
(4)(24)
-(113)
-(9)
(115)-
(147)(5)
350(113)
--
(124)159(58)
-(37)11198
Ordinary shareholders’ equity at end of period 8,859 9,074
Tangible net asset value Dec 17
(€m)Jun 18(€m)
Ordinary shareholders’ equity at the end of period 8,859 9,074
Adjustments:Intangible assets and goodwillOwn stock held for benefit of life assurance policyholders
(779)33
(786)28
Tangible net asset value (TNAV) 8,113 8,316Number of ordinary shares in issue at the end of the period (millions of shares) 1,079 1,079TNAV per share (€) €7.52 €7.71
44
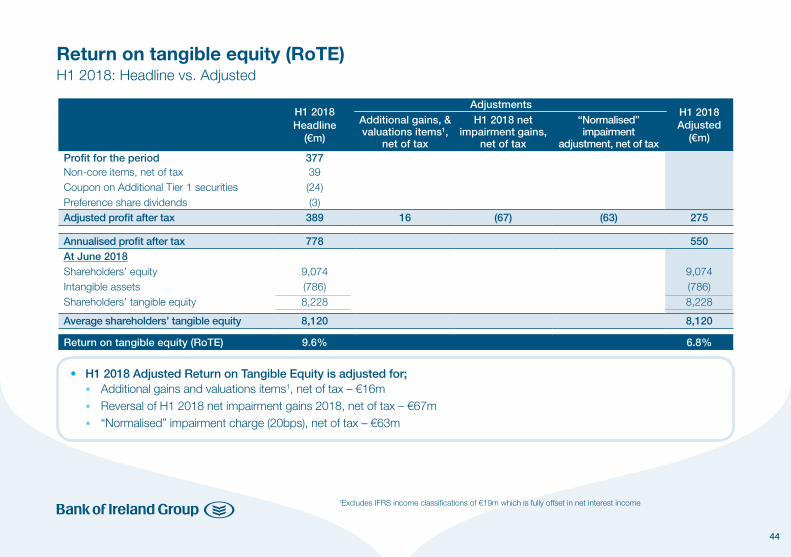
Return on tangible equity (RoTE)H1 2018: Headline vs. Adjusted
H1 2018Headline
(€m)
Additional gains, & valuations items1,
net of tax
H1 2018 net impairment gains,
net of tax
“Normalised” impairment
adjustment, net of tax
H1 2018Adjusted
(€m)
Profit for the period 377Non-core items, net of taxCoupon on Additional Tier 1 securitiesPreference share dividends
39(24)(3)
Adjusted profit after tax 389 16 (67) (63) 275
Annualised profit after tax 778 550At June 2018Shareholders’ equityIntangible assetsShareholders’ tangible equity
9,074(786)8,228
9,074(786)8,228
Average shareholders’ tangible equity 8,120 8,120
Return on tangible equity (RoTE) 9.6% 6.8%
• H1 2018 Adjusted Return on Tangible Equity is adjusted for; • Additional gains and valuations items1, net of tax – €16m • Reversal of H1 2018 net impairment gains 2018, net of tax – €67m • “Normalised” impairment charge (20bps), net of tax – €63m
1Excludes IFRS income classifications of €19m which is fully offset in net interest income
Adjustments
45
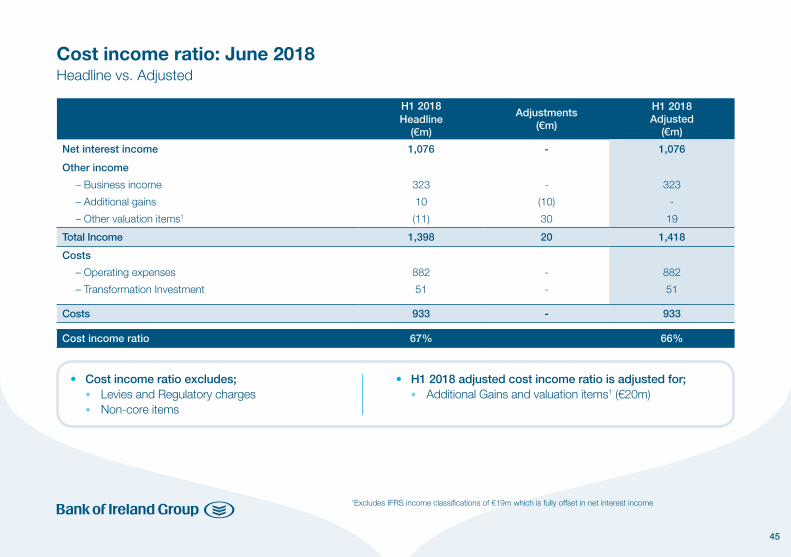
Cost income ratio: June 2018Headline vs. Adjusted
H1 2018Headline
(€m)
Adjustments(€m)
H1 2018Adjusted
(€m)
Net interest income 1,076 - 1,076
Other income
– Business income
– Additional gains
– Other valuation items1
323
10
(11)
-
(10)
30
323
-
19
Total Income 1,398 20 1,418
Costs
– Operating expenses
– Transformation Investment
882
51
-
-
882
51
Costs 933 - 933
Cost income ratio 67% 66%
• Cost income ratio excludes; • Levies and Regulatory charges • Non-core items
• H1 2018 adjusted cost income ratio is adjusted for; • Additional Gains and valuation items1 (€20m)
1Excludes IFRS income classifications of €19m which is fully offset in net interest income
46
61%
24%
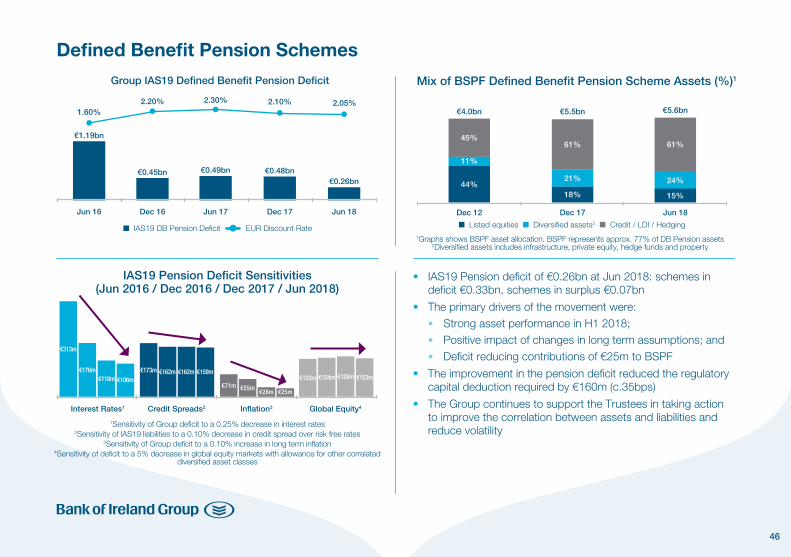
Defined Benefit Pension Schemes
Mix of BSPF Defined Benefit Pension Scheme Assets (%)1
45%61%
11%
21%44%
18% 15%
Dec 17 Jun 18Dec 12
n Listed equities n Diversified assets2 n Credit / LDI / Hedging1Graphs shows BSPF asset allocation. BSPF represents approx. 77% of DB Pension assets
2Diversified assets includes infrastructure, private equity, hedge funds and property
€5.6bn€4.0bn €5.5bn
• IAS19 Pension deficit of €0.26bn at Jun 2018: schemes in deficit €0.33bn, schemes in surplus €0.07bn
• The primary drivers of the movement were: • Strong asset performance in H1 2018; • Positive impact of changes in long term assumptions; and • Deficit reducing contributions of €25m to BSPF
• The improvement in the pension deficit reduced the regulatory capital deduction required by €160m (c.35bps)
• The Group continues to support the Trustees in taking action to improve the correlation between assets and liabilities and reduce volatility
IAS19 Pension Deficit Sensitivities(Jun 2016 / Dec 2016 / Dec 2017 / Jun 2018)
Interest Rates1 Credit Spreads2 Inflation3 Global Equity4
1Sensitivity of Group deficit to a 0.25% decrease in interest rates2Sensitivity of IAS19 liabilities to a 0.10% decrease in credit spread over risk free rates
3Sensitivity of Group deficit to a 0.10% increase in long term inflation4Sensitivity of deficit to a 5% decrease in global equity markets with allowance for other correlated
diversified asset classes
€313m
€122m€176m
€55m
€124m €123m€118m €106m
€28m €25m
€128m€173m €162m €162m €159m
€71m
n IAS19 DB Pension Deficit EUR Discount Rate
Group IAS19 Defined Benefit Pension Deficit
€1.19bn
€0.45bn €0.48bn€0.26bn
€0.49bn
Jun 16 Dec 16 Jun 17 Dec 17 Jun 18
1.60%2.20% 2.30% 2.10% 2.05%

47
Contact details
For further information please contact:
• Group Chief Financial Officer Andrew Keating tel: +353 76 623 5141 [email protected]
• Investor Relations Alan Hartley tel: +353 76 623 4850 [email protected]
Niall Murphy tel: +353 76 624 1385 [email protected]
• Chief Executive of Markets and Treasury Sean Crowe tel: +353 76 623 4720 [email protected]
• Capital Management Lorraine Smyth tel: +353 76 624 8409 [email protected]
Alan McNamara tel: +353 76 624 8725 [email protected]
Alan Elliott tel: +353 76 624 4371 [email protected]
• Wholesale Funding Darach O’Leary tel: +353 76 624 4224 [email protected]
Redmond O’Leary tel: +353 76 624 4198 [email protected]
• Investor Relations website www.bankofireland.com/investor
48
Forward-Looking statement
This document contains forward-looking statements with respect to certain of Bank of Ireland Group plc (‘BOIG plc’) and its subsidiaries’ (collectively the ‘Group’) plans and its current goals and expectations relating to its future financial condition and performance, the markets in which it operates and its future capital requirements. These forward-looking statements often can be identified by the fact that they do not relate only to historical or current facts. Generally, but not always, words such as ‘may,’ ‘could,’ ‘should,’ ‘will,’ ‘expect,’ ‘intend,’ ‘estimate,’ ‘anticipate,’ ‘assume,’ ‘believe,’ ‘plan,’ ‘seek,’ ‘continue,’ ‘target,’ ‘goal,’ ‘would,’ or their negative variations or similar expressions identify forward-looking statements, but their absence does not mean that a statement is not forward-looking.
Examples of forward-looking statements include, among others: statements regarding the Group’s near term and longer term future capital requirements and ratios, level of ownership by the Irish Government, loan to deposit ratios, expected impairment losses, the level of the Group’s assets, the Group’s financial position, future income, business strategy, projected costs, margins, future payment of dividends, the implementation of changes in respect of certain of the Group’s pension schemes, estimates of capital expenditures, discussions with Irish, United Kingdom, European and other regulators and plans and objectives for future operations. Such forward-looking statements are inherently subject to risks and uncertainties, and hence actual results may differ materially from those expressed or implied by such forward-looking statements.
Investors should read ‘Principal Risks and Uncertainties’ in the Group’s Interim report for the 6 months ended 30 June 2018 beginning on page 38 and also the discussion of risk in the Group’s Annual Report for the year ended 31 December 2017.
Nothing in this document should be considered to be a forecast of future profitability, dividends or financial position of the Group and none of the information in this document is or is intended to be a profit forecast, dividend forecast or profit estimate. Any forward-looking statement speaks only as at the date it is made. The Group does not undertake to release publicly any revision to these forward-looking statements to reflect events, circumstances or unanticipated events occurring after the date hereof.


Recommended