IET Research Journals
This paper is a preprint of a paper submitted to IET Renewable Power Generation and is subjectto Institution of Engineering and Technology Copyright. If accepted, the copy of record will beavailable at IET Digital Library.
Automated Distribution System Planning forLarge-Scale Network Integration Studies
ISSN 1751-8644doi: 0000000000www.ietdl.org
Alexander Scheidler1 , Leon Thurner2, Martin Braun1,2
1Fraunhofer Institute for Wind Energy and Energy System Technology (IWES), 34119 Kassel, Germany2Department of Energy Management and Power System Operation, University of Kassel, 34119 Kassel, Germany
E-mail: [email protected]
Abstract:Network integration studies try to assess the impact of future developments, such as the increase of Renewable Energy Sourcesor the introduction of Smart Grid Technologies, on large-scale network areas. Goals can be to support strategic alignment in theregulatory framework or to adapt the network planning principles of Distribution System Operators. This study outlines an approachfor the automated distribution system planning that can calculate network reconfiguration, reinforcement and extension plans ina fully automated fashion. This allows the estimation of the expected cost in massive probabilistic simulations of large numbersof real networks and constitutes a core component of a framework for large-scale network integration studies. Exemplary casestudy results are presented that were performed in cooperation with different major distribution system operators. The case studiescover the estimation of expected network reinforcement costs, technical and economical assessment of smart grid technologiesand structural network optimisation.
1 Introduction
In recent years various system-wide network integration studies (e.g.nation-wide, state-wide, DSO-wide) have been conducted in Ger-many [1–6] (also the authors are conducting such a study at themoment). The goal of these studies is to estimate the expected costsfor the integration of Renewable Energy Sources (RES) in the dis-tribution system based on different RES installation scenarios andto assess the technical and economic impact of innovative equip-ment and control strategies. Such system-wide network integrationstudies can support the strategic alignment in the regulatory frame-work as well as help to adapt the network planning principles of theDistribution System Operators (DSOs). A focus in these studies is:
• Determination of the maximum RES hosting capacity of thedistribution networks in the considered area.• Determination of the expected costs for RES integration in thedistribution system.• Techno-economic assessment of smart grid applications toincrease the RES hosting capacity and to decrease the RES integra-tion costs.
In the medium and low voltage level such studies are often per-formed on representative networks, which are chosen on the basis ofstructural parameters like residents per square kilometer, expectedRES installation or length of feeders. The representative networksare either built as generic network models [2, 4] or representativereal networks are chosen based on a cluster analysis of the networkparameters [1, 4]. A recent network integration study considers 130network models of real HV, MV and LV networks [6]. The resultsare then extrapolated on a system-wide perspective.
Several studies at the Fraunhofer IWES and the University ofKassel that investigated a large number of real distribution networksshow a considerable variation in the results and the obtained findings[7]. Especially the technical and economic assessment of differenttechnical measures in the network planning process show a highlocal or regional diversity which can hardly be covered by character-istic network models. A high sample size is therefore crucial for theaccuracy of the results in RES network integration studies. However,investigating a large number of networks is only possible with a high
degree of automation. Data import, analysis of the research objectiveand export of the results all have to be automated, so that the wholeprocess can be carried out with minimum manual engagement.
To estimate the cost of RES integration and to be able to eco-nomically compare different technologies and planning principles, itis necessary to calculate the cost of the classic network planningmeasures. These measures include network reconfiguration (e.g.reconfiguration of feeders), reinforcement (e.g. the increase of diam-eters of lines) and extension (e.g. founding new substations). Somenetwork integration studies rely on the help of experienced networkplanners who plan the necessary network development for selectedrepresentative networks. However, in the scope of automation of net-work integration studies the calculation of the expected cost must becarried out fully automatized while it should still generate reason-able realistic solutions. The purpose of this paper is to present ourautomated distribution system planning framework that covers bothrequirements.
Section 2 briefly sketches the usual process of conducting auto-mated network integration studies. Section 3 introduces the networkplanning problem and Section 4 presents our approach for its solu-tion. In Section 5 we present findings from four different networkintegration studies performed in collaboration with 4 different Dis-tribution System Operators (DSO). Finally, in Section 6 we concludeand discuss possible future research questions.
2 Automated Network Integration Studies
Network integration studies usually involve one or more DSO(s),who provide the basic data that is necessary to conduct the study.Typically, the data comprises a (possibly large) number of realdistribution network models. Moreover, the DSO’s basic networkplaning rules and specific constraints are specified. This includesthe definition of different worst case load cases (e.g. high feed-incase, high load case, n-1 case), the allowed network developmentmeasures and the associated cost assumptions. Additionally, differ-ent RES integration scenarios, i.e. possible future development ofRES in the considered area, are either provided by the DSO or devel-oped as part of the study. Finally, the specific research questions ofthe study are defined, for example which Smart Grid Technologiesshould be investigated.
IET Research Journals, pp. 1–8c© The Institution of Engineering and Technology 2015 1
The network data is mostly provided by the DSO(s) in a commer-cial network calculation software format like PowerFactoy, Sincal,NEPLAN, CYME, etc. As a first step we convert all network modelsinto the pandapower format. pandapower∗ is a Python basedopen source module that is aimed at automation of power systemanalysis and optimization in distribution and sub-transmission net-works [8]. The software is a joint development of the Universityof Kassel and the Fraunhofer IWES. It was hitherto the basis ofnumerous network integration studies [7].
The possibly large number of networks in conjunction with thecombinatorial complexity of the input parameters and the simulationof different probabilistic distributions of RES often leads to severalthousands independent simulation runs. In order to cope with thishigh number mostly a HPC cluster is utilized.
A single simulation run typically investigates a specific networkand a specific combination of parameters. That is, a certain ran-dom distribution of RES and loads is installed in the network modeland active elements that model Smart Grid components are added.For the resulting network model it is then checked if violations ofconstraints in any of the considered load cases occur. In case ofviolations the automated network planning is started to find a combi-nation of reconfiguration, reinforcement and extension measures thatensures safe operation of the network while being as cost-efficient aspossible. The main result is an estimation of the expected networkreinforcement cost for the specific network.
Finally, the results of all simulation runs are collected and statis-tically evaluated over the different parameter sets (RES scenarios,Smart Grid technologies, ect.).
3 Automated Network Planning
The automated network planning is a core component of ourapproach to conduct large-scale network studies that involve esti-mating RES integration cost. In the remainder of this paper we willfocus on this component. We consider a single simulation run outof possibly thousands and assume a readily parameterized networkmodel that is in a state that violates one or more given constraints.The goal is then to find a cost-optimal set of network reconfiguration,reinforcement and expansion measures that would bring the networkinto a valid state. This section introduces the network planning prob-lem and its formalization as a combinatorial optimization problem.The solution of the problem is discussed in Section 4.
3.1 An Introductory Example
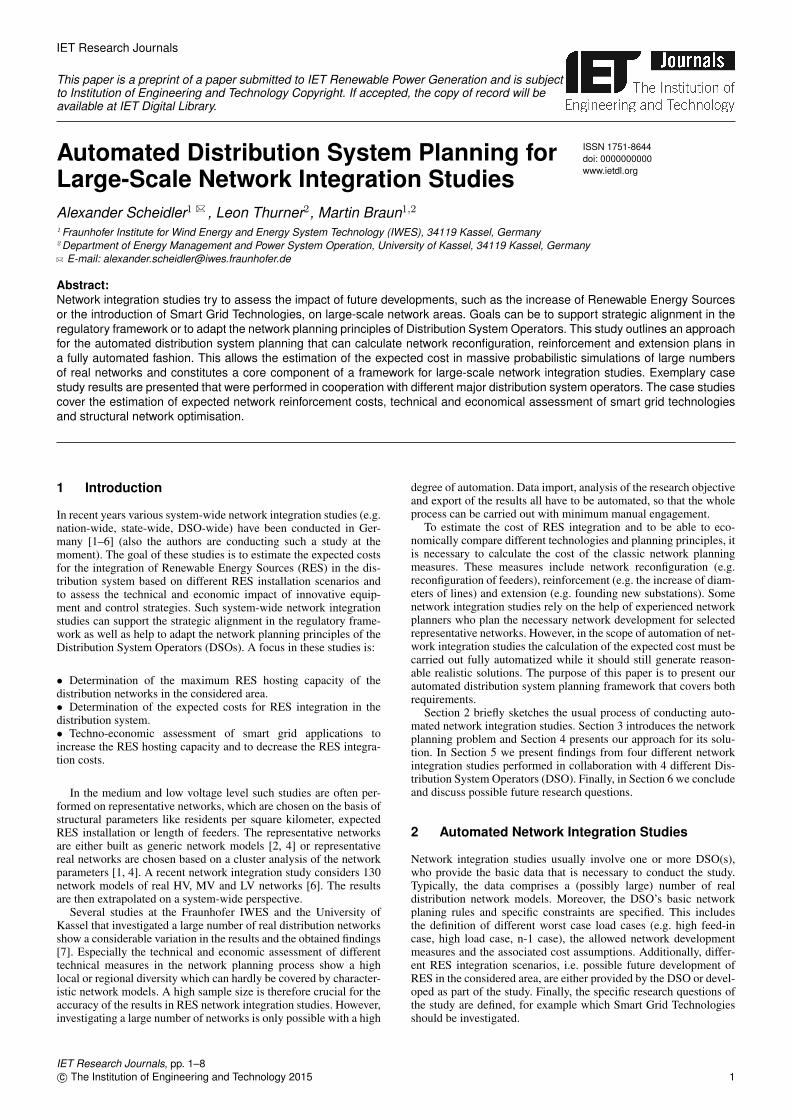
The proposed approach is introduced with the help of an example.Figure 1a shows a medium voltage ring with 6 lines, 5 MV/LV sub-stations modelled as load points and 10 load-break-switches. Due toan increase in RES the bus voltage in the considered high feed-inscenario exceeds the voltage limit at several stations (see Figure 1b).Therefore, from the network planning point of view the network isnot valid in its current state. To ensure its safe operation, the networkhas to be reconfigured, reinforced or extended so that all constraintsare complied with.
We call every possible action that could be taken by a human net-work planner an abstract measure. A measure is a single action thatcan be applied to the network model and that changes one or sev-eral properties of the model. A measure is atomic in the sense thatit can either be applied or not. In case of the example we considerreplacing existing lines by new lines with higher diameter as possiblemeasures. The set of measures M is then given as:
M = {REPLACE_LINE_1, . . . , REPLACE_LINE_6 } (1)
We can now treat the planning problem as a combinatorial opti-mization problem. The overall optimization goal is to find a setof measures with minimal cost, that leads to a network state thatcomplies with all technical constraints.
∗www.uni-kassel.de/go/pandapower
HV/MV
Line 1 Line 2 Line 3
8 km
Line 4Line 5Line 6
Switch 1
Switch 6
(closed)
(open)
7 km 5 km
6 km9 km4 km
(a) Medium voltage line ring with 6 lines, 5 load points and 10 load-break-
switches
(b) Voltage profile; installation of PV plants leads to voltage band violation
Fig. 1: Example network
Formally, a solution s is a subset of the available measures s ⊆M . A solution s corresponds to a network state that is the result ofthe application of all measures in s on the initial network state. Ifthe resulting network complies with all given constraints we call s afeasible solution.
A solution has associated costs c(s). In our example we definethe cost of a solution as the sum of the costs cm of all individualmeasures in the solution:
c(s) =∑m∈s
cm (2)
Here we assume that the costs of a replacement measure is equal tothe length of the replaced line.
In order to find the cost optimal network plan for the example weneed to find a feasible solution s∗ ⊆M that minimizes c(s):
minimizes⊆M
c(s)
subject to lpvv(s) = 0,(3)
where lpvv(s) gives the number of load points (lp) where thevoltage limit is violated after the application of s.
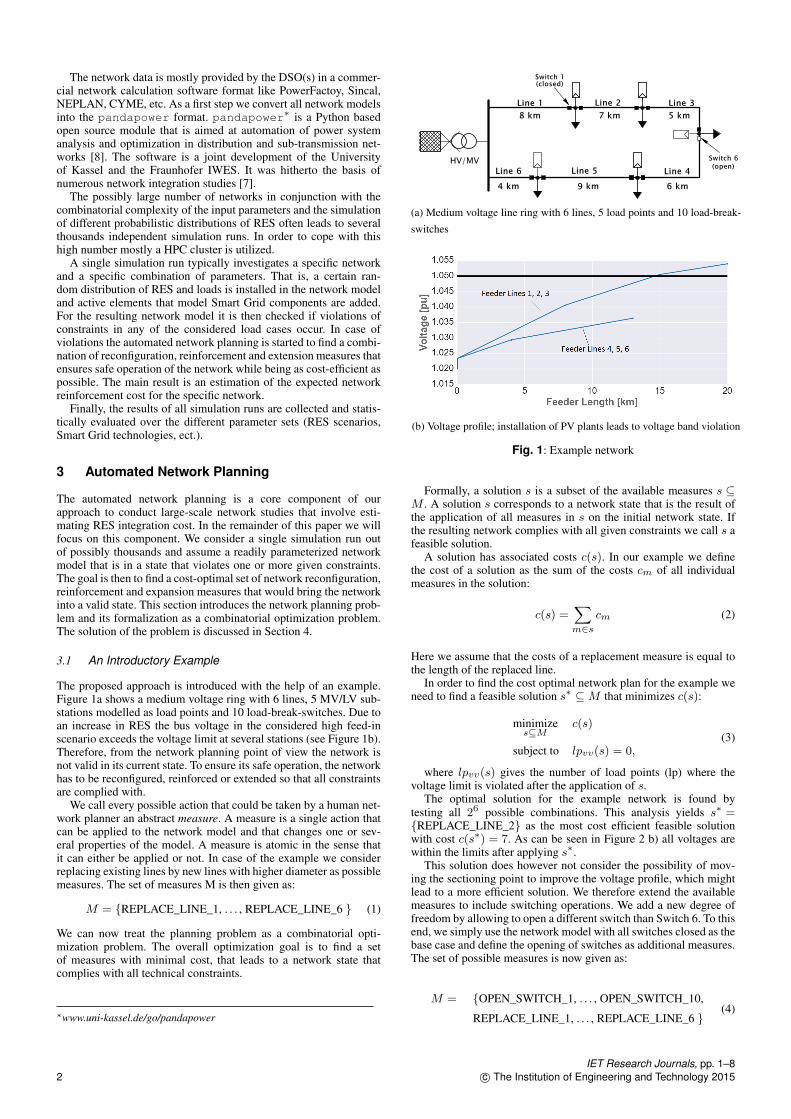
The optimal solution for the example network is found bytesting all 26 possible combinations. This analysis yields s∗ ={REPLACE_LINE_2} as the most cost efficient feasible solutionwith cost c(s∗) = 7. As can be seen in Figure 2 b) all voltages arewithin the limits after applying s∗.
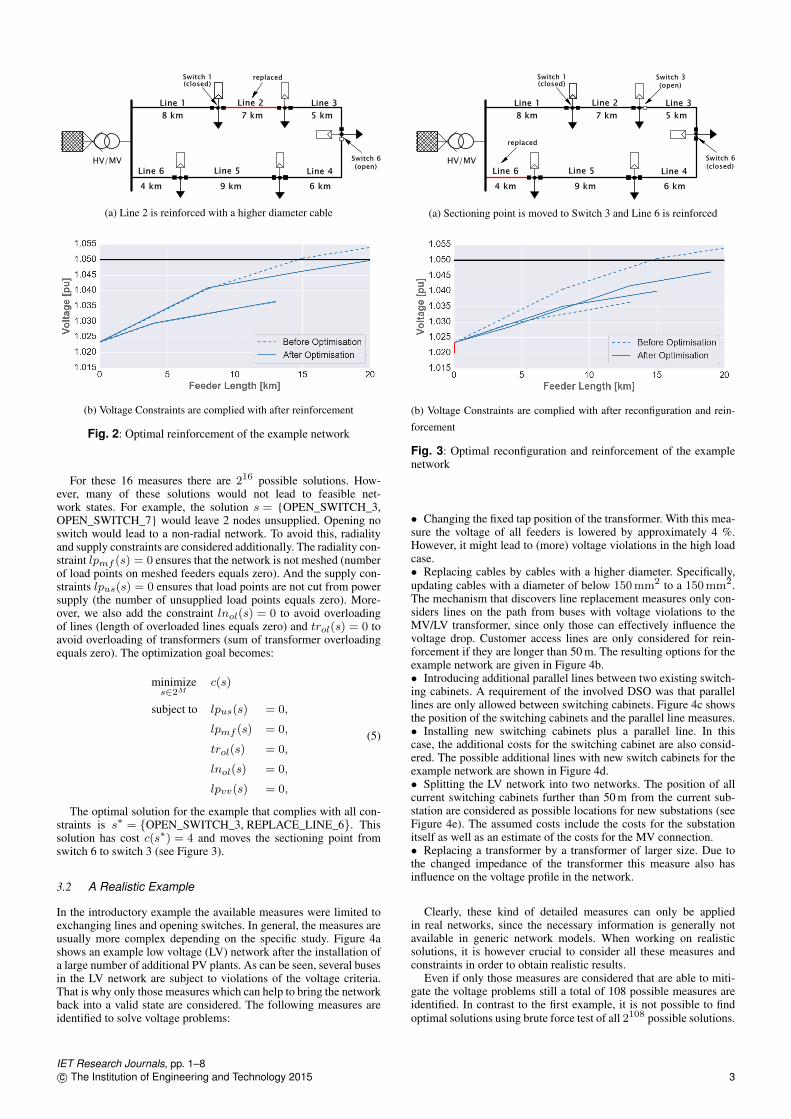
This solution does however not consider the possibility of mov-ing the sectioning point to improve the voltage profile, which mightlead to a more efficient solution. We therefore extend the availablemeasures to include switching operations. We add a new degree offreedom by allowing to open a different switch than Switch 6. To thisend, we simply use the network model with all switches closed as thebase case and define the opening of switches as additional measures.The set of possible measures is now given as:
M = {OPEN_SWITCH_1, . . . , OPEN_SWITCH_10,
REPLACE_LINE_1, . . . , REPLACE_LINE_6 }(4)
IET Research Journals, pp. 1–82 c© The Institution of Engineering and Technology 2015
HV/MV
Line 1 Line 2 Line 3
8 km
Line 4Line 5Line 6
Switch 6
(open)
7 km 5 km
6 km9 km4 km
replacedSwitch 1(closed)
(a) Line 2 is reinforced with a higher diameter cable
(b) Voltage Constraints are complied with after reinforcement
Fig. 2: Optimal reinforcement of the example network
For these 16 measures there are 216 possible solutions. How-ever, many of these solutions would not lead to feasible net-work states. For example, the solution s = {OPEN_SWITCH_3,OPEN_SWITCH_7} would leave 2 nodes unsupplied. Opening noswitch would lead to a non-radial network. To avoid this, radialityand supply constraints are considered additionally. The radiality con-straint lpmf (s) = 0 ensures that the network is not meshed (numberof load points on meshed feeders equals zero). And the supply con-straints lpus(s) = 0 ensures that load points are not cut from powersupply (the number of unsupplied load points equals zero). More-over, we also add the constraint lnol(s) = 0 to avoid overloadingof lines (length of overloaded lines equals zero) and trol(s) = 0 toavoid overloading of transformers (sum of transformer overloadingequals zero). The optimization goal becomes:
minimizes∈2M
c(s)
subject to lpus(s) = 0,
lpmf (s) = 0,
trol(s) = 0,
lnol(s) = 0,
lpvv(s) = 0,
(5)
The optimal solution for the example that complies with all con-straints is s∗ = {OPEN_SWITCH_3, REPLACE_LINE_6}. Thissolution has cost c(s∗) = 4 and moves the sectioning point fromswitch 6 to switch 3 (see Figure 3).
3.2 A Realistic Example
In the introductory example the available measures were limited toexchanging lines and opening switches. In general, the measures areusually more complex depending on the specific study. Figure 4ashows an example low voltage (LV) network after the installation ofa large number of additional PV plants. As can be seen, several busesin the LV network are subject to violations of the voltage criteria.That is why only those measures which can help to bring the networkback into a valid state are considered. The following measures areidentified to solve voltage problems:
HV/MV
Line 1 Line 2 Line 3
8 km
Line 4Line 5Line 6
Switch 3
(open)
7 km 5 km
6 km9 km4 km
replaced
Switch 6
(closed)
Switch 1(closed)
(a) Sectioning point is moved to Switch 3 and Line 6 is reinforced
(b) Voltage Constraints are complied with after reconfiguration and rein-
forcement
Fig. 3: Optimal reconfiguration and reinforcement of the examplenetwork
• Changing the fixed tap position of the transformer. With this mea-sure the voltage of all feeders is lowered by approximately 4 %.However, it might lead to (more) voltage violations in the high loadcase.• Replacing cables by cables with a higher diameter. Specifically,updating cables with a diameter of below 150mm2 to a 150mm2.The mechanism that discovers line replacement measures only con-siders lines on the path from buses with voltage violations to theMV/LV transformer, since only those can effectively influence thevoltage drop. Customer access lines are only considered for rein-forcement if they are longer than 50 m. The resulting options for theexample network are given in Figure 4b.• Introducing additional parallel lines between two existing switch-ing cabinets. A requirement of the involved DSO was that parallellines are only allowed between switching cabinets. Figure 4c showsthe position of the switching cabinets and the parallel line measures.• Installing new switching cabinets plus a parallel line. In thiscase, the additional costs for the switching cabinet are also consid-ered. The possible additional lines with new switch cabinets for theexample network are shown in Figure 4d.• Splitting the LV network into two networks. The position of allcurrent switching cabinets further than 50 m from the current sub-station are considered as possible locations for new substations (seeFigure 4e). The assumed costs include the costs for the substationitself as well as an estimate of the costs for the MV connection.• Replacing a transformer by a transformer of larger size. Due tothe changed impedance of the transformer this measure also hasinfluence on the voltage profile in the network.
Clearly, these kind of detailed measures can only be appliedin real networks, since the necessary information is generally notavailable in generic network models. When working on realisticsolutions, it is however crucial to consider all these measures andconstraints in order to obtain realistic results.
Even if only those measures are considered that are able to miti-gate the voltage problems still a total of 108 possible measures areidentified. In contrast to the first example, it is not possible to findoptimal solutions using brute force test of all 2108 possible solutions.
IET Research Journals, pp. 1–8c© The Institution of Engineering and Technology 2015 3
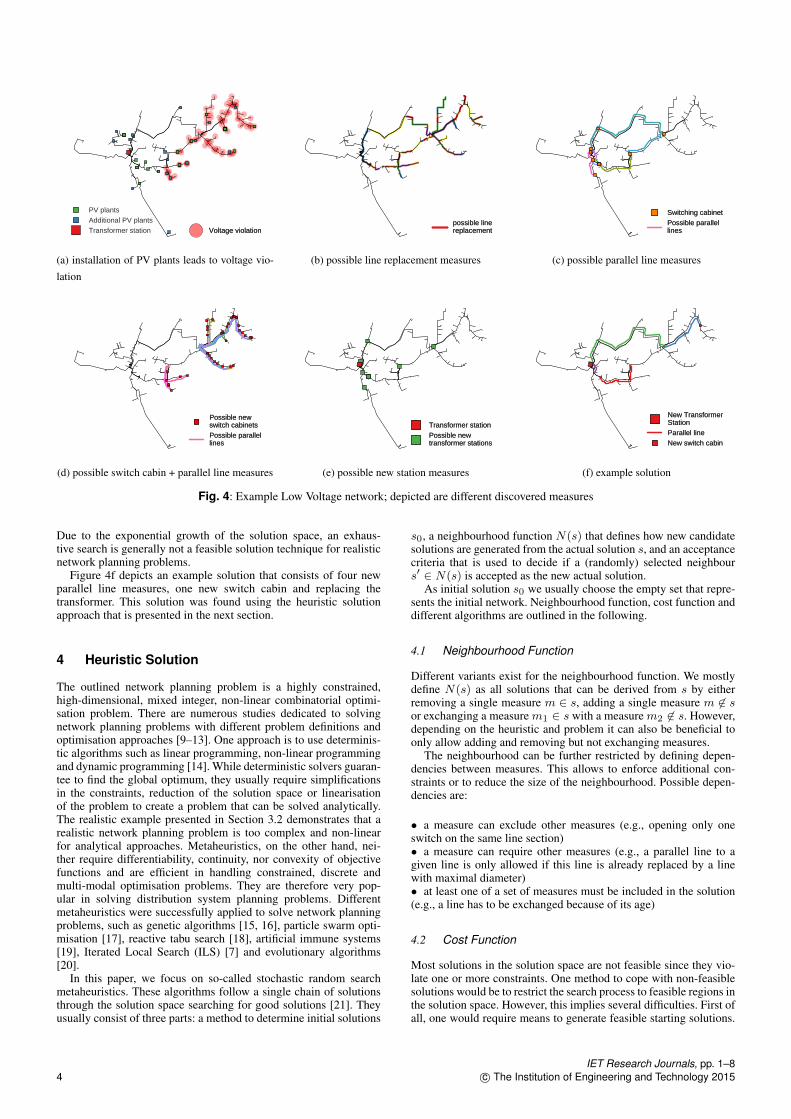
PV plantsAdditional PV plantsTransformer station Voltage violationVoltage violation
(a) installation of PV plants leads to voltage vio-
lation
possible linereplacementpossible linereplacement
(b) possible line replacement measures
Switching cabinetPossible parallellines
Switching cabinetPossible parallellines
(c) possible parallel line measures
Possible newswitch cabinetsPossible parallellines
Possible newswitch cabinetsPossible parallellines
(d) possible switch cabin + parallel line measures
Transformer stationPossible newtransformer stations
Transformer stationPossible newtransformer stations
(e) possible new station measures
New TransformerStationParallel lineNew switch cabin
New TransformerStationParallel lineNew switch cabin
(f) example solution
Fig. 4: Example Low Voltage network; depicted are different discovered measures
Due to the exponential growth of the solution space, an exhaus-tive search is generally not a feasible solution technique for realisticnetwork planning problems.
Figure 4f depicts an example solution that consists of four newparallel line measures, one new switch cabin and replacing thetransformer. This solution was found using the heuristic solutionapproach that is presented in the next section.
4 Heuristic Solution
The outlined network planning problem is a highly constrained,high-dimensional, mixed integer, non-linear combinatorial optimi-sation problem. There are numerous studies dedicated to solvingnetwork planning problems with different problem definitions andoptimisation approaches [9–13]. One approach is to use determinis-tic algorithms such as linear programming, non-linear programmingand dynamic programming [14]. While deterministic solvers guaran-tee to find the global optimum, they usually require simplificationsin the constraints, reduction of the solution space or linearisationof the problem to create a problem that can be solved analytically.The realistic example presented in Section 3.2 demonstrates that arealistic network planning problem is too complex and non-linearfor analytical approaches. Metaheuristics, on the other hand, nei-ther require differentiability, continuity, nor convexity of objectivefunctions and are efficient in handling constrained, discrete andmulti-modal optimisation problems. They are therefore very pop-ular in solving distribution system planning problems. Differentmetaheuristics were successfully applied to solve network planningproblems, such as genetic algorithms [15, 16], particle swarm opti-misation [17], reactive tabu search [18], artificial immune systems[19], Iterated Local Search (ILS) [7] and evolutionary algorithms[20].
In this paper, we focus on so-called stochastic random searchmetaheuristics. These algorithms follow a single chain of solutionsthrough the solution space searching for good solutions [21]. Theyusually consist of three parts: a method to determine initial solutions
s0, a neighbourhood function N(s) that defines how new candidatesolutions are generated from the actual solution s, and an acceptancecriteria that is used to decide if a (randomly) selected neighbours′ ∈ N(s) is accepted as the new actual solution.
As initial solution s0 we usually choose the empty set that repre-sents the initial network. Neighbourhood function, cost function anddifferent algorithms are outlined in the following.
4.1 Neighbourhood Function
Different variants exist for the neighbourhood function. We mostlydefine N(s) as all solutions that can be derived from s by eitherremoving a single measure m ∈ s, adding a single measure m 6∈ sor exchanging a measure m1 ∈ s with a measure m2 6∈ s. However,depending on the heuristic and problem it can also be beneficial toonly allow adding and removing but not exchanging measures.
The neighbourhood can be further restricted by defining depen-dencies between measures. This allows to enforce additional con-straints or to reduce the size of the neighbourhood. Possible depen-dencies are:
• a measure can exclude other measures (e.g., opening only oneswitch on the same line section)• a measure can require other measures (e.g., a parallel line to agiven line is only allowed if this line is already replaced by a linewith maximal diameter)• at least one of a set of measures must be included in the solution(e.g., a line has to be exchanged because of its age)
4.2 Cost Function
Most solutions in the solution space are not feasible since they vio-late one or more constraints. One method to cope with non-feasiblesolutions would be to restrict the search process to feasible regions inthe solution space. However, this implies several difficulties. First ofall, one would require means to generate feasible starting solutions.
IET Research Journals, pp. 1–84 c© The Institution of Engineering and Technology 2015
Yet, this is often a hard task in itself. Moreover, regions of feasi-ble solutions in the solution space do not need to be connected withrespect to the neighbourhood function and consequently the searchmight never reach certain regions in the solution space.
Instead of excluding non-feasible solutions, we extend the costfunction with the intend to guide the search process towards feasiblesolutions. To this end, the degree of constraint violation is includedin the cost function. More precisely, the cost function is defined as atuple of two values, where the first value of this tuple is a number thatrepresents the violated constraint and the second value representsthe strength of the violation. In case no constraint is violated thefirst value is zero and the second gives the cost c(s) of the solution.The cost of two solutions c′(s1) = (p1, v1) and c′(s2) = (p2, v2)is then compared lexicographically, that is, (p1, v1) < (p2, v2) iff(p1 < p2) ∨ (p1 = p2 ∧ v1 < v2).
The extended cost function for the example would then be:
c′(s) =
(5, lpus(s)), if lpus(s) > 0(4, lpmf (s)), if lpmf (s) > 0(3, trol(s)), if trol(s) > 0(2, lnol(s)), if lnol(s) > 0(1, lpvv(s)), if lpvv(s) > 0(0, c(s)), otherwise
(6)
4.3 Stochastic Random Search
Different stochastic random search algorithms can be implementedbased on the same cost and neighbourhood functions.
4.3.1 Hill Climbing (HC): One of the simplest stochastic ran-dom search algorithms is Hill Climbing. Hill Climbing starts withan initial solution s0 and iteratively moves to a random neighbour-ing solution if this step decreases the cost function. This is repeateduntil no improving step is available any more. As pseudo-code, thealgorithm can be written as:
1: procedure HILLCLIMBING(s0)2: s∗ ← s03: repeat4: Choose s′ ∈ N(s∗)5: if c(s′) < c(s∗) then6: s∗ = s′
7: end if8: until c(s) ≥ c(s∗), ∀s ∈ N(s∗)9: return s∗
10: end procedure
4.3.2 Iterated Local Search: Clearly, Hill Climbing willquickly end up in a local optimum. A valid approach for findingbetter solutions is then to just restart Hill Climbing several times.However, this would "forget" all information collected in the searchprocess so far. A different approach is to have means for a limitedacceptance of worsening moves. For example, to escape local optimaby slightly perturbing the actual solution. Iterated Local Search (ILS)does exactly this. In general, the search for better solutions in ILSoccurs in the reduced solution space defined by an arbitrary black-box heuristic. That is, ILS moves through the solution space from alocal optimum to neighbouring (improved) local optima. We use HillClimbing algorithm as local search algorithm for the ILS.
1: procedure ITERATEDLOCALSEARCH(s0)2: s∗ ← HillClimbing(s0)3: while not stopping criteria met do4: s′ ← Perturbate(s∗)5: s∗
′← HillClimbing(s′)
6: if c(s∗′) < c(s∗) then
7: s∗ = s∗′
8: end if9: end while
10: return s∗
11: end procedure
To perturbate a solution we simply move strength of arbitrary stepsin the neighbourhood of the solution:
1: procedure PERTURBATE(s′, strength)2: for strength steps do3: s′ ← Choose solution ∈ N(s′)4: end for5: return s′
6: end procedureFor the stopping criteria different variants can be used. In network
studies we usually stop ILS after a fixed number of iteration withoutimprovement.
4.3.3 Late Acceptance Hill Climbing: Late Acceptance Hill-Climbing (LAHC) is a local search algorithm, which accepts non-improving moves when a candidate cost function is better than itwas a number of iterations before [22]. It has been shown that LAHCperforms comparably to other well established heuristics like Simu-lated Annealing (SA) [23]. While SA and similar techniques follow acooling schedule that includes to calculate the cost difference in caseof worsening moves, this is not necessary in LAHC. This fact playswell with our definition of the cost function (it is not meaningful toquantify the difference between the cost values of two solutions thatlead to different constraint violations).
(3, 205)
(3, 210)tr
ol [%
] ILS_4_HC_AEILS_4_HCLAHC_50
(2, 0.05)
(2, 0.10)
lnol
[km
]
(1, 0)
(1, 0.01)
(1, 0.02)
lpvv
[p.u
.]
0 1000 2000 3000 4000number of cost function evaluations
(0, 5000)
(0, 10000)
c [E
UR
]
(a) Evolution of cost function values of the actual solution for different
Metaheuristics
HC
HC_A
E
ILS_
5_HC
_AE
LAHC
_50_
AE
45
50
55
60
65
70
75
cost
[TE
UR
]
HC
HC_A
E
ILS_
5_HC
_AE
LAHC
_50_
AE
26
28
30
32
34
36
cost
[TE
UR
]
(b) Comparison of the distributions of the best found solutions (50 runs,
5000 fitness evaluations) for two different networks
Fig. 5: Comparison of different Metaheuristics
4.4 Comparison of Algorithms
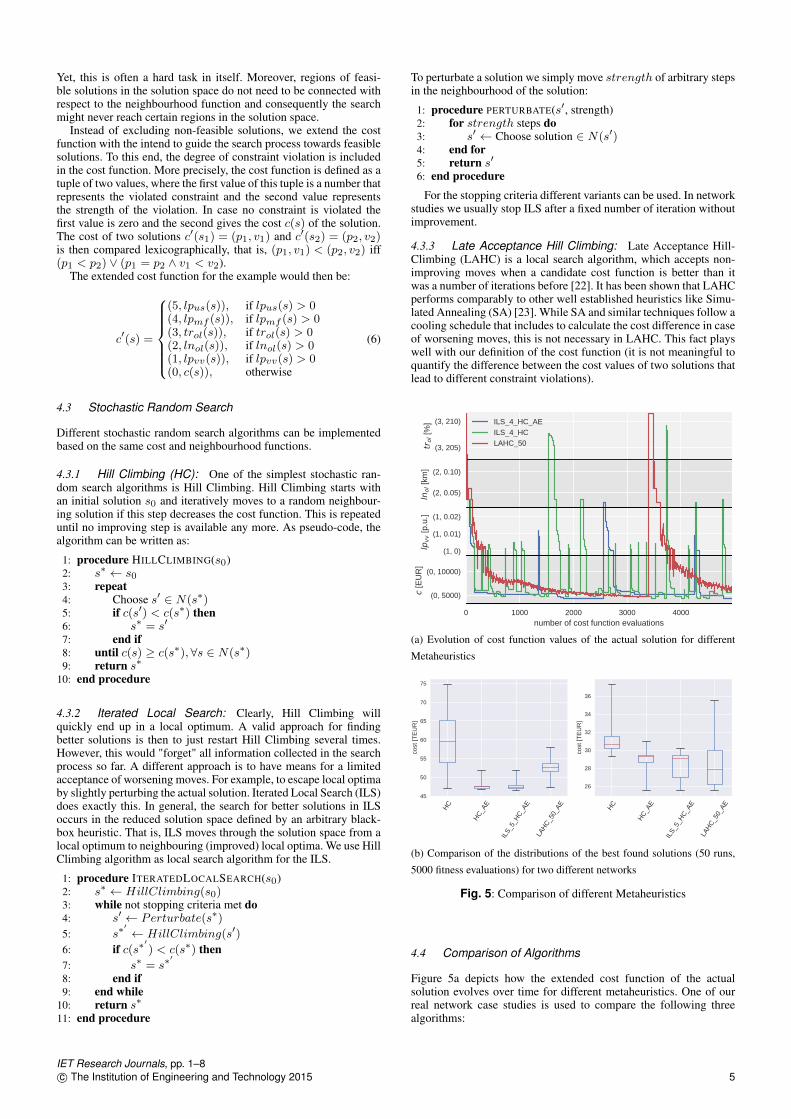
Figure 5a depicts how the extended cost function of the actualsolution evolves over time for different metaheuristics. One of ourreal network case studies is used to compare the following threealgorithms:
IET Research Journals, pp. 1–8c© The Institution of Engineering and Technology 2015 5
• ILS_4_HC: ILS with HC as local search, perturbation is done with4 random steps in the neighbourhood. The neighbourhood consist ofadding and removing measures.• ILS_4_HC_AE: same as ILS_4_HC, only that the neighbourhoodadditionally allows exchange (AE) of measures.• LAHC_50: LAHC with a threshold of 50 previous solutions
The y-axis is divided into 4 areas that represent the 4 different val-ues at the first position in the cost tuple: transformer overloading,line overloading, voltage violations and cost. For the ILS algorithms,perturbations are carried out repeatedly until 5000 cost functionevaluations are reached. Between two ILS iterations, the fitnessdecreases monotonic due to the Hill Climbing local search. The per-turbating step on the other hand usually leads to a worsening in thecost function. In the depicted 5000 fitness evaluations only 3 pertur-bation steps occur for ILS_4_HC_AE whereas for ILS_4_HC morethan 20 can be observed. This is due to the fact that the neighbour-hood of ILS_4_HC_AE is significantly larger than in ILS_4_HCdue to the allowed exchange of measures. The LAHC heuristicalways allows worsening steps and therefore takes more than 3000cost function evaluations for LAHC to reach a local optimum. It isrestarted until 5000 fitness evaluations are reached.
Which metaheuristic is best suited to solve a problem can only bedecided based on the specific use case. Figure 5b shows results fromtwo real networks, using the same type of considered measures andcost function. The only difference is the network, which also has aneffect on the number of measures and violated constraints. It can beseen that the different heuristics perform differently in each network.While in one network a restarted Hill Climbing with allowed mea-sure exchange performs on par with the ILS variant, for the othernetwork the LAHC variant is the best. This shows that there is notone metaheuristic that clearly outperforms all other algorithms. Itis however possible to draw conclusions from comparing differentalgorithms. For example, it seems like the AE algorithms gener-ally outperform the non AE algorithm. At least for this problem,allowing an exchange of measures seems to pay off, even though itsignificantly increases the neighbourhood. Larger sample sizes withmore heterogeneous problems are needed to deduce more generalconclusions about different algorithms.
5 Case Studies
The automated network planning framework allows flexible combi-nation of measures, constraints and cost functions to reflect differ-ent objects of investigation. Within different studies we developedmeasure implementations for, e.g.:
• replacing existing lines and transformers• adding parallel lines to existing line trails• changing the switching configuration• finding new line trails• deploying advanced control functions to transformers and PVsystems• replacing conventional transformers with On-Load-Tap-Changing(OLTC) transformers
Moreover, in different studies we considered the following con-straints:
• radiality, supply, n-1 and other topological constraints• load flow constraints for bus voltage, line loading, transformerloading• several worst-case scenarios, e.g. high load or high generation,simultaneously• load flow constraints for n-1 operation with optimal resupply• reliability constraints for outage times (ASIDI / SAIDI)
In the following we present exemplary results from four networkstudies that were performed in cooperation with different major dis-tribution system operators. The metaheuristics that are used in the
studies are adapted and tuned versions of the basic variants presentedin Section 4. Specific cost values are omitted for confidentialityreasons.
5.1 Expected Network Reinforcement Cost for LV Networks
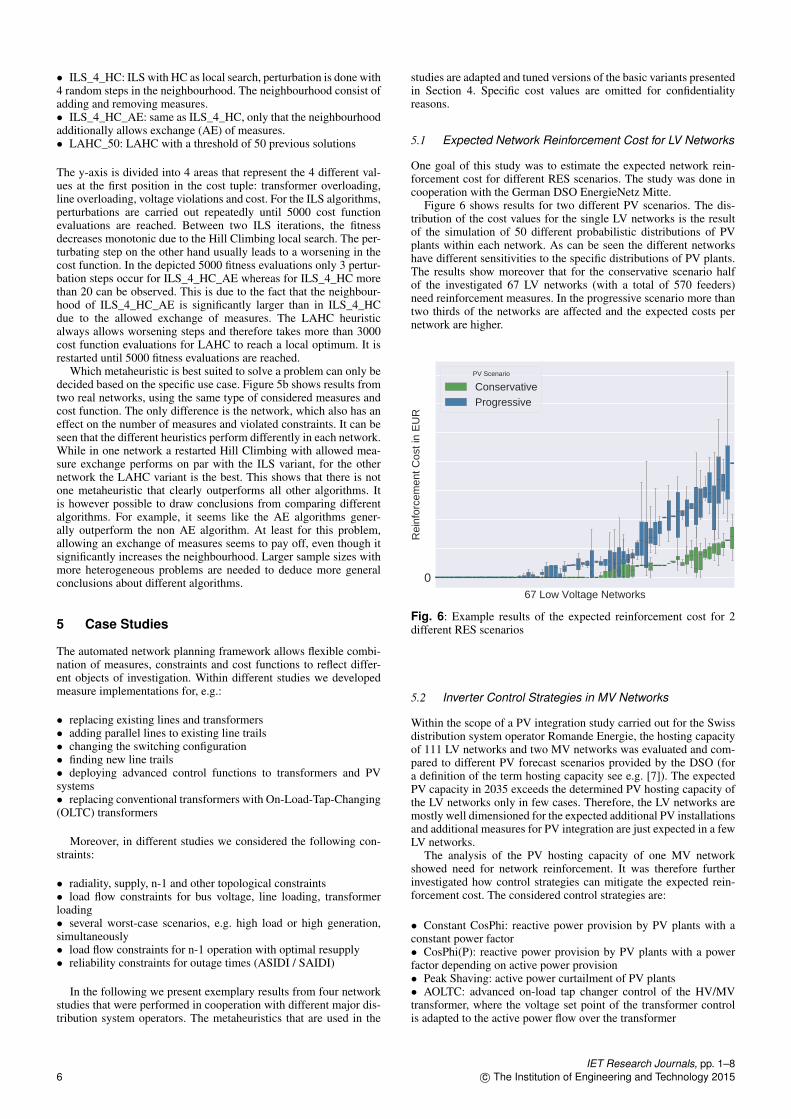
One goal of this study was to estimate the expected network rein-forcement cost for different RES scenarios. The study was done incooperation with the German DSO EnergieNetz Mitte.
Figure 6 shows results for two different PV scenarios. The dis-tribution of the cost values for the single LV networks is the resultof the simulation of 50 different probabilistic distributions of PVplants within each network. As can be seen the different networkshave different sensitivities to the specific distributions of PV plants.The results show moreover that for the conservative scenario halfof the investigated 67 LV networks (with a total of 570 feeders)need reinforcement measures. In the progressive scenario more thantwo thirds of the networks are affected and the expected costs pernetwork are higher.
67 Low Voltage Networks
0
Rei
nfor
cem
ent C
ost i
n E
UR
PV Scenario
ConservativeProgressive
Fig. 6: Example results of the expected reinforcement cost for 2different RES scenarios
5.2 Inverter Control Strategies in MV Networks
Within the scope of a PV integration study carried out for the Swissdistribution system operator Romande Energie, the hosting capacityof 111 LV networks and two MV networks was evaluated and com-pared to different PV forecast scenarios provided by the DSO (fora definition of the term hosting capacity see e.g. [7]). The expectedPV capacity in 2035 exceeds the determined PV hosting capacity ofthe LV networks only in few cases. Therefore, the LV networks aremostly well dimensioned for the expected additional PV installationsand additional measures for PV integration are just expected in a fewLV networks.
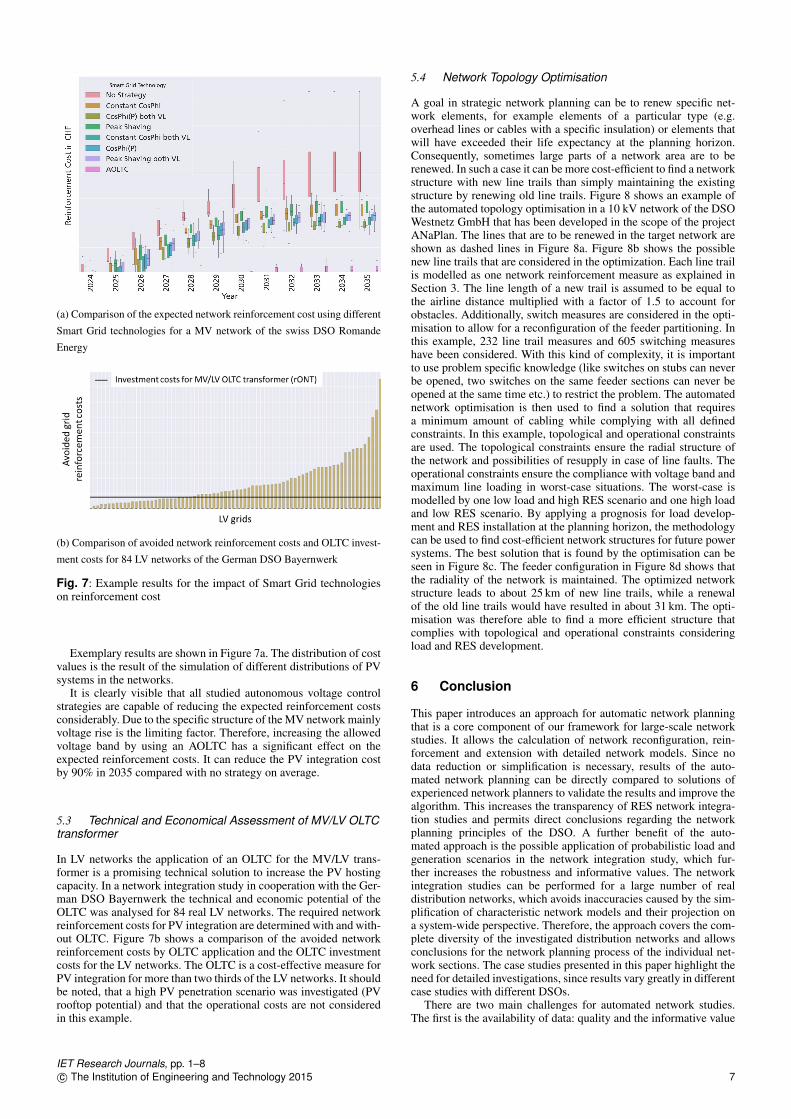
The analysis of the PV hosting capacity of one MV networkshowed need for network reinforcement. It was therefore furtherinvestigated how control strategies can mitigate the expected rein-forcement cost. The considered control strategies are:
• Constant CosPhi: reactive power provision by PV plants with aconstant power factor• CosPhi(P): reactive power provision by PV plants with a powerfactor depending on active power provision• Peak Shaving: active power curtailment of PV plants• AOLTC: advanced on-load tap changer control of the HV/MVtransformer, where the voltage set point of the transformer controlis adapted to the active power flow over the transformer
IET Research Journals, pp. 1–86 c© The Institution of Engineering and Technology 2015
(a) Comparison of the expected network reinforcement cost using different
Smart Grid technologies for a MV network of the swiss DSO Romande
Energy
(b) Comparison of avoided network reinforcement costs and OLTC invest-
ment costs for 84 LV networks of the German DSO Bayernwerk
Fig. 7: Example results for the impact of Smart Grid technologieson reinforcement cost
Exemplary results are shown in Figure 7a. The distribution of costvalues is the result of the simulation of different distributions of PVsystems in the networks.
It is clearly visible that all studied autonomous voltage controlstrategies are capable of reducing the expected reinforcement costsconsiderably. Due to the specific structure of the MV network mainlyvoltage rise is the limiting factor. Therefore, increasing the allowedvoltage band by using an AOLTC has a significant effect on theexpected reinforcement costs. It can reduce the PV integration costby 90% in 2035 compared with no strategy on average.
5.3 Technical and Economical Assessment of MV/LV OLTCtransformer
In LV networks the application of an OLTC for the MV/LV trans-former is a promising technical solution to increase the PV hostingcapacity. In a network integration study in cooperation with the Ger-man DSO Bayernwerk the technical and economic potential of theOLTC was analysed for 84 real LV networks. The required networkreinforcement costs for PV integration are determined with and with-out OLTC. Figure 7b shows a comparison of the avoided networkreinforcement costs by OLTC application and the OLTC investmentcosts for the LV networks. The OLTC is a cost-effective measure forPV integration for more than two thirds of the LV networks. It shouldbe noted, that a high PV penetration scenario was investigated (PVrooftop potential) and that the operational costs are not consideredin this example.
5.4 Network Topology Optimisation
A goal in strategic network planning can be to renew specific net-work elements, for example elements of a particular type (e.g.overhead lines or cables with a specific insulation) or elements thatwill have exceeded their life expectancy at the planning horizon.Consequently, sometimes large parts of a network area are to berenewed. In such a case it can be more cost-efficient to find a networkstructure with new line trails than simply maintaining the existingstructure by renewing old line trails. Figure 8 shows an example ofthe automated topology optimisation in a 10 kV network of the DSOWestnetz GmbH that has been developed in the scope of the projectANaPlan. The lines that are to be renewed in the target network areshown as dashed lines in Figure 8a. Figure 8b shows the possiblenew line trails that are considered in the optimization. Each line trailis modelled as one network reinforcement measure as explained inSection 3. The line length of a new trail is assumed to be equal tothe airline distance multiplied with a factor of 1.5 to account forobstacles. Additionally, switch measures are considered in the opti-misation to allow for a reconfiguration of the feeder partitioning. Inthis example, 232 line trail measures and 605 switching measureshave been considered. With this kind of complexity, it is importantto use problem specific knowledge (like switches on stubs can neverbe opened, two switches on the same feeder sections can never beopened at the same time etc.) to restrict the problem. The automatednetwork optimisation is then used to find a solution that requiresa minimum amount of cabling while complying with all definedconstraints. In this example, topological and operational constraintsare used. The topological constraints ensure the radial structure ofthe network and possibilities of resupply in case of line faults. Theoperational constraints ensure the compliance with voltage band andmaximum line loading in worst-case situations. The worst-case ismodelled by one low load and high RES scenario and one high loadand low RES scenario. By applying a prognosis for load develop-ment and RES installation at the planning horizon, the methodologycan be used to find cost-efficient network structures for future powersystems. The best solution that is found by the optimisation can beseen in Figure 8c. The feeder configuration in Figure 8d shows thatthe radiality of the network is maintained. The optimized networkstructure leads to about 25 km of new line trails, while a renewalof the old line trails would have resulted in about 31 km. The opti-misation was therefore able to find a more efficient structure thatcomplies with topological and operational constraints consideringload and RES development.
6 Conclusion
This paper introduces an approach for automatic network planningthat is a core component of our framework for large-scale networkstudies. It allows the calculation of network reconfiguration, rein-forcement and extension with detailed network models. Since nodata reduction or simplification is necessary, results of the auto-mated network planning can be directly compared to solutions ofexperienced network planners to validate the results and improve thealgorithm. This increases the transparency of RES network integra-tion studies and permits direct conclusions regarding the networkplanning principles of the DSO. A further benefit of the auto-mated approach is the possible application of probabilistic load andgeneration scenarios in the network integration study, which fur-ther increases the robustness and informative values. The networkintegration studies can be performed for a large number of realdistribution networks, which avoids inaccuracies caused by the sim-plification of characteristic network models and their projection ona system-wide perspective. Therefore, the approach covers the com-plete diversity of the investigated distribution networks and allowsconclusions for the network planning process of the individual net-work sections. The case studies presented in this paper highlight theneed for detailed investigations, since results vary greatly in differentcase studies with different DSOs.
There are two main challenges for automated network studies.The first is the availability of data: quality and the informative value
IET Research Journals, pp. 1–8c© The Institution of Engineering and Technology 2015 7
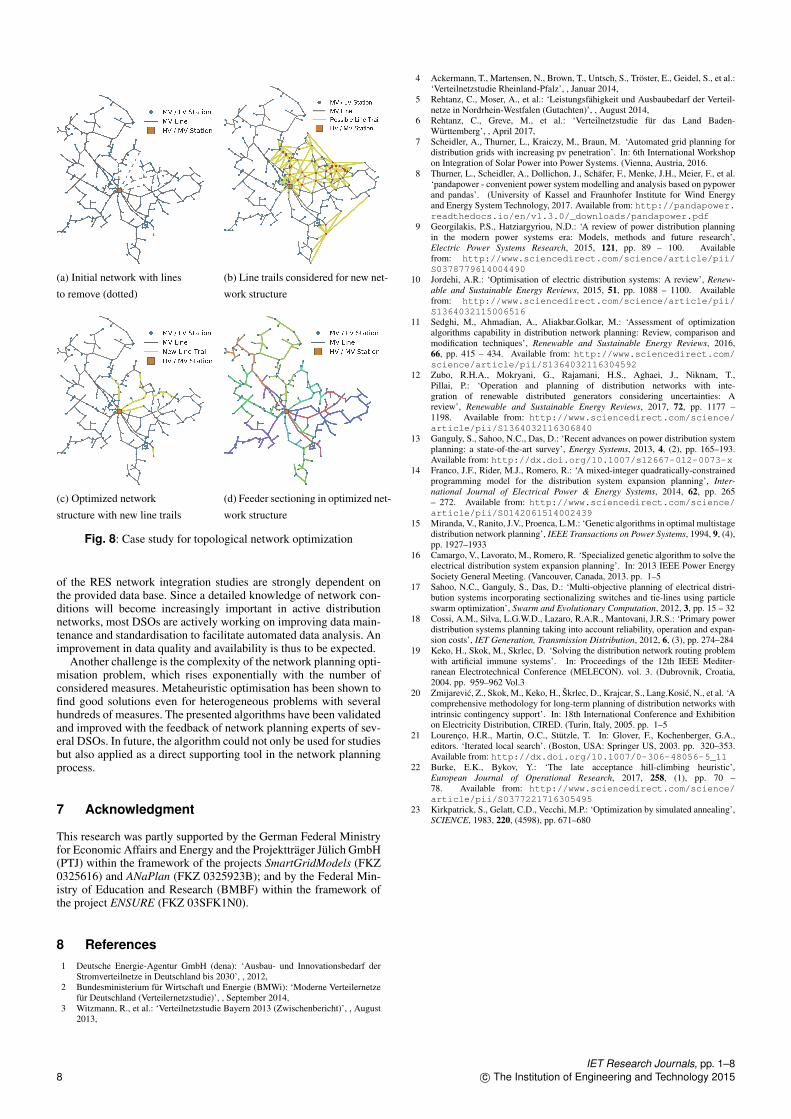
(a) Initial network with lines
to remove (dotted)
(b) Line trails considered for new net-
work structure
(c) Optimized network
structure with new line trails
(d) Feeder sectioning in optimized net-
work structure
Fig. 8: Case study for topological network optimization
of the RES network integration studies are strongly dependent onthe provided data base. Since a detailed knowledge of network con-ditions will become increasingly important in active distributionnetworks, most DSOs are actively working on improving data main-tenance and standardisation to facilitate automated data analysis. Animprovement in data quality and availability is thus to be expected.
Another challenge is the complexity of the network planning opti-misation problem, which rises exponentially with the number ofconsidered measures. Metaheuristic optimisation has been shown tofind good solutions even for heterogeneous problems with severalhundreds of measures. The presented algorithms have been validatedand improved with the feedback of network planning experts of sev-eral DSOs. In future, the algorithm could not only be used for studiesbut also applied as a direct supporting tool in the network planningprocess.
7 Acknowledgment
This research was partly supported by the German Federal Ministryfor Economic Affairs and Energy and the Projektträger Jülich GmbH(PTJ) within the framework of the projects SmartGridModels (FKZ0325616) and ANaPlan (FKZ 0325923B); and by the Federal Min-istry of Education and Research (BMBF) within the framework ofthe project ENSURE (FKZ 03SFK1N0).
8 References1 Deutsche Energie-Agentur GmbH (dena): ‘Ausbau- und Innovationsbedarf der
Stromverteilnetze in Deutschland bis 2030’, , 2012,2 Bundesministerium für Wirtschaft und Energie (BMWi): ‘Moderne Verteilernetze
für Deutschland (Verteilernetzstudie)’, , September 2014,3 Witzmann, R., et al.: ‘Verteilnetzstudie Bayern 2013 (Zwischenbericht)’, , August
2013,
4 Ackermann, T., Martensen, N., Brown, T., Untsch, S., Tröster, E., Geidel, S., et al.:‘Verteilnetzstudie Rheinland-Pfalz’, , Januar 2014,
5 Rehtanz, C., Moser, A., et al.: ‘Leistungsfähigkeit und Ausbaubedarf der Verteil-netze in Nordrhein-Westfalen (Gutachten)’, , August 2014,
6 Rehtanz, C., Greve, M., et al.: ‘Verteilnetzstudie für das Land Baden-Württemberg’, , April 2017,
7 Scheidler, A., Thurner, L., Kraiczy, M., Braun, M. ‘Automated grid planning fordistribution grids with increasing pv penetration’. In: 6th International Workshopon Integration of Solar Power into Power Systems. (Vienna, Austria, 2016.
8 Thurner, L., Scheidler, A., Dollichon, J., Schäfer, F., Menke, J.H., Meier, F., et al.‘pandapower - convenient power system modelling and analysis based on pypowerand pandas’. (University of Kassel and Fraunhofer Institute for Wind Energyand Energy System Technology, 2017. Available from: http://pandapower.readthedocs.io/en/v1.3.0/_downloads/pandapower.pdf
9 Georgilakis, P.S., Hatziargyriou, N.D.: ‘A review of power distribution planningin the modern power systems era: Models, methods and future research’,Electric Power Systems Research, 2015, 121, pp. 89 – 100. Availablefrom: http://www.sciencedirect.com/science/article/pii/S0378779614004490
10 Jordehi, A.R.: ‘Optimisation of electric distribution systems: A review’, Renew-able and Sustainable Energy Reviews, 2015, 51, pp. 1088 – 1100. Availablefrom: http://www.sciencedirect.com/science/article/pii/S1364032115006516
11 Sedghi, M., Ahmadian, A., Aliakbar.Golkar, M.: ‘Assessment of optimizationalgorithms capability in distribution network planning: Review, comparison andmodification techniques’, Renewable and Sustainable Energy Reviews, 2016,66, pp. 415 – 434. Available from: http://www.sciencedirect.com/science/article/pii/S1364032116304592
12 Zubo, R.H.A., Mokryani, G., Rajamani, H.S., Aghaei, J., Niknam, T.,Pillai, P.: ‘Operation and planning of distribution networks with inte-gration of renewable distributed generators considering uncertainties: Areview’, Renewable and Sustainable Energy Reviews, 2017, 72, pp. 1177 –1198. Available from: http://www.sciencedirect.com/science/article/pii/S1364032116306840
13 Ganguly, S., Sahoo, N.C., Das, D.: ‘Recent advances on power distribution systemplanning: a state-of-the-art survey’, Energy Systems, 2013, 4, (2), pp. 165–193.Available from: http://dx.doi.org/10.1007/s12667-012-0073-x
14 Franco, J.F., Rider, M.J., Romero, R.: ‘A mixed-integer quadratically-constrainedprogramming model for the distribution system expansion planning’, Inter-national Journal of Electrical Power & Energy Systems, 2014, 62, pp. 265– 272. Available from: http://www.sciencedirect.com/science/article/pii/S0142061514002439
15 Miranda, V., Ranito, J.V., Proenca, L.M.: ‘Genetic algorithms in optimal multistagedistribution network planning’, IEEE Transactions on Power Systems, 1994, 9, (4),pp. 1927–1933
16 Camargo, V., Lavorato, M., Romero, R. ‘Specialized genetic algorithm to solve theelectrical distribution system expansion planning’. In: 2013 IEEE Power EnergySociety General Meeting. (Vancouver, Canada, 2013. pp. 1–5
17 Sahoo, N.C., Ganguly, S., Das, D.: ‘Multi-objective planning of electrical distri-bution systems incorporating sectionalizing switches and tie-lines using particleswarm optimization’, Swarm and Evolutionary Computation, 2012, 3, pp. 15 – 32
18 Cossi, A.M., Silva, L.G.W.D., Lazaro, R.A.R., Mantovani, J.R.S.: ‘Primary powerdistribution systems planning taking into account reliability, operation and expan-sion costs’, IET Generation, Transmission Distribution, 2012, 6, (3), pp. 274–284
19 Keko, H., Skok, M., Skrlec, D. ‘Solving the distribution network routing problemwith artificial immune systems’. In: Proceedings of the 12th IEEE Mediter-ranean Electrotechnical Conference (MELECON). vol. 3. (Dubrovnik, Croatia,2004. pp. 959–962 Vol.3
20 Zmijarevic, Z., Skok, M., Keko, H., Škrlec, D., Krajcar, S., Lang.Kosic, N., et al. ‘Acomprehensive methodology for long-term planning of distribution networks withintrinsic contingency support’. In: 18th International Conference and Exhibitionon Electricity Distribution, CIRED. (Turin, Italy, 2005. pp. 1–5
21 Lourenço, H.R., Martin, O.C., Stützle, T. In: Glover, F., Kochenberger, G.A.,editors. ‘Iterated local search’. (Boston, USA: Springer US, 2003. pp. 320–353.Available from: http://dx.doi.org/10.1007/0-306-48056-5_11
22 Burke, E.K., Bykov, Y.: ‘The late acceptance hill-climbing heuristic’,European Journal of Operational Research, 2017, 258, (1), pp. 70 –78. Available from: http://www.sciencedirect.com/science/article/pii/S0377221716305495
23 Kirkpatrick, S., Gelatt, C.D., Vecchi, M.P.: ‘Optimization by simulated annealing’,SCIENCE, 1983, 220, (4598), pp. 671–680
IET Research Journals, pp. 1–88 c© The Institution of Engineering and Technology 2015
Recommended