Cop
yrig
ht ©
201
5, T
he H
ealth
and
Soc
ial C
are
Info
rmat
ion
Cen
tre.
All
right
s re
serv
ed
HSE 2014: VOL 1 | CHAPTER 3: ATTITUDES TOWARDS MENTAL ILLNESS 1
Attitudes towardsmental illness
Nevena Ilic, Helen Henderson, Claire Henderson, Sara Evans-Lacko, Graham Thornicroft
● This chapter explores attitudes among adults aged 16 and over towards mental illnessmeasured by the Community Attitudes toward the Mentally Ill (CAMI) scale. The CAMImeasures attitudes to two factors: prejudice and exclusion; and tolerance and supportfor community care. Attitudes are analysed in relation to a range of socio-economiccharacteristics, and by people’s knowledge and experience of mental illness.
● Attitudes towards the two factors were scored, and a mean score was calculated foreach factor ranging from 0-100, with higher scores representing more positiveattitudes (that is, less prejudiced/more tolerant).
● Overall, views were more positive in relation to prejudice and exclusion than totolerance and support for community care, with mean scores of 76 and 71 respectivelyamong all adults.
● Women consistently had significantly less prejudiced and more tolerant views thanmen. Women’s mean score on prejudice and exclusion was 78, compared with 73 formen; the equivalent scores on tolerance and support for community care were 72 and69.
● Attitudes towards mental illness varied according to age, with different patterns for thetwo factors. People aged 35-64 held the least prejudiced views (scores 77-79), whilethe most prejudiced attitudes were held by participants aged 65 and over (65-73).Attitudes relating to tolerance and support for community care were least positiveamong younger participants aged 16-34 (65-69), and were at a broadly equal levelamong participants from the age of 35 and over (71-74).
● Attitudes towards mental illness were associated with socio-economic indicators.Those living in the lowest income households or the most deprived areas were leastlikely to hold positive views in relation to prejudice and exclusion and to tolerance andsupport for community care. Scores on prejudice and exclusion ranged from 75among women in lowest income households to 82 in the highest income households,compared with 69-76 among men. There was a similar pattern for scores on toleranceand support for community care; and these ranges were also very similar according toquintiles of area deprivation.
● Attitudes varied according to the highest level of educational qualification achieved.The least prejudiced and most tolerant attitudes were held by those with at leastdegree level education (79-83 for prejudice and exclusion, 72-76 for tolerance andsupport for community care). Those with no qualifications held the least positiveattitudes (66-71 for both prejudice and exclusion and for tolerance and support forcommunity care).
● There was also variation according to employment status. Those in employment heldthe most positive attitudes towards prejudice and exclusion (81 for women, 75 formen), while the least positive attitudes about prejudice and exclusion were held byretired participants (74 for women and 70 for men). In contrast, retired participantswere the most positive on tolerance and support for community care (73 for both
3Summary

2 HSE 2014: VOL 1 | CHAPTER 3: ATTITUDES TOWARDS MENTAL ILLNESS Cop
yrig
ht ©
201
5, T
he H
ealth
and
Soc
ial C
are
Info
rmat
ion
Cen
tre.
All
right
s re
serv
ed
women and men), and unemployed participants held the least positive attitudes (68 forwomen and 66 for men).
● Men and women who knew someone with a mental illness were statisticallysignificantly more likely to hold less prejudiced and more tolerant views (80-83 forwomen and 75-77 for men on prejudice and exclusion, 73-77 and 69-73 respectivelyfor tolerance and support for community care) than those who did not know anyonewith a mental illness (equivalent scores were 70 and 68 on prejudice and exclusion, 67for both men and women on tolerance and support for community care).
● Participants who had ever been diagnosed with some form of mental illness had morepositive attitudes towards both factors. Women ever diagnosed with a commonmental disorder scored 82 on prejudice and exclusion and 75 on tolerance andsupport for community care, with equivalent scores of 79 and 73 for men. Men andwomen who had never been diagnosed with a mental illness scored 77 and 73 onprejudice and exclusion respectively, and 71 and 69 on tolerance and support forcommunity care.
HSE 2014: VOL 1 | CHAPTER 3: ATTITUDES TOWARDS MENTAL ILLNESS 3Cop
yrig
ht ©
201
5, T
he H
ealth
and
Soc
ial C
are
Info
rmat
ion
Cen
tre.
All
right
s re
serv
ed3.1 Introduction
The importance of mental health has been increasingly recognised in recent years, andalongside this has grown an awareness of the need to talk about public attitudes to mentalillness and reduce levels of stigma and discrimination in relation to mental illness. In 2001, theWorld Health Organisation (WHO) issued the first major report on the topic of mental healthand recommended that the public be educated, stating that ‘well-planned public awarenessand education campaigns can reduce stigma and discrimination, increase the use of mentalhealth services, and bring mental and physical health care closer to each other’.1
The ‘Time to Change’ (TTC) campaign was launched in 2009, and continues to be led by Mindand Rethink Mental Illness charities. It has been described as ‘England’s largest programmeto challenge mental health stigma and discrimination’.2 In 2015 the government announced apolicy for mental health service reform, which included making mental health part of the newnational measure of well-being, and providing up to £16m of funding for the second phase ofthe TTC campaign.3 The focus on attitudes to mental health in policy continued in 2014, whenthe Department of Health released a report titled ‘Closing the Gap: Priorities for essentialchange in mental health’. One of the 25 priority actions within this report was to stamp outand ultimately remove discrimination in order to ‘help millions of people affected by mentalhealth problems to fulfil their potential as active and equal citizens’.4 Looking to the future, in2013 WHO announced a ‘Comprehensive Mental Health Action Plan 2013-2020’, which callsfor a change in attitudes that perpetuate stigmatisation and discrimination around mentalillness, emphasising that they often lead to a violation of human rights of persons with mentalillness.5 All of these initiatives reiterate the importance of reducing discrimination relating tomental illness.
Around one in four people in the UK experience a mental illness in their lifetime,6,7 yetexperience of discrimination remains relatively high. The TTC campaign aimed to reducelevels of experience of discrimination by 5% from 2008 to 2011. There was a slight decreaseover this period in the proportion of participants in the TTC evaluation surveys who reportedone or more experiences of discrimination (91% to 88%), although it did not meet the 5%target, and it remains the case that the great majority of those with mental illness reportedexperience of discrimination in the last year.8
However, data from the national Attitudes to Mental Illness surveys show that since thebeginning of the second phase of Time to Change, which started in 2011, there have beenimprovements in attitudes towards people with a mental illness.9 This includes findings thatthe proportion of those willing ‘to work with someone with a mental health problem’ increasedby seven percentage points, from 69% in 2009 to 76% in 2013; while willingness to ‘continuea relationship with a friend with a mental health problem’ increased by six percentage points,from 82% in 2009 to 88% in 2013.10
Using data from the Health Survey for England (HSE) 2014, this chapter explores people’scurrent perceptions of, and stance towards, mental illness. This was done by measuringparticipants’ attitudes to prejudice and tolerance. In order to look into the factors which drivethese attitudes, analyses within this chapter examine whether attitudes to mental illness differby a range of demographic characteristics, including educational level and employmentstatus, as well as participants’ experience and knowledge of mental illness.
3.2 Methods and Definitions
3.2.1 Methods
Community Attitudes towards the Mentally Ill scale
Community Attitudes toward the Mentally Ill (CAMI) is a scale developed by Taylor and Dear in1981 to measure community attitudes towards people with mental illness. The original CAMIquestionnaire consisted of 40 attitudinal statements about mental illness, with participantssaying how much they agreed or disagreed with each statement on a 5-point Likert Scale.
For HSE 2014 a 12-item scale (CAMI–12) was used among adults aged 16 and over. Thiswas a subset of the original statements, selected to show levels of mental health-relatedstigma and tolerance, and first used in the survey evaluating the Time to Change socialmarketing campaign.10,11 The CAMI questionnaire was administered in the self completionquestionnaire during the interview visit.
Factor analysis
For the HSE 2014, an exploratory factor analysis was performed on the 12 attitudestatements. Factor analysis is a statistical method used to describe variability among agroup of correlated variables (in this case agreement or disagreement with the attitudestatements) in terms of a potentially lower number of underlying factors. Factor analysissearches for joint variations in response to the underlying factors. With the CAMIstatements, the factor analysis produced two factors,12 which revealed themes of:• Prejudice and exclusion• Tolerance and support for community care.
An internal reliability test, Cronbach’s Alpha, was run on the two factors, both of which werefound to be internally reliable.13 The identification of the two factors was consistent withprevious research, which ran a factor analysis on the 27 item version of the CAMIquestionnaire used in the National Attitudes to Mental Illness survey.14
Scoring the attitude statements
The 12 CAMI statements were phrased in both positive and negative directions. Thoserelating to tolerance and support of community care expressed supportive attitudestowards mental illness where agreement was positive, while for those relating to prejudiceand exclusion disagreement reflected more positive views. The degree of the participant’sagreement or disagreement to each of the statements was rated on a 5-point Likert Scale,which was scored as follows for positive statements:
Agree strongly 100Agree slightly 75Neither agree nor disagree 50Disagree slightly 25Disagree strongly 0
Negative statements were scored in reverse, so that in each case, mean scores ranged from0-100 and a higher score represented a more positive attitude (less prejudiced/moretolerant).There was also a sixth option of ‘Don’t know’; those choosing this option wereexcluded from the calculation of the mean score.
Table 3.1 shows the individual statements in the CAMI scale and the full distribution ofresponses to them, including the proportion of participants giving the response option‘don’t know’. For most statements this is a relatively low proportion, between 2-10%, butfor one statement, ‘Most women who were once patients in a mental hospital can betrusted as babysitters’, one in five adults chose the ‘don’t know’ response (20%).
A single measure for each of the factors has been derived, representing levels of prejudiceand exclusion, and tolerance and support for community care. This single measure for thefactor takes the average of the mean scores from the individual statements relating to thatfactor. Participants were included in this average score if they had responded (i.e. not said‘don’t know’) to at least two of the six statements relating to the relevant factor.
This ‘composite’ mean score for each factor is used in the analyses throughout the chapter. Table 3.1
Age standardisation
Most tables in this chapter that do not present an age breakdown are age-standardised.This allows comparisons between categories being examined after taking into account anydifferences there may be in age profiles. Both observed and age-standardised data areprovided by region in the tables. Observed data can be used to examine actual prevalenceor mean values within a region, needed, for example, for planning services. Age-standardised data are required for comparisons between regions to exclude age-relatedeffects, and are discussed in the report text.
4 HSE 2014: VOL 1 | CHAPTER 3: ATTITUDES TOWARDS MENTAL ILLNESS Cop
yrig
ht ©
201
5, T
he H
ealth
and
Soc
ial C
are
Info
rmat
ion
Cen
tre.
All
right
s re
serv
ed
However, age-standardisation has not been used in Table 3.7, looking at employmentstatus. This is because there the ‘retired’ group contains almost all older participants,whereas the other groups of economic activity contain very few; thus there are a number ofblank cells in the weighting matrix of age by employment status, meaning that the age-standardisation does not work satisfactorily.
3.2.2 Definitions
The General Health Questionnaire, GHQ-12
The 12-item General Health Questionnaire (GHQ-12) is a widely used and validatedmeasure of mental health.15 It was originally intended for use in general practice settings asa screening instrument for mental ill health but cannot be used to diagnose specificpsychiatric problems. In HSE 2014, the GHQ-12 was administered via a self-completionbooklet given to participants aged 13 and over; analysis in this chapter is based on adultsaged 16 and over.
The questionnaire consists of twelve items measuring general levels of happiness;depression and anxiety; sleep disturbance; and ability to cope over the last few weeks.Each item is rated on a four-point scale, where a score of 0 is given to responses indicatingthat a symptom is present ‘not at all’ or ‘no more than usual’ and a score of 1 is given toresponses indicating the symptom is present ‘rather more than usual’ or ‘much more thanusual’. Consistent with previous HSE surveys, a GHQ-12 score of 4 or more is referred to asa ‘high GHQ-12 score’, indicating probable psychological disturbance or mental ill health.
Mental illness categories
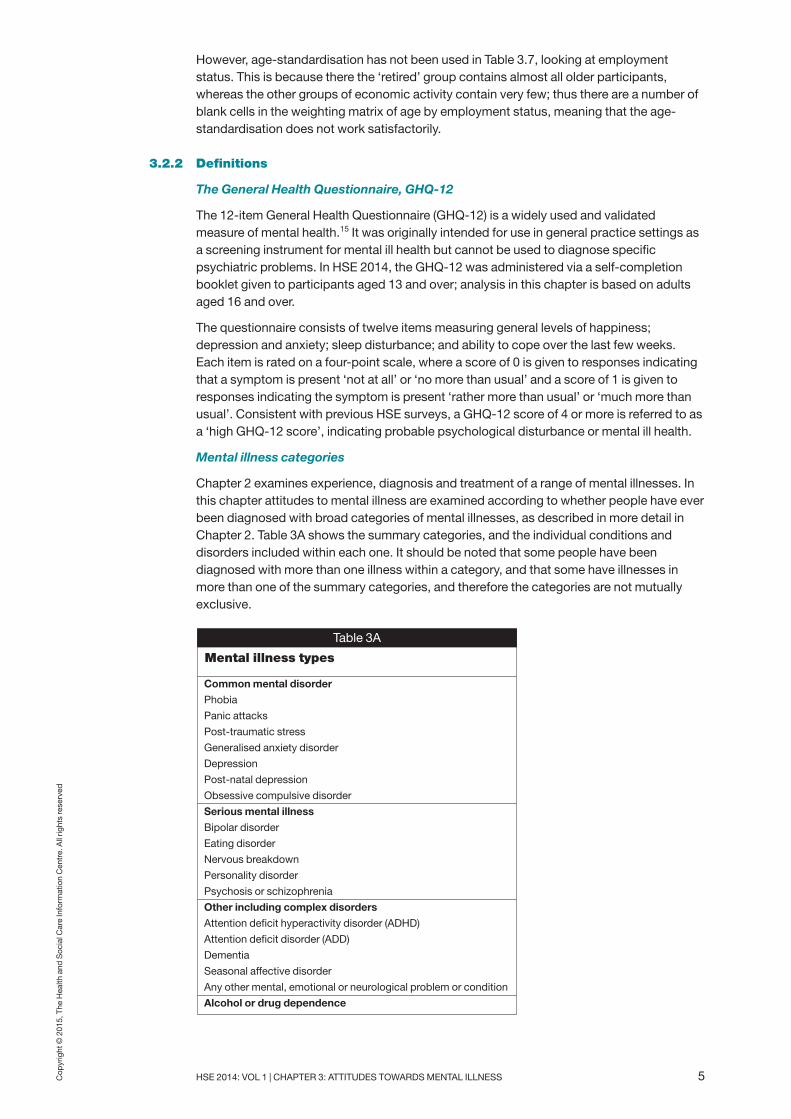
Chapter 2 examines experience, diagnosis and treatment of a range of mental illnesses. Inthis chapter attitudes to mental illness are examined according to whether people have everbeen diagnosed with broad categories of mental illnesses, as described in more detail inChapter 2. Table 3A shows the summary categories, and the individual conditions anddisorders included within each one. It should be noted that some people have beendiagnosed with more than one illness within a category, and that some have illnesses inmore than one of the summary categories, and therefore the categories are not mutuallyexclusive.
HSE 2014: VOL 1 | CHAPTER 3: ATTITUDES TOWARDS MENTAL ILLNESS 5Cop
yrig
ht ©
201
5, T
he H
ealth
and
Soc
ial C
are
Info
rmat
ion
Cen
tre.
All
right
s re
serv
ed
Table 3A
Mental illness types
Common mental disorder
Phobia
Panic attacks
Post-traumatic stress
Generalised anxiety disorder
Depression
Post-natal depression
Obsessive compulsive disorder
Serious mental illness
Bipolar disorder
Eating disorder
Nervous breakdown
Personality disorder
Psychosis or schizophrenia
Other including complex disorders
Attention deficit hyperactivity disorder (ADHD)
Attention deficit disorder (ADD)
Dementia
Seasonal affective disorder
Any other mental, emotional or neurological problem or condition
Alcohol or drug dependence
3.3 Attitudes towards mental illness
3.3.1 Attitudes towards mental illness, by age and sex
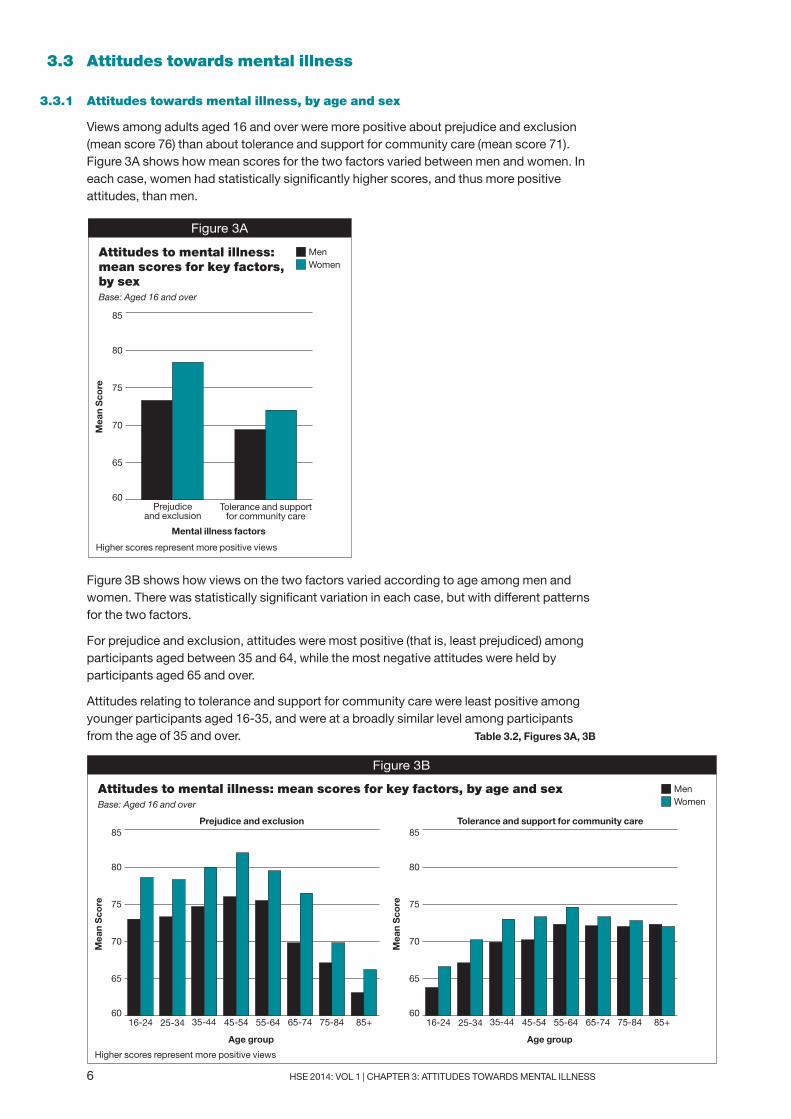
Views among adults aged 16 and over were more positive about prejudice and exclusion(mean score 76) than about tolerance and support for community care (mean score 71).Figure 3A shows how mean scores for the two factors varied between men and women. Ineach case, women had statistically significantly higher scores, and thus more positiveattitudes, than men.
Figure 3B shows how views on the two factors varied according to age among men andwomen. There was statistically significant variation in each case, but with different patternsfor the two factors.
For prejudice and exclusion, attitudes were most positive (that is, least prejudiced) amongparticipants aged between 35 and 64, while the most negative attitudes were held byparticipants aged 65 and over.
Attitudes relating to tolerance and support for community care were least positive amongyounger participants aged 16-35, and were at a broadly similar level among participantsfrom the age of 35 and over. Table 3.2, Figures 3A, 3B
6 HSE 2014: VOL 1 | CHAPTER 3: ATTITUDES TOWARDS MENTAL ILLNESS
Attitudes to mental illness: mean scores for key factors, by sexBase: Aged 16 and over
Mea
n S
core
Figure 3A
Prejudiceand exclusion
Tolerance and supportfor community care
Higher scores represent more positive views
Mental illness factors
MenWomen
60
65
70
75
80
85
Attitudes to mental illness: mean scores for key factors, by age and sexBase: Aged 16 and over
Mea
n S
core
Figure 3B
35-44 45-5416-24 25-34 55-64 65-74 75-84 85+
Age group
60
65
70
75
80
85
Mea
n S
core
35-44 45-5416-24 25-34 55-64 65-74 75-84 85+
Age group
60
65
70
75
80
85
MenWomen
Prejudice and exclusion Tolerance and support for community care
Higher scores represent more positive views
3.3.2 Attitudes towards mental illness, by region
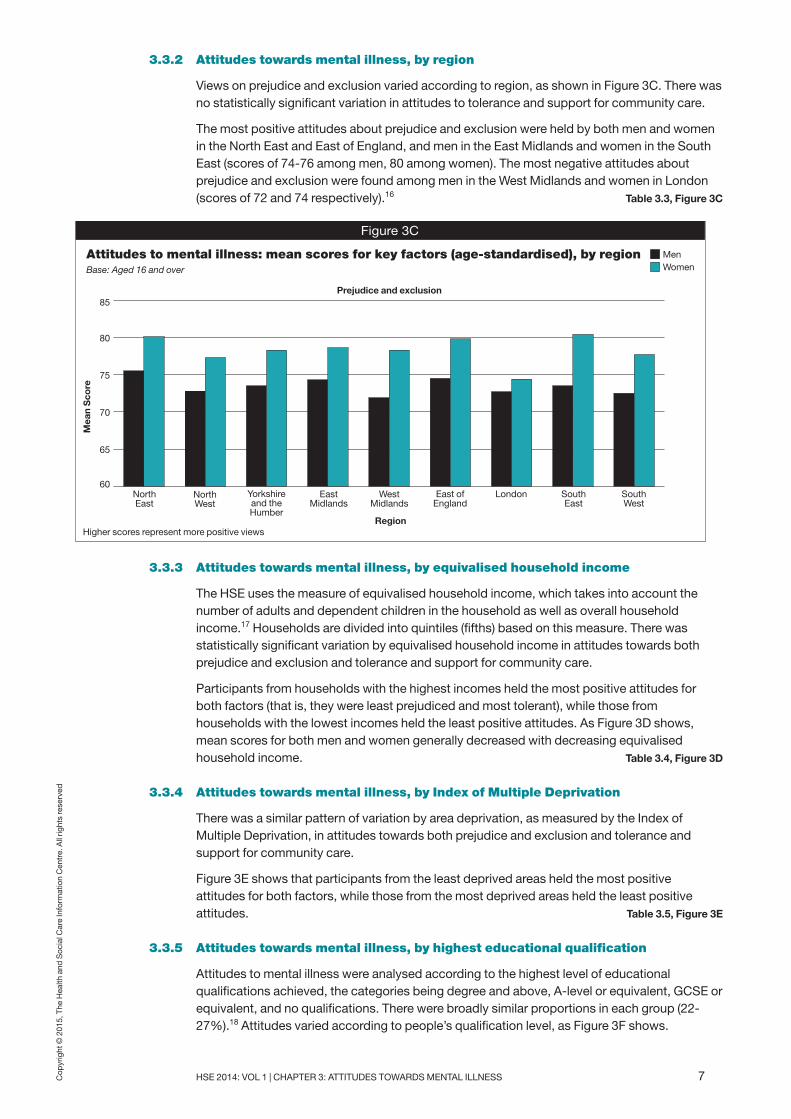
Views on prejudice and exclusion varied according to region, as shown in Figure 3C. There wasno statistically significant variation in attitudes to tolerance and support for community care.
The most positive attitudes about prejudice and exclusion were held by both men and womenin the North East and East of England, and men in the East Midlands and women in the SouthEast (scores of 74-76 among men, 80 among women). The most negative attitudes aboutprejudice and exclusion were found among men in the West Midlands and women in London(scores of 72 and 74 respectively).16 Table 3.3, Figure 3C
3.3.3 Attitudes towards mental illness, by equivalised household income
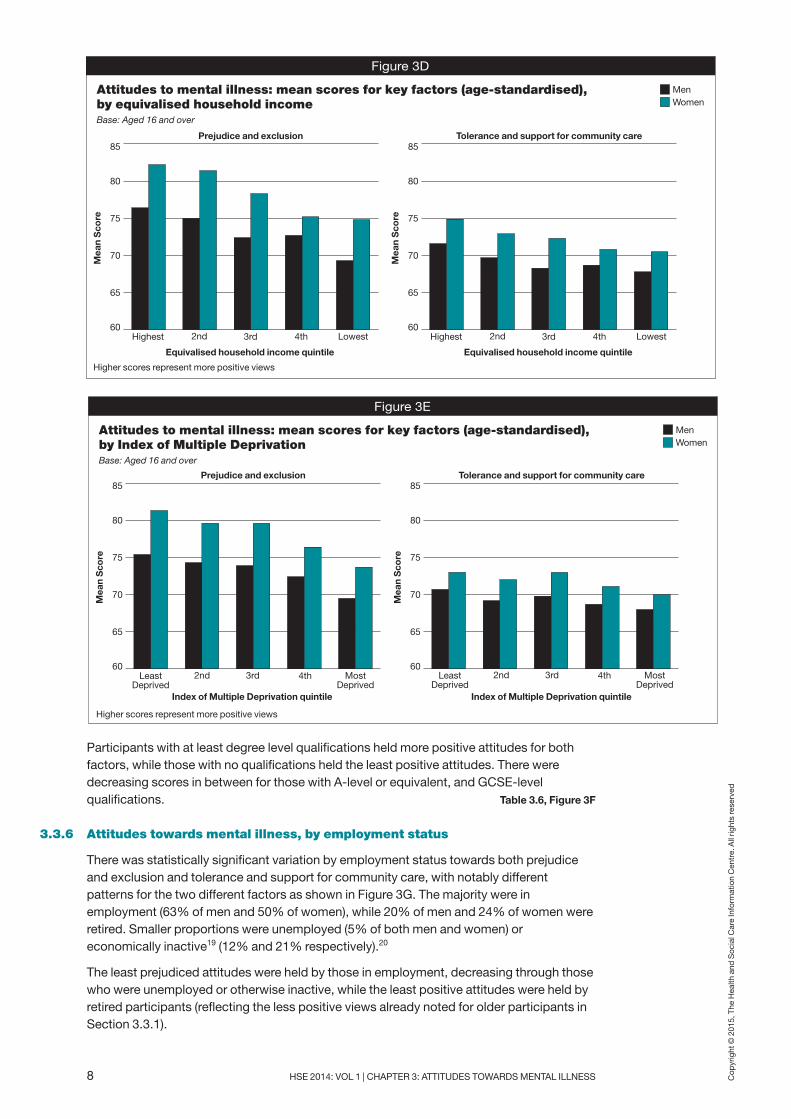
The HSE uses the measure of equivalised household income, which takes into account thenumber of adults and dependent children in the household as well as overall householdincome.17 Households are divided into quintiles (fifths) based on this measure. There wasstatistically significant variation by equivalised household income in attitudes towards bothprejudice and exclusion and tolerance and support for community care.
Participants from households with the highest incomes held the most positive attitudes forboth factors (that is, they were least prejudiced and most tolerant), while those fromhouseholds with the lowest incomes held the least positive attitudes. As Figure 3D shows,mean scores for both men and women generally decreased with decreasing equivalisedhousehold income. Table 3.4, Figure 3D
3.3.4 Attitudes towards mental illness, by Index of Multiple Deprivation
There was a similar pattern of variation by area deprivation, as measured by the Index ofMultiple Deprivation, in attitudes towards both prejudice and exclusion and tolerance andsupport for community care.
Figure 3E shows that participants from the least deprived areas held the most positiveattitudes for both factors, while those from the most deprived areas held the least positiveattitudes. Table 3.5, Figure 3E
3.3.5 Attitudes towards mental illness, by highest educational qualification
Attitudes to mental illness were analysed according to the highest level of educationalqualifications achieved, the categories being degree and above, A-level or equivalent, GCSE orequivalent, and no qualifications. There were broadly similar proportions in each group (22-27%).18 Attitudes varied according to people’s qualification level, as Figure 3F shows.
HSE 2014: VOL 1 | CHAPTER 3: ATTITUDES TOWARDS MENTAL ILLNESS 7Cop
yrig
ht ©
201
5, T
he H
ealth
and
Soc
ial C
are
Info
rmat
ion
Cen
tre.
All
right
s re
serv
ed
Attitudes to mental illness: mean scores for key factors (age-standardised), by region Base: Aged 16 and over
Mea
n S
core
Figure 3C
MenWomen
60
65
70
75
80
85
Yorkshireand theHumber
EastMidlands
NorthEast
NorthWest
WestMidlands
East ofEngland
London SouthEast
SouthWest
Region
Prejudice and exclusion
Higher scores represent more positive views
Participants with at least degree level qualifications held more positive attitudes for bothfactors, while those with no qualifications held the least positive attitudes. There weredecreasing scores in between for those with A-level or equivalent, and GCSE-levelqualifications. Table 3.6, Figure 3F
3.3.6 Attitudes towards mental illness, by employment status
There was statistically significant variation by employment status towards both prejudiceand exclusion and tolerance and support for community care, with notably differentpatterns for the two different factors as shown in Figure 3G. The majority were inemployment (63% of men and 50% of women), while 20% of men and 24% of women wereretired. Smaller proportions were unemployed (5% of both men and women) oreconomically inactive19 (12% and 21% respectively).20
The least prejudiced attitudes were held by those in employment, decreasing through thosewho were unemployed or otherwise inactive, while the least positive attitudes were held byretired participants (reflecting the less positive views already noted for older participants inSection 3.3.1).
8 HSE 2014: VOL 1 | CHAPTER 3: ATTITUDES TOWARDS MENTAL ILLNESS Cop
yrig
ht ©
201
5, T
he H
ealth
and
Soc
ial C
are
Info
rmat
ion
Cen
tre.
All
right
s re
serv
ed
Attitudes to mental illness: mean scores for key factors (age-standardised), by equivalised household income Base: Aged 16 and over
Mea
n S
core
Figure 3D
2nd 3rdHighest 4th Lowest
Equivalised household income quintile
2nd 3rdHighest 4th Lowest
Equivalised household income quintile
MenWomen
60
65
70
75
80
85
Mea
n S
core
60
65
70
75
80
85Prejudice and exclusion Tolerance and support for community care
Higher scores represent more positive views
Attitudes to mental illness: mean scores for key factors (age-standardised), by Index of Multiple Deprivation Base: Aged 16 and over
Mea
n S
core
Figure 3E
3rdLeastDeprived
2nd 4th MostDeprived
3rdLeastDeprived
2nd 4th MostDeprived
Index of Multiple Deprivation quintile Index of Multiple Deprivation quintile
60
65
70
75
80
85
Mea
n S
core
60
65
70
75
80
85
MenWomen
Prejudice and exclusion Tolerance and support for community care
Higher scores represent more positive views
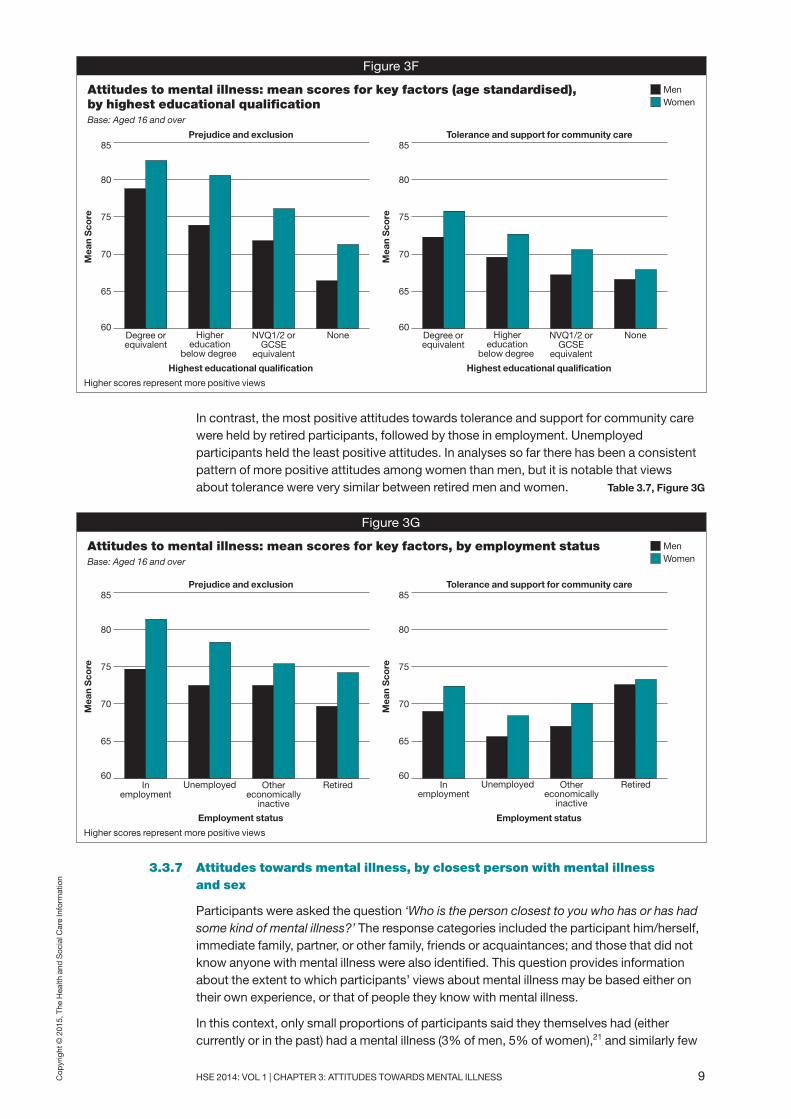
In contrast, the most positive attitudes towards tolerance and support for community carewere held by retired participants, followed by those in employment. Unemployedparticipants held the least positive attitudes. In analyses so far there has been a consistentpattern of more positive attitudes among women than men, but it is notable that viewsabout tolerance were very similar between retired men and women. Table 3.7, Figure 3G
3.3.7 Attitudes towards mental illness, by closest person with mental illness and sex
Participants were asked the question ‘Who is the person closest to you who has or has hadsome kind of mental illness?’ The response categories included the participant him/herself,immediate family, partner, or other family, friends or acquaintances; and those that did notknow anyone with mental illness were also identified. This question provides informationabout the extent to which participants’ views about mental illness may be based either ontheir own experience, or that of people they know with mental illness.
In this context, only small proportions of participants said they themselves had (eithercurrently or in the past) had a mental illness (3% of men, 5% of women),21 and similarly few
HSE 2014: VOL 1 | CHAPTER 3: ATTITUDES TOWARDS MENTAL ILLNESS 9Cop
yrig
ht ©
201
5, T
he H
ealth
and
Soc
ial C
are
Info
rmat
ion
Attitudes to mental illness: mean scores for key factors (age standardised), by highest educational qualification Base: Aged 16 and over
Mea
n S
core
Figure 3F
Highereducation
below degree
NVQ1/2 orGCSE
equivalent
Degree orequivalent
None Highereducation
below degree
NVQ1/2 orGCSE
equivalent
Degree orequivalent
None
Highest educational qualification Highest educational qualification
MenWomen
60
65
70
75
80
85
Mea
n S
core
60
65
70
75
80
85
Prejudice and exclusion Tolerance and support for community care
Higher scores represent more positive views
Attitudes to mental illness: mean scores for key factors, by employment status Base: Aged 16 and over
Mea
n S
core
Figure 3G
Unemployed Othereconomically
inactive
Inemployment
Retired Unemployed Othereconomically
inactive
Inemployment
Retired
Employment status Employment status
MenWomen
60
65
70
75
80
85
Mea
n S
core
60
65
70
75
80
85
Prejudice and exclusion Tolerance and support for community care
Higher scores represent more positive views

said that the closest person they knew with a mental illness was their partner (7% and 5%respectively). A much larger group mentioned immediate family (26% of men, 32% ofwomen), or other family members or friends (21% and 23%). 5-6% mentioned anacquaintance or colleague. 37% of men and 31% of women said that they did not knowanyone who had had a mental illness.22
Figure 3H shows that there was statistically significant variation in attitudes according tothis measure for both factors. In each case, there was a difference between those who didnot know anyone with a mental illness and the other participants, with much lower scores(68-70 for prejudice and exclusion, 67 for tolerance and support for community care)among those without family, friends or acquaintances with mental illness. Among thosewho had themselves had a mental illness, or knew someone who had, scores for theprejudice and exclusion factor ranged between 75-80 for men and 80-83 for women; ontolerance and support for community care, the equivalent ranges were 69-73 for men and73-77 among women.
Figure 3H suggests some variation between groups, and a slightly different pattern betweenmen and women; however, because some of the groups are quite small (men who have hadmental illness themselves, men or women with a partner or acquaintance/colleague whohas had a mental illness), the margins of error are quite wide and the patterns are notstatistically significantly different between men and women. Table 3.8, Figure 3H
3.3.8 Attitudes towards mental illness, by knowledge of mental illness
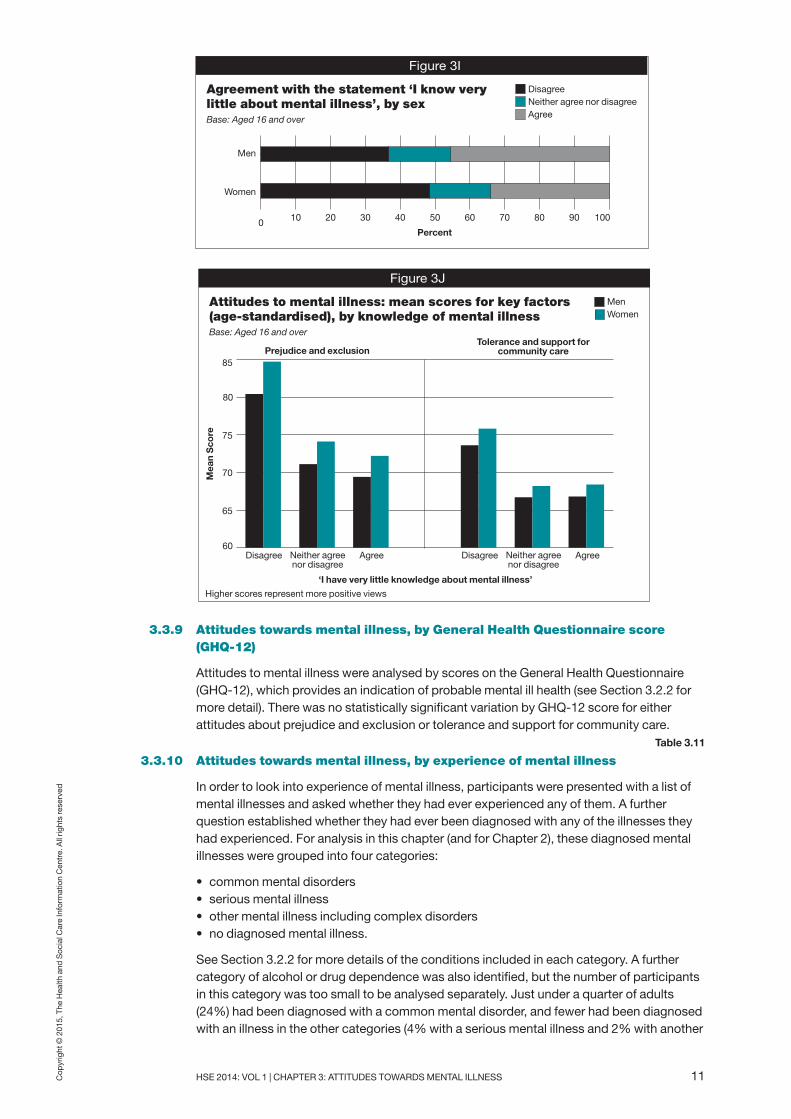
As well as the 12 attitude statements relating to prejudice and tolerance within the CAMIquestionnaire, a statement on knowledge about mental illness was included: ‘I have verylittle knowledge about mental illness’. As with the other statements, it required participantsto indicate their level of agreement or disagreement. For this analysis, the five responsecategories were grouped into three, those agreeing (strongly agree/tend to agree), thosedisagreeing (disagree strongly/tend to disagree), and those who said ‘neither agree nordisagree’. Figure 3I shows that there were different patterns of response between men andwomen, with men more likely to agree than disagree, while the reverse was true for women.
Attitudes about knowledge of mental illness were associated with attitudes about prejudiceand exclusion, and tolerance and support for community care, with similar results for bothmen and women, as shown in Figure 3J. Those who felt they were more knowledgeable, i.e.who disagreed that they knew little about mental illness, had considerably more positiveviews towards both prejudice and exclusion and tolerance and support for community care,compared with those who agreed (i.e. did not feel knowledgeable) or those who neitheragreed nor disagreed. Table 3.9, 3.10 Figures 3I, 3J
10 HSE 2014: VOL 1 | CHAPTER 3: ATTITUDES TOWARDS MENTAL ILLNESS Cop
yrig
ht ©
201
5, T
he H
ealth
and
Soc
ial C
are
Info
rmat
ion
Cen
tre.
All
right
s re
serv
ed
Attitudes to mental illness: mean scores for key factors (age-standardised), by closest person with mental illness Base: Aged 16 and over
Mea
n S
core
Figure 3H
Closest person with mental illness Closest person with mental illness
60
65
70
75
80
85
Mea
n S
core
60
65
70
75
80
85
MenWomen
Immediate family
Partner Partner Your-self
Other family/ friend
Acquain tance/
colleague
Don'tknow
anyone
Immediate family
Your-self
Other family/ friend
Acquain tance/
colleague
Don'tknow
anyone
Prejudice and exclusion Tolerance and support for community care
Higher scores represent more positive views
3.3.9 Attitudes towards mental illness, by General Health Questionnaire score(GHQ-12)
Attitudes to mental illness were analysed by scores on the General Health Questionnaire(GHQ-12), which provides an indication of probable mental ill health (see Section 3.2.2 formore detail). There was no statistically significant variation by GHQ-12 score for eitherattitudes about prejudice and exclusion or tolerance and support for community care.
Table 3.11
3.3.10 Attitudes towards mental illness, by experience of mental illness
In order to look into experience of mental illness, participants were presented with a list ofmental illnesses and asked whether they had ever experienced any of them. A furtherquestion established whether they had ever been diagnosed with any of the illnesses theyhad experienced. For analysis in this chapter (and for Chapter 2), these diagnosed mentalillnesses were grouped into four categories:
• common mental disorders• serious mental illness• other mental illness including complex disorders• no diagnosed mental illness.
See Section 3.2.2 for more details of the conditions included in each category. A furthercategory of alcohol or drug dependence was also identified, but the number of participantsin this category was too small to be analysed separately. Just under a quarter of adults(24%) had been diagnosed with a common mental disorder, and fewer had been diagnosedwith an illness in the other categories (4% with a serious mental illness and 2% with another
HSE 2014: VOL 1 | CHAPTER 3: ATTITUDES TOWARDS MENTAL ILLNESS 11Cop
yrig
ht ©
201
5, T
he H
ealth
and
Soc
ial C
are
Info
rmat
ion
Cen
tre.
All
right
s re
serv
ed
Agreement with the statement ‘I know very little about mental illness’, by sexBase: Aged 16 and over
Figure 3I
Disagree Neither agree nor disagreeAgree
Percent
Men
Women
0 10 20 30 40 50 60 70 80 90 100
Attitudes to mental illness: mean scores for key factors (age-standardised), by knowledge of mental illness Base: Aged 16 and over
Mea
n S
core
Figure 3J
60
65
70
75
80
85
Disagree Neither agreenor disagree
Agree Disagree Neither agreenor disagree
Agree
MenWomen
‘I have very little knowledge about mental illness’
Prejudice and exclusionTolerance and support for
community care
Higher scores represent more positive views
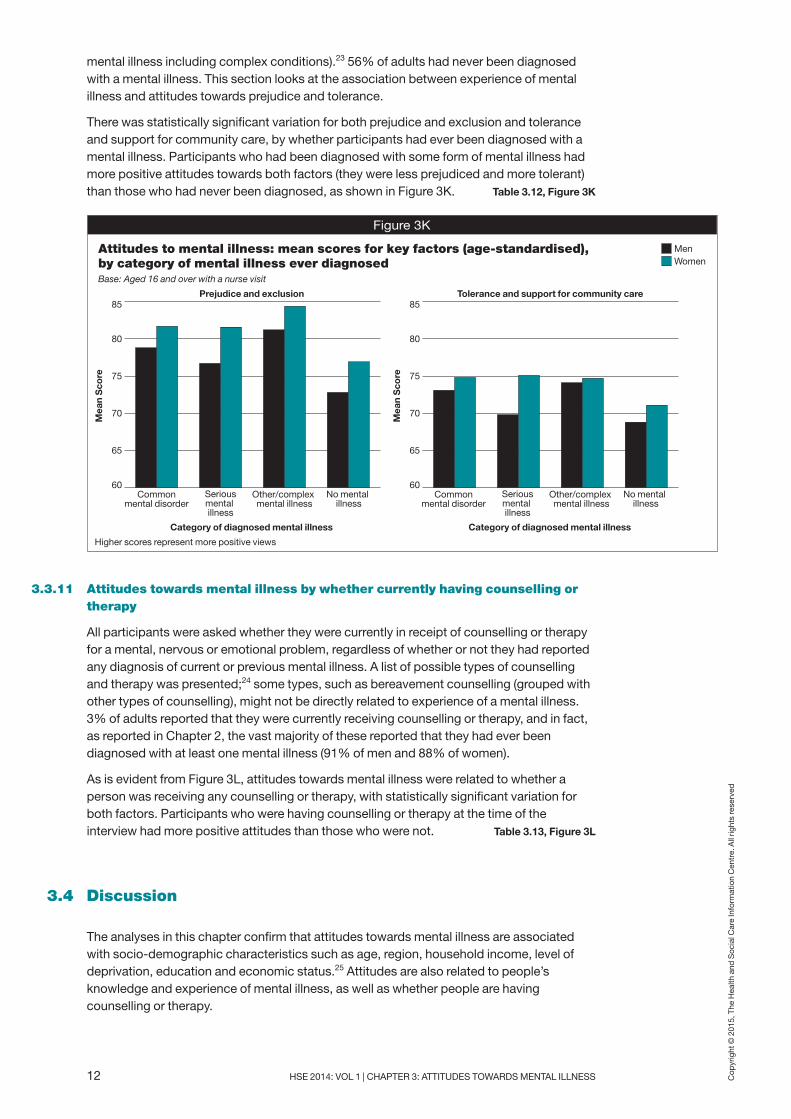
mental illness including complex conditions).23 56% of adults had never been diagnosedwith a mental illness. This section looks at the association between experience of mentalillness and attitudes towards prejudice and tolerance.
There was statistically significant variation for both prejudice and exclusion and toleranceand support for community care, by whether participants had ever been diagnosed with amental illness. Participants who had been diagnosed with some form of mental illness hadmore positive attitudes towards both factors (they were less prejudiced and more tolerant)than those who had never been diagnosed, as shown in Figure 3K. Table 3.12, Figure 3K
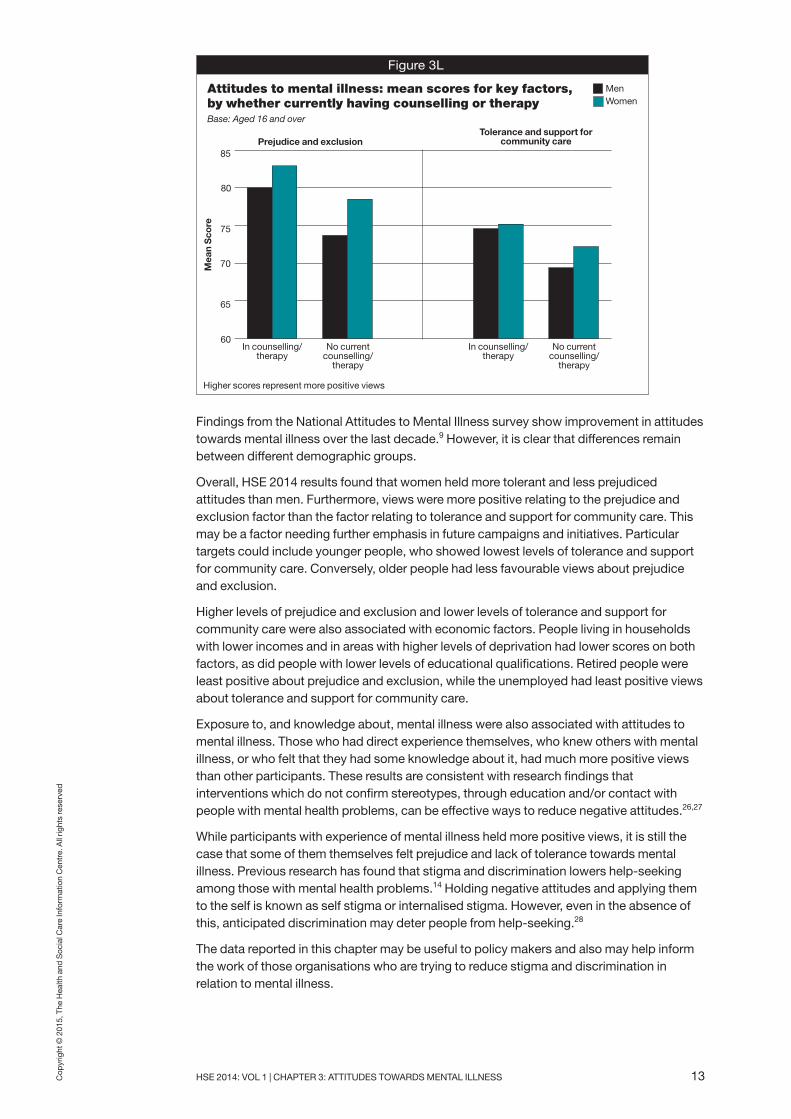
3.3.11 Attitudes towards mental illness by whether currently having counselling ortherapy
All participants were asked whether they were currently in receipt of counselling or therapyfor a mental, nervous or emotional problem, regardless of whether or not they had reportedany diagnosis of current or previous mental illness. A list of possible types of counsellingand therapy was presented;24 some types, such as bereavement counselling (grouped withother types of counselling), might not be directly related to experience of a mental illness.3% of adults reported that they were currently receiving counselling or therapy, and in fact,as reported in Chapter 2, the vast majority of these reported that they had ever beendiagnosed with at least one mental illness (91% of men and 88% of women).
As is evident from Figure 3L, attitudes towards mental illness were related to whether aperson was receiving any counselling or therapy, with statistically significant variation forboth factors. Participants who were having counselling or therapy at the time of theinterview had more positive attitudes than those who were not. Table 3.13, Figure 3L
3.4 Discussion
The analyses in this chapter confirm that attitudes towards mental illness are associatedwith socio-demographic characteristics such as age, region, household income, level ofdeprivation, education and economic status.25 Attitudes are also related to people’sknowledge and experience of mental illness, as well as whether people are havingcounselling or therapy.
12 HSE 2014: VOL 1 | CHAPTER 3: ATTITUDES TOWARDS MENTAL ILLNESS Cop
yrig
ht ©
201
5, T
he H
ealth
and
Soc
ial C
are
Info
rmat
ion
Cen
tre.
All
right
s re
serv
ed
Attitudes to mental illness: mean scores for key factors (age-standardised), by category of mental illness ever diagnosed Base: Aged 16 and over with a nurse visit
Mea
n S
core
Figure 3K
Seriousmental illness
Other/complex mental illness
Commonmental disorder
No mental illness
Seriousmental illness
Other/complex mental illness
Commonmental disorder
No mental illness
Category of diagnosed mental illness Category of diagnosed mental illness
MenWomen
60
65
70
75
80
85
Mea
n S
core
60
65
70
75
80
85
Prejudice and exclusion Tolerance and support for community care
Higher scores represent more positive views
Findings from the National Attitudes to Mental Illness survey show improvement in attitudestowards mental illness over the last decade.9 However, it is clear that differences remainbetween different demographic groups.
Overall, HSE 2014 results found that women held more tolerant and less prejudicedattitudes than men. Furthermore, views were more positive relating to the prejudice andexclusion factor than the factor relating to tolerance and support for community care. Thismay be a factor needing further emphasis in future campaigns and initiatives. Particulartargets could include younger people, who showed lowest levels of tolerance and supportfor community care. Conversely, older people had less favourable views about prejudiceand exclusion.
Higher levels of prejudice and exclusion and lower levels of tolerance and support forcommunity care were also associated with economic factors. People living in householdswith lower incomes and in areas with higher levels of deprivation had lower scores on bothfactors, as did people with lower levels of educational qualifications. Retired people wereleast positive about prejudice and exclusion, while the unemployed had least positive viewsabout tolerance and support for community care.
Exposure to, and knowledge about, mental illness were also associated with attitudes tomental illness. Those who had direct experience themselves, who knew others with mentalillness, or who felt that they had some knowledge about it, had much more positive viewsthan other participants. These results are consistent with research findings thatinterventions which do not confirm stereotypes, through education and/or contact withpeople with mental health problems, can be effective ways to reduce negative attitudes.26,27
While participants with experience of mental illness held more positive views, it is still thecase that some of them themselves felt prejudice and lack of tolerance towards mentalillness. Previous research has found that stigma and discrimination lowers help-seekingamong those with mental health problems.14 Holding negative attitudes and applying themto the self is known as self stigma or internalised stigma. However, even in the absence ofthis, anticipated discrimination may deter people from help-seeking.28
The data reported in this chapter may be useful to policy makers and also may help informthe work of those organisations who are trying to reduce stigma and discrimination inrelation to mental illness.
HSE 2014: VOL 1 | CHAPTER 3: ATTITUDES TOWARDS MENTAL ILLNESS 13Cop
yrig
ht ©
201
5, T
he H
ealth
and
Soc
ial C
are
Info
rmat
ion
Cen
tre.
All
right
s re
serv
ed
Attitudes to mental illness: mean scores for key factors, by whether currently having counselling or therapyBase: Aged 16 and over
Mea
n S
core
Figure 3L
60
65
70
75
80
85
In counselling/therapy
No currentcounselling/
therapy
In counselling/therapy
No currentcounselling/
therapy
MenWomen
Prejudice and exclusionTolerance and support for
community care
Higher scores represent more positive views
References and notes
1 World Health Organization. The Way Forward. Chapter 5 in The World Health Report 2001 – MentalHealth: New Understanding, New Hope. WHO, 2001, p. 111.www.who.int/whr/2001/en/whr01_ch5_en.pdf?ua=1
2 www.time-to-change.org.uk/
3 Department of Health. 2010 to 2015 government policy: mental health service reform. DH, London, 2015.www.gov.uk/government/publications/2010-to-2015-government-policy-mental-health-service-reform/2010-to-2015-government-policy-mental-health-service-reform
4 Department of Health. Closing the Gap: Priorities for essential change in mental health. DH, London,2014.www.gov.uk/government/uploads/system/uploads/attachment_data/file/281250/Closing_the_gap_V2_-_17_Feb_2014.pdf
5 World Health Organization. Comprehensive mental health action plan 2013 – 2020. WHO, 2013.http://apps.who.int/gb/ebwha/pdf_files/WHA66/A66_R8-en.pdf?ua=1
6 Singleton N, Bumpstead R, O’Brien M, Lee A, Meltzer H. Psychiatric Morbidity Among Adults Living InPrivate Households 2000. p32. The Stationery Office, London, 2001.www.ons.gov.uk/ons/search/index.html?newquery=adult+psychiatric+morbidity+survey+2000 This study showed that in any one year 1 in 4 British adults experienced at least one mental disorder, and1 in 6 experienced this at any given time.
7 McManus S, Meltzer H, Brugha T et al. Adult psychiatric morbidity in England, 2007. Results of ahousehold survey.The Health and Social Care Information Centre, Leeds, 2009.www.hscic.gov.uk/catalogue/PUB02931/adul-psyc-morb-res-hou-sur-eng-2007-rep.pdf This study showed that 23% of adults in England experienced one of the mental conditions covered;reference periods varied depending on the condition, from experience in the last week to experience inthe last year.
8 Corker E, Hamilton S, Henderson C et al. Experiences of discrimination among people using mentalhealth services in England 2008 – 2011. The British Journal of Psychiatry 2013;202:s58-s63.
9 www.time-to-change.org.uk/sites/default/files/Attitudes_to_mental_illness_2014_report_final_0.pdf
10 TNS BMRB. Attitudes to Mental Illness 2013 Research Report, Prepared for Time to Change. TNSBMRB, London, 2014. www.time-to-change.org.uk/sites/default/files/121168_Attitudes_to_mental_illness_2013_report.pdf
11 Evans-Lacko S, Malcolm E, West K et al. Influence of Time to Change’s social marketing interventions onstigma in England 2009-11. British Journal of Psychiatry 2013:202(S55):s77-s88.
12 Before the factor analysis was undertaken, eligible cases for the analysis were identified. Any cases withmore than three ‘don’t know’ answers across the 12 statements were excluded, and there were 6687valid cases with at least 9 valid responses for analysis. Two-factor and three-factor analyses were run,with VARIMAX rotation. Three factors explained 52% of the total variance, while two factors explained43%. A Cronbach’s Alpha reliability analysis was run for all derived factors. Due to the fact that Factor 1had a statistically significantly higher reliability measure within a two-factor solution, and for consistencywith previous findings, a two-factor solution was selected for this research.
13 Cronbach’s Alpha score for Factor 1 was 0.767; Cronbach’s Alpha score for Factor 2 was 0.668. Thevalue of Cronbach’s Alpha varies from zero to 1, with scores above 0.6 constituting an appropriatedegree of reliability.
14 Rusch N, Evans-Lacko S, Henderson C, Flach C, Thornicroft G. Knowledge and Attitudes as Predictorsof Intentions to Seek Help for and Disclose a Mental Illness. Psychiatry Online.org, 2011, vol 62, no. 6.
15 Goldberg D, Williams PA. User Guide to the General Health Questionnaire. NFER-Nelson, Windsor, 1998.
16 Age-standardised data are discussed here, to allow comparisons between regions to exclude age-related effects. See the section in Section 3.2.2. about age-standardisation.
17 Not all households provide information about household income. 20% of adults lived in households thatdid not have any information about household income.
18 These proportions are based on all adults participating in the HSE 2014, table not shown.
19 This category includes those who are not actively seeking work, including those who are sick ordisabled, or who are looking after the family or home.
20 These proportions are based on all adults participating in the HSE 2014, table not shown.
21 The proportion mentioning that they had themselves experienced mental illness at this question is verymuch lower than the proportion identified with mental illnesses in Chapter 2. The question examined herepresents a very different context from the questions examined in Chapter 2, where people werepresented with a list of conditions and asked which they had experienced. It is also possible that, whenasked about the ‘person closest to you’ with a mental illness, many may not have thought to includethemselves.
22 These proportions are based on all adults participating in the nurse visit (where these questions wereasked) in HSE 2014; table not shown.
23 Prevalence of the different categories of mental illness are taken from Chapter 2, Table 2.1.
14 HSE 2014: VOL 1 | CHAPTER 3: ATTITUDES TOWARDS MENTAL ILLNESS Cop
yrig
ht ©
201
5, T
he H
ealth
and
Soc
ial C
are
Info
rmat
ion
Cen
tre.
All
right
s re
serv
ed
24 The types of counselling listed were:CounsellingBereavement counsellingCognitive behavioural therapyPsychotherapy or psychoanalysisMindfulness therapyAlcohol or drug counsellingArt, music or drama therapySocial skills trainingCouples or family therapySex therapyAnother type of therapy.
25 Evans-Lacko S, Henderson C, Thornicroft G. Public knowledge, attitudes and behaviour regarding people withmental illness in England 2009-2012. British Journal of Psychiatry 2013;202(S55):s51-s57, 2013.
26 Mehta N, Clement S, Marcus E et al. Systematic review of evidence for effective interventions to reduce mentalhealth related stigma and discrimination: medium and long-term effectiveness. British Journal of Psychiatry2015;207:377–384.
27 Corrigan PW, Morris SB, Michaels PJ et al. Challenging the public stigma of mental illness: a meta-analysis ofoutcome studies. Psychiatr Serv. 2012;63(10):963-73.
28 Clement S, Schauman O, Graham T et al.What is the impact of mental health-related stigma on help-seeking?A systematic review of quantitative and qualitative studies. Psychol Med. 2015;45(1):11-27.
HSE 2014: VOL 1 | CHAPTER 3: ATTITUDES TOWARDS MENTAL ILLNESS 15Cop
yrig
ht ©
201
5, T
he H
ealth
and
Soc
ial C
are
Info
rmat
ion
Cen
tre.
All
right
s re
serv
ed
Recommended