Aquat. Living Resour. 21, 1–12 (2008)c© EDP Sciences, IFREMER, IRD 2008DOI: 10.1051/alr:2008017www.alr-journal.org
AquaticLivingResources
Assessment of fish trophic status and relationships by stableisotope data in the coral reef lagoon of New Caledonia, southwestPacificLaure Carassou1,a, Michel Kulbicki1, Thomas J.R. Nicola2 and Nicholas V.C. Polunin2
1 Institute of Research for Development, BP A5, 98848 Nouméa Cedex, New Caledonia2 Department of Marine Sciences and Coastal Management, University of Newcastle, Newcastle upon Tyne, UK
Received 25 September 2007; Accepted 20 February 2008
Abstract – This study examines the trophic status and relationships of coral reef fish in the lagoon of New Caledonia,southwest pacific. The feeding habits of 34 fish species collected at three contrasted sites were first described using acompilation of gut contents observations and data from the literature. The carbon and nitrogen isotope signatures ofthese fish and of some of their potential ultimate food sources were also determined at each site. Despite some spatialvariations in the isotopic signatures of most food sources and fish trophic groups, the overall trophic structures of fishassemblages were similar at the three sites. Stable isotope data were then used to re-assign fish species to trophic groupsbased on the δ15N signatures of fish and their food sources. Herbivorous fish species were clearly distinguished from theother trophic groups by their lower δ15N signatures, consistent with an estimated trophic position of ∼2 for all speciesexamined. Scaridae were however characterized by relatively higher δ13C and lower δ15N, which is probably linked withthe role of detritus in their diet. The estimated trophic positions of planktivorous fish species were consistent with theirgut contents-based classification. Conversely, the isotopic signatures of carnivorous and piscivorous fish species largelyoverlapped, and their estimated trophic positions were much lower than expected. This suggests that these species feedover a broader range of trophic levels and food sources than implied by the gut contents observations, and indicatesthat their diet is partly omnivorous. Finally, the relationships between body mass and the isotopic signatures of four fishspecies were significant for at least one isotopic ratio for each species. Since ontogenetic variations and omnivorousdiets are difficult to assess with gut contents data only, stable isotopes revealed essential in estimating the actual trophicstatus and relationships characterizing the fish species under study.
Key words: Coral reef fish / Gut contents / Stable isotopes / Trophic position / Ontogenetic variability / Pacific Ocean
Résumé – Utilisation des isotopes stables pour l’estimation du régime alimentaire et des relations trophiquesdes poissons du lagon de Nouvelle-Calédonie (Pacifique Sud-Ouest). Cette étude fournit une analyse du régimealimentaire et des relations trophiques qui caractérisent les poissons du lagon de Nouvelle-Calédonie. Le régime ali-mentaire de 34 espèces, récoltées dans trois stations contrastées, est décrit par la méthode des contenus stomacaux enutilisant une large base de données locales, associée à une étude bibliographique. Les isotopes stables du carbone etde l’azote sont ensuite mesurés sur les poissons récoltés et sur différentes sources alimentaires potentielles prélevées àchaque station. Malgré des différences spatiales significatives pour la plupart des sources alimentaires et des groupestrophiques de poissons, la structure trophique globale des assemblages se révèle peu variable d’une station à l’autre.Les données isotopiques sont ensuite utilisées pour réassigner les espèces de poissons à différents groupes trophiques,sur la base du rapport entre le δ15N des espèces et de celui de leurs sources alimentaires. Les données isotopiquesconfirment les résultats des analyses de contenus stomacaux pour les herbivores et les planctivores. Les Scaridae sontcependant caractérisés par des valeurs particulièrement élevées en δ13C et faibles en δ15N, probablement liées à unrégime alimentaire en partie détritivore. A l’inverse, pour la plupart des espèces carnivores et piscivores, les donnéesisotopiques mettent en évidence une gamme de sources alimentaires plus diversifiée que celle fournie par les étudesde contenus stomacaux, et un comportement alimentaire plutôt omnivore. Enfin, la relation entre la masse corporelleet les ratios isotopiques, testée chez quatre espèces, montre des variations ontogéniques significatives pour au moins
a Corresponding author: [email protected]
Article published by EDP Sciences and available at http://www.alr-journal.org or http://dx.doi.org/10.1051/alr:2008017
2 L. Carassou et al.: Aquat. Living Resour. 21, 1–12 (2008)
un des isotopes étudiés (carbone ou azote) pour les quatre espèces, mais pas de changement de niveau trophique. Lesvariations ontogéniques et les comportements alimentaires de type omnivore étant difficiles à évaluer par les seulesdonnées de contenus stomacaux, les isotopes stables se révèlent cruciaux pour l’estimation des niveaux trophiques réelsdes espèces et la représentation des relations trophiques au sein des assemblages.
1 Introduction
The structure and functioning of fish assemblages relyin part on the trophic status and relationships characterizingfish species. The understanding of fish trophic networks hasthus become increasingly important for the establishment ofecologically based management programmes (Kulbicki et al.2005). In ecosystems characterized by a very high species di-versity, such as coral reefs, information on the diet of fishspecies remains incomplete and difficult to assess. Fish dietsare often studied using gut contents, which give no informationabout the origin of the food sources consumed and are repre-sentative only of the food ingested by fish at the time of sam-pling (Pinnegar and Polunin 1999). Conversely, the analysis ofthe stable isotope signatures of prey and predators provides in-formation about the food-web structure and energy flow overlong time periods (Pinnegar and Polunin 2000; Phillips andGregg 2003). Indeed, the ratio of 13C/12C, noted δ13C, in-creases by less than 1.0%� on average per trophic level (Post2002), and can thus be used to discriminate between the car-bon sources used by consumers (Peterson 1999). The ratio of15N/14N, noted δ15N, increases from diet to consumers witha highly variable enrichment level, comprised between 2 and5%� (Olive et al. 2003), a mean enrichment of 3.4%� beinggenerally admitted (Post 2002). Despite its variability, the δ15Nenrichment is consistent throughout successive trophic levels,and can thus provide a measure of trophic position (Post 2002).
In New Caledonia, southwest Pacific, the lagoon extendson an area of 19 000 km2, thus providing a wide range of envi-ronmental conditions, from highly productive coastal ecosys-tems, influenced by terrigeneous inputs (Tenório et al. 2005)with high chl a concentrations (Pinazo et al. 2004) and zoo-plankton densities (Champalbert 1993), to barrier reef ecosys-tems influenced by oligotrophic oceanic water flows (Pinazoet al. 2004). This strong environmental variability and theproximity of New Caledonia to the coral reefs biodiversitycenter located in the China Sea-Philippines-Indonesia regionresult in highly diverse shorefish assemblages in the lagoon,with a total of 1694 species (Fricke and Kulbicki 2006). How-ever, little is known about the trophic relationships that supportthis highly diverse shorefish fauna, since the few studies avail-able have only considered specific trophic groups or only usedgut contents data (Grimaud and Kulbicki 1998; Bozec et al.2005; Kulbicki et al. 2005).
The principal aim of the present study was to assess the fishtrophic status and relationships in the lagoon of New Caledo-nia through the use of stable isotope data, while taking intoaccount the high spatial heterogeneity of the lagoon.
This study was therefore conducted in four stages.• The fish species collected at three sites, chosen for their
contrasted environmental conditions, were assigned to trophicgroups, relying on previous gut contents data and on a synthe-sis from the literature.
• The isotopic signatures of those fish and of some of theirpotential food sources were assessed at each site, and com-pared between sites, in order to determine whether the trophicfunctioning of fish assemblages varied spatially.• The fish species were re-assigned to trophic groups based
on stable isotope analyses, in order to check whether any po-tential food sources had been neglected by previous gut con-tents analyses.• The relationships between δ13C and δ15N signatures and
body mass were tested for four fish species, so as to detect ifan ontogenetic variability occurred in their diet.
2 Material and methods
2.1 Sampling sites
Observations from hydrodynamic 3D models developedat the Institute of Research for the Development (IRD) wereused in order to select three sampling sites where water col-umn conditions were representative of the contrasts in watercolumn productivity characterizing the lagoon of New Cale-donia (see Ouillon et al. 2005; Jouon et al. 2006 for recentapplications of the models). The three chosen sites were sep-arated by distances of 11 to 14 km, and included: a fringingreef site (Site 1: 20˚10.0’S 166˚20.3’E), an intermediate reefsite (Site 2: 20˚19.2’S 166˚23.5’E) and a barrier reef site (Site3: 22˚12.3’S 166˚17.7’E), lying approximately 20 km from thecoast (Fig. 1).
2.2 Sampling
All samples were collected within a two month period,from July to August 1996, in order to reduce the temporalvariations in the isotopic signatures of the organisms (Owens1987). Except for spanish mackerel Scomberomorus commer-son, provided by the South Pacific Commission, all the fishsamples were collected at the three chosen sites using 7% ac-tive substance rotenone. Although it contains carbon, any po-tential effect of rotenone on the carbon isotope signatures offish can be considered as negligible. Rotenone residues haveindeed been shown to be rapidly cleared from fish plasma, withless than 2% of the dose remaining after 20 min (Gingerich1986). Moreover, as the same sampling procedure was appliedfor all fish species and at all sites, the potential resulting errorin isotopic signatures was supposed to be standardized acrossspecies and sites. Poisoning was performed on 250–300 m2
areas of coral reef surrounded by a 60 m long, 3 m deep and10 mm mesh stretch net. The fish were placed on ice immedi-ately after their removal from water.
Three plankton samples, each represented by two repli-cates, were collected at each site from the upper 5 m layer

L. Carassou et al.: Aquat. Living Resour. 21, 1–12 (2008) 3
Fig. 1. Position of the study sites (stars) in the southwest lagoon ofNew Caledonia: Fringing reef (site 1), Intermediate reef (site 2) andBarrier reef (site 3).
of the water column, using five minutes horizontal tows witha 35 μm mesh plankton net. All plankton samples were pre-served in formaldehyde. Formaldehyde may alter the isotopicsignatures of plankton (Kaehler and Pakhomov 2001), but thisalteration has been shown to be low, not exceeding 1.1%� for13C and 1.5%� for 15N, depending on the conservation proce-dure (Feuchtmayr and Grey 2003). In order to check for anypotential effect of formaldehyde on the results of our study,all the ensuing analyses implying calculations based on zoo-plankton isotopic signatures (i.e., trophic levels calculations)were repeated three times, by using the original δ13C and δ15Nzooplankton signatures, and also (δ13C ± 1.1%�) and (δ15N ±1.5%�). In each case, the three calculations brought to similarinterpretations, so we decided to present only the results im-plying raw signatures of plankton. Furthermore, since a simi-lar procedure was applied for all plankton samples at all sites,the resulting error was expected to be standardized across allsamples and sites.
Turf forming microalgae, red calcareous algae and themost common seaweeds encountered were sampled by scubadiving at each site. Each algal type was represented by threesamples at each site, each sample being replicated twice. Themacrophytes collected were: an unidentified brown macroalgaat the fringing reef site, a brown macroalga, Lobophora sp.(Phaeophyceae, Dictyotales), at the intermediate reef site, and
a calcareous green alga, Halimeda sp. (Chlorophyta, Bryop-sidales), at the barrier reef site. The algae were placed on iceimmediately after their removal from water.
2.3 Fish diets and identification of gut contents-basedtrophic groups
The feeding habits of the collected fishes were identifiedby combining several data sets: a large set of unpublished pre-vious data on fish gut contents collected by IRD over long timeperiods in the same area (Kulbicki et al. 2005; Kulbicki 2006),data from the literature, and the Fishbase website1 (see Table 1for the most recent references consulted). The consistency ofthe diets obtained by this combination of previous data wascompleted by direct observations of gut contents performed onone to three individuals of each species collected at each site,depending on their respective abundances. Prey items rarelyrecorded in the literature or rarely observed in combined gutcontents data were reported but considered as minor. The fishspecies were assigned to trophic groups according to the ma-jor prey items described in the literature and observed in com-bined gut contents data. The trophic groups identified were:herbivorous, planktivorous, carnivorous and piscivorous. Al-though piscivorous fish may be considered as carnivorous, itwas decided to distinguish them from the strictly carnivorousones since they should be on average one trophic level higher(Bozec et al. 2004).
2.4 Sample preparation
Two to six individuals were selected for each fish speciesfrom each site. They were weighed (fresh weight, in g) andfork-length measured (FL, in cm). For each individual, two fil-lets of white muscle tissue taken from the dorsal region weredissected for analysis. Muscle tissue presents the advantageof showing a lower variability in isotopic composition com-pared to other body parts (Pinnegar and Polunin 1999). More-over, the use of muscle tissues, whose dependence on oxida-tive metabolism is limited relative to other body parts (e.g.,heart, brain, viscera or the hepatobiliary system), allows to re-duce any potential effect of rotenone on fish isotopic signatures(Gingerich 1986). For the smaller fish (<3 g), the whole spec-imen was used, after removing the head and viscera. Sampleswere freeze-dried for 24 h.
The plankton samples were filtered on 200 μm and 35 μmmesh filters in order to separate two size ranges of particles: the35–200 μm size range, constituted by particulate organic mat-ter (POM) consisting of phytoplankton and detritus and repre-senting the base of the trophic food chain, and the >200 μmsize range, constituted by zooplankton and representing a pri-mary consumer level. Each filtered sample was washed downwith de-ionized water to remove salt, dried at 60 ◦C during24 h in an oven and stored with silica gel prior to isotopicanalysis (Lajtha and Michener 1994). The turf, red calcareousand macroalgae samples were also freeze-dried for 24 h andstored with silica gel prior to isotopic analysis.
1 http://www.fishbase.org/

4 L. Carassou et al.: Aquat. Living Resour. 21, 1–12 (2008)
Table 1. Number of individuals, fork length range (cm) and body mass (fresh weight) range (g) for each fish species, with the correspondingcollection sites: Fringing reef (site 1), Intermediate reef (site 2) and Barrier reef (site 3), see Fig. 1 for the location of the sampling sites.
Number of Fork lengthFish family Fish species fishes range Body mass Site
collected (cm) (g)Acanthuridae Acanthurus nigrofuscus 3 8–15 13–81 1
Ctenochaetus striatus 6 10–17 28–142 1 + 2Zebrasoma scopas 2 13–14 48–68 1
Apogonidae Cheilidopterus quinquelineatus 9 4–9 1–10 1 + 2 + 3Ostorhinchus doederleini 6 8–9 8–14 1 + 2
Blenniidae Cirripectes stigmaticus 3 6–7 3–5 2Caesionidae Caesio caerulaurea 6 14–22 54–167 1 + 3Chaetodontidae Chaetodon citrinellus 2 9–10 13–19 3
Chaetodon flavirostris 3 5–12 3–7 2Haemulidae Plectorhynchus lineatus 2 20–31 121–456 2Holocentridae Sargocentron rubrum 3 15–16 87–94 1Labridae Bodianus perditio 3 17–27 92–391 3
Hemigymnus melapterus 3 16–21 83–183 1Lethrinidae Lethrinus atkinsoni 3 17–19 90–114 1Mullidae Mulloidichthys flavolineatus 3 15–20 43–94 3
Parupeneus ciliatus 3 20–22 154–209 2Nemipteridae Scolopsis bilineatus 5 10–18 18–133 1 + 2Pomacentridae Abudebduf sexfasciatus 9 7–10 9–25 2 + 3
Centropyge tibicens 3 8–10 15–36 2Chromis viridis 3 4–5 2–3 2Chrysiptera notialis 3 5–6 4–5 1Dascyllus aruanus 6 4–6 2–7 2 + 3Pomacentrus adelus 3 6–7 9–11 1Pomacentrus moluccensis 3 7–10 10–20 2Stegastes nigricans 9 8–12 12–147 2 + 3
Scaridae Chlorurus sordidus 3 13–19 119–515 3Scarus niger 3 15–19 77–147 3Scarus schlegeli 3 16–25 69–270 3
Scombridae Scomberomorus commerson 3 73–95 3300–7200 3Scorpaenidae Scorpaenodes guamensis 3 5–7 3–7 3Serranidae Epinephelus merra 7 15–23 50–180 1 + 2 + 3Siganidae Siganus doliatus 3 9–17 79–165 1Synodontidae Saurida gracilis 3 13–18 18–58 3
Synodus variegatus 9 9–18 7–58 1 + 2 + 3
All samples (fish, plankton and all algae types) wereground to a homogenized fine powder with a pestle and a mor-tar. Both the calcareous algae and the plankton samples re-quired an acidification with 1% HCL to remove the inorganiccomponents. Each sample was weight-calibrated in order topermit comparisons with the standard reference material, asdetermined in trial mass spectrometry runs: 1 mg for fish sam-ples, 5 mg for turf-forming algae, macroalgae and plankton,and 12 mg for red calcareous algae and Halimeda sp.
2.5 Stable isotope analyses
Dual analyses of the stable isotope abundances of carbonand nitrogen were conducted at the University of Newcastlefor plankton and algae, and at the Scottish Crops Research In-stitute for fish samples. All the samples of POM and algae (i.e.,food sources), zooplankton (i.e., primary consumers) and fish(i.e., secondary consumers) were oxidised, and the N2 and CO2
passed through a single inlet dual collector mass spectrometer(Europa Scientific ANCA SL 20-20 system). For calibration ofthe equipment and compensation for drift with time, the refer-ence standards used were leucine for source materials and coddorsal muscle tissues for fish samples. Ratios of 13C/12C and15N/14N were expressed relative to the internal standards: vir-tual PeeDee Belemnite (vPDB) for carbon, and atmosphericN2 for nitrogen. The relative abundances of stable isotopes(%�) were expressed according to the formula:
δX = [(Rsample/Rstandard) − 1] × 103
where X is 13C or 15N,R is the ratio 13C/12C or 15N/14N.Increase or decline in δ13C or δ15N indicates enrichment ordepletion of the heavy isotope compared to the lighter iso-tope relative to the internal standard. The difference found inδ13C and δ15N data between the two ANCA mass spectrome-ters when analyzing the same material was <0.2%�.

L. Carassou et al.: Aquat. Living Resour. 21, 1–12 (2008) 5
2.6 Data analysis
A major condition when using stable isotopes in determin-ing food sources is that these food sources have distinct iso-topic signatures (Vander Zanden and Rasmussen 2001). Dif-ferences in both δ13C and δ15N between food sources werethus tested using one-factor ANOVAs. Differences in δ13Cand δ15N signatures between fish trophic groups were sim-ilarly tested, with fish individuals as replicates within eachtrophic group. Since some spatial variability was expectedin the isotopic signatures of at least the food sources, one-factor ANOVAs were also used to test for the effect of siteson the δ13C and δ15N signatures of each food source commonto the three sites, and on the δ13C and δ15N mean signaturesof each fish trophic group, with fish individuals as replicateswithin each trophic group. As linear analyses are sensitiveto departure from normality, the distribution of the δ13C andδ15N signatures were tested for normal distribution using theKolmogorov-Smirnov test prior to being entered in the variousmodels (Scherrer 1984).
The fish species were re-assigned to trophic groups by cal-culating trophic positions based on their δ15N mean signatures.The ultimate food sources of fish (i.e., POM and algae) wereassigned the basic trophic positions, equal to 1 (Bozec et al.2004), and the site-specific differences in their δ15N signatureswere considered. A fractionation of 3.2%� per trophic levelwas used, following the recommendations of Sweetings et al.(2007) for fish muscle tissues. The trophic positions (TP) ofeach fish species at each site were thus calculated as follows:
TPfish = (Δδ15N/3.2) + 1, with Δδ15N = δ15Nfish − δ15Nsource,
the source being represented by either POM or different algaetypes in each case. The expected trophic positions were ∼2for herbivorous fishes, ∼2.5 to 3 for planktivorous, ∼3 to 3.5for carnivorous and ∼3.5 and more for piscivorous, followingBozec et al. (2004).
Finally, since fish body mass is known to have a significantinfluence on the δ13C and δ15N fractionation values (Sweetinget al. 2007), the effect of body mass on the isotopic signaturesof fish was tested for the species presenting the highest abun-dances and widest body mass range, using linear regressionmodels. This enabled detection of a potential ontogenetic vari-ability occurring in the diet of these species, a point which hasto be taken into account when assigning trophic status to fishspecies. ANOVAs and regression analyses were performed us-ing Systat v10.2.
3 Results
3.1 Fish sampling
A total of 141 fishes were analyzed: 41 coming from thefringing reef site, 48 from the intermediate reef site and 52from the barrier reef site. These fishes belonged to 34 species:14 on the fringing reef site, 16 on the intermediate reef site and17 on the barrier reef site, and ranged from 4.5 to 95.0 cm FLand from 1.0 g to 7.2 kg in weight (Table 1). Only three species
were common to the three sampling sites (Cheilidopterus quin-quelineatus, Epinephelus merra, Synodus variegatus), all ofthem being piscivores. Seven were common to at least twosampling sites: two were common to the fringing and the in-termediate reefs, three to the intermediate and the barrier reefsand only one to the fringing and the barrier reefs.
3.2 Fish diets and gut contents-based trophic groups(Table 2)
According to the combined gut contents data, amongthe 34 species of fish collected, 11 were herbivorous (H1to H11), mainly represented by Acanthuridae, Pomacentri-dae and Scaridae; seven were planktivorous (Z1 to Z7), in-cluding five species of Pomacentridae; nine were carnivorous(C1 to C9), including Mullidae and Labridae; five were pis-civorous, with Scomberomorus commerson (Pi4) consumingsmall pelagic fish species, while Synodus variegatus (Pi5),Cheilodipterus quinquelineatus (Pi1) and Epinephelus merra(Pi2) consumed more reef site-attached fish species; twoChaetodontidae were coralivorous, but for statistical analysesthey were assimilated to carnivores (C10 and C11, Table 2).
3.3 Trophic structure of fish assemblages (Fig. 2 andTable 3)
The food sources considered were characterized by signif-icant differences in their δ13C and δ15N signatures (“Table 3;ANOVA”2 – A[1], p < 0.05). POM showed a consistentlydepleted δ13C signature (mean = -20.2 ± 0.4%�) relative toall other food sources (Fig. 2), and significant spatial differ-ences in both δ13C and δ15N (A [3], p < 0.05). The greencalcareous algae Halimeda sp. collected at site 3 also showeda low δ13C signature (mean = 18.5 ± 0.5%�). Conversely, thered calcareous algae showed consistently enriched δ13C sig-natures (mean = –3.9 ± 0.3%�), and neither did their δ13C orδ15N signatures vary spatially (A [3], p > 0.05). The brownunidentified macroalgae and Lobophora sp. collected at sites 1and 2 presented intermediate values of δ13C, with means of –10.5±0.2%� and –10.9± 0.5%� respectively. The turf microal-gae presented variable δ13C at the three sites (A [3], p < 0.05),with a particularly enriched signature at site 3 (Fig. 2), buttheir δ15N signatures were similar at the three sites (A [3],p > 0.05). Among the food sources collected at the three sites,turf microalgae presented the most depleted mean δ15N signa-ture (mean = 3.1 ± 0.2%�), followed by POM (mean = 4.0 ±0.5%�) and red calcareous algae (mean = 4.5 ± 0.3%�). Thezooplanktonic primary consumers showed a mean δ13C signa-ture varying from –18.5%� at site 2 to –20.1%� at site 1, withweak but significant spatial differences (A [3], p < 0.05). Theδ15N mean signature of zooplankton was enriched by ∼3%�relative to POM, with a mean of 6.4%� and no differences be-tween sites (A [3], p > 0.05). Finally, as indicated by theirposition along the δ13C axis, red calcareous algae were prob-ably not a major source of food for any of the fish speciesexamined at any site. A similar observation can be made for
2 “Table 3; ANOVA”: A.

6 L. Carassou et al.: Aquat. Living Resour. 21, 1–12 (2008)
Table 2. Trophic groups of the 34 fish species assigned from combined gut contents data, including direct observations from the present study;previous unpublished data from the same area and published data from the literature. Food items between brackets indicate prey rarely observedin gut contents or rarely reported in the literature.
Trophic group Fish species Prey items Code ReferencesHerbivorous
Acanthurus nigrofuscus Microalgae H1 Polunin et al. 1995Centropyge tibiscens Microalgae (corals and tunicates) H2 Shirai 1986Cirripectes stigmaticus Microalgae H3 Sano et al. 1984Ctenochaetus striatus Microalgae (detrital material) H4 Choat et al. 2004Pomacentrus adelus Filamentous algae (green algae) H5 Allen 1991Scarus niger Microalgae (detrital material) H6 Ochavillo et al. 1992Scarus schlegeli Microalgae (detrital material) H7 Choat et al. 2004Chlorurus sordidus Microalgae (detrital material) H8 Choat et al. 2002Siganus doliatus Microalgae H9 Woodland 1997Stegastes nigricans Microalgae (microinvertebrates) H10 Hata and Kato 2004Zebrasoma scopas Microalgae (macroalgae) H11 Choat et al. 2004
PlanktivorousAbudebduf sexfasciatus Zooplankton (microalgae) Z1 Myers 1991Ostorhinchus doederleini Zooplankton (nekton, zoobenthos) Z2 Myers 1991Caesio caerulaurea Zooplankton Z3 Ter Kuile 1989Chromis viridis Zooplankton (microalgae) Z4 Allen 1991Chrysiptera notialis Zooplankton Z5 Allen 1991Dascyllus aruanus Zooplankton (microalgae) Z6 Booth 2004Pomacentrus moluccensis Zooplankton (microalgae) Z7 Pratchett et al. 2001
CarnivorousBodianus perditio Macroinvertebrates C1 Kulbicki et al. 2005Hemigymnus melapterus Macroinvertebrates (zooplankton) C2 Westneat 2001Lethrinus atkinsoni Macroinvertebrates (nekton) C3 Kulbicki et al. 2005Mulloidichthys flavolineatus Macroinvertebrates (nekton) C4 Kulbicki et al. 2005Parupeneus ciliatus Macroinvertebrates (zooplankton) C5 Kulbicki et al. 2005Plectorhynchus lineatus Macroinvertebrates (nekton) C6 Myers 1991Sargocentron rubrum Macroinvertebrates (nekton) C7 Kulbicki et al. 2005Scolopsis bilineatus Macroinvertebrates (nekton) C8 Russell 1990Scorpaenodes guamensis Macroinvertebrates C9 Myers 1991Chaetodon citrinellus Corals (microalgae) C10 Allen et al. 1998Chaetodon flavirostris Corals (microalgae) C11 Coleman et al. 1981
PiscivorousCheilidopterus quinquelineatus Reef nekton P1 Nakamura et al. 2003Epinephelus merra Reef nekton P2 Kulbicki et al. 2005Saurida gracilis Nekton P3 Kulbicki et al. 2005Scomberomorus commerson Pelagic nekton P4 Blaber et al. 1990Synodus variegatus Reef nekton P5 Shibuno et al. 1996
the green calcareous alga Halimeda sp. collected at site 3. Theδ13C signatures presented by brown macroalgae and turf mi-croalgae were more consistent with those of most fishes. Thelinks between the δ15N signatures of food sources and fish willbe examined in more detail below.
Each trophic group of fish was characterized by a specificδ13C and δ15N range of values (A [2], p < 0.05). At the threesites, the herbivorous fish species were clearly separated fromthe other trophic groups by their low δ15N signatures (Fig. 2),except for Stegastes nigricans (H10) at sites 2 and 3, and Cen-tropyge tibiscens (H2) at site 2, which presented higher δ15Nsignatures (Figs. 2b and 2c). The Scaridae species (H6, H7 and
H8) collected at site 3 showed particularly low δ15N and highδ13C signatures (Fig. 2c). Consequently, the mean δ15N andδ13C values of herbivores displayed significant spatial varia-tions (A [4], p < 0.05). Contrary to the herbivorous species,the planktivorous, carnivorous and piscivorous species werepoorly discriminated by their isotopic signatures (Fig. 2), espe-cially at site 2 where their values largely overlapped (Fig. 2b).Spatial variations in δ13C signatures were only found for car-nivores and for piscivores when the pelagic species Scombero-morus commerson was excluded (A [4], p < 0.05). Conversely,only the δ15N signatures of piscivores did not vary spatially(A[4], p > 0.05) and Synodus variegatus (P5) showed the

L. Carassou et al.: Aquat. Living Resour. 21, 1–12 (2008) 7
Fig. 2. Plots of δ15N against δ13C signatures of food sources, zoo-plankton and fish species at the fringing (site 1), intermediate (site 2)and barrier reef (site 3) sites. The points represent the mean valuesand the bars the standard deviations. See Table 2 for species codesand Fig. 1 for the position of the sampling sites.
highest δ15N values at all sites (Fig. 2). Site 3 was also char-acterized by a wide dispersion of δ13C and δ15N values amongcarnivorous and piscivorous species, whereas these specieswere plotted more narrowly at site 1 (Figs. 2a and 2c).
3.4 Re-assessment of fish trophic groups based onisotopic data (Table 4)
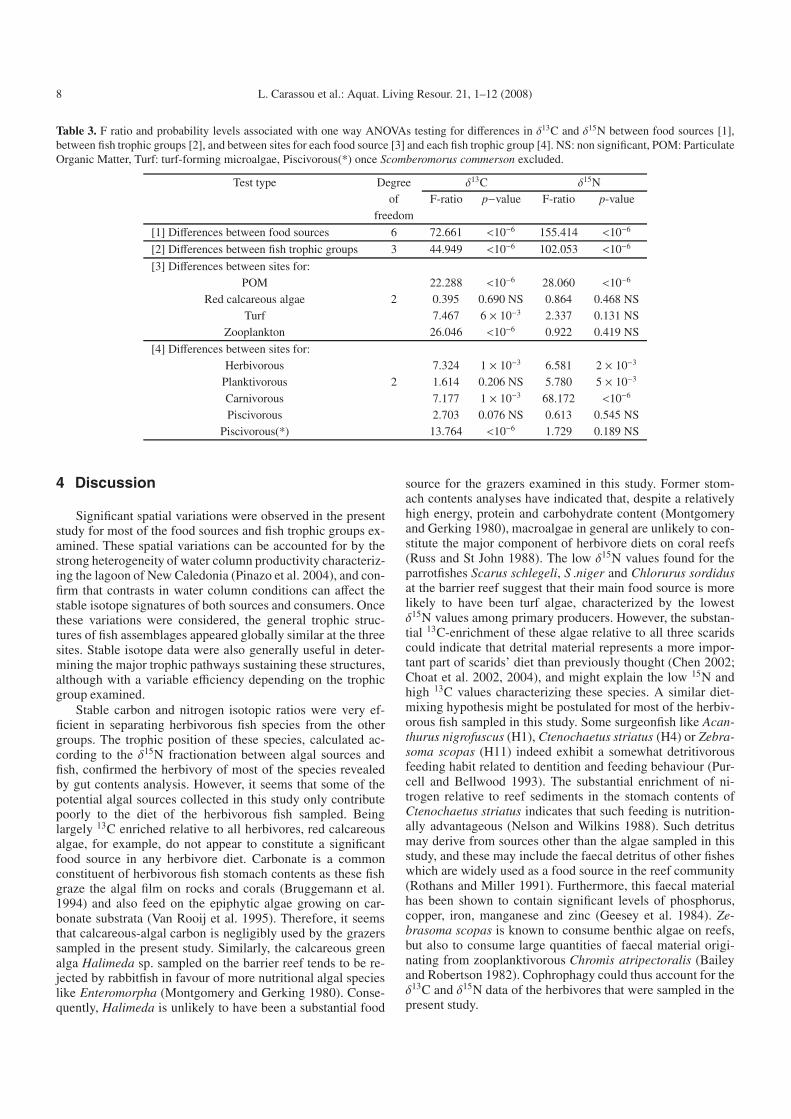
Generally, the estimated trophic positions based on eitherPOM or algae as the first trophic level were close (Table 4). Forseven out of the 11 herbivorous-classified species, the Δδ15Nestimated trophic positions were consistent with gut contentsdata, with mean positions ranging from 1.8 to 2.5 (i.e. ∼2;Table 4). However, the three Scaridae species (Scarus niger, S.schlegeli and Chlorurus sordidus, H6 to H8) and Cirripectesstigmaticus (H3) were characterized by lower trophic posi-tions, with means ranging from 1.4 to 1.6 (i.e. <2; Table 4).The estimated trophic positions of the seven planktivorous-classified species ranged from 2.4 to 2.8 (Table 4), logically in-dicating one higher trophic level relative to herbivores and con-firming the gut contents-based classification. For carnivorousand piscivorous species however, the estimated trophic posi-tions were generally lower than expected. The mean estimatedtrophic positions of the eleven carnivorous-classified speciesranged from 2.0 to 2.9, which suggest that these species feedover a broader range of food items than indicated by gutcontents data alone. The values for Mulloidichthys flavolin-eatus (C4), Bodianus perditio (C1) and Scolopsis bilineatus(C9) were particularly low, always < to 2.4. Among the fivepiscivorous-classified species, only did Scomberomorus com-merson (P4) show a high estimated trophic position > 3.5,consistent with its gut contents-based classification, whereasthe mean values for Saurida gracilis (P3) and Cheilidopterusquinquelineatus (P1) were as low as 2.3 to 2.5 respectively(Table 4).
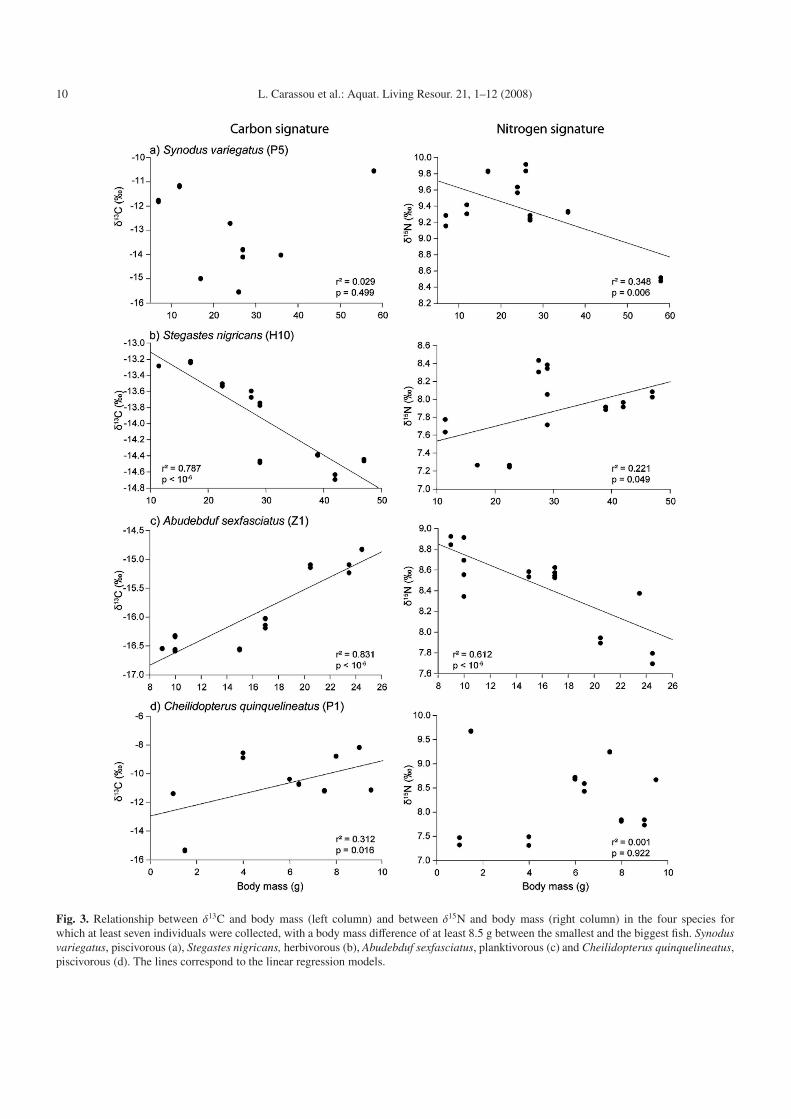
3.5 Ontogenetic variability in fish feeding behaviour(Fig. 3)
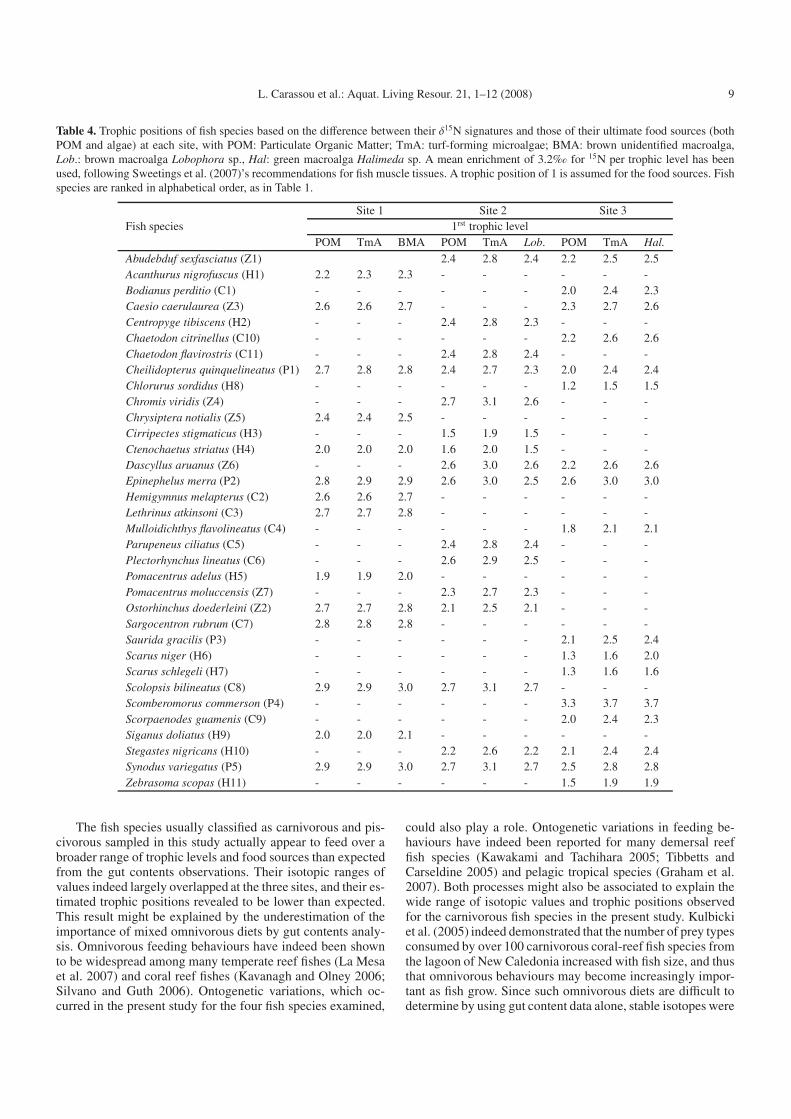
The four species selected for the study of the relation-ship between body mass and isotopic variations were: Synodusvariegatus (P5), Stegastes nigricans (H10), Abudebduf sexfas-ciatus (Z1) and Cheilidopterus quinquelineatus (P1). Thesespecies were indeed the only ones to provide at least sevenindividuals with a body mass difference of at least 8.5 g be-tween the smallest and the biggest fish. The δ13C signature ofmuscle tissue increased with body mass for Abudebduf sexfas-ciatus and Cheilidopterus quinquelineatus (Figs. 3c and 3d;r2 = 0.83, p < 10−6 and r2 = 0.31, p = 0.016 respectively),whereas it decreased with body mass for Stegastes nigricans(Fig. 3b; r2 = 0.79, p < 10−6). The relationship was not signif-icant for Synodus variegatus (Fig. 3a; p > 0.05). Conversely,the δ15N signature of muscle tissue decreased with body massfor Synodus variegatus and Abudebduf sexfasciatus (Figs. 3aand 3b, r2 = 0.38, p = 0.006 and r2 = 0.61, p < 10−6 respec-tively) and increased with body mass for Stegastes nigricans(Fig. 3b; r2 = 0.22, p < 10−6). The relationship was not signif-icant for Cheilidopterus quinquelineatus (Fig. 3d). In no casedid the variation in δ15N with body mass exceed 2.4%�, whichsuggests that no changes in trophic position occurred for anyspecies within the range of body mass values available in thepresent study.
8 L. Carassou et al.: Aquat. Living Resour. 21, 1–12 (2008)
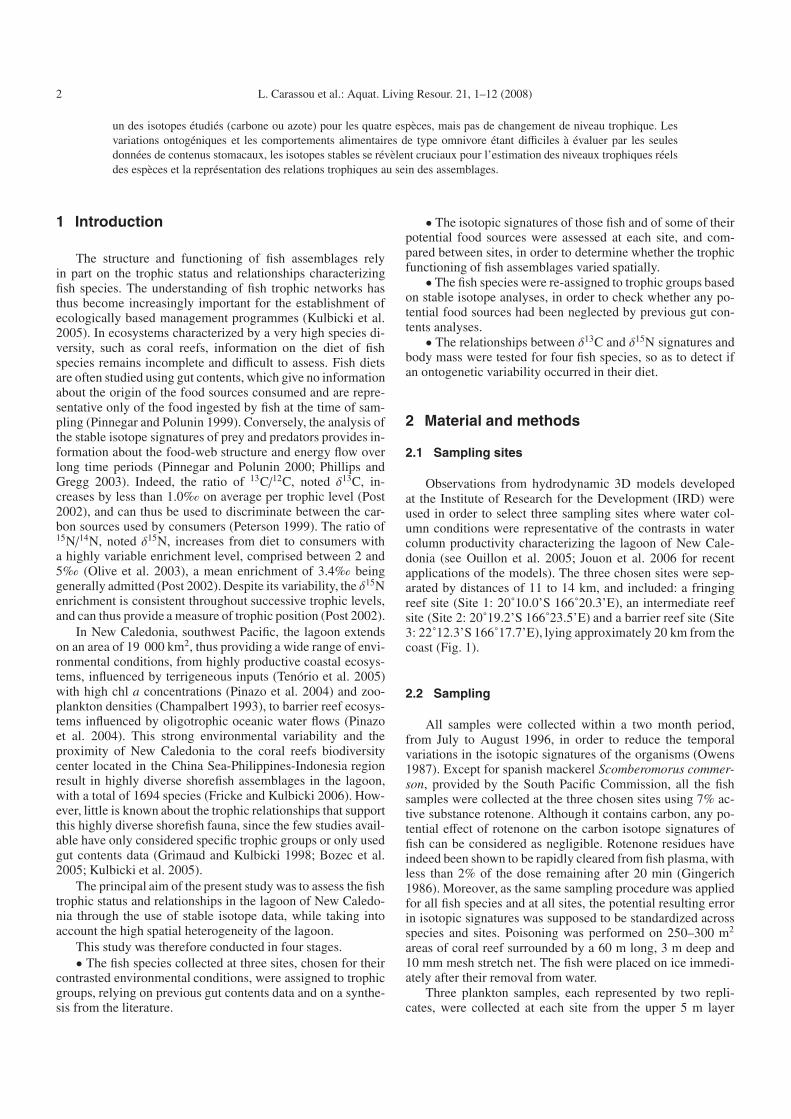
Table 3. F ratio and probability levels associated with one way ANOVAs testing for differences in δ13C and δ15N between food sources [1],between fish trophic groups [2], and between sites for each food source [3] and each fish trophic group [4]. NS: non significant, POM: ParticulateOrganic Matter, Turf: turf-forming microalgae, Piscivorous(*) once Scomberomorus commerson excluded.
Test type Degree δ13C δ15Nof F-ratio p−value F-ratio p-value
freedom
[1] Differences between food sources 6 72.661 <10−6 155.414 <10−6
[2] Differences between fish trophic groups 3 44.949 <10−6 102.053 <10−6
[3] Differences between sites for:POM 22.288 <10−6 28.060 <10−6
Red calcareous algae 2 0.395 0.690 NS 0.864 0.468 NSTurf 7.467 6 × 10⁻³ 2.337 0.131 NS
Zooplankton 26.046 <10−6 0.922 0.419 NS
[4] Differences between sites for:Herbivorous 7.324 1 × 10⁻³ 6.581 2 × 10⁻³
Planktivorous 2 1.614 0.206 NS 5.780 5 × 10⁻³
Carnivorous 7.177 1 × 10⁻³ 68.172 <10−6
Piscivorous 2.703 0.076 NS 0.613 0.545 NSPiscivorous(*) 13.764 <10−6 1.729 0.189 NS
4 Discussion
Significant spatial variations were observed in the presentstudy for most of the food sources and fish trophic groups ex-amined. These spatial variations can be accounted for by thestrong heterogeneity of water column productivity characteriz-ing the lagoon of New Caledonia (Pinazo et al. 2004), and con-firm that contrasts in water column conditions can affect thestable isotope signatures of both sources and consumers. Oncethese variations were considered, the general trophic struc-tures of fish assemblages appeared globally similar at the threesites. Stable isotope data were also generally useful in deter-mining the major trophic pathways sustaining these structures,although with a variable efficiency depending on the trophicgroup examined.
Stable carbon and nitrogen isotopic ratios were very ef-ficient in separating herbivorous fish species from the othergroups. The trophic position of these species, calculated ac-cording to the δ15N fractionation between algal sources andfish, confirmed the herbivory of most of the species revealedby gut contents analysis. However, it seems that some of thepotential algal sources collected in this study only contributepoorly to the diet of the herbivorous fish sampled. Beinglargely 13C enriched relative to all herbivores, red calcareousalgae, for example, do not appear to constitute a significantfood source in any herbivore diet. Carbonate is a commonconstituent of herbivorous fish stomach contents as these fishgraze the algal film on rocks and corals (Bruggemann et al.1994) and also feed on the epiphytic algae growing on car-bonate substrata (Van Rooij et al. 1995). Therefore, it seemsthat calcareous-algal carbon is negligibly used by the grazerssampled in the present study. Similarly, the calcareous greenalga Halimeda sp. sampled on the barrier reef tends to be re-jected by rabbitfish in favour of more nutritional algal specieslike Enteromorpha (Montgomery and Gerking 1980). Conse-quently, Halimeda is unlikely to have been a substantial food
source for the grazers examined in this study. Former stom-ach contents analyses have indicated that, despite a relativelyhigh energy, protein and carbohydrate content (Montgomeryand Gerking 1980), macroalgae in general are unlikely to con-stitute the major component of herbivore diets on coral reefs(Russ and St John 1988). The low δ15N values found for theparrotfishes Scarus schlegeli, S .niger and Chlorurus sordidusat the barrier reef suggest that their main food source is morelikely to have been turf algae, characterized by the lowestδ15N values among primary producers. However, the substan-tial 13C-enrichment of these algae relative to all three scaridscould indicate that detrital material represents a more impor-tant part of scarids’ diet than previously thought (Chen 2002;Choat et al. 2002, 2004), and might explain the low 15N andhigh 13C values characterizing these species. A similar diet-mixing hypothesis might be postulated for most of the herbiv-orous fish sampled in this study. Some surgeonfish like Acan-thurus nigrofuscus (H1), Ctenochaetus striatus (H4) or Zebra-soma scopas (H11) indeed exhibit a somewhat detritivorousfeeding habit related to dentition and feeding behaviour (Pur-cell and Bellwood 1993). The substantial enrichment of ni-trogen relative to reef sediments in the stomach contents ofCtenochaetus striatus indicates that such feeding is nutrition-ally advantageous (Nelson and Wilkins 1988). Such detritusmay derive from sources other than the algae sampled in thisstudy, and these may include the faecal detritus of other fisheswhich are widely used as a food source in the reef community(Rothans and Miller 1991). Furthermore, this faecal materialhas been shown to contain significant levels of phosphorus,copper, iron, manganese and zinc (Geesey et al. 1984). Ze-brasoma scopas is known to consume benthic algae on reefs,but also to consume large quantities of faecal material origi-nating from zooplanktivorous Chromis atripectoralis (Baileyand Robertson 1982). Cophrophagy could thus account for theδ13C and δ15N data of the herbivores that were sampled in thepresent study.
L. Carassou et al.: Aquat. Living Resour. 21, 1–12 (2008) 9
Table 4. Trophic positions of fish species based on the difference between their δ15N signatures and those of their ultimate food sources (bothPOM and algae) at each site, with POM: Particulate Organic Matter; TmA: turf-forming microalgae; BMA: brown unidentified macroalga,Lob.: brown macroalga Lobophora sp., Hal: green macroalga Halimeda sp. A mean enrichment of 3.2%� for 15N per trophic level has beenused, following Sweetings et al. (2007)’s recommendations for fish muscle tissues. A trophic position of 1 is assumed for the food sources. Fishspecies are ranked in alphabetical order, as in Table 1.
Site 1 Site 2 Site 3Fish species 1rst trophic level
POM TmA BMA POM TmA Lob. POM TmA Hal.
Abudebduf sexfasciatus (Z1) 2.4 2.8 2.4 2.2 2.5 2.5Acanthurus nigrofuscus (H1) 2.2 2.3 2.3 - - - - - -Bodianus perditio (C1) - - - - - - 2.0 2.4 2.3Caesio caerulaurea (Z3) 2.6 2.6 2.7 - - - 2.3 2.7 2.6Centropyge tibiscens (H2) - - - 2.4 2.8 2.3 - - -Chaetodon citrinellus (C10) - - - - - - 2.2 2.6 2.6Chaetodon flavirostris (C11) - - - 2.4 2.8 2.4 - - -Cheilidopterus quinquelineatus (P1) 2.7 2.8 2.8 2.4 2.7 2.3 2.0 2.4 2.4Chlorurus sordidus (H8) - - - - - - 1.2 1.5 1.5Chromis viridis (Z4) - - - 2.7 3.1 2.6 - - -Chrysiptera notialis (Z5) 2.4 2.4 2.5 - - - - - -Cirripectes stigmaticus (H3) - - - 1.5 1.9 1.5 - - -Ctenochaetus striatus (H4) 2.0 2.0 2.0 1.6 2.0 1.5 - - -Dascyllus aruanus (Z6) - - - 2.6 3.0 2.6 2.2 2.6 2.6Epinephelus merra (P2) 2.8 2.9 2.9 2.6 3.0 2.5 2.6 3.0 3.0Hemigymnus melapterus (C2) 2.6 2.6 2.7 - - - - - -Lethrinus atkinsoni (C3) 2.7 2.7 2.8 - - - - - -Mulloidichthys flavolineatus (C4) - - - - - - 1.8 2.1 2.1Parupeneus ciliatus (C5) - - - 2.4 2.8 2.4 - - -Plectorhynchus lineatus (C6) - - - 2.6 2.9 2.5 - - -Pomacentrus adelus (H5) 1.9 1.9 2.0 - - - - - -Pomacentrus moluccensis (Z7) - - - 2.3 2.7 2.3 - - -Ostorhinchus doederleini (Z2) 2.7 2.7 2.8 2.1 2.5 2.1 - - -Sargocentron rubrum (C7) 2.8 2.8 2.8 - - - - - -Saurida gracilis (P3) - - - - - - 2.1 2.5 2.4Scarus niger (H6) - - - - - - 1.3 1.6 2.0Scarus schlegeli (H7) - - - - - - 1.3 1.6 1.6Scolopsis bilineatus (C8) 2.9 2.9 3.0 2.7 3.1 2.7 - - -Scomberomorus commerson (P4) - - - - - - 3.3 3.7 3.7Scorpaenodes guamenis (C9) - - - - - - 2.0 2.4 2.3Siganus doliatus (H9) 2.0 2.0 2.1 - - - - - -Stegastes nigricans (H10) - - - 2.2 2.6 2.2 2.1 2.4 2.4Synodus variegatus (P5) 2.9 2.9 3.0 2.7 3.1 2.7 2.5 2.8 2.8Zebrasoma scopas (H11) - - - - - - 1.5 1.9 1.9
The fish species usually classified as carnivorous and pis-civorous sampled in this study actually appear to feed over abroader range of trophic levels and food sources than expectedfrom the gut contents observations. Their isotopic ranges ofvalues indeed largely overlapped at the three sites, and their es-timated trophic positions revealed to be lower than expected.This result might be explained by the underestimation of theimportance of mixed omnivorous diets by gut contents analy-sis. Omnivorous feeding behaviours have indeed been shownto be widespread among many temperate reef fishes (La Mesaet al. 2007) and coral reef fishes (Kavanagh and Olney 2006;Silvano and Guth 2006). Ontogenetic variations, which oc-curred in the present study for the four fish species examined,
could also play a role. Ontogenetic variations in feeding be-haviours have indeed been reported for many demersal reeffish species (Kawakami and Tachihara 2005; Tibbetts andCarseldine 2005) and pelagic tropical species (Graham et al.2007). Both processes might also be associated to explain thewide range of isotopic values and trophic positions observedfor the carnivorous fish species in the present study. Kulbickiet al. (2005) indeed demonstrated that the number of prey typesconsumed by over 100 carnivorous coral-reef fish species fromthe lagoon of New Caledonia increased with fish size, and thusthat omnivorous behaviours may become increasingly impor-tant as fish grow. Since such omnivorous diets are difficult todetermine by using gut content data alone, stable isotopes were
10 L. Carassou et al.: Aquat. Living Resour. 21, 1–12 (2008)
Fig. 3. Relationship between δ13C and body mass (left column) and between δ15N and body mass (right column) in the four species forwhich at least seven individuals were collected, with a body mass difference of at least 8.5 g between the smallest and the biggest fish. Synodusvariegatus, piscivorous (a), Stegastes nigricans, herbivorous (b), Abudebduf sexfasciatus, planktivorous (c) and Cheilidopterus quinquelineatus,piscivorous (d). The lines correspond to the linear regression models.
L. Carassou et al.: Aquat. Living Resour. 21, 1–12 (2008) 11
essential in estimating the trophic status and feeding relation-ships of the fish species under study.
5 Conclusion
In the present study, stable isotope data facilitated the as-sessment of the major trophic relationships structuring fish as-semblages in the lagoon of New Caledonia. Stable isotopesof carbon and nitrogen were very efficient for discriminatingherbivorous fish species and for identifying their major foodsources. Conversely, carnivorous and piscivorous fish trophicgroups were poorly discriminated from one another, and theirestimated trophic positions were lower than expected whenconsidering gut contents data alone. This was probably dueto a partly omnivorous diet, or to an ontogenetic variation inthe food sources consumed by some species. This study thusemphasizes the importance of mixed dietary, including co-prophagy and omnivorous diet, in the feeding habits of manycoral reef fish species usually classified as carnivorous by gutcontents studies. This type of feeding behaviour should thusbe paid greater attention when assigning fish species to trophicgroups and when attempting to model the trophic structure offish assemblages in such diversified ecosystems.
Acknowledgements. Generous field help was offered by E. Gillep-sie and O. Rossier. C. Hetherington and C. Scrimgeour are thankedfor assistance with mass spectrometry and S. Barker for his help-ful advice on methodology. The University of Newcastle ExplorationCouncil and British Sub-Aqua Jubilee Trust provided funding forthis study. We thank A.M. Lassallette, University of the French WestIndies, for help in editing the English text.
References
Allen G.R., 1991, Damselfishes of the world. H.A., Baensch editor,Melle.
Allen G.R., Steene R., Allen M., 1998, A guide to angelfishes andbutterflyfishes. Odyssey Publishing, Perth.
Bailey T.G., Robertson D.R., 1982, Organic and caloric levels of fishfaeces relative to its consumption by coprophagous reef fishes.Mar. Biol. 69, 45-50.
Blaber S.J.M., Milton D.A., Rawlinson N.J.F., 1990, Diets of la-goon fishes in the Solomon Islands: predators of tuna baitfishand trophic effects of baitfishing on the subsistence fishery. Fish.Resour. 8, 263-286.
Booth J.D., 2004, Synergistic effects of conspecifics and food ongrowth and energy allocation of a damselfish. Ecology 85, 2881-2887.
Bozec Y.M., Gascuel D., Kulbicki M., 2004, Trophic model of la-goonal communities in a large open atoll (Uvea, Loyalty islands,New Caledonia). Aquat. Living Resour. 17, 151-162.
Bozec Y.M., Kulbicki M., Chassot E., Gascuel D., 2005, Trophic sig-nature of coral reef fish assemblages: towards a potential indica-tor of ecosystem disturbance. Aquat. Living Resour. 18, 103-109.
Bruggemann J.H., van Oppen M.J.H., Breeman A.M., 1994, Foragingby the stoplight parrotfish Sparisoma viride. I. Food selection indifferent socially determined habitats. Mar. Ecol. Prog. Ser. 106,41-55.
Champalbert G., 1993, Plankton inhabiting the surface layer of thesouthern and southwestern lagoon of New Caledonia. Mar. Biol.115, 223-228.
Chen L.S., 2002, Post-settlement diet shift of Chlorurus sordidus andScarus schlegeli (Pisces: Scaridae). Zool. Stud. 41, 47-58.
Choat J.H., Clements K.D., Robbins W.D., 2002, The trophic statusof herbivorous fishes on coral reefs. I. Dietary analysis. Mar. Biol.140, 613-623.
Choat J.H., Robbins W.D., Clements K.D., 2004, The trophic statusof herbivorous fishes on coral reefs. II. Food processing modesand trophodynamics. Mar. Biol. 145, 445-454.
Coleman N., 1981, Australian Sea Fishes North of 30˚S. Doubleday,Lane Cove, NSW Australia.
Feuchtmayr H., Grey J., 2003, Effects of preparation and preservationprocedures on carbon and nitrogen stable isotope determinationsfrom zooplankton. Rapid Commun. Mass Spectrom. 17, 2605-2610.
Fricke R., Kulbicki M., 2006, Checklist of the shore fishes of NewCaledonia. In: Payri C., Richer de Forges B. (Eds.) Compendiumof Marine Species from New Caledonia, Nouméa, Doc. Sci. Tech.IRD II 7, pp. 313-358.
Geesey G.G., Alexander G.V., Bray R.N., Miller A.C., 1984, Fish fae-cal pellets are a source of minerals for inshore reef communities.Mar. Ecol. Prog. Ser. 15, 19-25.
Gingerich W.H., 1986, Tissue distribution and elimination ofrotenone in rainbow trout. Aquat. Toxicol. 8, 27-40.
Graham B.S., Grubbs D., Holland K., Popp B.N., 2007, A rapid on-togenetic shift in the diet of juvenile yellowfin tuna from Hawaii.Mar. Biol. 150, 647-658.
Grimaud J., Kulbicki M., 1998, Influence de la distance à l’océansur les peuplements ichthyologiques des récifs frangeants deNouvelle-Calédonie. C.R. Acad. Sci. Paris, Life Sci. 321, 923-931.
Hata H., Kato, M. 2004, Monoculture and mixed-species algal farmson a coral reef are maintained through intensive and extensivemanagement by damselfishes. J. Exp. Biol. Ecol. 313, 285-296.
Jouon A., Douillet P., Ouillon S., Fraunié P., 2006, Calculations of hy-drodynamic time parameters in a semi-opened coastal zone usinga 3D hydrodynamic model. Cont. Shelf Res. 26, 1395-1415.
Kaehler S., Pakhomov E.A., 2001, Effects of storage and preservationof the δ13C and δ15N signatures of selected marine organisms.Mar. Ecol. Prog. Ser. 219, 299-304.
Kavanagh K.D., Olney J.E., 2006, Ecological correlates of popula-tion density and behaviour in the circumtropical black triggerfishMelichthys niger (Balistidae). Environ. Biol. Fish. 76, 387-398.
Kawakami T., Tachihara K., 2005, Diet shift of larval and juvenilelandlocked Ryukyu-ayu Plecoglossus altivelis ryukyuensis in theFukuji Reservoir, Okinawa Island, Japan. Fish. Sci. 71, 1003-1009.
Kulbicki M., 2006, Ecologie des poissons lagonaires de NouvelleCalédonie (Ecology of lagoon fishes in New Caledonia), PhD dis-sertation, Université de Perpignan, France.
Kulbicki M., Bozec Y.M., Labrosse P., Letourneur Y., Mou-Tham G.,Wantiez L., 2005, Diet composition of carnivorous fishes fromcoral reef lagoons of New Caledonia. Aquat. Living Resour. 18,231-250.
Lajtha K., Michener R.H., 1994, Stable isotopes in ecology and envi-ronmental sciences. Methods in Ecology, Lawton J.M., LickensG.E. (Eds.) Blackwell Publishing, London.
La Mesa G., La Mesa M., Tanasetti P., 2007, Feeding habitsof the Madeira rockfish Scorpaena maderensis from centralMediterranean Sea. Mar. Biol. 150, 1313-1320.

12 L. Carassou et al.: Aquat. Living Resour. 21, 1–12 (2008)
Montgomery W.L., Gerking S.D., 1980, Marine macroalgae as foodsfor fishes: an evaluation of potential food quality. Environ. Biol.Fish. 5, 143-153.
Myers, R.F., 1991, Micronesian reef fishes. 2nd edition CoralGraphics, Barrigada, Guam. Nakamura Y., Horinouchi M., NakaiT., Sano M., 2003, Food habits of fishes in a seagrass bed on afringing coral reef at Iriomote Island, southern Japan. Ichthyol.Res. 50, 15-22.
Nelson S.G., Wilkins S.D., 1988, Sediment processing by the sur-geonfish Ctenochaetus striatus at Moorea, French Polynesia. J.Fish Biol. 32, 817-824.
Ochavillo D.G., Dixon P.I., Aliño P.M., 1992, The daily food ra-tion of parrotfishes in the fringing reefs of Bolinao, Pangasinan,Northwestern Philippines. Proc. 7th Int. Coral Reef Symp. 2, 927-933.
Olive P.J.W., Pinnegar J.K., Polunin N.V.C., Richards G., Welch R.,2003, Isotope trophic-step fractionation: a dynamic equilibriummodel. J. Anim. Ecol. 72, 608-617.
Ouillon S., Douillet P., Fichez R., Panché J.Y., 2005, Enhancementof regional variations in salinity and temperature in a coral reeflagoon, New Caledonia. C. R. Geosciences 337, 1509-1517.
Owens N.J.P., 1987, Natural variations in 15N in the marine environ-ment. Adv. Mar. Biol. 24, 389-451.
Peterson J., 1999, Stable isotopes as tracers of organic matter inputand transfer in benthic food webs: a review. Acta Oecol. 20, 479-487.
Phillips D.L., Gregg J.W., 2003, Source partitioning using stable iso-topes: coping with too many sources. Oecologia 136, 261-269.
Pinazo C., Bujan S., Douillet P., Fichez R., Grenz C., Maurin A.,2004, Impact of wind and freshwater inputs on phytoplanktonbiomass in the coral reef lagoon of New Caledonia during thesummer cyclonic period: a coupled three-dimensional biogeo-chemical modelling approach. Coral Reefs 23, 281-296.
Pinnegar J.K., Polunin N.V.C., 1999, Differencial fractionation ofδ13C and δ15N among fish tissues: implications for the study oftrophic interactions. Funct. Ecol. 13, 225-231.
Pinnegar J.K., Polunin N.V.C., 2000, Contributions of stable-isotopedata to elucidation of food webs of Mediterranean rocky littoralfishes. Oecologia 122, 399-409.
Polunin N.V.C., Harmelin-Vivien M., Galzin R., 1995, Contrasts inalgal food processing among five herbivorous coral-reef fishes. J.Fish Biol. 47, 455-465.
Post D.M., 2002, Using stable isotopes to estimate trophic position:models, methods, and assumptions. Ecology 83, 703-718.
Pratchett M.S., Gust N., Goby G., Klanten S.O., 2001, Consumptionof coral propagules represents a significant trophic link betweencorals and reef fish. Coral Reefs 20, 13-17.
Purcell S.W., Bellwood D.R., 1993, A functional analysis of food pro-curement in two surgeonfish species, Acanthurus nigrofuscus andCtenochaetus striatus (Acanthuridae). Environ. Biol. Fishes 37,139-159.
Rothans T.C., Miller A.C., 1991, A link between biologically im-ported particulate organic nutrients and the detritus food web inreef communities. Mar. Biol. 110, 145-150.
Russ G.R., St John J., 1988, Diets, growth rates and secondary pro-duction of herbivorous coral reef fishes. Proc. 6th Int. Coral ReefSymp. 2, 37-42.
Russell B.C., 1990, Nemipterid fishes of the world (Threadfin breams,whiptail breams, monocle breams, dwarf monocle breams, andcoral breams). Family Nemipteridae. An annotated and illus-trated catalogue of nemipterid species known to date. FAO FishSynopsis 12, N˚125, pp.1-149.
Sano M., Shimizu M., Nose Y., 1984, Food habits of the teleosteanreef fishes in Okinawa Island, southern Japan. Univ. Tokyo Bull.25.
Scherrer B., 1984, Biostatistique. G. Morin ed., Boucherville,Québec. Shibuno T., Shigeta T., Abe O., Fujita H., HashimatoH., Gushima K., 1996, Feeding habits of pinguiped and synodon-tid fishes at Kuchierabu-Jima. J. Fac. Appl. Biol. Sci. HiroshimaUniv. 35, 105-111.
Shirai S., 1986, Ecological encyclopedie of the marine animals of theIndo-Pacific. Vol. 1 Vertebrata (Mammals, Reptiles, Fishes). ShinNippon Kyoiku Tosho, Tokyo.
Silvano R.A.M., Guth A.Z., 2002, Diet and feeding behaviour ofKyphosus spp. (Kyphosidae) in a Brazilian subtropical reef. Braz.Arch. Biol. Technol. 49, 623-629.
Sweeting C.J., Barry J., Barnes C., Polunin N.V.C., Jennings S., 2007,Effects of body size and environment on diet-tissue δ15N fraction-ation in fishes. J. Exp. Mar. Biol. Ecol. 340, 1-10.
Tenorio M.M.B., Le Borgne R., Rodier M., Neveux J., 2005, Theimpact of terrigeneous inputs on the Bay of Ouinné (NewCaledonia) phytoplankton communities: a spectrofluorometricand microscopic approach. Estuar. Coast. Shelf Sci. 64, 531-545.
Ter Kuile C., 1989, The forage base of some reef fishes in the Floressea with notes on sampling and fishery. Neth. J. Sea Res. 23, 171-179.
Tibbetts I.R., Carseldine L., 2005, Trophic shifts in three subtropicalAustralian halfbeaks (Teleostei: Hemiramphidae). Mar. Freshw.Res. 56, 925-932.
Vander Zanden M.J., Rasmussen J.B., 2001, Variation in δ15N andδ13C trophic fractionation: implications for aquatic food websstudies. Limnol. Oceanogr. 46, 2061-2066.
Van Rooij J.M., Bruggemann J.H., Videler J.J., Breeman A.M., 1995,Plastic growth of the herbivorous reef fish Sparisoma viride: fieldevidence for a trade-off between growth and reproduction. Mar.Ecol. Prog. Ser. 122, 93-105.
Westneat M.W., 2001, Labridae. Wrasses, hogfishes, razorfishes,corises, tuskfishes. In: Carpenter, K.E., Niem, V. (Eds.), 2001.FAO species identification guide for fishery purposes. The liv-ing marine resources of the Central West Pacific. Vol. 6. Bonyfishes part 4 (Labridae to Latimeriidae), estuarine crocodiles.FAO, Rome, pp. 3381-3467.
Woodland D., 1997, Siganidae. Spinefoots. Rabbitfishes. In:Carpenter K.E., Niem V. (Eds.), FAO Identification Guide forFishery Purposes. The Western Central Pacific, pp. 3627-3650.
Recommended