
ASHRAE HeadquartersGSHP vs. VRF
Jeffrey D. Spitler, Laura Southard, Oklahoma State University
Xiaobing Liu, Oak Ridge National Laboratory

Project Team
Jeff Spitler Xiaobing Liu Laura Southard
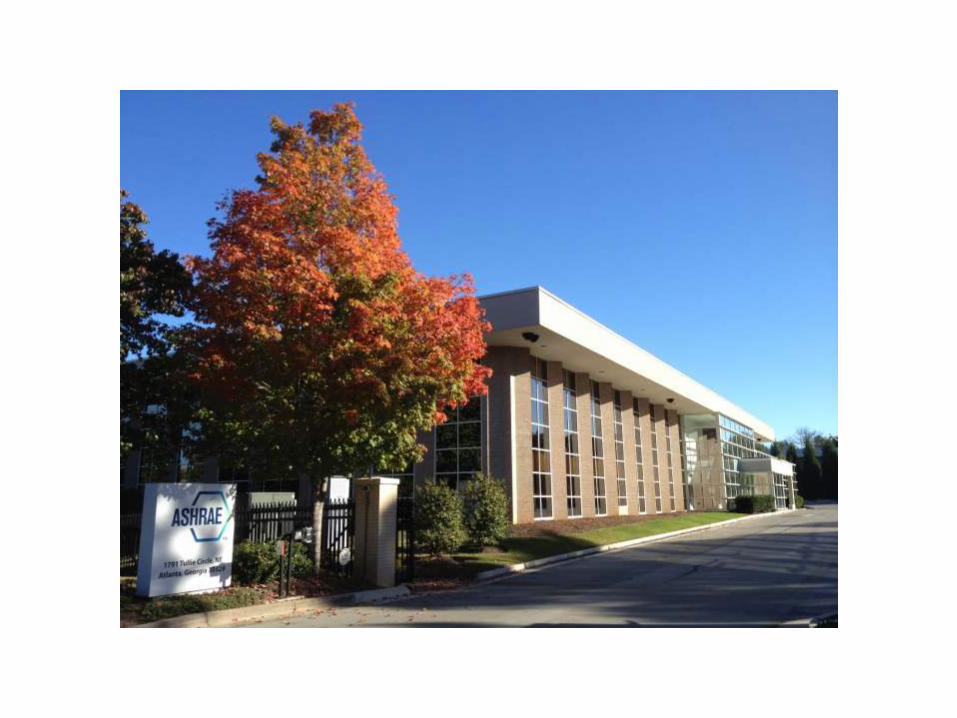
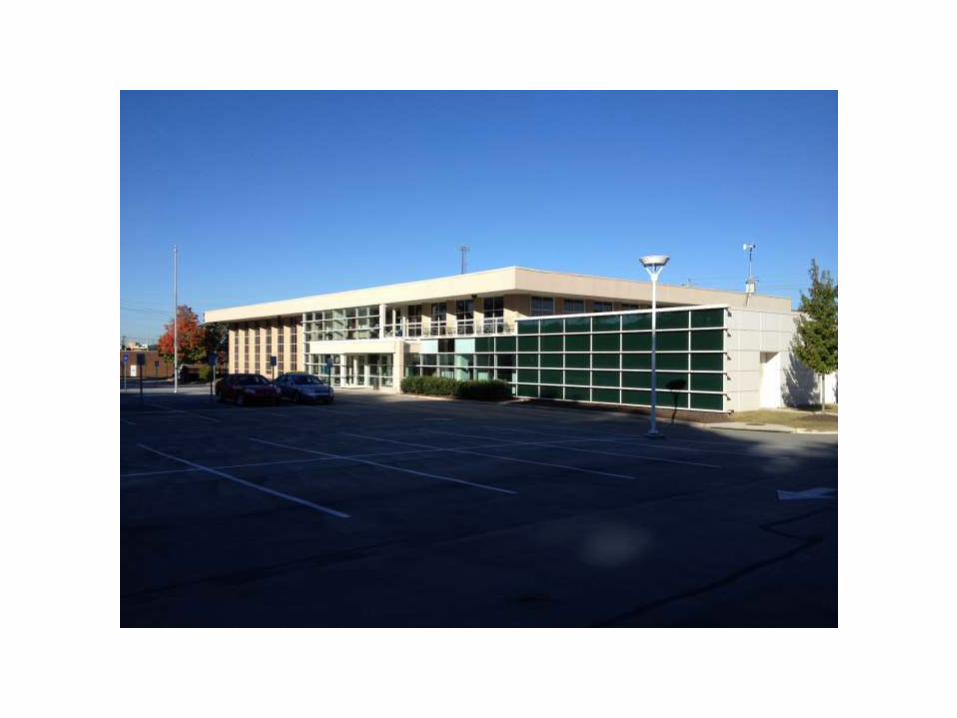
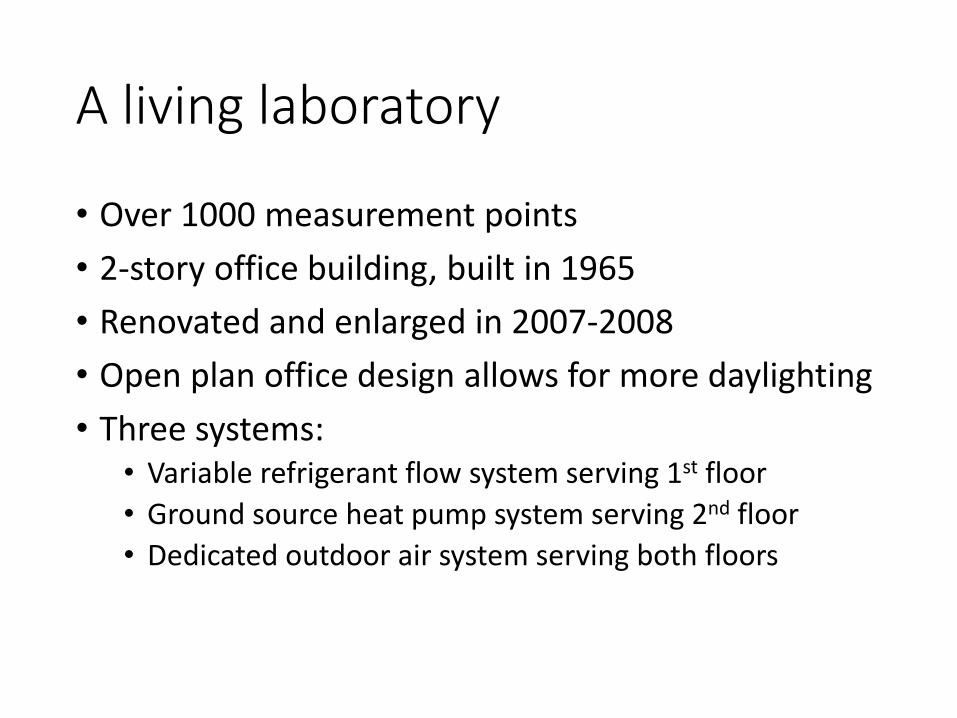
A living laboratory
• Over 1000 measurement points
• 2-story office building, built in 1965
• Renovated and enlarged in 2007-2008
• Open plan office design allows for more daylighting
• Three systems:• Variable refrigerant flow system serving 1st floor
• Ground source heat pump system serving 2nd floor
• Dedicated outdoor air system serving both floors
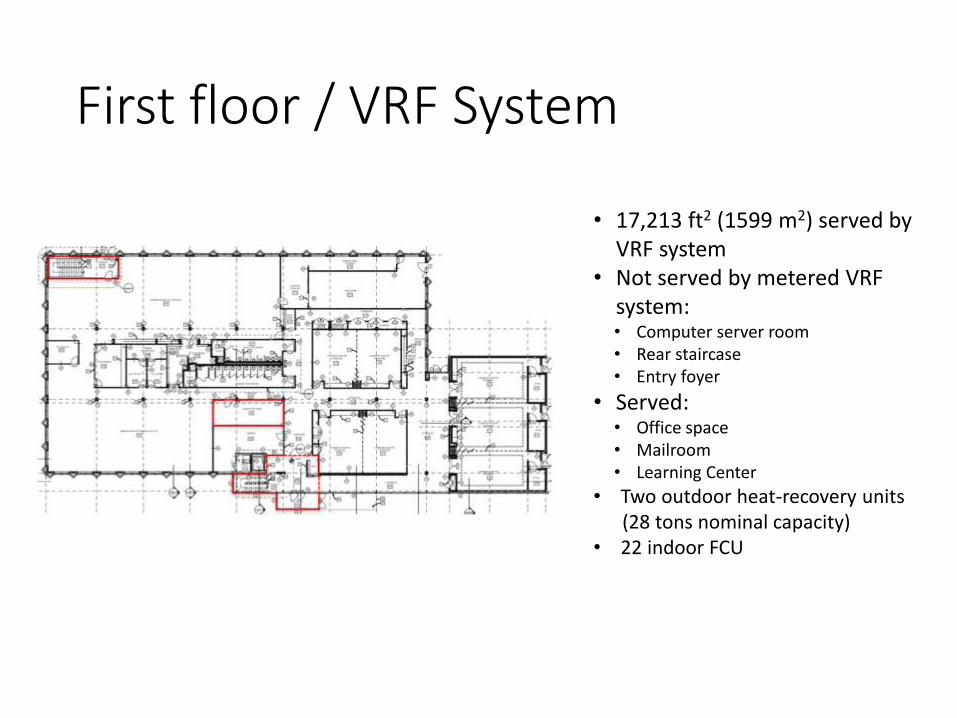
First floor / VRF System
• 17,213 ft2 (1599 m2) served by VRF system
• Not served by metered VRF system:• Computer server room• Rear staircase• Entry foyer
• Served:• Office space• Mailroom• Learning Center
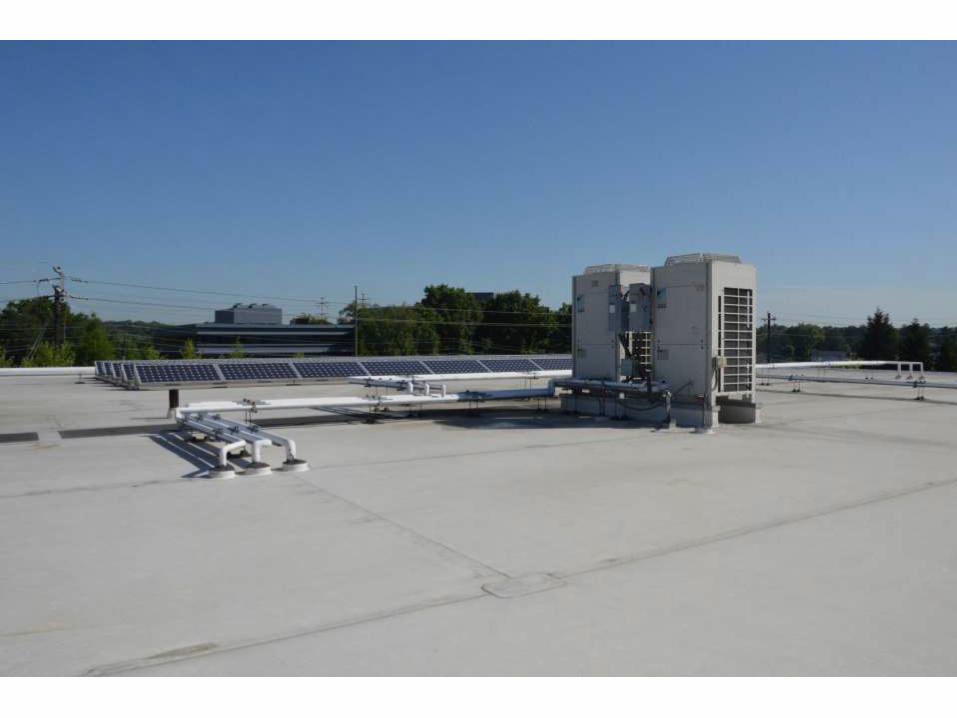
• Two outdoor heat-recovery units(28 tons nominal capacity)
• 22 indoor FCU
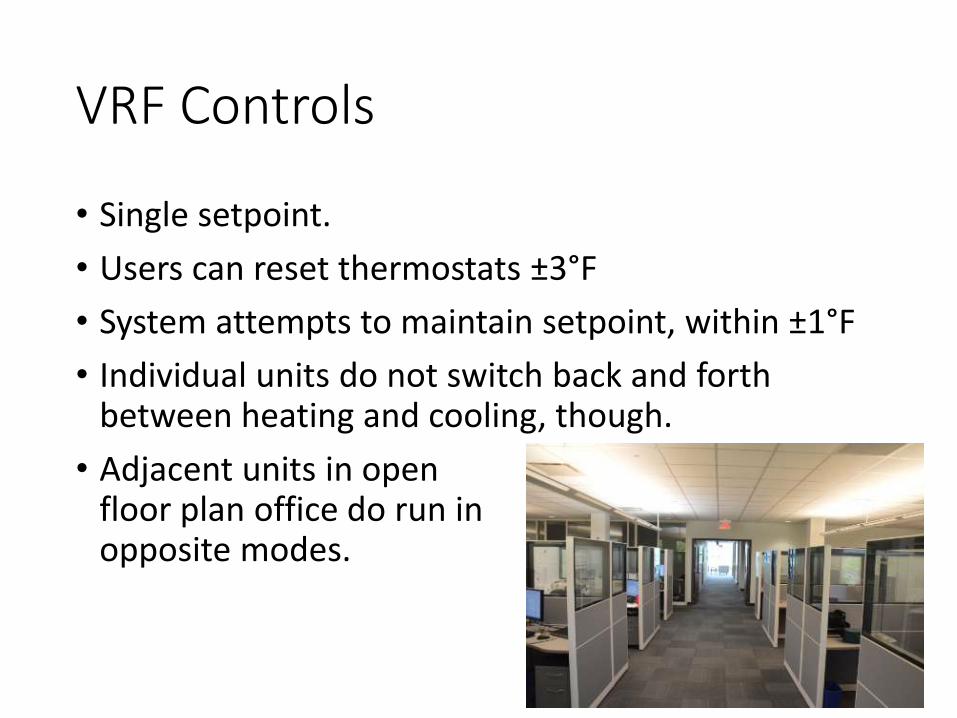
VRF Controls
• Single setpoint.
• Users can reset thermostats ±3°F
• System attempts to maintain setpoint, within ±1°F
• Individual units do not switch back and forth between heating and cooling, though.
• Adjacent units in open floor plan office do run inopposite modes.
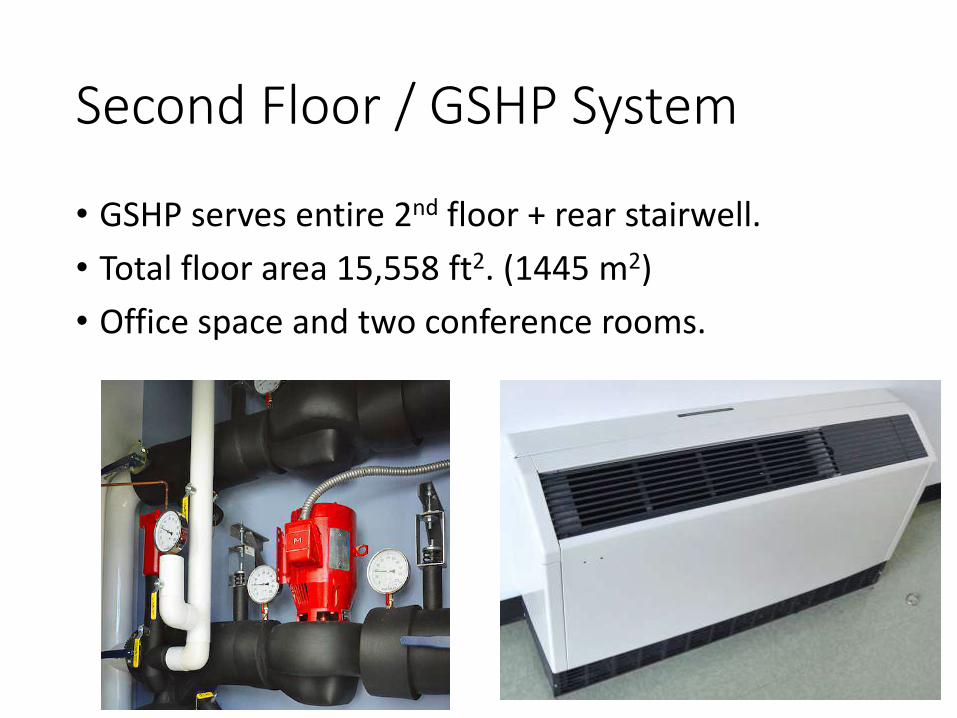
Second Floor / GSHP System
• GSHP serves entire 2nd floor + rear stairwell.
• Total floor area 15,558 ft2. (1445 m2)
• Office space and two conference rooms.
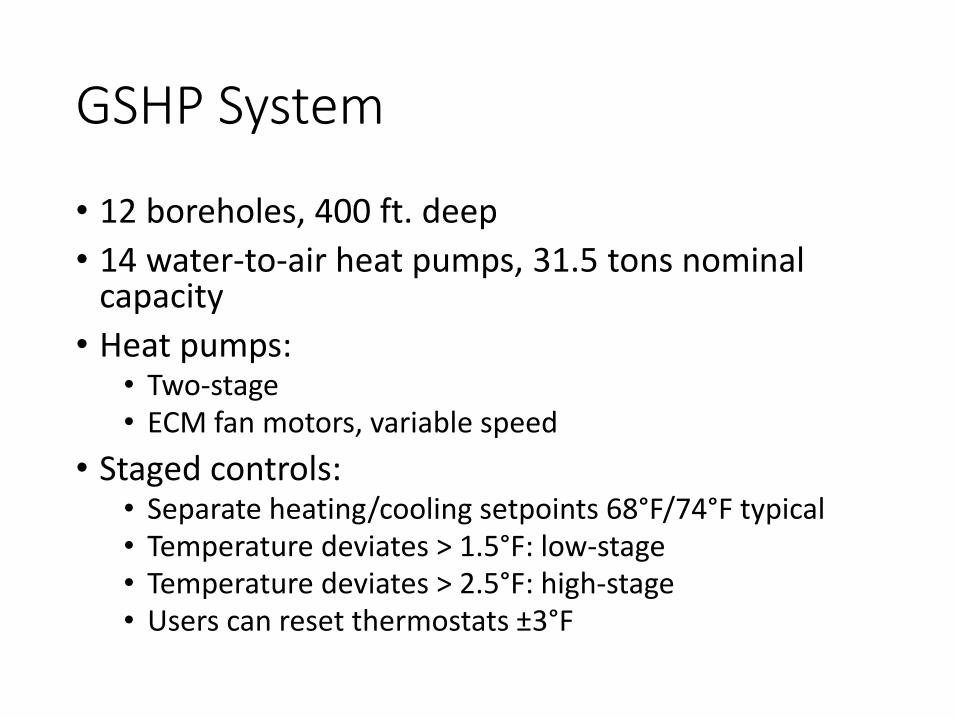
GSHP System
• 12 boreholes, 400 ft. deep
• 14 water-to-air heat pumps, 31.5 tons nominal capacity
• Heat pumps:• Two-stage• ECM fan motors, variable speed
• Staged controls:• Separate heating/cooling setpoints 68°F/74°F typical• Temperature deviates > 1.5°F: low-stage• Temperature deviates > 2.5°F: high-stage• Users can reset thermostats ±3°F
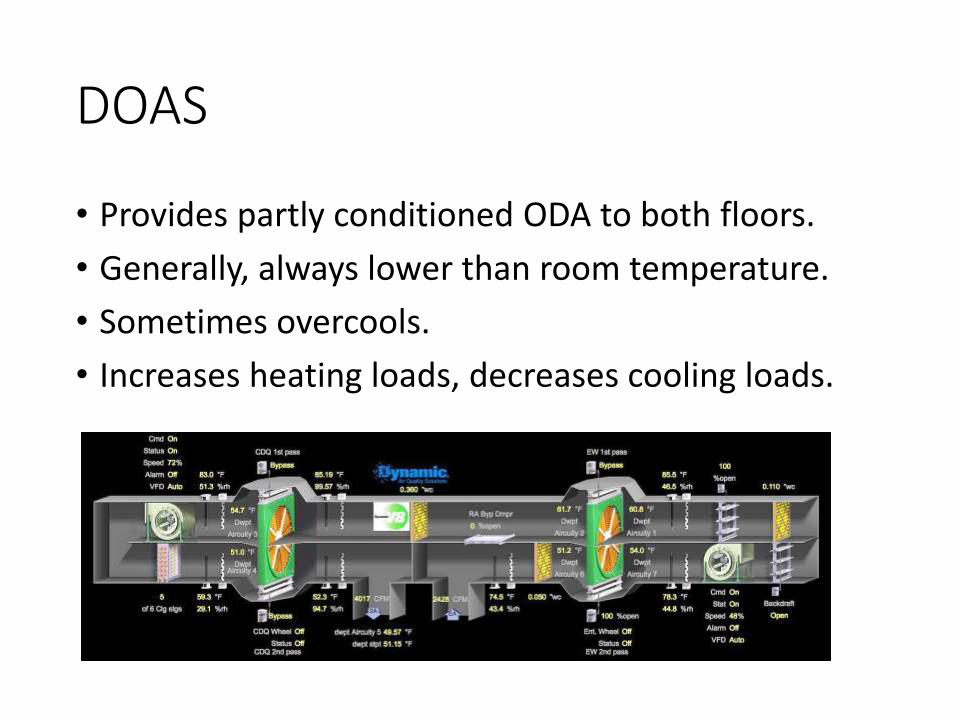
DOAS
• Provides partly conditioned ODA to both floors.
• Generally, always lower than room temperature.
• Sometimes overcools.
• Increases heating loads, decreases cooling loads.
Qualitative comparison of loads
• 1st floor and 2nd floor: same lighting and plug load densities.
• Occupancy:• 1st floor (normal): 400 ft2/person
• 2nd floor (normal): 259 ft2/person
• 1st floor, learning center: used ~26 hours/month
• DOAS average flow rate:• 1st floor: 2560 CFM
• 2nd floor: 1480 CFM
Qualitative comparison of loads
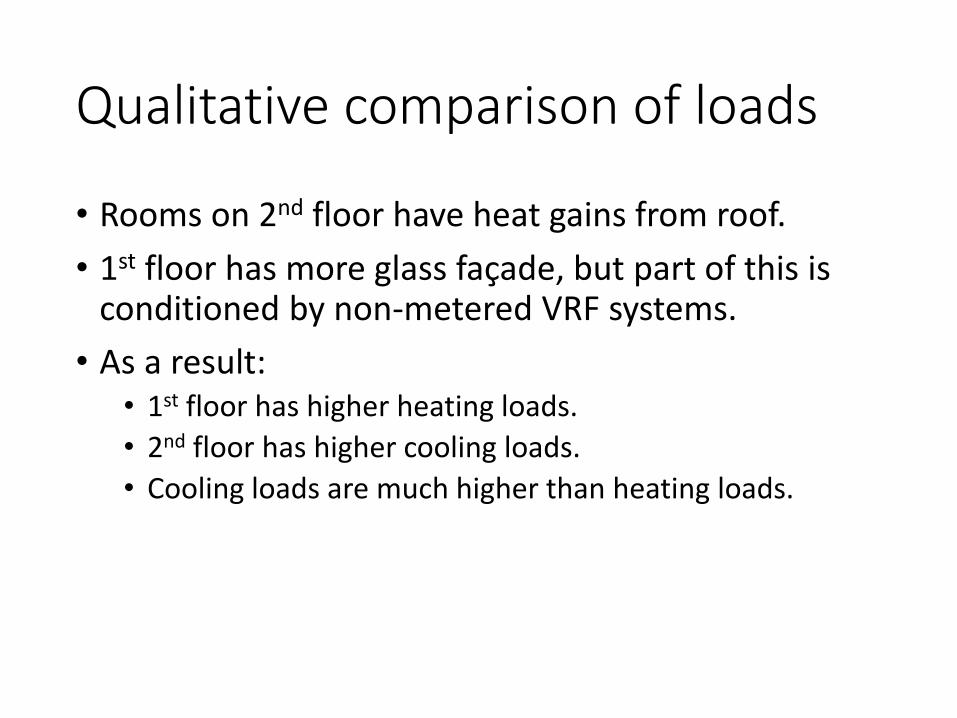
• Rooms on 2nd floor have heat gains from roof.
• 1st floor has more glass façade, but part of this is conditioned by non-metered VRF systems.
• As a result:• 1st floor has higher heating loads.
• 2nd floor has higher cooling loads.
• Cooling loads are much higher than heating loads.

Results
• Energy consumption
• Heating and Cooling Loads
• System COP and EER
• Why?
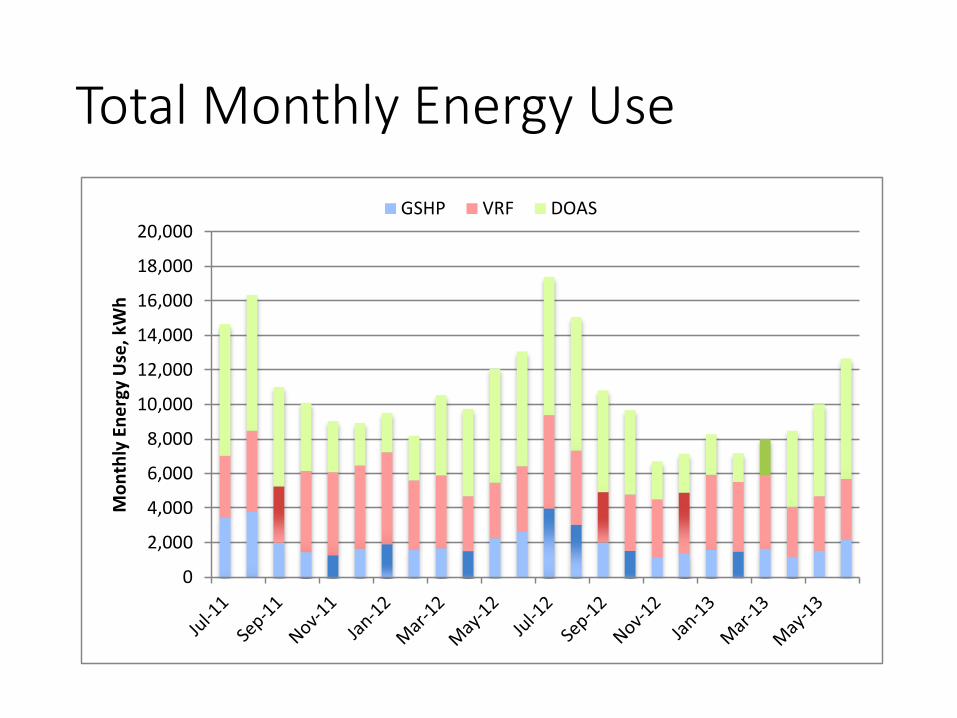
Total Monthly Energy Use
0
2,000
4,000
6,000
8,000
10,000
12,000
14,000
16,000
18,000
20,000
Mo
nth
ly E
ne
rgy
Use
, kW
h
GSHP VRF DOAS
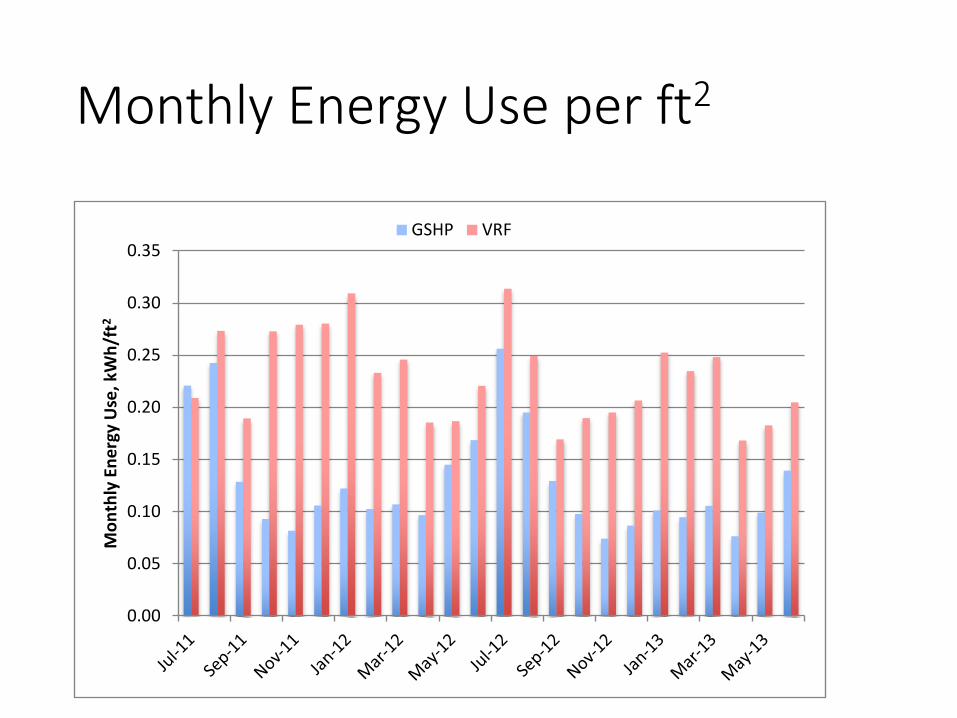
Monthly Energy Use per ft2
0.00
0.05
0.10
0.15
0.20
0.25
0.30
0.35
Mo
nth
ly E
ne
rgy
Use
, kW
h/f
t2
GSHP VRF
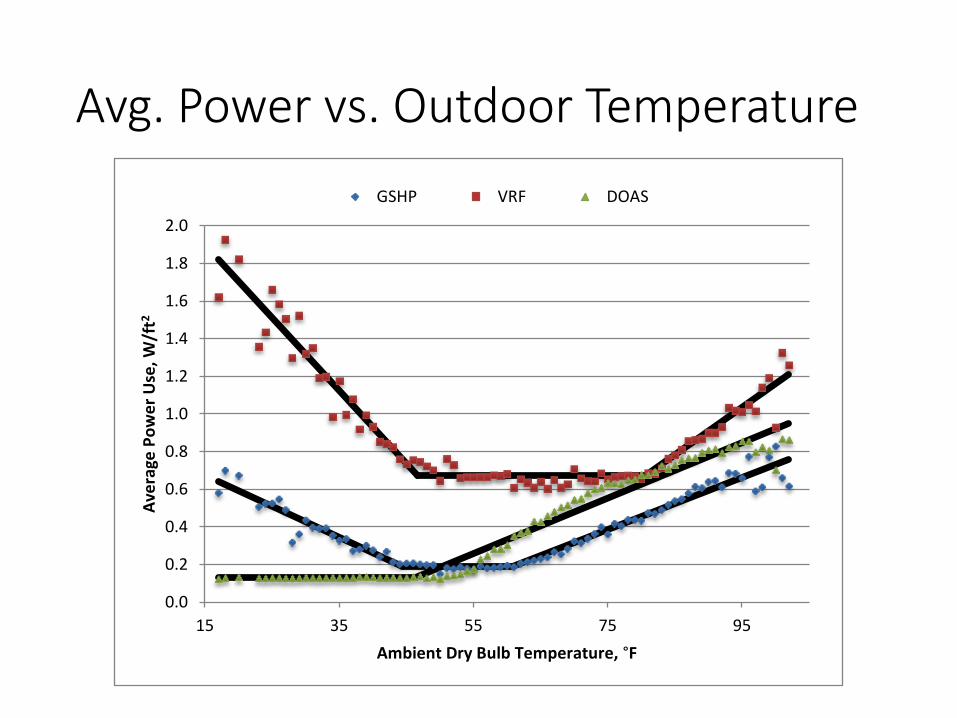
Avg. Power vs. Outdoor Temperature
0.0
0.2
0.4
0.6
0.8
1.0
1.2
1.4
1.6
1.8
2.0
15 35 55 75 95
Ave
rage
Po
we
r U
se, W
/ft2
Ambient Dry Bulb Temperature, °F
GSHP VRF DOAS
0
100
200
300
400
500
600
700
800
900
10001
4
18
22
26
30
34
38
42
46
50
54
58
62
66
70
74
78
82
86
90
94
98
10
2
Nu
mb
er o
f h
ou
rs
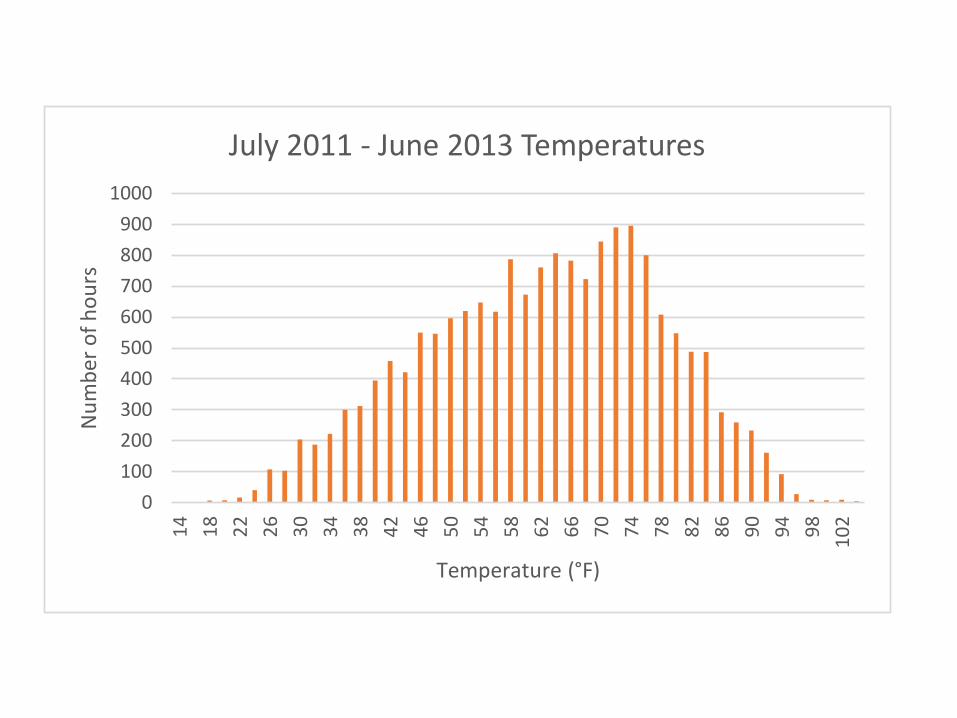
Temperature (°F)
July 2011 - June 2013 Temperatures
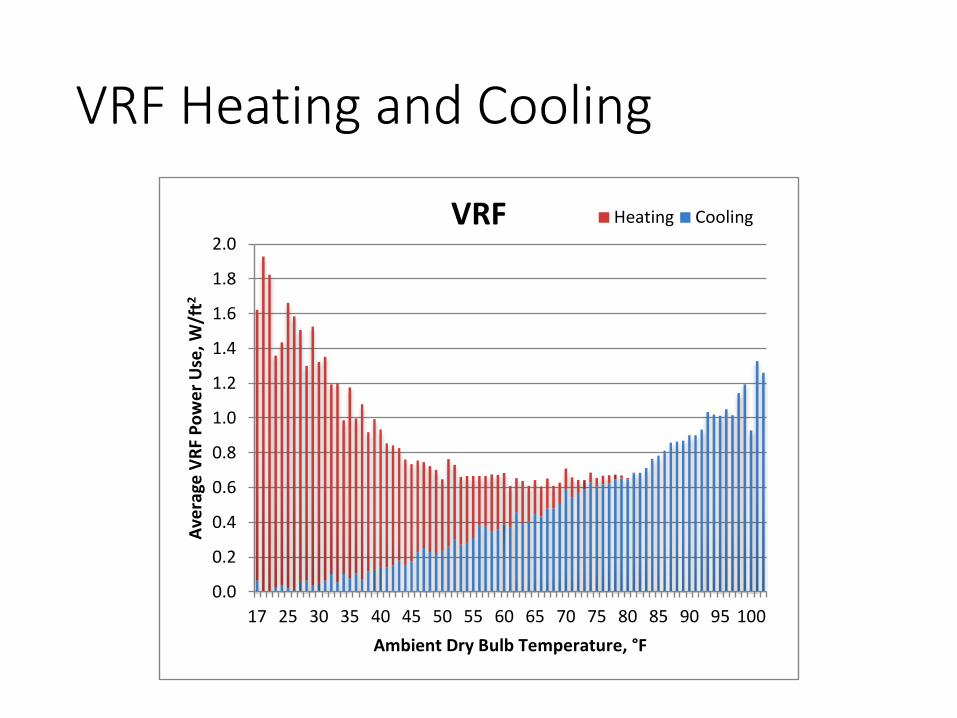
VRF Heating and Cooling
0.0
0.2
0.4
0.6
0.8
1.0
1.2
1.4
1.6
1.8
2.0
17 25 30 35 40 45 50 55 60 65 70 75 80 85 90 95 100
Ave
rage
VR
F P
ow
er
Use
, W/f
t2
Ambient Dry Bulb Temperature, °F
VRF Heating Cooling
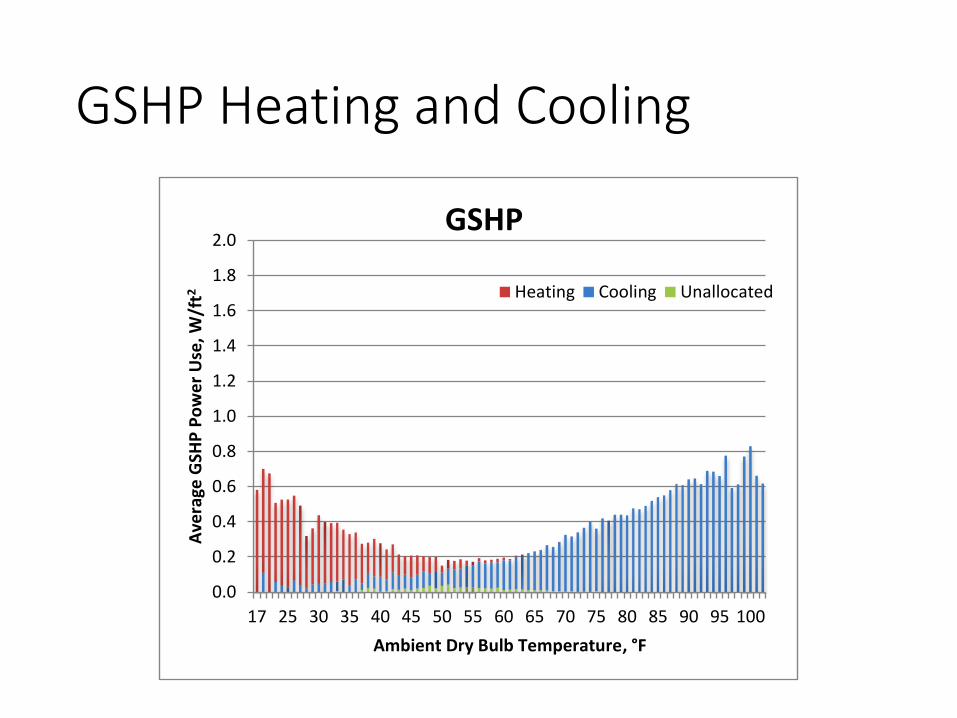
GSHP Heating and Cooling
0.0
0.2
0.4
0.6
0.8
1.0
1.2
1.4
1.6
1.8
2.0
17 25 30 35 40 45 50 55 60 65 70 75 80 85 90 95 100
Ave
rage
GSH
P P
ow
er
Use
, W/f
t2
Ambient Dry Bulb Temperature, °F
GSHP
Heating Cooling Unallocated
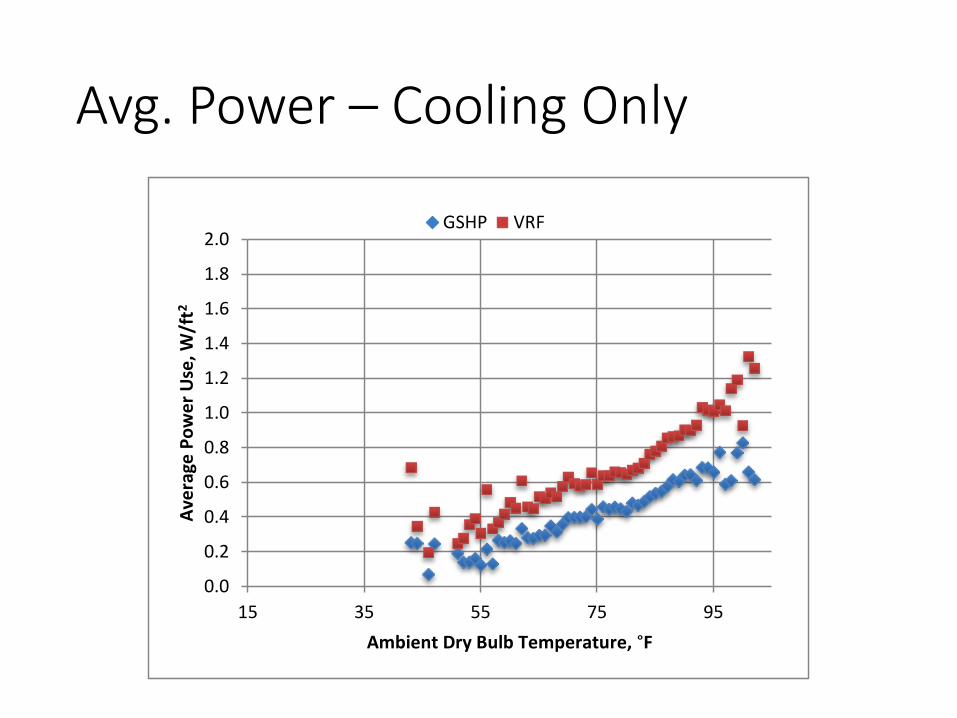
Avg. Power – Cooling Only
0.0
0.2
0.4
0.6
0.8
1.0
1.2
1.4
1.6
1.8
2.0
15 35 55 75 95
Ave
rage
Po
we
r U
se, W
/ft2
Ambient Dry Bulb Temperature, °F
GSHP VRF
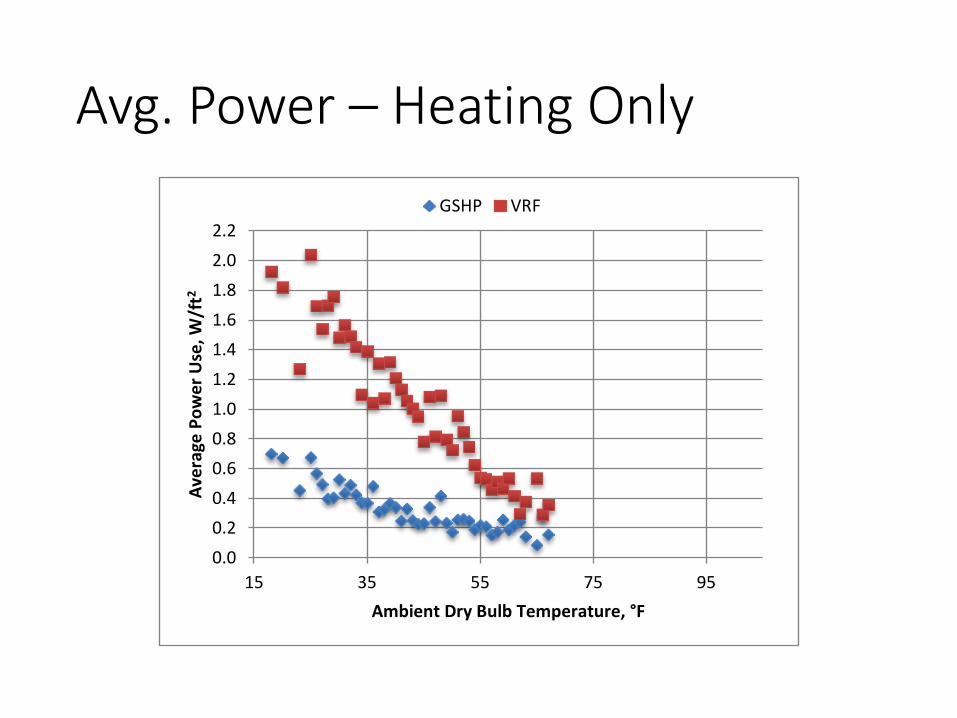
Avg. Power – Heating Only
0.0
0.2
0.4
0.6
0.8
1.0
1.2
1.4
1.6
1.8
2.0
2.2
15 35 55 75 95
Ave
rage
Po
we
r U
se, W
/ft2
Ambient Dry Bulb Temperature, °F
GSHP VRF
A moderate day
April 3, 2013Morning low: 43°FAfternoon high: 63°F
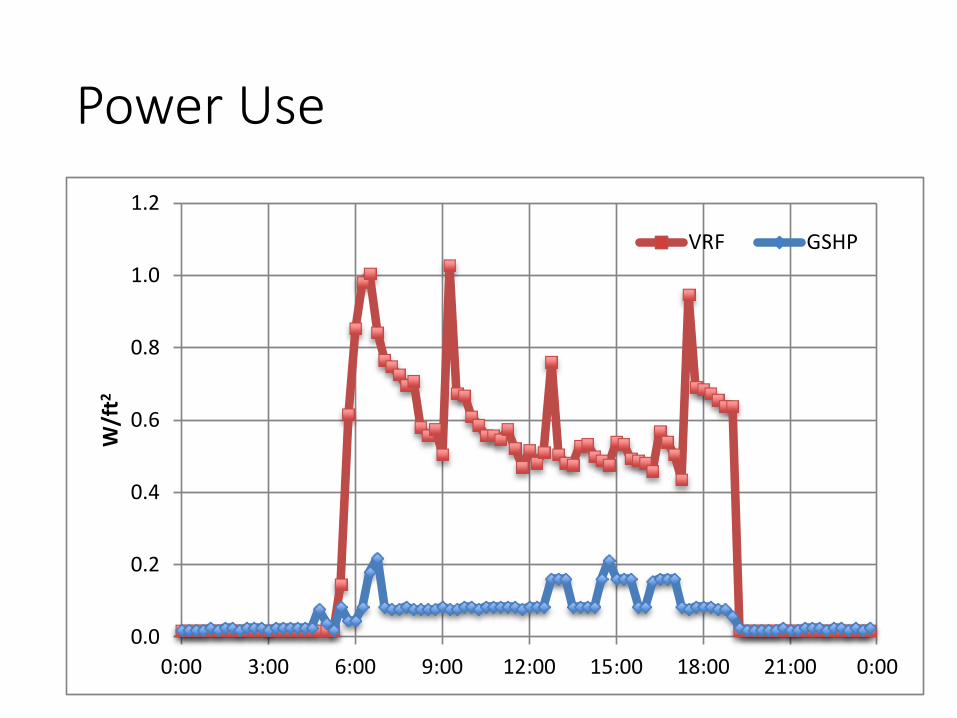
Power Use
0.0
0.2
0.4
0.6
0.8
1.0
1.2
0:00 3:00 6:00 9:00 12:00 15:00 18:00 21:00 0:00
W/f
t2
VRF GSHP
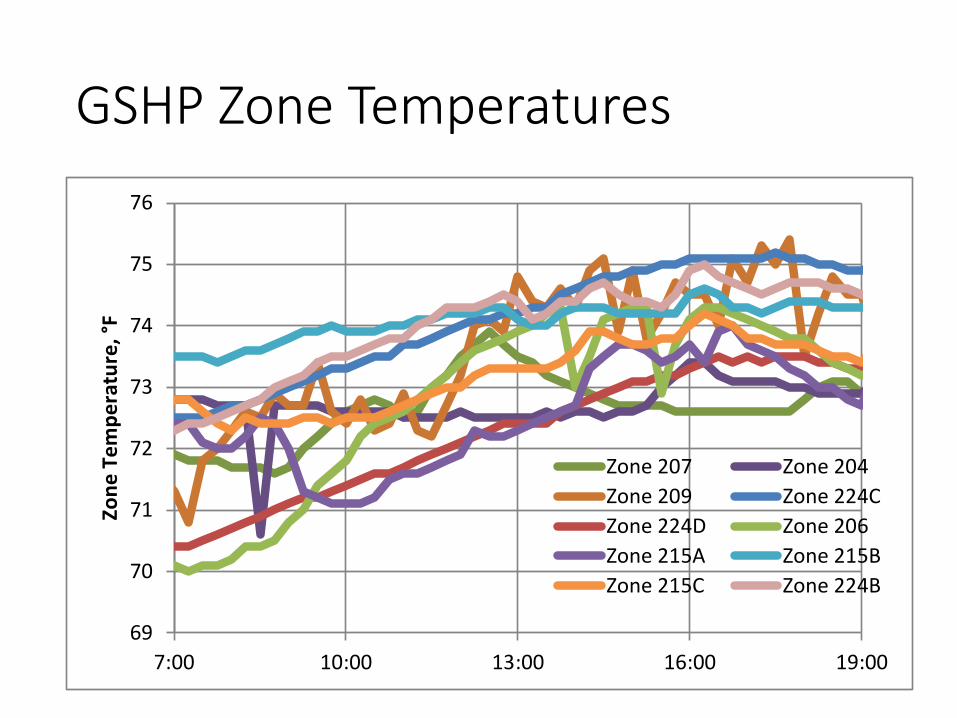
GSHP Zone Temperatures
69
70
71
72
73
74
75
76
7:00 10:00 13:00 16:00 19:00
Zon
e T
em
pe
ratu
re, °
F
Zone 207 Zone 204
Zone 209 Zone 224C
Zone 224D Zone 206
Zone 215A Zone 215B
Zone 215C Zone 224B
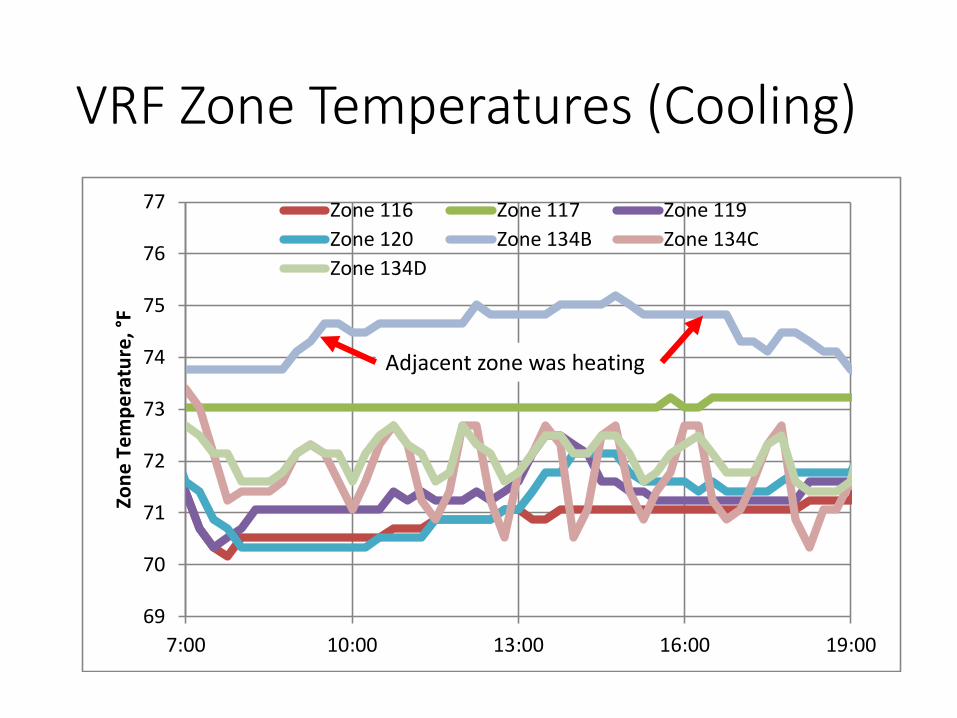
VRF Zone Temperatures (Cooling)
69
70
71
72
73
74
75
76
77
7:00 10:00 13:00 16:00 19:00
Zon
e T
em
pe
ratu
re, °
F
Zone 116 Zone 117 Zone 119
Zone 120 Zone 134B Zone 134C
Zone 134D
Adjacent zone was heating
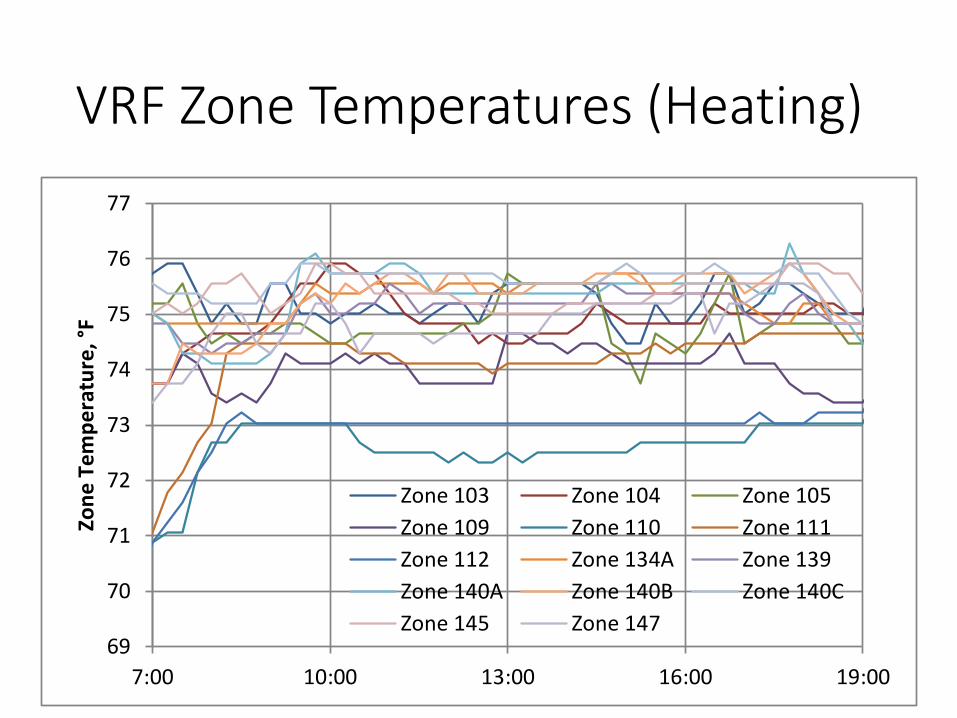
VRF Zone Temperatures (Heating)
69
70
71
72
73
74
75
76
77
7:00 10:00 13:00 16:00 19:00
Zon
e T
em
pe
ratu
re, °
F
Zone 103 Zone 104 Zone 105
Zone 109 Zone 110 Zone 111
Zone 112 Zone 134A Zone 139
Zone 140A Zone 140B Zone 140C
Zone 145 Zone 147
Why is GSHP so much better?
• Source temperatures.
• Equipment efficiency at actual source temperatures.
• Apparent control issue – most VRF units run mostof the time under moderate load conditions.
• Unnecessary (?) simultaneous heating and cooling.
• Loads are different. (Yes, but how much?)
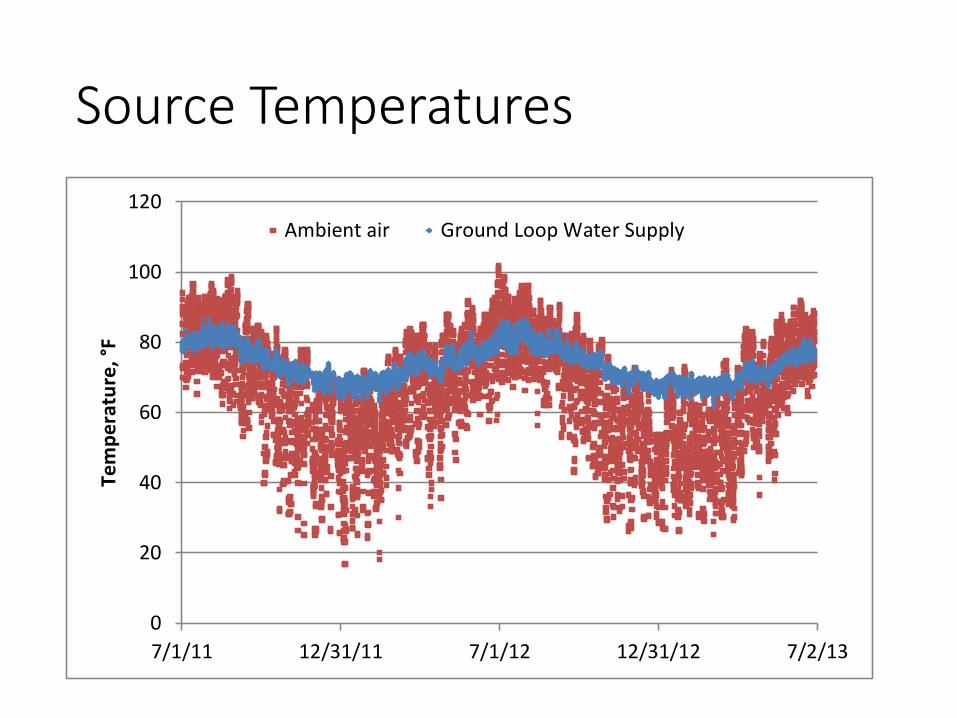
Source Temperatures
0
20
40
60
80
100
120
7/1/11 12/31/11 7/1/12 12/31/12 7/2/13
Tem
pe
ratu
re, °
F
Ambient air Ground Loop Water Supply

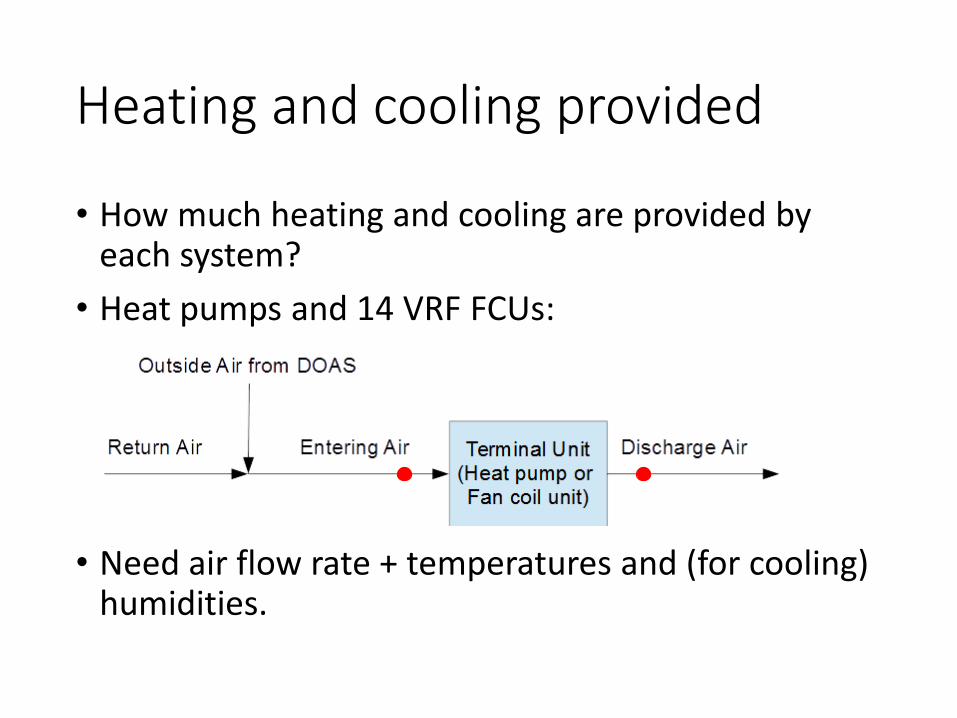
Heating and cooling provided
• How much heating and cooling are provided by each system?
• Heat pumps and 14 VRF FCUs:
• Need air flow rate + temperatures and (for cooling) humidities.
Actual Available Measurements
• Airflow – from flow hood measurements(VRF system changed control boards and flows in April 2012)
• Discharge air temperature
• Zone air temperature
• Zone air humidity
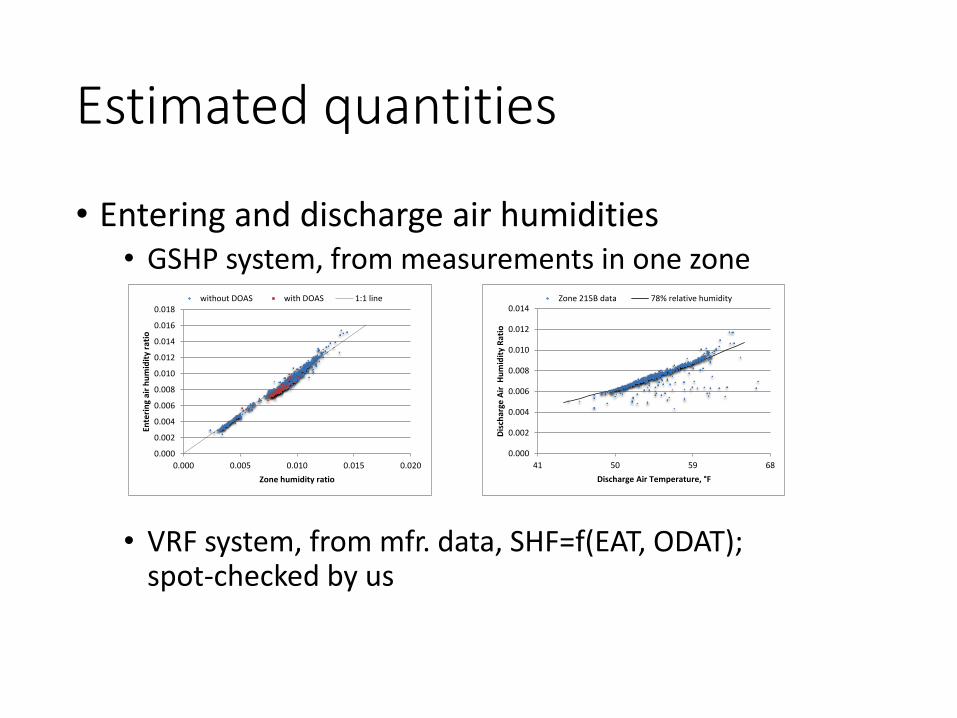
Estimated quantities
• Entering and discharge air humidities• GSHP system, from measurements in one zone
• VRF system, from mfr. data, SHF=f(EAT, ODAT);spot-checked by us
0.000
0.002
0.004
0.006
0.008
0.010
0.012
0.014
0.016
0.018
0.000 0.005 0.010 0.015 0.020
Ente
rin
g ai
r h
um
idit
y ra
tio
Zone humidity ratio
without DOAS with DOAS 1:1 line
0.000
0.002
0.004
0.006
0.008
0.010
0.012
0.014
41 50 59 68
Dis
char
ge A
ir H
um
idit
y R
atio
Discharge Air Temperature, °F
Zone 215B data 78% relative humidity
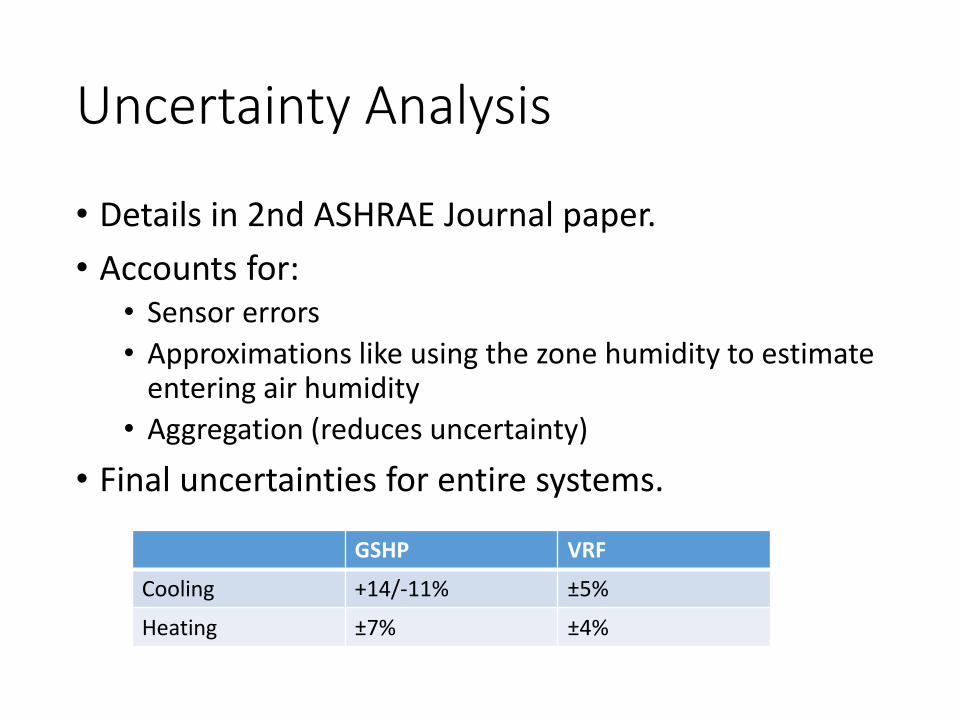
Uncertainty Analysis
• Details in 2nd ASHRAE Journal paper.
• Accounts for:• Sensor errors
• Approximations like using the zone humidity to estimate entering air humidity
• Aggregation (reduces uncertainty)
• Final uncertainties for entire systems.
GSHP VRF
Cooling +14/-11% ±5%
Heating ±7% ±4%
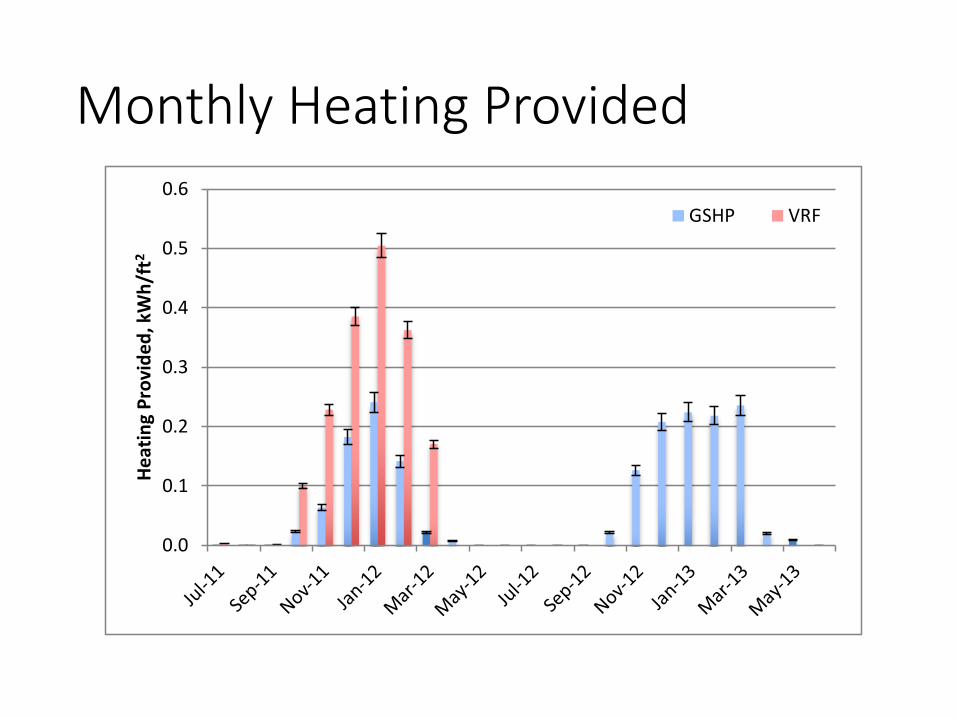
Monthly Heating Provided
0.0
0.1
0.2
0.3
0.4
0.5
0.6
He
atin
g P
rovi
de
d, k
Wh
/ft2
GSHP VRF
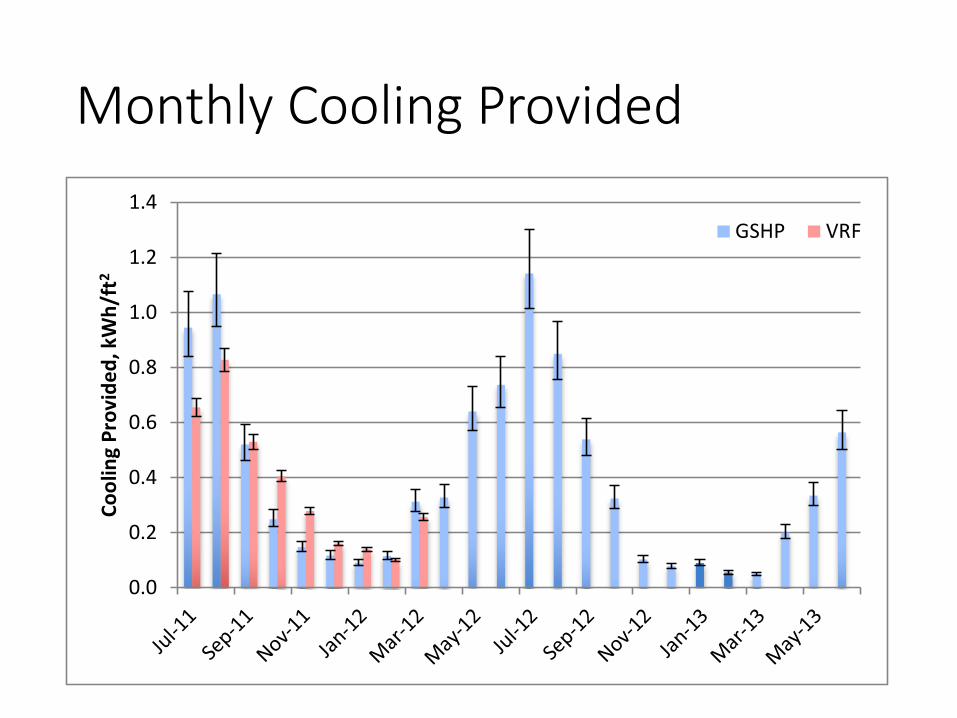
Monthly Cooling Provided
0.0
0.2
0.4
0.6
0.8
1.0
1.2
1.4
Co
olin
g P
rovi
de
d, k
Wh
/ft2
GSHP VRF
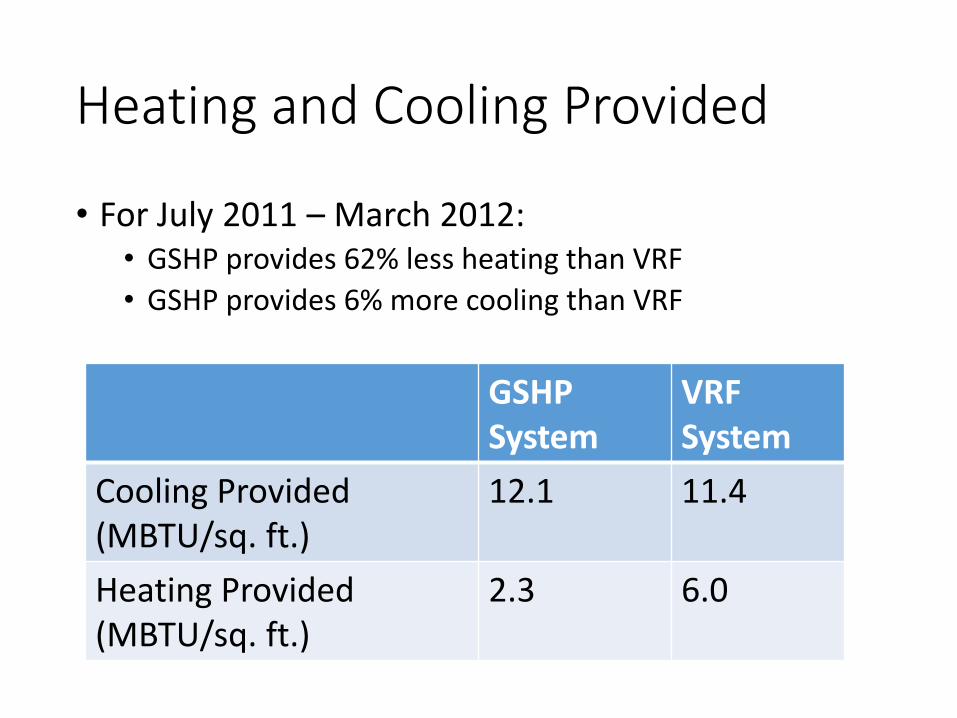
Heating and Cooling Provided
• For July 2011 – March 2012:• GSHP provides 62% less heating than VRF
• GSHP provides 6% more cooling than VRF
GSHP System
VRF System
Cooling Provided (MBTU/sq. ft.)
12.1 11.4
Heating Provided (MBTU/sq. ft.)
2.3 6.0
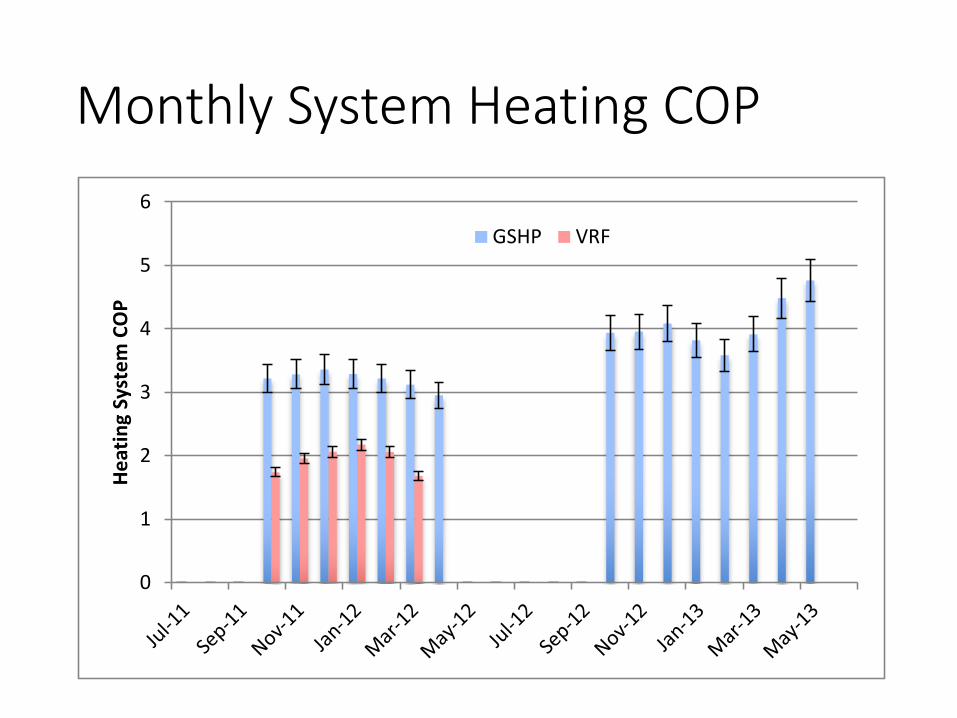
Monthly System Heating COP
0
1
2
3
4
5
6
He
atin
g Sy
ste
m C
OP
GSHP VRF
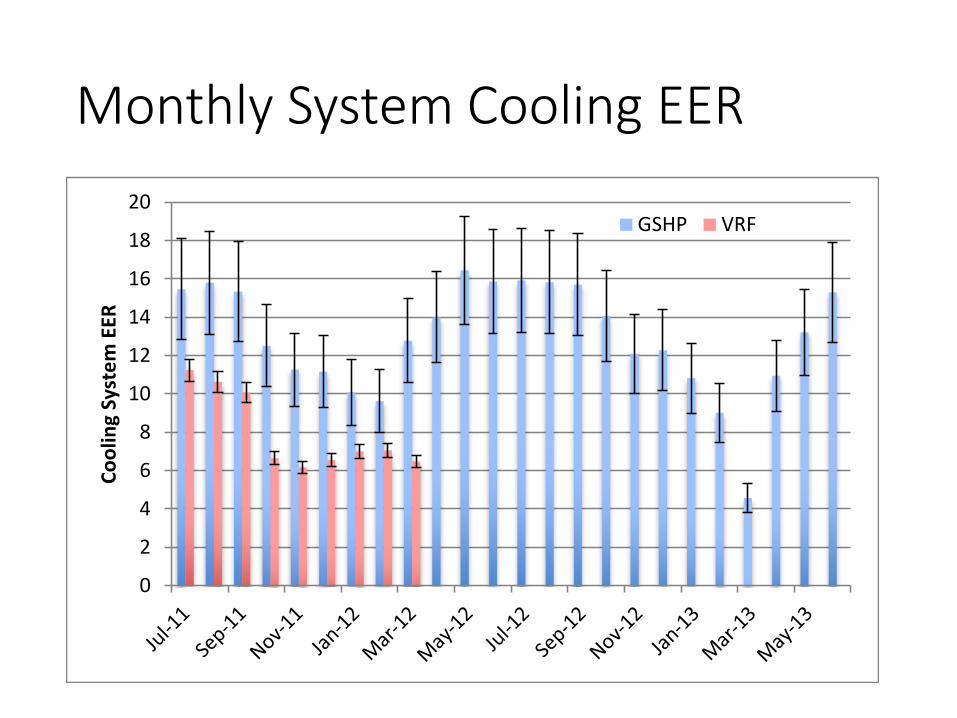
Monthly System Cooling EER
0
2
4
6
8
10
12
14
16
18
20
Co
olin
g Sy
ste
m E
ER
GSHP VRF
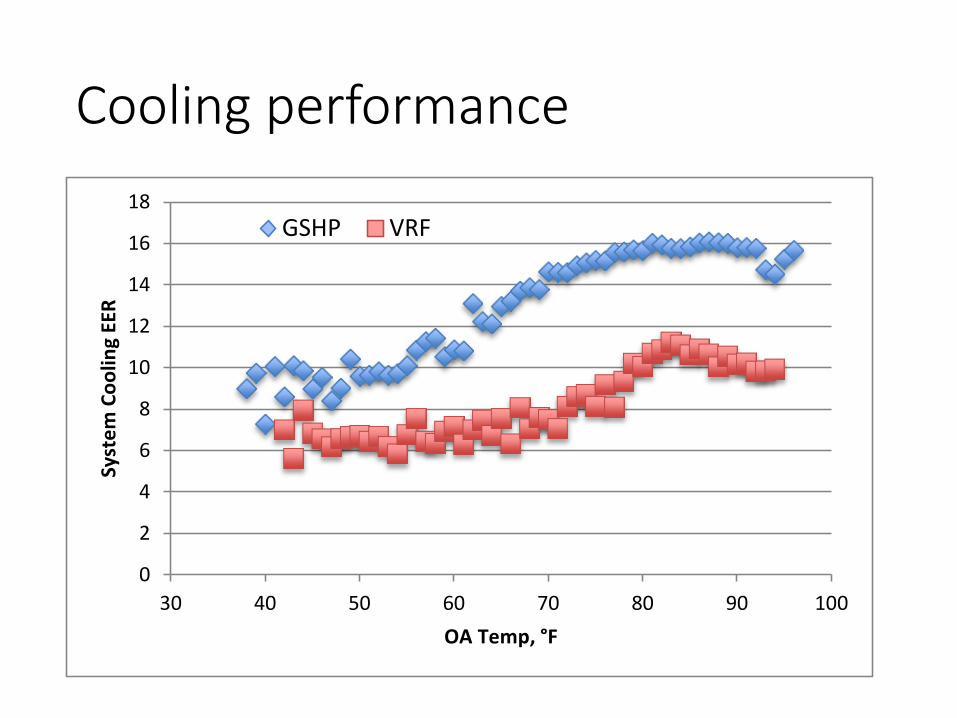
Cooling performance
0
2
4
6
8
10
12
14
16
18
30 40 50 60 70 80 90 100
Syst
em
Co
olin
g EE
R
OA Temp, °F
GSHP VRF

Heating Performance
0.0
0.5
1.0
1.5
2.0
2.5
3.0
3.5
4.0
4.5
25 35 45 55 65 75 85
Syst
em
He
atin
g C
OP
OA Temp, °F
GSHP VRF
Counterintuitive trends
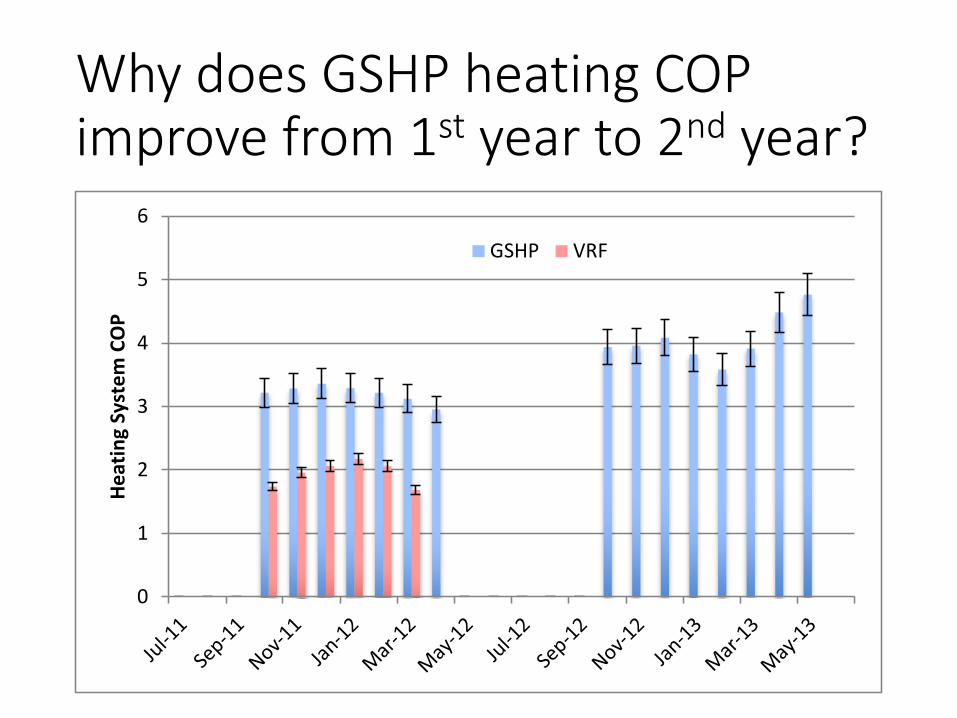
• GSHP system heating COP goes up from 1st winter to 2nd winter.
• For both systems, system cooling EER increases with increasing ODA temperature (to a point)
• For GSHP system, performance increases with higher loads. (next slide)
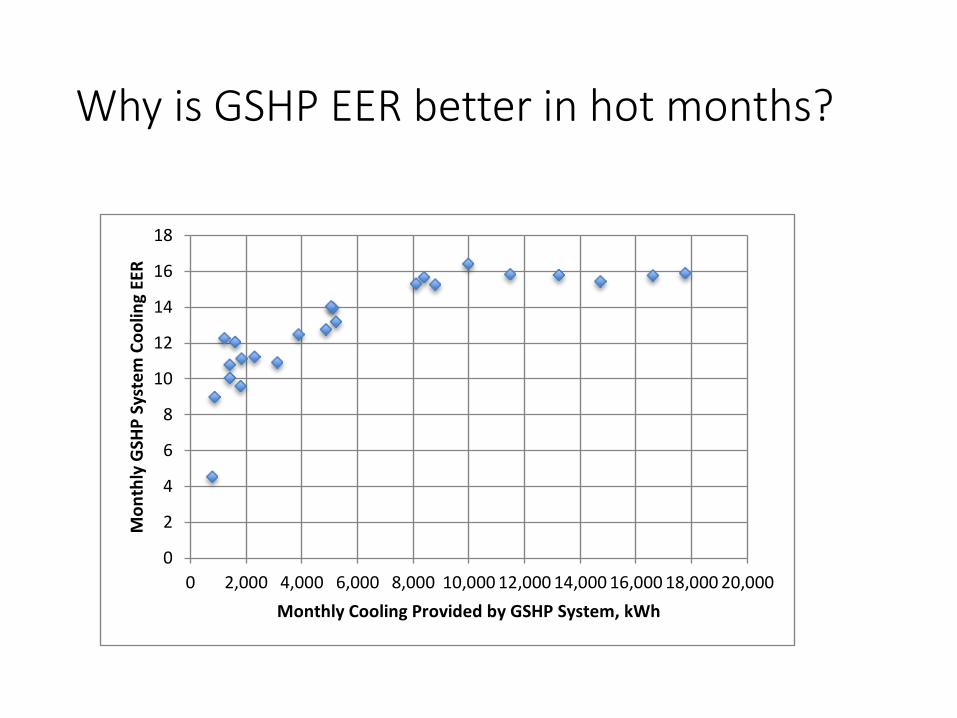
Why is GSHP EER better in hot months?
0
2
4
6
8
10
12
14
16
18
0 2,000 4,000 6,000 8,000 10,000 12,000 14,000 16,000 18,000 20,000
Mo
nth
ly G
SHP
Sys
tem
Co
olin
g EE
R
Monthly Cooling Provided by GSHP System, kWh
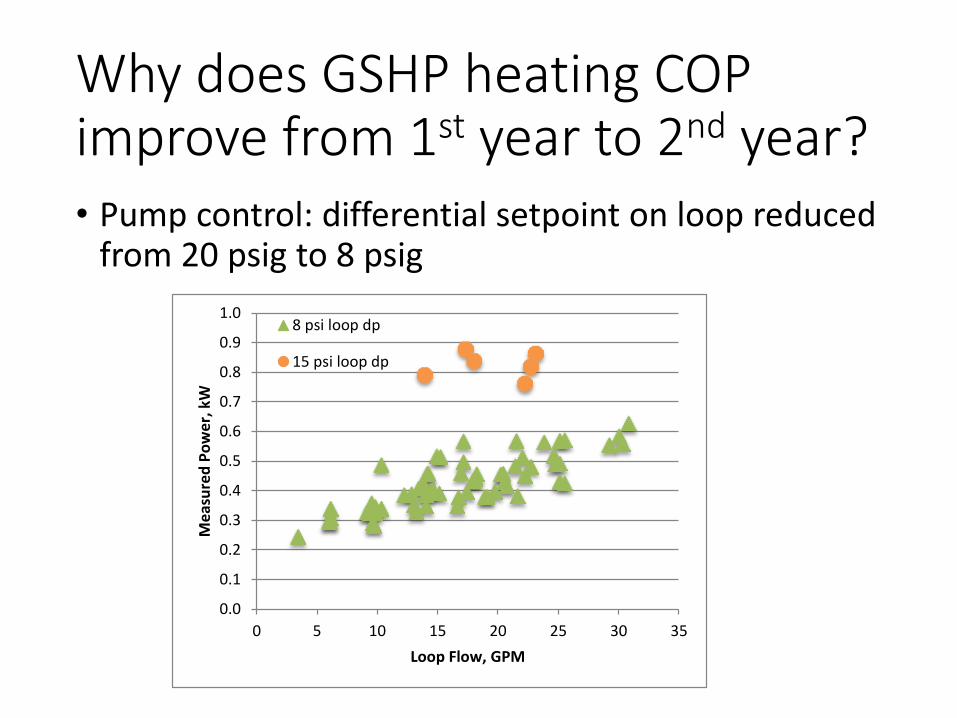
Why does GSHP heating COP improve from 1st year to 2nd year?• Pump control: differential setpoint on loop reduced
from 20 psig to 8 psig
0.0
0.1
0.2
0.3
0.4
0.5
0.6
0.7
0.8
0.9
1.0
0 5 10 15 20 25 30 35
Me
asu
red
Po
we
r, k
W
Loop Flow, GPM
8 psi loop dp
15 psi loop dp
0
1
2
3
4
5
6
He
atin
g Sy
ste
m C
OP
GSHP VRF
Why does GSHP heating COP improve from 1st year to 2nd year?• Pump control: differential setpoint on loop reduced
from 20 psig to 8 psig
0.0
0.1
0.2
0.3
0.4
0.5
0.6
0.7
0.8
0.9
1.0
0 5 10 15 20 25 30 35
Me
asu
red
Po
we
r, k
W
Loop Flow, GPM
8 psi loop dp
15 psi loop dp
Why are trends counterintuitive?
• For GSHP:• Entering fluid temperature does not correspond directly
to outdoor air temperature.
• Higher run time fractions correspond to less pumpingenergy and parasitic losses (per unit cooling or heatingprovided)
• For VRF (we speculate):• Simultaneous heating and cooling may not be as
efficient as imagined.
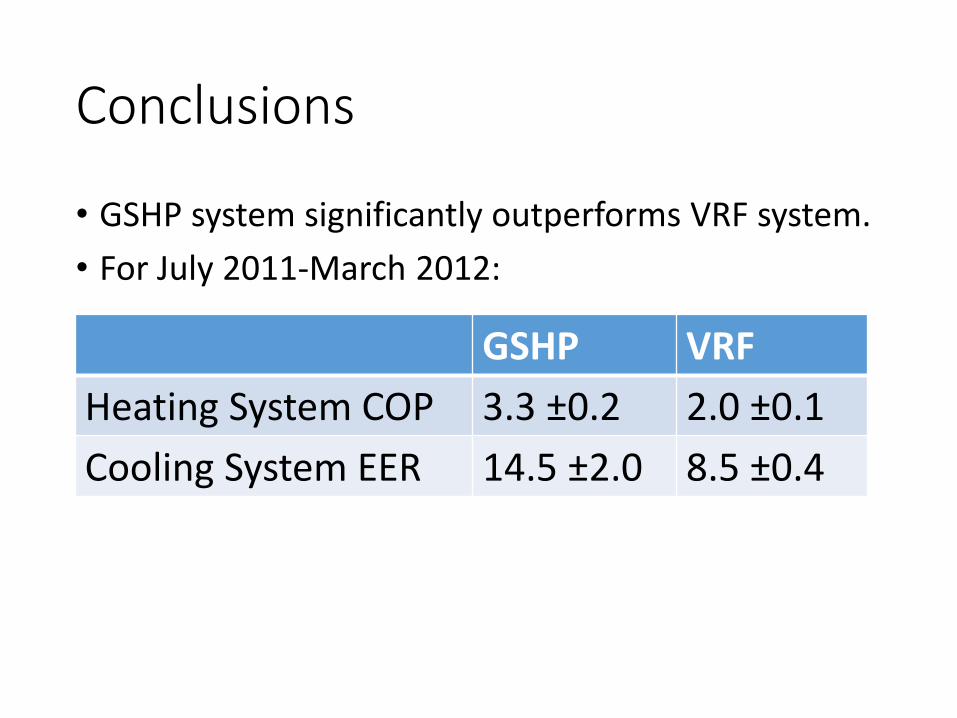
Conclusions
• GSHP system significantly outperforms VRF system.
• For July 2011-March 2012:
GSHP VRF
Heating System COP 3.3 ±0.2 2.0 ±0.1
Cooling System EER 14.5 ±2.0 8.5 ±0.4
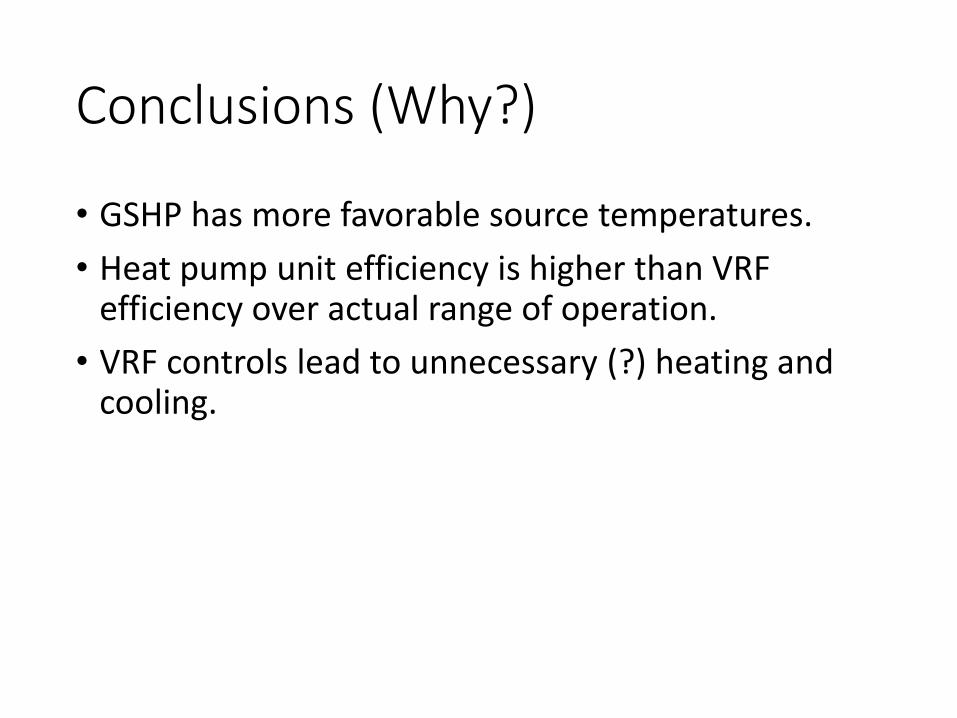
Conclusions (Why?)
• GSHP has more favorable source temperatures.
• Heat pump unit efficiency is higher than VRF efficiency over actual range of operation.
• VRF controls lead to unnecessary (?) heating and cooling.

Thanks!
• GEO
• Southern Company
• US/China Clean Energy Research Center for Building Energy Efficiency
• ASHRAE and Mike Vaughn
• Daikin, ClimateMaster and Trane
Recommended