Asahi World
Asahi Breweries, Ltd.ANNUAL REPORT 2009
Annual R
eport 20
09
ASAHI BREWERIES, LTD.http://www.asahibeer.co.jp/english
For more IR information, please contact our Investor Relations Office
(Public Relations Department)
1-23-1, Azumabashi, Sumida-ku, Tokyo 130-8602, Japan
Tel: +81-3-5608-5126 Fax: +81-3-5608-7121
E-mail: [email protected]
The Asahi Breweries Group is anchored by alcoholic beverages, including beer-type*1, shochu, and RTD (ready-to-
drink) beverages, whisky and spirits, and wine, also handling soft drinks and chilled beverages in its soft drinks business, along with
functional foods, baby foods and other products in the food business. The Group controls powerful brands in the Japanese market, including
Asahi Super Dry beer in the alcoholic beverages business and WONDA canned coffee in the soft drinks business. Overseas, the Group is
broadening its business horizons through partnerships with Tsingtao Brewery Company Limited (Tsingtao Brewery) and Tingyi-Asahi Beverages
Holding Co., Ltd. in China, the acquisition of Schweppes Australia, and other actions.
P4
HEAD OFFICE23-1, Azumabashi 1-chome, Sumida-ku, Tokyo 130-8602, JapanTel: +81-3-5608-5126Fax: +81-3-5608-7121URL: http://www.asahibeer.co.jp/english
DATE OF ESTABLISHMENTSeptember 1, 1949
MAJOR DOMESTIC OFFICES AND BREWERIESRegional Headquarters and Branches: 20Breweries: 9Laboratories: 9
NUMBER OF OVERSEAS OFFICESBusiness Offices: 3
NUMBER OF EMPLOYEESConsolidated: 17,316Non-consolidated: 3,719
FISCAL YEAR-END DATEDecember 31, on an annual basis
DIVIDENDSYear-end: To shareholders of record on December 31Interim: To shareholders of record on June 30
PAID-IN CAPITAL¥182,531 million
NUMBER OF SHARES OF COMMON STOCK ISSUED483,585,862
NUMBER OF SHAREHOLDERS119,908 (4,458 more than last fiscal year)
ORDINARY GENERAL MEETING OF SHAREHOLDERSThe ordinary general meeting of shareholders of the Company is normally held in March each year in Tokyo, Japan. In addition, the Company may hold an extraordinary meeting of shareholders as necessary, giving at least two weeks prior notice to shareholders.
Investor Information (As of December 31, 2009)
COMPOSITION OF SHAREHOLDERS (%)
Financial institutions 37.8
Overseas corporations, etc. 26.8
Individuals, other 16.9
Other corporations 16.3
Securities companies 2.2
* Treasury stock is included under “Individuals, other.”
MAJOR SHAREHOLDERS
Shareholder NamePercentage of
voting rights (%)
Japan Trustee Services Bank, Ltd. (Trust Account) 4.5%
The Master Trust Bank of Japan, Ltd. (Trust Account) 4.4%
Asahi Kasei Corporation 3.9%
The Dai-ichi Mutual Life Insurance Company 3.5%
Fukoku Mutual Life Insurance Company 3.5%
Sumitomo Mitsui Banking Corporation 1.9%
The Sumitomo Trust & Banking Co., Ltd. 1.7%
Sumitomo Life Insurance Company 1.5%
Mizuho Corporate Bank, Ltd. 1.2%
The Norinchukin Bank 1.2%
* While Asahi Breweries, Ltd. owns 18,576,000 shares of treasury stock, it is not included with the major shareholders listed above.
STOCK EXCHANGE LISTINGSTokyo Stock Exchange, Osaka Securities Exchange
NEWSPAPER FOR OFFICIAL NOTICENihon Keizai Shimbun
TRANSFER AGENT AND REGISTRAR STOCK TRANSFER AGENT: The Sumitomo Trust & Banking Co., Ltd. 2-3-1 Yaesu, Chuo-ku, Tokyo
HANDLING OFFICE: The Sumitomo Trust & Banking Co., Ltd. Stock Transfer Agency Department 1-4-4 Marunouchi, Chiyoda-ku, Tokyo
AUDITORKPMG AZSA & Co.
2009/1 2009/3 2009/5 2009/7 2009/9 2009/11
(¥)
(million shares)
0
5
10
20
15
1,000
1,200
1,400
1,600
SHARE PRICE RANGE AND TRADING VOLUME ON THE TOKYO STOCK EXCHANGE (COMMON STOCK)
93
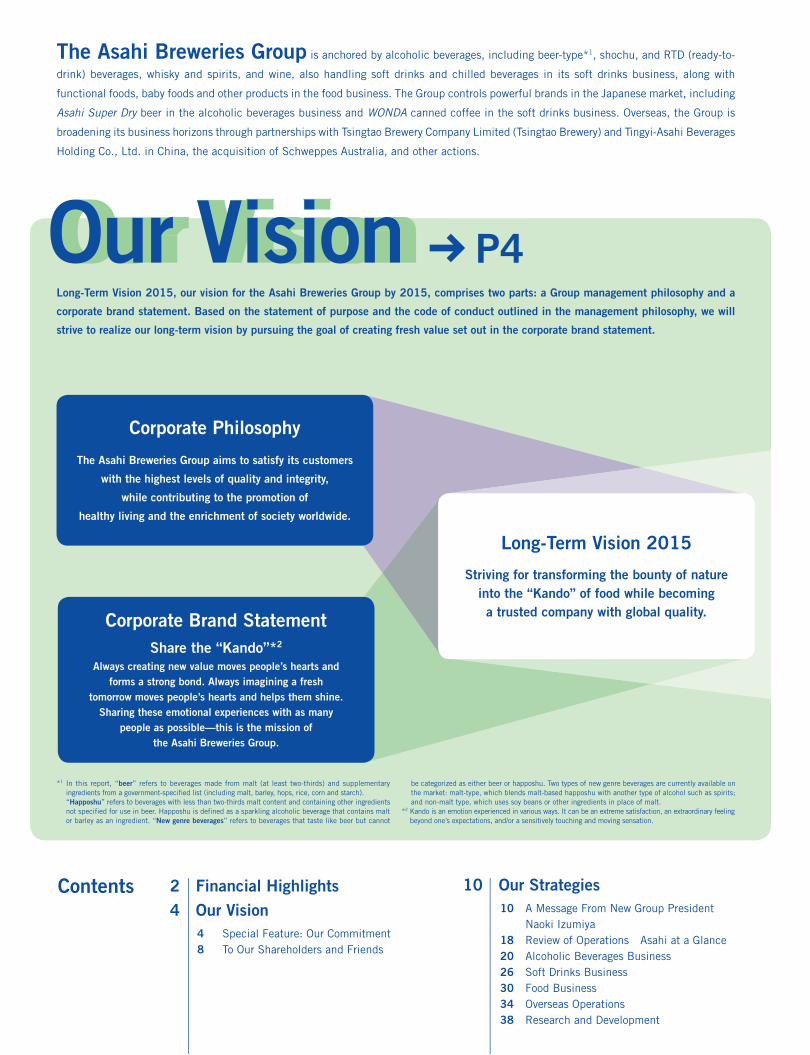
Corporate Philosophy
The Asahi Breweries Group aims to satisfy its customers
with the highest levels of quality and integrity,
while contributing to the promotion of
healthy living and the enrichment of society worldwide.
Long-Term Vision 2015
Striving for transforming the bounty of nature into the “Kando” of food while becoming a trusted company with global quality.Corporate Brand Statement
Share the “Kando”*2
Always creating new value moves people’s hearts and forms a strong bond. Always imagining a fresh
tomorrow moves people’s hearts and helps them shine. Sharing these emotional experiences with as many
people as possible—this is the mission of the Asahi Breweries Group.
2 Financial Highlights 4 Our Vision 4 Special Feature: Our Commitment 8 To Our Shareholders and Friends
10 Our Strategies 10 A Message From New Group President
Naoki Izumiya 18 Review of Operations Asahi at a Glance 20 Alcoholic Beverages Business 26 Soft Drinks Business 30 Food Business 34 Overseas Operations 38 Research and Development
Contents
Long-Term Vision 2015, our vision for the Asahi Breweries Group by 2015, comprises two parts: a Group management philosophy and a
corporate brand statement. Based on the statement of purpose and the code of conduct outlined in the management philosophy, we will
strive to realize our long-term vision by pursuing the goal of creating fresh value set out in the corporate brand statement.
*1 In this report, “beer” refers to beverages made from malt (at least two-thirds) and supplementary ingredients from a government-specified list (including malt, barley, hops, rice, corn and starch).
“Happoshu” refers to beverages with less than two-thirds malt content and containing other ingredients not specified for use in beer. Happoshu is defined as a sparkling alcoholic beverage that contains malt or barley as an ingredient. “New genre beverages” refers to beverages that taste like beer but cannot
be categorized as either beer or happoshu. Two types of new genre beverages are currently available on the market: malt-type, which blends malt-based happoshu with another type of alcohol such as spirits; and non-malt type, which uses soy beans or other ingredients in place of malt.
*2 Kando is an emotion experienced in various ways. It can be an extreme satisfaction, an extraordinary feeling beyond one’s expectations, and/or a sensitively touching and moving sensation.

The Asahi Breweries Group recently formulated its long-term vision targeting the year 2015. Our aim in this report
is to give readers a clear understanding of both this vision and the business strategies contained in the Medium-Term Management Plan
2012 that we will pursue to achieve it. In the Special Feature (p. 4), we let front-line employees explain in their own words our long-term
vision of striving to transform the bounty of nature into the “Kando” of food while becoming a trusted company with global quality. Next,
in an interview with Asahi Breweries President Naoki Izumiya (p. 10) and the Review of Operations (p. 18), we discuss the underlying
economic climate in which we are operating and the concrete strategies that will allow us to realize our long-term vision.
and
P10
1
The Asahi Breweries Group has established the Medium-Term Management Plan 2012 as a priority milestone for the achievement of the
Long-Term Vision 2015. Our top priority for the three years through 2012 is to improve existing businesses’ profitability while aggressively
promoting new capital and business alliances. The policies for each business are outlined below.
Alcoholic Beverages Business: Strengthening and Cultivating Core Brands While Striving for World-Class Profitability
Soft Drinks Business: Cultivating Strong Brands and Raising Profitability to Become a Pillar of the Industry Realignment
Overseas Operations: Raising Profitability in China by Alliance With Tsingtao Brewery and Expanding Our Presence in Asia and Oceania
Food Business*: Reinforcing Brands and Seeking Group Synergies in Areas of Strength
Medium-Term Management Plan 2012
Improve existing businesses’ profitability in pursuit of
Long-Term Vision 2015’s attainment.
40 Group Management 40 Corporate Governance 44 Risk Management and Compliance 45 Board of Directors, Auditors and
Corporate Officers 46 Corporate Social Responsibility (CSR)
49 Financial Section 87 Fact Sheets
Forward-Looking Statements
The current plans, forecasts, strategies and performance
presented in this annual report include forward-looking state-
ments based on assumptions and opinions arrived at from
currently available information. Asahi Breweries cautions
readers that future actual results could differ materially from
these forward-looking statements depending on the outcome
of certain factors. All such forward-looking statements are
subject to certain risks and uncertainties including, but not
limited to, economic conditions, trends in consumption and
market competition, foreign exchange rates, tax, and other
systems influencing the company’s business areas.
* As part of the formulation “Long-Term Vision 2015” and “Medium-Term Management Plan 2012,” the Group’s food and pharmaceuticals operation was renamed the “food business.”

2 Our Vision: Financial Highlights
Financial Highlights
Millions of yen %Thousands of U.S.
dollars *1
2009 2008 2007Change
(2009/2008) 2009
For the year:
Net sales ¥1,472,469 ¥1,462,748 ¥1,464,072 +0.7 $15,987,720
Alcoholic beverages 958,156 995,703 1,012,256 –3.8 10,403,431
Soft drinks 355,162 316,737 299,663 +12.1 3,856,265
Food and pharmaceuticals 92,400 79,203 67,089 +16.7 1,003,257
Others 66,751 71,105 85,064 –6.1 724,767
Operating income 82,777 94,520 86,956 –12.4 898,773
Alcoholic beverages 78,879 90,762 79,285 –13.1 856,449
Soft drinks 695 616 4,593 +12.8 7,546
Food and pharmaceuticals 2,745 1,944 1,344 +41.2 29,804
Others 889 1,006 1,724 –11.6 9,653
Elimination and/or corporate (431) 192 10 — (4,679)
Operating income ratio (%) 5.6 6.5 5.9 –0.9 point
Net income 47,645 45,014 44,798 +5.8 517,318
Net cash provided by operating activities 106,358 106,094 69,573 +0.2 1,154,810
Capital investments*2 62,376 36,135 44,481 +72.6 677,264
At year-end:
Total assets ¥1,433,653 ¥1,299,059 ¥1,324,392 +10.4 $15,566,265
Interest-bearing debt 391,875 302,259 332,458 +29.6 4,254,896
Total net assets 577,703 534,628 529,782 +8.1 6,272,562
Per share data (in yen and U.S. dollars):
Net income ¥ 102.49 ¥ 96.31 ¥ 94.94 +6.4 $ 1.11
Diluted net income 102.42 96.14 94.74 +6.5 1.11
Cash dividends applicable to the year 21.00 20.00 19.00 ±0.0 0.23
Total net assets 1,233.25 1,122.13 1,089.33 +9.9 13.39
Key ratios:
ROE (%) 8.7 8.7 9.0
ROA (%)*3 6.6 7.4 6.9
Total assets turnover (times) 1.1 1.1 1.1
Equity ratio (%) 40.0 40.2 38.9
Interest coverage ratio (times) 23.1 20.4 13.4
Debt-to-equity ratio (times) 0.68 0.58 0.65
*1 U.S. dollar amounts are translated from Japanese yen, for convenience only, at the rate of ¥92.10 to U.S.$1, using the exchange rate prevailing at December 31, 2009.*2 Includes effects accompanying changes in accounting standards for lease transactions and trademarks of an Australian subsidiary at time of acquisition.*3 ROA: Ordinary income to total assets
Asahi Breweries, Ltd. and Consolidated SubsidiariesDecember 31, 2009, 2008 and 2007

3
0
400
800
1,200
1,600 1,472.5
958.2
355.292.466.81,430.0 1,446.4 1,464.1 1,462.7
20092005 2006 2007 20080
30
60
90
120
82.890.2
39.9
88.7
44.8
87.0
44.8
94.5
45.0
20092005 2006 2007 2008
47.6
OPERATInG InCOME/nET InCOME(¥ billion)
nET SALES(¥ billion)
1,433.7
1,218.2
7.4
1,288.5
7.2
1,324.4
6.9
1,299.1
7.4
20092005 2006 2007 2008
6.6
0
500
1,000
1,500
0
3
6
9
0
20
80
60
40
62.4
43.950.0
36.9
48.844.5
45.3
36.1
47.4
20092005 2006 2007 2008
58.4
CAPITAL InVESTMEnTS*/DEPRECIATIOn*(¥ billion)
TOTAL ASSETS/ROA(¥ billion) (%)
0
100
200
400
600
500
300
0
2
4
8
12
10
6
573.5
454.9
9.1
476.7
9.6
514.7
9.0
521.6
8.7
20092005 2006 2007 2008
8.7
TOTAL nET ASSETS/ROE(¥ billion) (%)
391.9
289.2
0.64
290.1
0.61
332.5
0.65
302.3
0.58
20092005 2006 2007 2008
0.68
0
100
200
300
400
0
0.3
0.6
0.9
1.2
InTEREST-BEARInG DEBT/D/E RATIO(¥ billion) (Times)
Alcoholic Beverages Soft Drinks
Food and Pharmaceuticals Others Operating Income Net Income
Total Assets (Left Scale) ROA (Right Scale) Capital Investments Depreciation
* Includes effects accompanying changes in accounting standards for lease transactions and trademarks of an Australian subsidiary at time of acquisition.
Total Net Assets (Left Scale) ROE (Right Scale) Interest-Bearing Debt (Left Scale) D/E Ratio (Right Scale)
4 Our Vision: Special Feature
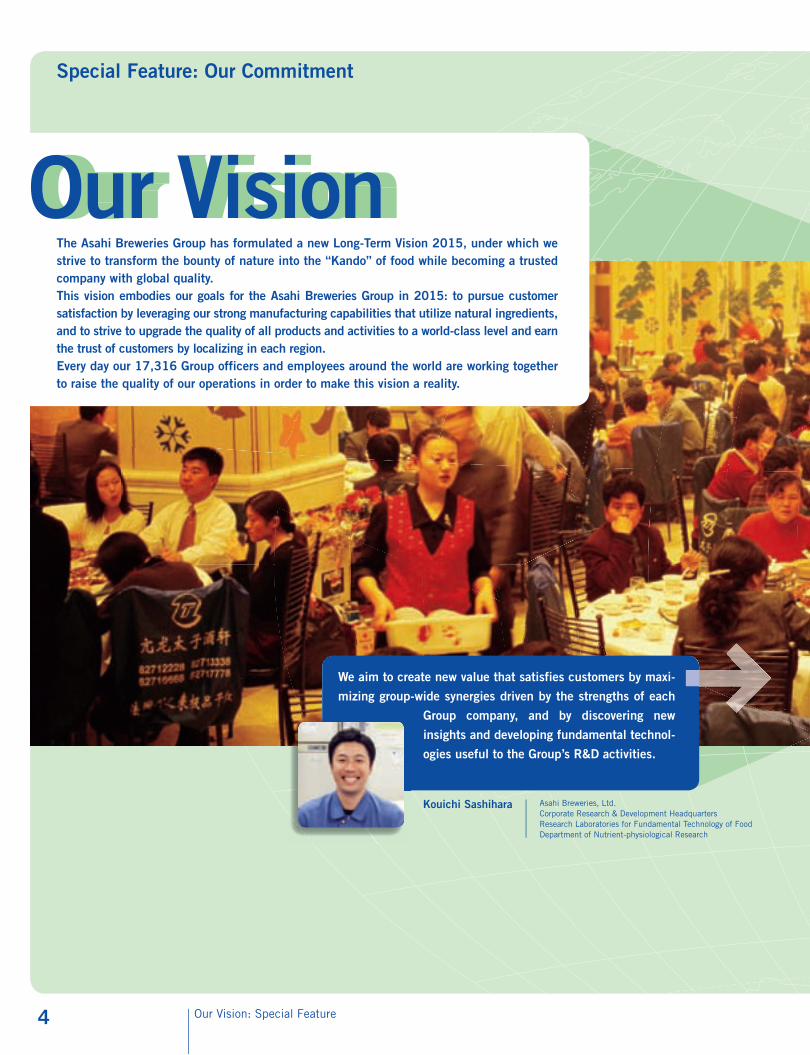
Special Feature: Our Commitment
Kouichi Sashihara Asahi Breweries, Ltd.Corporate Research & Development HeadquartersResearch Laboratories for Fundamental Technology of FoodDepartment of Nutrient-physiological Research
We aim to create new value that satisfies customers by maxi-
mizing group-wide synergies driven by the strengths of each
Group company, and by discovering new
insights and developing fundamental technol-
ogies useful to the Group’s R&D activities.
The Asahi Breweries Group has formulated a new Long-Term Vision 2015, under which we strive to transform the bounty of nature into the “Kando” of food while becoming a trusted company with global quality.This vision embodies our goals for the Asahi Breweries Group in 2015: to pursue customer satisfaction by leveraging our strong manufacturing capabilities that utilize natural ingredients, and to strive to upgrade the quality of all products and activities to a world-class level and earn the trust of customers by localizing in each region.Every day our 17,316 Group officers and employees around the world are working together to raise the quality of our operations in order to make this vision a reality.

5
Ayako Yano
Wakodo Co., Ltd.Department of Baby Foods & GoodsResearch and Development Center
By harnessing expertise developed over
more than a century and its impeccable
quality grounded on food safety and reli-
ability, Wakodo aims to offer high-value-added product
propositions to customers in order to deliver customer sat-
isfaction surpassing expectations.
Makiko Akita Asahi Soft Drinks Co., Ltd.Marketing Headquarters, Products Strategy Department
Customer needs are diversifying, for example, with consum-
ers becoming increasingly health-conscious. By constantly
focusing on customer-oriented production, we
propose products to satisfy as many customers
as possible.

6 Our Vision: Special Feature
Looking ahead, we must accelerate efforts to strengthen the
overseas operations base in order to achieve further Group-
wide growth. We will do our utmost to enhance our presence
mainly in Asia and Oceania. In the process, we
seek to establish ourselves as a driving force
behind the Group’s growth strategy.
Hiroshi Shimizu Asahi Breweries, Ltd.International Headquarters, International Business Department
Satoshi IchikawaAsahi Breweries, Ltd.Kanagawa Brewery, Brewing Section
The top priority of day-to-day production
operations is to produce beer of the
highest quality in a timely manner and
only in the amounts needed. By continuously raising
the bar of our performance in this regard, we aspire to
earn the trust of customers and society at large.
only in the amounts needed. By continuously raising only in the amounts needed. By continuously raising
7
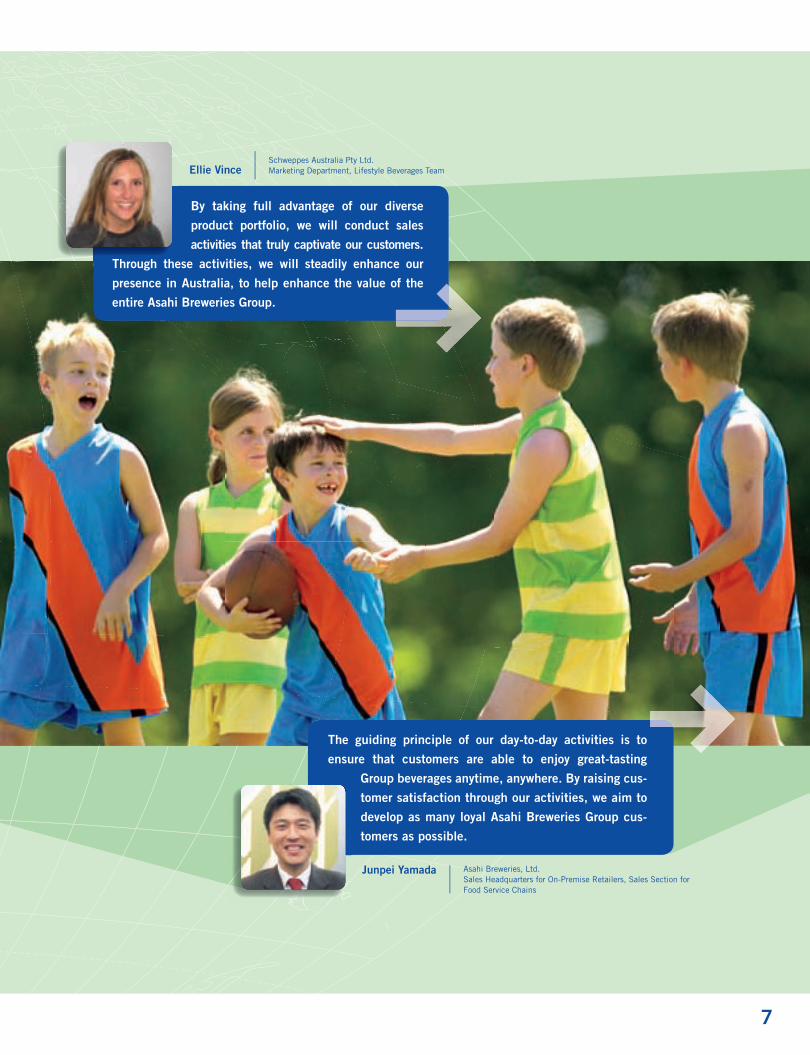
Ellie VinceSchweppes Australia Pty Ltd.Marketing Department, Lifestyle Beverages Team
By taking full advantage of our diverse
product portfolio, we will conduct sales
activities that truly captivate our customers.
Through these activities, we will steadily enhance our
presence in Australia, to help enhance the value of the
entire Asahi Breweries Group.
Junpei Yamada Asahi Breweries, Ltd.Sales Headquarters for On-Premise Retailers, Sales Section for Food Service Chains
The guiding principle of our day-to-day activities is to
ensure that customers are able to enjoy great-tasting
Group beverages anytime, anywhere. By raising cus-
tomer satisfaction through our activities, we aim to
develop as many loyal Asahi Breweries Group cus-
tomers as possible.
8 Our Vision: To Our Shareholders and Friends
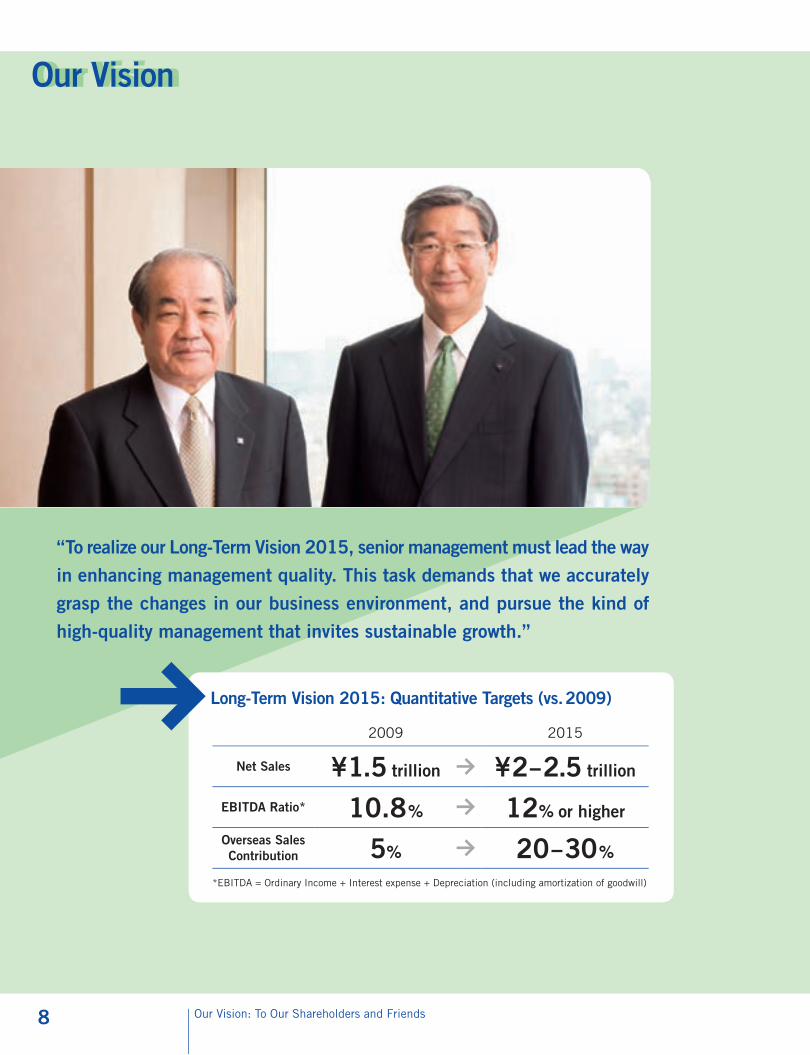
Long-Term Vision 2015: Quantitative Targets (vs. 2009)
2009 2015
net Sales ¥1.5 trillion ¥2–2.5 trillion
EBITDA Ratio* 10.8% 12% or higher
Overseas Sales Contribution 5% 20–30%
*EBITDA = Ordinary Income + Interest expense + Depreciation (including amortization of goodwill)
“To realize our Long-Term Vision 2015, senior management must lead the way in enhancing management quality. This task demands that we accurately grasp the changes in our business environment, and pursue the kind of high-quality management that invites sustainable growth.”

9
Japan’s economy, battered by the worldwide recession triggered by economic turmoil in the United States,
continued to face weak economic conditions during the fiscal year ended December 31, 2009. The business
environment in the food industry, meanwhile, has entered a period of major transformation characterized by
realignments in Japan and overseas as key markets mature.
Anticipating these changes, we formulated Long-Term Vision 2015 and Medium-Term Management Plan
2012, declaring a new direction for the Asahi Breweries Group that reaffirms our corporate philosophy.
Coinciding with this new start, our policy going forward is to innovate our management structure, and to move
with speed to meet management plan targets.
Under the Long-Term Vision, our stated mission is strive to transform the bounty of nature into the “Kando”
of food while becoming a trusted company with global quality. Our goal by the final year of this vision is to
achieve net sales of ¥2 to ¥2.5 trillion, a business scale that will rank the Group among the top 10 firms in
the global food industry. Under Medium-Term Management Plan 2012, a set of milestones for realizing this
vision, our top priority will be improving the profitability of existing businesses. Accordingly, we plan to push
ahead with profit structure reform designed to generate stable cash flows. Our intent here is not simply to
grow our business scale, but to build an optimal business portfolio from a medium- to long-term perspective
by using cash flows for global business and capital alliances.
To realize our Long-Term Vision, senior management must lead the way in enhancing management quality.
This task demands that we accurately grasp the changes in our business environment, and pursue the kind
of high-quality management that invites sustainable growth. In all corporate activities, our aim is to evolve
into a corporate group that delivers more to excite, satisfy and energize our stakeholders. With this in mind,
expect great things from what the Asahi Breweries Group has in store going forward.
To Our Shareholders and Friends
naoki IzumiyaPresident
Hitoshi OgitaChairman of the Board
10 Our Strategies
A Message From new Group President naoki Izumiya
Fiscal 2009 marked the final year of our Third Medium-Term Management Plan. Amid an increasingly
challenging business environment marred by weak consumer spending, we moved to strengthen our Group
management base with the goal of establishing a growth and earnings base for our next phase as a com-
pany. These efforts resulted in record-high net income for a ninth consecutive term.
From 2010, we embarked on the Medium-Term Management Plan 2012. In the plan we give highest
priority to improving the profitability of existing businesses, while also further enhancing business and
capital alliances in Japan and overseas. Our success here will be vital to realizing our Long-Term Vision.
naoki IzumiyaPresident
: A Message from New Group President Naoki Izumiya

11
long-term cash flows by restructuring our brand base and carrying
out profit structure reform in the domestic alcoholic beverages busi-
ness. The second policy was to use that cash to promote growth in
existing Group businesses and for investment in new businesses.
Unquestionably, our biggest success was that the profit struc-
ture reforms we enacted were far greater than initially planned.
Despite facing escalating costs for raw materials, we sought to
create optimal production and distribution frameworks, which
included the hybridization of our Ibaraki Brewery. We also used
fixed costs more efficiently, particularly advertising and sales pro-
motion expenses. In addition, we made huge strides in developing
and cultivating new beer-type beverage brands, among them Clear
Asahi and Asahi Style Free.
BREAKDOWn OF SALES/D/E RATIO*(%) (Times)
20052001 2002 2003 2004 2006 2007 2008 2009
2622 20 21 233329 30 30
0
25
75
50
0.50
0.75
1.00
1.25
100 1.50
67
78 80 79 77 74 71 70 70
0.68
1.081.04
0.84
0.73
0.640.61
0.650.58
Sales (Asahi Breweries, Ltd., non-consolidated; Left scale) Sales (Group companies; Left scale) D/E Ratio (Right scale)
Overview of the Third Medium-Term Management Plan
Greater-than-expected profit structure reform and successful global network expansion
From 2001 to 2009, the Asahi Breweries Group pursued a series
of three medium-term management plans. We implemented man-
agement reforms and strengthened our financial standing in order
to improve Group competitiveness, and conducted M&As to enable
us to shift to a profit structure that relies less on the alcoholic
beverages business and more on other areas.
In particular, we adhered to two main business policies under
the Third Medium-Term Management Plan as we strove to carve out
a new growth path for the Group. The first was to generate stable and
Roadmap of the Group’s Medium-Term Management Plans
2001–2003Implement management reforms and enhance financial standing to improve Group competitiveness
2004–2006Reform business and profit structure to achieve growth with profits
2007–2009Generate stable cash flows in the alcoholic beverages business, and establish a new growth track for the Group
Accomplishments•Reformedcorporategovernance
•Enhancedfinancialstanding,includingbyreducing financial debt
•StrengthenedbaseforGroupgrowth,including in the shochu, RTD beverages, whisky and spirits, and wine business
Accomplishments•Expandedbasefornext-generation
growth through M&As
•Improvedefficiencyby optimizing production and distribution frameworks
Accomplishments•Achievedgreater-than-expectedreformsofprofitstructure,
including efficiencies in fixed costs
•Expandedglobalnetworkinalcoholicbeveragesandsoft drinks businesses
•Strengthenedbasefordomesticsoftdrinksandfoodandpharma-ceuticals businesses and achieved dramatic growth in Chinese soft drinks business
Overview of the 1st through 3rd Medium-Term Management Plans
* An indicator that measures a company’s financial health (Ratio of financial debt to shareholders’ equity)
12 Our Strategies
At the same time, we enhanced and expanded our global net-
work during these three years. Along with the acquisition of
Schweppes Australia, a company poised for stable growth that has
the second-leading share of Australia’s soft drinks market, our suc-
cess came from investment in Tsingtao Brewery Company Limited
(Tsingtao Brewery). This company ranks second in terms of scale
of production and sales in China’s rapidly growing beer market.
In existing Group businesses as well, we managed to expand
the base for our next phase of growth. Not only did growth at Asahi
Soft Drinks Co., Ltd. surpass the industry average, but in food and
pharmaceuticals, we entered a capital and business alliance with
Amano Jitsugyo Co., Ltd., which possesses some of the best tech-
nological capabilities and manufacturing scale in Japan in the
field of freeze-dried foods. Meanwhile Tingyi-Asahi Beverages
Holding Co., Ltd. (Tingyi-Asahi Beverages), a soft drinks business
based in China that the Group has invested in since 2004, is
seeing growth far outpace the market growth rate thanks to pro-
duction technology, quality assurance and financial support pro-
vided by the Asahi Breweries Group.
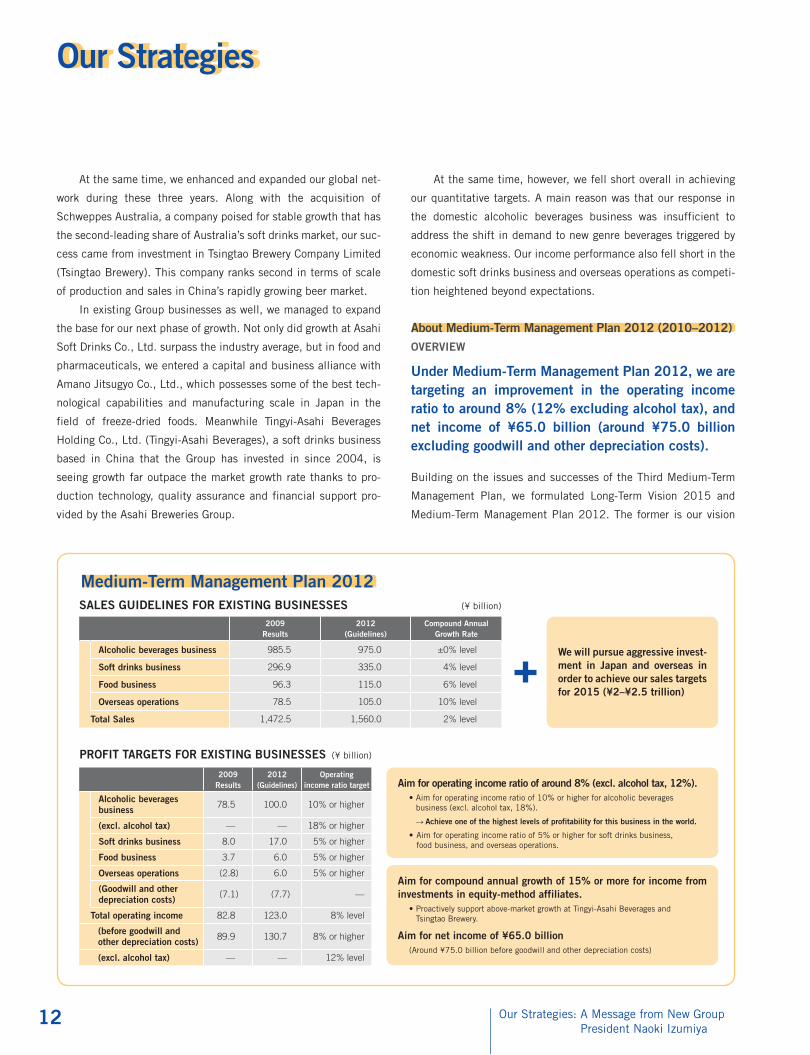
SALES GUIDELInES FOR ExISTInG BUSInESSES (¥ billion)
PROFIT TARGETS FOR ExISTInG BUSInESSES (¥ billion)
2009 Results
2012 (Guidelines)
Compound Annual Growth Rate
Alcoholic beverages business 985.5 975.0 ±0% level
Soft drinks business 296.9 335.0 4% level
Food business 96.3 115.0 6% level
Overseas operations 78.5 105.0 10% level
Total Sales 1,472.5 1,560.0 2% level
2009 Results
2012 (Guidelines)
Operating income ratio target
Alcoholic beverages business 78.5 100.0 10% or higher
(excl. alcohol tax) — — 18% or higher
Soft drinks business 8.0 17.0 5% or higher
Food business 3.7 6.0 5% or higher
Overseas operations (2.8) 6.0 5% or higher
(Goodwill and other depreciation costs) (7.1) (7.7) —
Total operating income 82.8 123.0 8% level
(before goodwill and other depreciation costs) 89.9 130.7 8% or higher
(excl. alcohol tax) — — 12% level
Aim for operating income ratio of around 8% (excl. alcohol tax, 12%).•Aimforoperatingincomeratioof10%orhigherforalcoholicbeverages business (excl. alcohol tax, 18%).
R Achieve one of the highest levels of profitability for this business in the world.
•Aimforoperatingincomeratioof5%orhigherforsoftdrinksbusiness, food business, and overseas operations.
Aim for compound annual growth of 15% or more for income from investments in equity-method affiliates.
•Proactivelysupportabove-marketgrowthatTingyi-AsahiBeveragesand Tsingtao Brewery.
Aim for net income of ¥65.0 billion (Around ¥75.0 billion before goodwill and other depreciation costs)
We will pursue aggressive invest-ment in Japan and overseas in order to achieve our sales targets for 2015 (¥2–¥2.5 trillion)
At the same time, however, we fell short overall in achieving
our quantitative targets. A main reason was that our response in
the domestic alcoholic beverages business was insufficient to
address the shift in demand to new genre beverages triggered by
economic weakness. Our income performance also fell short in the
domestic soft drinks business and overseas operations as competi-
tion heightened beyond expectations.
About Medium-Term Management Plan 2012 (2010–2012)OVERVIEW
Under Medium-Term Management Plan 2012, we are targeting an improvement in the operating income ratio to around 8% (12% excluding alcohol tax), and net income of ¥65.0 billion (around ¥75.0 billion excluding goodwill and other depreciation costs).
Building on the issues and successes of the Third Medium-Term
Management Plan, we formulated Long-Term Vision 2015 and
Medium-Term Management Plan 2012. The former is our vision
Medium-Term Management Plan 2012
: A Message from New Group President Naoki Izumiya

13
for the Asahi Breweries Group by 2015, taking into account a
maturing domestic market, growth in newly emerging markets,
global realignment among food companies, and other major
changes in the business environment. The new plan, for its part,
sets milestones on the road to achieving that vision in light of
those environmental changes. Under the new plan, improving the
profitability of existing businesses and strengthening business and
capital alliances in Japan and around the world are top priority
concerns, which we think will form a direct link to realizing Long-
Term Vision 2015.
In terms of quantitative targets, we do not anticipate growth
in the Japanese alcoholic beverages market, which is already
mature. Therefore, by aiming for steady growth in sales in each
company, we will work to achieve around 2% average growth over-
all. With this in mind, we are aiming to raise the operating income
ratio for the domestic alcoholic beverages industry to one of the
highest levels of profitability for this business in the world. We will
pursue similar increases in profitability in all Group businesses,
aiming for an overall operating income ratio* of around 8% (excl.
alcohol tax, 12%). We will also actively seek income from invest-
ments in equity-method affiliates, which includes income from
Tingyi-Asahi Beverages and Tsingtao Brewery, targeting compound
annual growth of 15% or higher.
By adhering to these initiatives, we are looking to post ¥65.0
billion in net income in 2012 (around ¥75.0 billion excluding goodwill
and other depreciation costs).
* Target operating income ratio for each business assume the adoption of International Financial Reporting Standards and exclude goodwill and other depreciation costs.
Operating Cash Flows + Asset Liquidation (Cumulative Total, 2010–2012) ¥360.0 billion or higher
Investments to strengthen the base for growth
Capital investments to strengthen the base for growth and enhance efficiency: approx. ¥100.0 billion
•Investmentsforconstructingoptimalproductionanddistributionframeworksandincreasing efficiencies in the soft drinks and food businesses
•Environmentalinvestmentsforalow-carbonsociety
Aggressively promote capital and business alliances•Makeuseoffinancialdebtforcapitaldemandsinexcessofinternalfunds(The Asahi Breweries Group considers an appropriate D/E ratio level to be about 0.7, with temporary increases acceptable)
Shareholder returns
Consolidated payout ratio: Continue payment of stable dividends with a consolidated payout ratio of 20% or more
Purchase of treasury stock: Consider purchase of treasury stock as capital demands and financial soundness permit
R Prioritize business investment and aim for shareholder returns through higher share prices
Cash Flow Allocation Guidelines R Allocate flexibly taking into account management and operating conditions
ROE target: Maintain current level of around 9%
Financial and Cash Flow Policies

20052001 2002 2003 2004 2006 2007 2008 2009
10.08.4 8.6 6.8
13.015.0
9.86.6 6.5 6.4 7.3 8.2 9.0 9.0 9.3
47.6
13.614.8
23.2
30.6
39.944.8 44.8 45.0
0
20
40
60
14 Our Strategies
FInAnCIAL AnD CASH FLOW STRATEGIES AnD
CAPITAL- BUSInESS ALLIAnCES
Allocating cash flows to business investments for growth and improving profitability are our highest priorities.
One objective under Medium-Term Management Plan 2012 is to
generate cash flows of at least ¥360.0 billion from a combination
of operating cash flows and asset securitization. As with the Third
EPS ¥27.0 ¥28.9 ¥46.8 ¥62.5 ¥82.2 ¥94.0 ¥94.9 ¥96.3 ¥102.5
Dividend per share ¥13.0 ¥13.0 ¥13.0 ¥15.0 ¥17.0 ¥19.0 ¥19.0 ¥20.0 ¥21.0
Dividend payout ratio 48.1% 45.0% 27.8% 24.0% 20.7% 20.2% 20.0% 20.8% 20.5%
Total Dividends Share Buybacks Net Income
Medium-Term Management Plan, our allocation policy will give
highest priority to business investments that strengthen our base
for growth. In terms of specifics, we will allot around ¥100.0 billion
to capital investments. These will consist mainly of investments to
enhance efficiency in existing businesses and environmental invest-
ments. We hope to use additional funds to promote capital and
business alliances both domestically and overseas in order to stake
claim to new growth bases. We intend to also explore the option of
making flexible use of financial debt.* This will allow us to cope
with any temporary capital demands or other large-scale invest-
ment needs that may arise as we prioritize investments. As for ROE,
given the current instability in the economic environment, we will
strive to maintain our current level of around 9%, recognizing the
importance of balancing improved profitability with robust share-
holders’ equity.
Where shareholder returns are concerned, as in previous
years, we remain committed to the payment of a stable dividend,
with a consolidated payout ratio of 20% or more. Also, as our capi-
tal demands and financial soundness permit, we will consider
additional purchases of treasury stock. However, since business
investment for growth is our top-priority policy during the medium-
term plan, we want to meet shareholder expectations by delivering
improved performance enabled through business investment.
(Billions of yen)
net Income and Total Dividends
: A Message from New Group President Naoki Izumiya
15
Regarding capital and business alliances, on the domestic
side, our priority is the soft drinks and food businesses. Here, we
are seeking alliances that will enhance competitiveness by, for
example, complementing brands and sales channels. Outside
Japan, our focus is on both the alcoholic beverages and soft drinks
businesses, specifically in the Asia and Oceania region. Our ambi-
tions there are to develop alliances with long-term business part-
ners, and to take opportunities to expand our global network.
* The Asahi Breweries Group considers an appropriate D/E ratio level to be about 0.7.
STRATEGIES BY BUSInESS
Improving profitability is our most pressing concern for all Group businesses.
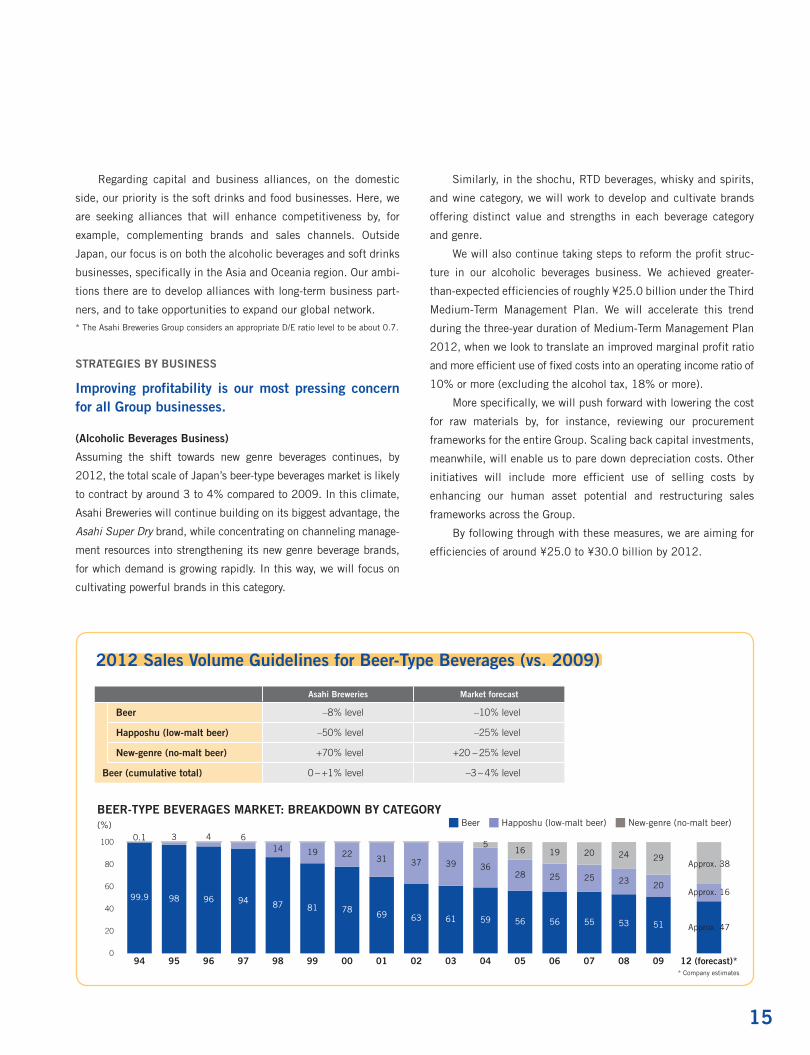
(Alcoholic Beverages Business)
Assuming the shift towards new genre beverages continues, by
2012, the total scale of Japan’s beer-type beverages market is likely
to contract by around 3 to 4% compared to 2009. In this climate,
Asahi Breweries will continue building on its biggest advantage, the
Asahi Super Dry brand, while concentrating on channeling manage-
ment resources into strengthening its new genre beverage brands,
for which demand is growing rapidly. In this way, we will focus on
cultivating powerful brands in this category.
Asahi Breweries Market forecast
Beer –8% level –10% level
Happoshu (low-malt beer) –50% level –25% level
new-genre (no-malt beer) +70% level +20 – 25% level
Beer (cumulative total) 0 – +1% level –3 – 4% level
BEER-TYPE BEVERAGES MARKET: BREAKDOWn BY CATEGORY(%) Beer Happoshu (low-malt beer) New-genre (no-malt beer)
Similarly, in the shochu, RTD beverages, whisky and spirits,
and wine category, we will work to develop and cultivate brands
offering distinct value and strengths in each beverage category
and genre.
We will also continue taking steps to reform the profit struc-
ture in our alcoholic beverages business. We achieved greater-
than-expected efficiencies of roughly ¥25.0 billion under the Third
Medium-Term Management Plan. We will accelerate this trend
during the three-year duration of Medium-Term Management Plan
2012, when we look to translate an improved marginal profit ratio
and more efficient use of fixed costs into an operating income ratio of
10% or more (excluding the alcohol tax, 18% or more).
More specifically, we will push forward with lowering the cost
for raw materials by, for instance, reviewing our procurement
frameworks for the entire Group. Scaling back capital investments,
meanwhile, will enable us to pare down depreciation costs. Other
initiatives will include more efficient use of selling costs by
enhancing our human asset potential and restructuring sales
frameworks across the Group.
By following through with these measures, we are aiming for
efficiencies of around ¥25.0 to ¥30.0 billion by 2012.
94 95 96 97 98 99 00 01 02 03 04 05 06 07 08 09
29
99.9 98 96 94 87 81 78 69 63 61 59 56 56 55 53 51
0.1 3 4 614 19 22 31 37 39 36
28 25 25 23 20
Approx. 38
Approx. 47
Approx. 16
12 (forecast)*
516 19 20 24
0
20
40
60
80
100
2012 Sales Volume Guidelines for Beer-Type Beverages (vs. 2009)
* Company estimates

16 Our Strategies
Tingyi-Asahi Beverages Holding Co., Ltd.Baltika Breweries (Russia)
Boon Rawd Brewery Co, Ltd. (Thailand)
Molson Coors Brewing Company (Canada)
Shepherd Neame Ltd. (U.K.)
Staropramen Brewery (Czech Republic)
Tsingtao Brewery Company Limited
Beijing Beer Asahi Co., Ltd.
Yantai Beer Tsingtao Asahi Co., Ltd.
Hangzhou Xihu Beer Asahi Co., Ltd.
Shenzhen Tsingtao Beer Asahi Co., Ltd.
40%
20%
73%
Haitai Beverage Co., Ltd. 58%
Schweppes Australia Pty Ltd. 100%
51%
55%
29%
No. 2 soft drinks company in China
No. 2 beer company in China
No. 2 soft drinks company in Australia
No. 3 soft drinks company in South Korea
(Soft Drinks Business)
In the soft drinks business in Japan, with many industry players and
an increasingly severe competitive environment, the struggle for
who will emerge on top is expected to only intensify going forward.
Our policy in this environment is to promote business and
capital alliances that spur industry realignment. The growth strate-
gies and improved profitability of Asahi Soft Drinks, as the core
driver of these efforts, will be vital to realizing this goal.
With the market scale in 2012 projected to be virtually at the
same level as today, Asahi Soft Drinks Co., Ltd. will strengthen
core brands, develop new ones, and expand the number of vending
machines in operation, to achieve compound annual growth of
around 4%.
As for profit structure reform, our sights are on an operating
income ratio of 5% or more in 2012, by continuing to raise the percent-
age of PET bottles produced in-house and using sales promotion
expenses more efficiently.
(Food Business*)
In the food business, Asahi Food & Healthcare Co., Ltd., Wakodo
Co., Ltd. and Amano Jitsugyo Co., Ltd. are the Group’s key operating
companies. Each company, while striving to strengthen brands in
the categories where each has a respective advantage, will capitalize
on Group synergies to propose high-added-value products to cus-
tomers across a broad spectrum of age ranges.
Furthermore, by promoting greater efficiency in total SCM for
the entire Group, our goal is achieve an overall operating income
ratio of 5% or more for this business in 2012.
We will look to expand the base for our next stage of growth by
aggressively tackling new business domains, including a natural
seasonings business utilizing yeast extracts and other ingredients,
and overseas expansion in baby foods, one of our strong categories
in this business.
* As part of the formulation “Long-Term Vision 2015” and “Medium-Term Manage-ment Plan 2012,” the Group’s food and pharmaceuticals operation was renamed the “food business.”
(Overseas Operations)
Turning to overseas operations, in our beer business in China, we
acquired a stake in and concluded a capital and business alliance
with Tsingtao Brewery. Last year marked a decade of trust building
between our companies, and in Tsingtao Brewery we have now
gained a powerful partner in the Chinese market. One outcome of
Investment in Beer Manufacturer
Investment in Soft Drinks Manufacturer
Production Base
Equity Investment
Ownership Interest
Overseas Business and Capital Alliances(As of April 30, 2010)
: A Message from New Group President Naoki Izumiya

17
this change is improved earnings for existing businesses thanks to
production- and sales-side alliances with this partner. At the same
time, the ability to support the growth of Tsingtao Brewery itself in
a wide variety of ways will allow the Group to incorporate ongoing
growth in the Chinese market.
One goal for the future is to leverage Tsingtao Brewery’s net-
work of production and sales bases to promote the Asahi brand
across China. In regions beyond China, too, we are looking to raise
the value of the Asahi brand through alliances and production
licensing with powerful partners in each market. Our ambition here
is clear—to become the No. 1 Asian premium brand.
In the overseas soft drinks business, Schweppes Australia,
which we acquired in April 2009, was off to a great start in its first
year of consolidation. Through brand cultivation and development
of new channels going forward, we are aiming for a compound
annual growth rate of 5%. This is in addition to an operating
income ratio for 2012 of around 8% from improved efficiency
gained by leveraging expertise possessed by the Group.
Turning to Haitai Beverage Co., Ltd. in South Korea, while
profit structure reform is proceeding apace, sales recovery in main-
stay brands has been slow. Together with enacting additional profit
structure reform, we hope to stage a recovery in sales through more
vigorous marketing investment in core brands, to mount a return to
profitability as quickly as possible.
Tingyi-Asahi Beverages, meanwhile, continues to perform
strongly amid increasingly bold attacks from major competitors.
This resilience owes to a level of cost competitiveness that is
second to none. Bolstering our support structure will remain a
focus going forward, to help Tingyi-Asahi Beverages continue striv-
ing to be China’s No. 1 soft drinks company.
As these proposed measures suggest, we remain committed in
overseas operations to building a rock-solid network in Asia and
Oceania. Once this network is developed, we intend to take full
advantage of it to further enhance profitability.
CSR
We are moving proactively to create social value.
In closing, let me say a few words about CSR. Under Medium-Term
Management Plan 2012, the activities that the Asahi Breweries
Group should pursue in terms of CSR are divided into three stages.
In Stage 1, “Foundations as a Company,” our task is to lay the
foundations that become the basis for corporate activities. Stage 2
is “Meet Expectations” and Stage 3, “Create Value,” exhorts us to
create social value.
Going forward, Asahi Breweries Group activities will increas-
ingly take place on a global stage. As such, the stakeholders with
whom we are connected with will also grow dramatically. As one
might imagine, in this situation, we will continue to reinforce our
“Foundations as a Company,” particularly highly transparent gov-
ernance, proper information disclosure, and compliance. From
this firm foundation, every Group officer and employee will proac-
tively address themes vital to our society. These range from contri-
butions to the creation of local culture, to CSR procurement and
efforts to stamp out problem drinking.
The business of the Asahi Breweries Group revolves around
harnessing water, grains, and other natural resources. In March,
we established the Environmental Vision 2020 and the Statement
on Biodiversity, plans for coexisting with the global environment so
that we can pass it along in good condition to the next generation.
The Group as a whole is also working on a number of environmen-
tal initiatives. (For more details on Environmental Vision 2020 and
the Statement on Biodiversity, please refer to page 47.)
Without question, the environment in which the Asahi Breweries
Group finds itself is a challenging one. With that said, however, I
am sure that we have accurately assessed the environment, and
based on that assessment we will pursue measures that play to the
Group’s capabilities. In the process, input from our shareholders,
investors and other stakeholders will always be more than wel-
come, since we believe that reflecting this feedback in how we
manage will be critical to achieving real growth.

18 Our Strategies
Asahi at a Glance The Asahi Breweries Group’s four business segments, as represented in consolidated accounting, are alcoholic beverages, soft drinks, food, and
other businesses. In each business segment, the entities that generate major profits are: Asahi Breweries, Ltd. for the alcoholic beverages busi-
ness; Asahi Soft Drinks Co., Ltd. for the soft drinks business; and Asahi Food & Healthcare Co., Ltd. and Wakodo Co., Ltd. for the food business.
Review of Operations
958.2
65.1%
1,012.3 995.7
2007 2008 20090
300
600
900
1,200
66.84.5%
85.0
71.1
2007 2008 20090
20
40
100
80
600.9
1.1%
1.7
1.0
2007 2008 20090
0.5
1.0
2.0
1.5
355.2
24.1%
299.7316.7
2007 2008 20090
100
200
300
400
92.4
6.3%67.1
79.2
2007 2008 20090
20
40
60
100
80
0.7
0.8%
4.6
0.6
2007 2008 20090
1
2
3
4
5
2.7
3.3%
1.3
1.9
2007 2008 20090
1
2
3
ALCOHOLIC BEVERAGES
SOFT DRInKS
net Sales (¥ billion) Operating Income (¥ billion)
FOOD
OTHERS
78.9
95.3%
79.3
90.8
2007 2008 20090
20
40
60
100
80
: Review of Operations Asahi at a Glance

19
In our other businesses, we undertake Group company support operations such as logistics and sales support businesses and operation of restaurants.
In 2009, sales and operating income both declined as a result of reorganization of our wholesale business and other factors.
n Share of the domestic beer market*1 surpassed 50% for the second year in a row
n Taxable shipment volume of Asahi Style Free rose year-on-year even amid overall market contraction
n Expanded market share by introducing Asahi Off and Asahi Mugi Shibori in addition to Clear Asahi
n Acquired shares of China’s Tsingtao Brewery Company Limited (Tsingtao Brewery) and built a strong partnership
n Boosted presence of Asahi Super Dry, mainly in Asia
n WONDA brand coffee achieved a fifth consec-utive year of higher sales volume and captured No. 3 market share in coffee
n Mitsuya Cider brand sales volume rose for a sixth consecutive year, to over 37 million cases annually*2
n In the Chinese soft drinks business, Tingyi-Asahi Beverages Holding Co., Ltd. (Tingyi-Asahi Beverages) achieved steady growth
n Schweppes Australia saw strong performance from mainstay brands and new brands alike
n Asahi Food & Healthcare Co., Ltd., Wakodo Co., Ltd. and Amano Jitsugyo Co., Ltd. all expanded profits
n Harnessed Group synergies to launch a sea-sonings business
n Asahi Breweries, Ltd.
n The Nikka Whisky Distilling Co., Ltd.
n Sainte Neige Wine Co., Ltd.
n Satsumatsukasa Shuzo Co., Ltd.
n Beijing Beer Asahi Co., Ltd.
n Tsingtao Brewery Co., Ltd.
n Asahi Soft Drinks Co., Ltd.
n LB Co., Ltd. (Tokyo)
n LB Co., Ltd. (Nagoya)
n Haitai Beverage Co., Ltd.
n Schweppes Australia Pty Ltd.
n Tingyi-Asahi Beverages Holdings Co., Ltd. (Equity Method Affiliate)
n Asahi Food & Healthcare Co., Ltd.
n Wakodo Co., Ltd.
n Amano Jitsugyo Co., Ltd.
n Aim for net sales of ¥941.0 billion (down 1.8% year on year) and operating income of ¥86.5 billion (up 9.7% year on year).
n Strengthen brand power of Asahi Super Dry and target latent users
n Aim to make Asahi Style Free the top brand in the low-carbo-hydrate beverage category
n Introduce Asahi Strong Off, a new value-added product in the new-genre beverages category, which is expected to grow
n Aim to improve the profitability of the Chinese beer business in partnership with Tsingtao Brewery
n Aim for net sales of ¥389.0 billion (up 9.5% year on year) and operating income of ¥5.2 billion (up by a factor of 7.4 year on year).
n Actively develop zero-carbohydrate Health Facts and product proposals based on the concept of good taste and health
n Further promote creation of an optimal production framework linked throughout the Group to enhance cost competitiveness
n Harness synergies with Schweppes Australia to strengthen our foundation for growth and improve profitability
n Strengthen across-the-board support for Tingyi-Asahi Bever-ages with the aim of making it China’s number-one soft drinks manufacturer
n Aim for net sales of ¥99.0 billion (up 7.1% year on year) and operating income of ¥3.7 billion (up 34.8% year on year)
n Further strengthen core brands and synergies between operat-ing companies
n Aim to raise operating income ratio by pursuing greater SCM efficiency for the business as a whole
Major Group Companies (including affiliates) 2009 Highlights Plans for 2010
*1 Refer to inside front cover for details on beer-type beverage categories (beer, happoshu, and new genre beverages). *2 For the purpose of sales volume, a case is calculated as a case of product ready for shipment.

20 Our Strategies20
Alcoholic Beverages Business
l Improve market position of mainstay brands
l Strengthen business base through further profit structure reforms
l Research and develop new products that provide differentiated value
l Restructure product portfolio
l Optimize manufacturing capabilities and internal structure in light of market changes
l Cultivated and enhanced brands
Share of domestic beer category
2007
49.4%
2009
50.6%
Sales volume for Asahi Style Free
2007
8.3 million cases
2008
11.72 million cases
Sales volume for Clear Asahi
2008 Launched
2009
19.33 million cases
l Advanced profit structure reform Exceeded targets through optimal production and distribution frameworks
and increasing efficiency of fixed costs.
Refer to pages 34–37 for details of activities in the overseas operations.Refer to inside front cover for details on beer-type beverage categories (beer, happoshu, and new genre beverages).
Results of the Third Medium-Term Management Plan
Future Topics
: Alcoholic Beverages Business
21
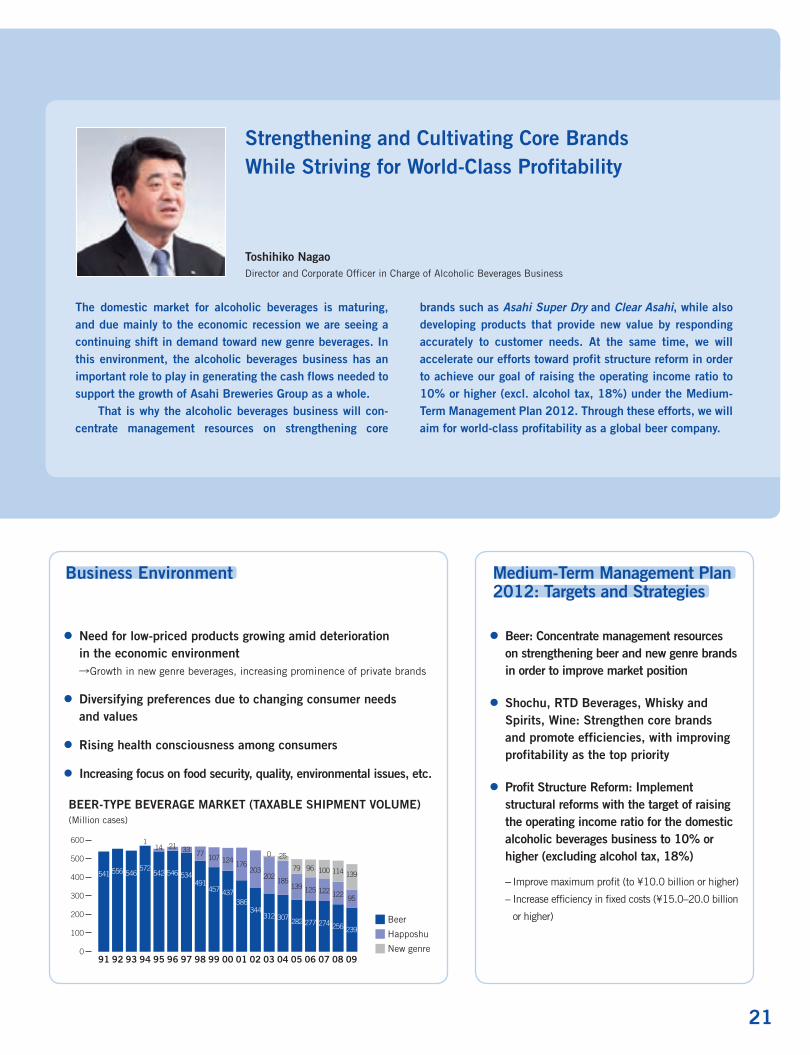
The domestic market for alcoholic beverages is maturing, and due mainly to the economic recession we are seeing a continuing shift in demand toward new genre beverages. In this environment, the alcoholic beverages business has an important role to play in generating the cash flows needed to support the growth of Asahi Breweries Group as a whole.
That is why the alcoholic beverages business will con-centrate management resources on strengthening core
brands such as Asahi Super Dry and Clear Asahi, while also developing products that provide new value by responding accurately to customer needs. At the same time, we will accelerate our efforts toward profit structure reform in order to achieve our goal of raising the operating income ratio to 10% or higher (excl. alcohol tax, 18%) under the Medium-Term Management Plan 2012. Through these efforts, we will aim for world-class profitability as a global beer company.
Strengthening and Cultivating Core Brands While Striving for World-Class Profitability
Toshihiko nagaoDirector and Corporate Officer in Charge of Alcoholic Beverages Business
l need for low-priced products growing amid deterioration in the economic environment
RGrowth in new genre beverages, increasing prominence of private brands
l Diversifying preferences due to changing consumer needs and values
l Rising health consciousness among consumers
l Increasing focus on food security, quality, environmental issues, etc.
l Beer: Concentrate management resources on strengthening beer and new genre brands in order to improve market position
l Shochu, RTD Beverages, Whisky and Spirits, Wine: Strengthen core brands and promote efficiencies, with improving profitability as the top priority
l Profit Structure Reform: Implement structural reforms with the target of raising the operating income ratio for the domestic alcoholic beverages business to 10% or higher (excluding alcohol tax, 18%)
– Improve maximum profit (to ¥10.0 billion or higher)
– Increase efficiency in fixed costs (¥15.0–20.0 billion
or higher)
0
200
100
300
400
500
600
91 92 93 94 95 96 97 98 99 00 01 02 03 04 05 06 07 08 09
139541 556 546572
542 546 534491
457 437386
344312 307 282 277 274 256 239
114 21 33 77 107 124 176
203202
185139 125 122 122 95
0 25
79 96 100 114
BEER-TYPE BEVERAGE MARKET (TAxABLE SHIPMEnT VOLUME)(Million cases)
Beer
Happoshu
New genre
Business Environment Medium-Term Management Plan 2012: Targets and Strategies
22 Our Strategies22
Asahi Style Free
2009 BUSInESS OVERVIEWMarket EnvironmentJapan’s alcoholic beverages industry continued to confront accelerat-
ing market changes in 2009, including a decline in the drinking-age
population and changing consumer tastes, as well as realignment in
the distribution sector and growth in private brand products. In addi-
tion, beer-type beverages saw substantial growth in new genre bever-
ages (up 21.4% year on year), owing primarily to more stringent
belt-tightening among consumers due to poor economic conditions. In
contrast, shipment volumes for beer and happoshu declined by 6.7%
and 15.6%, respectively. As a result, overall taxable shipment
volume was 2.1% lower year on year. By category, beer was 50.6%,
happoshu 20.1%, and new genre beverages 29.3% of the beer-type
beverages market.
Shipment volume in alcoholic beverages other than beer-type was
largely unchanged for the year, despite revitalized growth in the whisky
and spirits market, as the market has reached saturation.
Initiatives in 2009The Asahi Breweries Group worked to cultivate and enhance its brands
with product proposals and sales promotion activities tailored to cus-
tomer needs. At the same time, we took steps to establish a profit
structure capable of withstanding market volatility by constructing opti-
mal production and distribution frameworks, and utilizing advertising
and sales promotion expenses more efficiently. These efforts, however,
were negatively impacted by several factors, including lower sales vol-
umes for beer-type beverages, reflecting weak economic conditions and
unstable weather during the summer months, as well as amendments
to Japan’s tax system and changes in accounting standards. As a result,
total sales for the alcoholic beverages business, including overseas
operations, were ¥958.2 billion, down 3.8% year on year, with operat-
ing income down 13.1% to ¥78.9 billion for the same period.
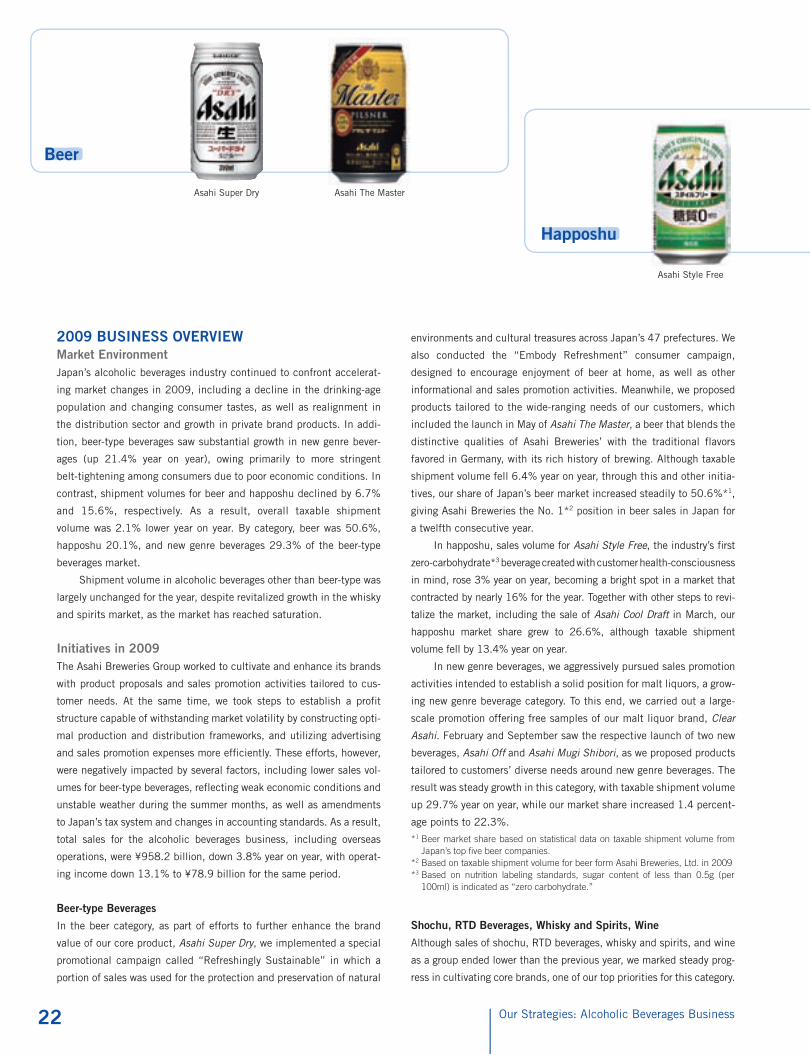
Beer-type Beverages
In the beer category, as part of efforts to further enhance the brand
value of our core product, Asahi Super Dry, we implemented a special
promotional campaign called “Refreshingly Sustainable” in which a
portion of sales was used for the protection and preservation of natural
environments and cultural treasures across Japan’s 47 prefectures. We
also conducted the “Embody Refreshment” consumer campaign,
designed to encourage enjoyment of beer at home, as well as other
informational and sales promotion activities. Meanwhile, we proposed
products tailored to the wide-ranging needs of our customers, which
included the launch in May of Asahi The Master, a beer that blends the
distinctive qualities of Asahi Breweries’ with the traditional flavors
favored in Germany, with its rich history of brewing. Although taxable
shipment volume fell 6.4% year on year, through this and other initia-
tives, our share of Japan’s beer market increased steadily to 50.6%*1,
giving Asahi Breweries the No. 1*2 position in beer sales in Japan for
a twelfth consecutive year.
In happoshu, sales volume for Asahi Style Free, the industry’s first
zero-carbohydrate*3 beverage created with customer health- consciousness
in mind, rose 3% year on year, becoming a bright spot in a market that
contracted by nearly 16% for the year. Together with other steps to revi-
talize the market, including the sale of Asahi Cool Draft in March, our
happoshu market share grew to 26.6%, although taxable shipment
volume fell by 13.4% year on year.
In new genre beverages, we aggressively pursued sales promotion
activities intended to establish a solid position for malt liquors, a grow-
ing new genre beverage category. To this end, we carried out a large-
scale promotion offering free samples of our malt liquor brand, Clear
Asahi. February and September saw the respective launch of two new
beverages, Asahi Off and Asahi Mugi Shibori, as we proposed products
tailored to customers’ diverse needs around new genre beverages. The
result was steady growth in this category, with taxable shipment volume
up 29.7% year on year, while our market share increased 1.4 percent-
age points to 22.3%.
*1 Beer market share based on statistical data on taxable shipment volume from Japan’s top five beer companies.
*2 Based on taxable shipment volume for beer form Asahi Breweries, Ltd. in 2009*3 Based on nutrition labeling standards, sugar content of less than 0.5g (per
100ml) is indicated as “zero carbohydrate.”
Shochu, RTD Beverages, Whisky and Spirits, Wine
Although sales of shochu, RTD beverages, whisky and spirits, and wine
as a group ended lower than the previous year, we marked steady prog-
ress in cultivating core brands, one of our top priorities for this category.
Asahi Super Dry Asahi The Master
: Alcoholic Beverages Business
Beer
Happoshu

23
The profit margin, meanwhile, improved over initial estimates, to nearly
6%, thanks largely to more efficient use of sales promotion expenses.
In shochu, we conducted vigorous sales promotion activities tar-
geting core brands Kanoka and Satsuma Tsukasa, in a bid to fortify our
position in the strong-selling Ko- and Otsu-type shochu blend and
potato shochu markets. These efforts yielded steady success, culmi-
nating in year-on-year growth for Kanoka on a sales volume and mon-
etary basis for a sixteenth consecutive year.
In RTD beverages, along with adding Asahi Slat to our mainstay
Asahi Cocktail Partner and Asahi Shunka Shibori brands, we worked to
Clear Asahi Asahi Off Asahi Mugi Shibori Asahi Strong Off
propose a broad lineup of products to meet customer needs. Asahi
Slat, launched in February 2009, has proven a hit for its juicy taste
with real fruit pulp while remaining a very low-calorie beverage*4. As a
result, the product continues to sell strongly, having already exceeded
initial targets.
In whisky and spirits, brisk sales of core brand Black Nikka Clear
Blend continued, leading to year-on-year growth for a third consecutive
year. The quality of the Nikka brand, moreover, was recognized on the
world stage when Taketsuru 21 Years Old was named “World’s Best
Blended Malt Whisky” at the World Whiskies Awards*5 in April 2009,
Beer (Including overseas operations)
66.8%
Shochu, RTD beverages, Whisky and Spirits, Wine
12.7%
New genre (Malt-type)
10.5%Happoshu
9.9%Beer-type Beverages
87.3%
* Excludes sales from real estate and other
SHARE OF SALES BY PRODUCT (2009)
Sales Operating income
Shochu RTD (Low-alcohol) Whisky and Spirits
Wine Operating income ratio
Total beer-type beverages Beer Happoshu
New genre beverages
ALCOHOLIC BEVERAGES SALES AnD OPERATInG InCOME (InCL. OVERSEAS OPERATIOnS)(¥ billion)
nET SALES FOR SHOCHU, RTD BEVERAGES, WHISKY AnD SPIRITS, WInE AnD OPERATInG InCOME RATIO(¥ billion)
06 07 08 09 10(target)
27.4
57.2
32.7
27.3
54.9
35.7
27.5
52.7
31.4
25.9
50.3
30.6
25.8
15.1 15.3 14.8
12.4
6%6%5%4%2%
12.0
48.0
31.9
0
40
80
120
160
SHARE BY BEER-TYPE BEVERAGE CATEGORY (ASAHI BREWERIES, LTD.)(%)
94 95 96 97 98 99 00 01 02 03 04 05 06 07 08 090
10
20
30
40
50
60
22.3%
37.5%
50.6%
26.6%
941.0995.7 958.2
2008 2009 2010(target)
86.590.8
78.9
2008 2009 2010(target)
0
200
400
600
800
1,000
0
20
40
60
80
100
new genre (Malt-type)

24 Our Strategies
and received the highest honor in the whisky category at the Interna-
tional Spirits Challenge*6 in October.
In wine, we revamped our Antioxidant-Free Organic Wine series of
domestic wines to further groom the Sainte Neige brand. For imported
wines, along with handling the Lanson champagne brand for the first
time, we strove to expand sales through more robust brand appeal and
a diverse product lineup centered on key brands like Baron Philippe de
Rothschild and Maison Louis Latour.
*4 Based on comparison with products sold in the can chu-hi market as of December 2009.
*5 An international competition focused exclusively on whisky, chiefly sponsored by U.K.-based Whisky Magazine.
*6 An international competition covering the full range of spirits, chiefly sponsored by Drinks International, an exclusive publisher of alcoholic beverage-related material based in the U.K.
PLAnS AnD STRATEGIES FOR 2010Sales Plan for the Alcoholic Beverages Business in 2010Faced with ongoing market contraction and realignment of the industry
in Japan and overseas, the alcoholic beverages industry is likely to con-
tinue to confront a severe environment characterized by major restruc-
turing both domestically and internationally. Despite this climate, we
will marshal Group management resources in a drive to cultivate and
enhance top brands in each category. At the same time, we are deter-
mined to successfully achieve the top priority of our Medium-Term
Management Plan 2012—improving the profitability of existing busi-
nesses—and push forward with profit structure reform. Consequently,
the Group is targeting sales of ¥941.0 billion (down 1.8% year on year)
and operating income of ¥86.5 billion (up 9.7% year on year).
Beer-type BeveragesThe market for beer-type beverages in 2010 is predicted to contract
between 1 and 2%, with the ongoing shift in demand away from the beer
and happoshu categories towards new genre beverages projected to con-
tinue. Still further growth is also likely for some time in low- carbohydrate
beverages and other products that meet needs around customer health
consciousness. The Group is responding readily to these customer
trends, with the goal of tying these efforts to future growth.
Three policies will shape initiatives in this area—uncover poten-
tial beer demand; respond more robustly to zero- and low-carbohydrate
beverage needs; and propose new value in the diversifying range of
new genre beverages. To this end, we are targeting total taxable ship-
ment volume of 176 million cases, down 0.6% year on year.
Beer
In the beer category, the overall market is expected to decline between
5 to 6% due to the impact of economic weakness in Japan. In this cli-
mate, the Asahi Breweries Group will focus on “uncovering potential
beer demand” to frame our initiatives, working to expand Asahi brand
presence even in a contracting market. Specifically, in Asahi Super Dry,
while to date we have focused mainly on marketing activities designed
to heighten brand loyalty among an existing base of mainstay custom-
ers, going forward we intend to strengthen the targeting of entry cus-
tomers from a wider range of generations, particularly those of younger
drinking ages. In February 2010, the Asahi Group served as a Japan
Olympic Committee “Gold Partner” for the Winter Olympic Games in
Vancouver, pursuing ad campaigns featuring Olympic athletes and vari-
ous other promotions to stimulate demand. This year, the Company will
continue to promote the “Refreshingly Sustainable” campaign, which
earned a good reception when it was run in spring and fall of 2009.
In targeting other potential customers, we are planning a series
of ad campaigns that persuasively underscore the inherent value of
the Asahi Super Dry brand as a sophisticated and masculine beer. At
the same time, we seek to propose the new “extra cold” style of drink-
ing to uncover potential beer demand in the commercial- and home-
use sectors.
Happoshu
The overall happoshu market is projected to decline by between 12
and 14%, reflecting a shift in demand away from standard-type hap-
poshu towards new genre beverages. The Group achieved record-high
sales last year, and will continue to promote the strong-performing
Asahi Style Free in advertising and sales promotions, with the goal of
further cultivating the brand.
new Genre Beverages
The market for new genre beverages is expected to grow between 11 and
13% overall. The entire Group will concentrate on this category, with
Asahi Slat
Kanoka Satsuma Tsukasa
Asahi Cocktail Partner
: Alcoholic Beverages Business
Shochu
RTD beverages

25
initiatives led by a commitment to “propose new value in the diversifying
range of new genre beverages.” First in malt-type new genre beverages,
our top priority is to reinforce the Clear Asahi brand, ranked No. 1 in sales
for a second consecutive year. Specifically, beginning with the late January
2010 production run we enacted quality improvements, changed the
package design and enhanced its thirst-quenching qualities. At the
same time, we plan to launch the Asahi Breweries Group’s largest-ever
television ad campaign for new genre beverages in a drive to boost
brand value.
In March we launched sales of Asahi Strong Off, a product that
answers the needs of more frequent consumers. The added value of
this beverage includes its higher alcohol content and a crisper taste
thanks to its lower level of carbohydrates.
As for Asahi Off, the No. 1 newly launched brand in the beer-type
beverages market in 2009, we will enhance product quality and pack-
aging beginning late January. Going forward we will highlight more
vigorously the two distinct properties of this beverage in order to raise
satisfaction among existing customers and encourage potential cus-
tomers to try the product.
Shochu, RTD Beverages, Whisky and Spirits, WineProfit margins are projected to be largely flat across shochu, RTD bev-
erages, whisky and spirits, and wine, mainly reflecting lower sales and
greater investment in low-alcohol beverage brands. We will continue
channeling resources into cultivating core brands that offer unique
value and advantages, and promote further structural reform by
enhancing cost competitiveness.
Profit Structure ReformImproving the profitability of existing businesses is the top priority
issue of the Group’s newly announced Medium-Term Management
Plan 2012.
In terms of profit structure reform for the domestic alcoholic bev-
erages business, our policy is to gain efficiencies totaling ¥25 to ¥30
billion between 2010 to 2012, and raise the operating income ratio
excluding the liquor tax in the alcoholic beverages business to 18% or
more. In the first year, 2010, our goal is to reduce total costs by
roughly ¥11 billion through reductions in costs for raw materials,
including benefits from falling market prices for imported malt, and by
promoting efforts to minimize fixed costs across the board.
As we press ahead over the three-year period with more efficient
utilization of the portion of advertising and sales promotion expenses
allocated to the commercial-use sector, we hope to expand investment
for fostering and strengthening strong brands. In 2010, assuming the
bulk of expenses will go toward new genre beverages, efficiencies
should total around ¥1 billion. That said, we will strive to flexibly
manage the situation by keeping a close watch on sales trends and
other factors.
Taketsuru Black Nikka Clear Blend
Sankaboshizai-Mutenka Wine
Mouton-Cadet
SALES PLAn AnD ACTUAL RESULTS BY ALCOHOLIC BEVERAGES CATEGORY (ASAHI BREWERIES, LTD.)(¥ billion)
2009 2008 Year-on-year % of Total 2010 Target Year-on-year % of Total
Beer-type beverages (total) 844.3 873.5 –3.3% 87.3% 827.3 –2.0% 87.1%
Beer 646.5 685.7 –5.7% 66.8% 614.7 –4.9% 64.8%
Happoshu 96.2 110.3 –12.8% 9.9% 76.9 –20.1% 8.1%
New genre 101.6 77.5 +31.1% 10.5% 135.7 +33.6% 14.3%
Beverages other than beer-type beverages (total) 123.1 129.7 –5.1% 12.7% 122.0 –0.9% 12.9%
Shochu 50.3 52.7 –4.6% 5.2% 48.0 –4.5% 5.1%
RTD 30.6 31.4 –2.7% 3.2% 31.9 +4.4% 3.4%
Whisky and spirits 26.0 27.5 –5.5% 2.7% 25.8 –0.8% 2.7%
Wine 12.4 14.8 –16.3% 1.3% 12.0 –3.4% 1.3%
Other 3.9 3.2 +19.8% 0.4% 4.3 +10.9% 0.5%
Total 967.5 1,003.1 –3.6% 100% 949.3 –1.9% 100%Excludes sales from real estate and other businesses
Whisky and Spirits
Wine
26 Our Strategies
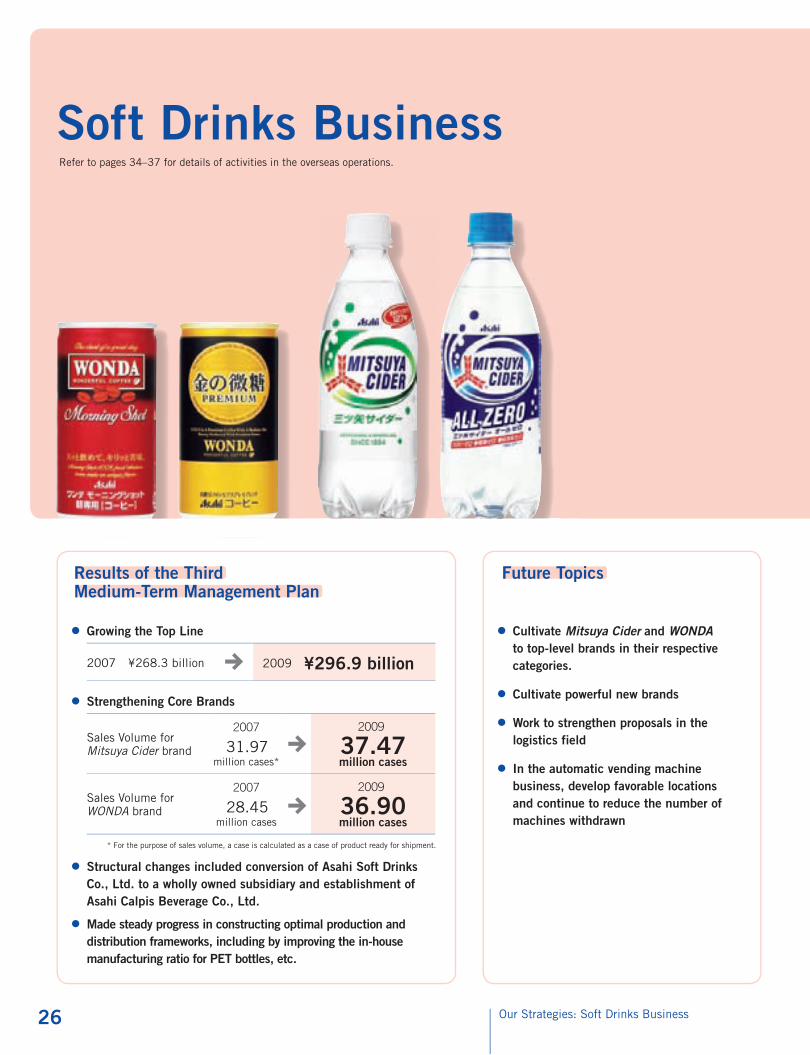
l Cultivate Mitsuya Cider and WONDA to top-level brands in their respective categories.
l Cultivate powerful new brands
l Work to strengthen proposals in the logistics field
l In the automatic vending machine business, develop favorable locations and continue to reduce the number of machines withdrawn
l Growing the Top Line
2007 ¥268.3 billion 2009 ¥296.9 billion
l Strengthening Core Brands
Sales Volume for Mitsuya Cider brand
2007
31.97 million cases*
2009
37.47 million cases
Sales Volume for WONDA brand
2007
28.45 million cases
2009
36.90 million cases
* For the purpose of sales volume, a case is calculated as a case of product ready for shipment.
l Structural changes included conversion of Asahi Soft Drinks Co., Ltd. to a wholly owned subsidiary and establishment of Asahi Calpis Beverage Co., Ltd.
l Made steady progress in constructing optimal production and distribution frameworks, including by improving the in-house manufacturing ratio for PET bottles, etc.
Soft Drinks BusinessRefer to pages 34–37 for details of activities in the overseas operations.
Results of the Third Medium-Term Management Plan
Future Topics
: Soft Drinks Business
27
Medium-Term Management Plan 2012: Targets and Strategies
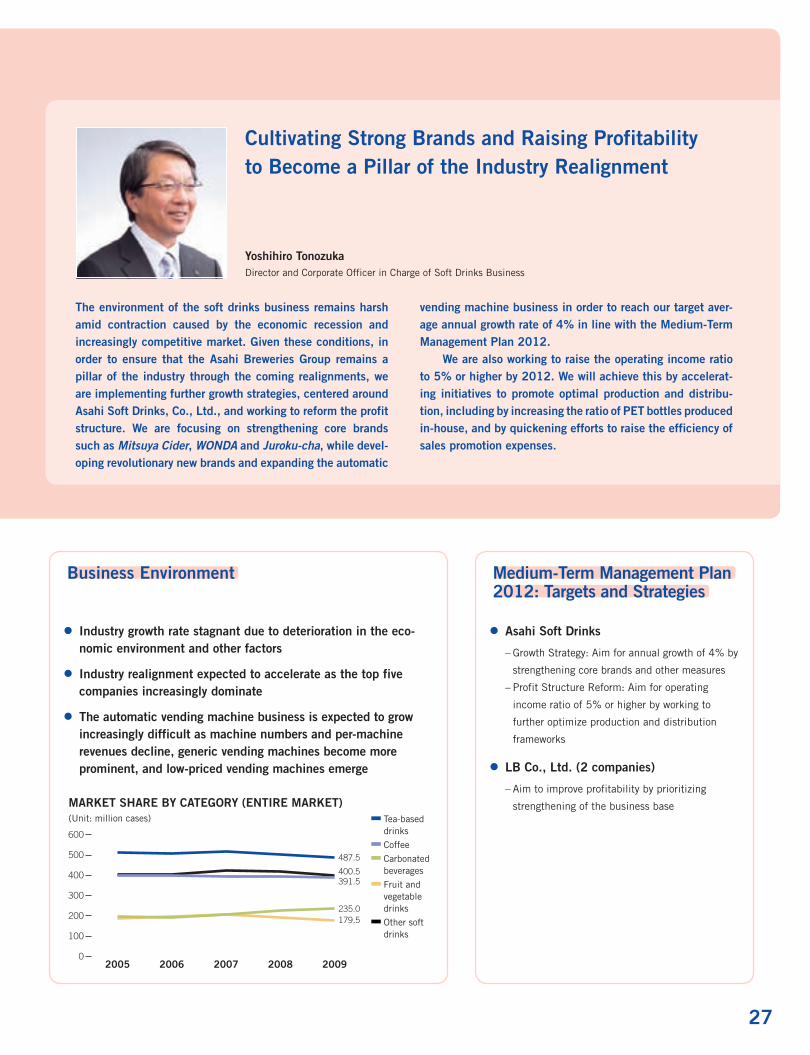
Cultivating Strong Brands and Raising Profitability to Become a Pillar of the Industry Realignment
Yoshihiro TonozukaDirector and Corporate Officer in Charge of Soft Drinks Business
l Industry growth rate stagnant due to deterioration in the eco-nomic environment and other factors
l Industry realignment expected to accelerate as the top five companies increasingly dominate
l The automatic vending machine business is expected to grow increasingly difficult as machine numbers and per-machine revenues decline, generic vending machines become more prominent, and low-priced vending machines emerge
l Asahi Soft Drinks
– Growth Strategy: Aim for annual growth of 4% by
strengthening core brands and other measures
– Profit Structure Reform: Aim for operating
income ratio of 5% or higher by working to
further optimize production and distribution
frameworks
l LB Co., Ltd. (2 companies)
– Aim to improve profitability by prioritizing
strengthening of the business base
The environment of the soft drinks business remains harsh amid contraction caused by the economic recession and increasingly competitive market. Given these conditions, in order to ensure that the Asahi Breweries Group remains a pillar of the industry through the coming realignments, we are implementing further growth strategies, centered around Asahi Soft Drinks, Co., Ltd., and working to reform the profit structure. We are focusing on strengthening core brands such as Mitsuya Cider, WONDA and Juroku-cha, while devel-oping revolutionary new brands and expanding the automatic
vending machine business in order to reach our target aver-age annual growth rate of 4% in line with the Medium-Term Management Plan 2012.
We are also working to raise the operating income ratio to 5% or higher by 2012. We will achieve this by accelerat-ing initiatives to promote optimal production and distribu-tion, including by increasing the ratio of PET bottles produced in-house, and by quickening efforts to raise the efficiency of sales promotion expenses.
0
200
100
300
400
500
600
391.5
487.5
400.5
235.0179.5
2005 2006 2007 2008 2009
Tea-based drinks
Coffee
Carbonated beverages
Fruit and vegetable drinks
Other soft drinks
MARKET SHARE BY CATEGORY (EnTIRE MARKET)(Unit: million cases)
Business Environment

28 Our Strategies
MARKET EnVIROnMEnTIn 2009, sales volume in the Japanese soft drinks industry is esti-
mated to have declined by around 3% overall as a result of weak eco-
nomic conditions and unstable weather during the summer months. By
category, although carbonated beverages continued from 2008 to see
steady growth in sales volume, other categories were generally lower
year on year.
InITIATIVES In 2009Sales for the soft drinks business, including for overseas operations,
were ¥355.2 billion, up 12.1% year on year, with operating income up
12.9% to ¥694 million.
In soft drink operations in Japan, core operating company Asahi
Soft Drinks Co., Ltd. enacted initiatives designed to stimulate dramatic
growth through a basic policy addressing three key issues: growth strat-
egies, structural reform, and “taking on challenges in new areas.”
With respect to the product-related measures at the heart of the
growth strategies, we focused marketing efforts on the company’s core
brands WONDA and Mitsuya Cider, working continuously to cultivate
and strengthen these brands. These efforts were rewarded with a fifth
consecutive year of higher sales volume of WONDA canned coffee,
enhancing the brand’s presence and bringing it to the number three
place in terms of market share. The May 2009 release of the Mitsuya
Cider All Zero product under the Mitsuya Cider brand won a strong
response from customers and helped vitalize the entire brand. Conse-
quently, sales volume of the Mitsuya Cider brand rose for a sixth con-
secutive year, to over 37 million cases. Thanks to these developments,
total sales volume for Asahi Soft Drinks recorded a seventh consecu-
tive year of growth and set an all-time high.
As a result, Asahi Soft Drinks sales rose 0.3% year on year to
¥274.4 billion.
Where profit structure reform is concerned, we took steps designed
to both improve quality and reform the profit structure by striving to
reduce prices for raw materials and improve logistics efficiency, and by
introducing a cutting-edge production line at the Akashi Factory,
including equipment to produce PET bottles.
In the chilled beverages business, LB Co., Ltd. (Tokyo) gained promi-
nent convenience store chains as regular customers in the mainstay
tea-based drinks category. Sales declined, however, due to poor sales
stemming from a sharp downturn in the overall market, coupled with
lackluster sales of long life products. On the profit side, earnings grew
despite factors such as lower sales and further price cuts, thanks
largely to efforts to curb costs for raw materials, smarter use of pro-
cessing costs, and greater efficiency in sales commissions.
At LB Co., Ltd. (Nagoya), earnings growth was attributable to several
factors. These included sharp growth in the OEM business, reflecting
the subcontracted production of Bireley’s for Asahi Soft Drinks Co.,
Ltd.; the steady enactment of support measures to enhance functional-
ity in the home delivery business; and the aggressive purchase and sale
of Group products. Profit, meanwhile, rose substantially atop growth in
sales of Bireley’s, coupled with cost reductions in fixed costs, including
for sales promotions and sample products, and lower production costs.
PLAnS AnD STRATEGIES FOR 2010The soft drinks market in Japan is expected to remain in severe straits
in 2010, with performance on a par with 2009. Under these stringent
conditions, the Asahi Breweries Group is targeting sales of ¥389.0
SHARE BY CATEGORY (ASAHI SOFT DRInKS CO., LTD.)(%)
2004 2005 2006 2007 2008 20090
5
10
15
20
8.7%
17.6%
9.4%
Carbonated beverages Coffee Total
: Soft Drinks Business
Asahi Juroku-cha
Asahi TeaO Golden Straight Tea WONDA
Morning ShotWONDA
Kinnobitou (low-sugar)
WONDAZero Max
(sugar-free)
WONDA Black WONDA
Asahi Soft Drinks Co., Ltd.
Tea-based drinks
Asahi Soft Drinks Co., Ltd.
Coffee
Asahi Soft Drinks Co., Ltd.
Carbonated beverages

29
billion (up 9.5% year on year) and operating income of ¥5.2 billion
(up by a factor of 7.4).
At Asahi Soft Drinks Co., Ltd., we will continue to promote growth
strategies, with a target of boosting sales volume 3.6% to 152 million
cases, as well as implementing profit structure reforms that will lead
to improved profitability.
With respect to the product-related measures at the heart of the
growth strategies, we will aggressively develop products based on the
concept of “Health Facts” that balance good taste and zero calories,
with the aim of cultivating and establishing brands that customers will
choose. Specifically, with the Mitsuya Cider brand we will continue to
pursue “transparent value” and cultivate Mitsuya Cider All Zero. We will
strengthen the WONDA brand by expanding our presence in the growing
low-sugar and sugar-free categories. In product development, we will
move to a “borderless” mode of development that looks beyond the
existing category frameworks and analyzes needs from the customer
perspective, challenging ourselves to create innovative new products.
In the vending machine business, we will strive to increase the
number of vending machines by at least 10,000, and also firmly estab-
lish efficient vending machine operations.
In terms of structural reform, we will seek to create an optimal pro-
duction framework linked throughout the Group, including the commence-
ment of operations in March 2010 of a new soft drinks production line at
our Ibaraki Brewery, and to work to enhance cost competitiveness.
In the chilled beverages business, in the mainstay tea-based drinks
category LB Co., Ltd. (Tokyo) will increase the number of new convenience
store chains handled and expand sales channels by acquiring mass-
retail outlets as regular vendors for long life products. At the same time,
we will aggressively enter the cup beverage market and develop markets
in new beverage categories. With respect to profit, our goals are to grow
profit through increased sales, primarily in the tea-based drinks cate-
gory, and to take steps to reduce variable and fixed costs.
At LB Co., Ltd. (Nagoya), in addition to realizing sales expansion for
LB products and other Asahi Breweries Group products in the home
delivery business, efforts will focus on broadening sales channels in
four areas—catering, restaurants, mass retail, and bidding. On the
profit side, we will look to reduce costs for raw materials, variable costs
related to distribution and other variable costs, and to use sales promo-
tion expenses, processing costs, and other fixed costs more efficiently.
SALES AnD OPERATInG InCOME In SOFT DRInKS BUSInESS (InCL. OVERSEAS OPERATIOnS)(¥ billion)
Sales Operating income
389.0
316.7355.2
2008 2009 2010(target)
5.2
0.6 0.7
2008 2009 2010(target)
0
100
200
300
400
0
2
4
6
Asahi Fujisan no Vanadium Tennensui
Ocha UKON a
Mitsuya Cider Mitsuya Cider All Zero
Lemon-Flavor Mitsuya Cider Zero
Asahi Soft Drinks Co., Ltd.
Water
LB Co., Ltd. (Tokyo)LB Co., Ltd. (nagoya)
Chilled beverages
SOFT DRInKS SALES COMPOSITIOn BY COMPAnY (2009)
Asahi Soft Drinks Co., Ltd.
75.4%
Other
0.1%
Schweppes Australia
13.1%Haitai Beverage Co., Ltd.
5.4%
LB Co., Ltd. (Nagoya)
1.1%
LB Co., Ltd. (Tokyo)
4.9%

30 Our Strategies
l Harness Group Synergies
– Strengthen product proposal capabilities
– Expand sales channels and business domains
– Profit structure reform for SCM as a whole
Asahi Food & Healthcarel Enhance profitability, improve
financial standing
Wakodol Cultivate new businesses, including
overseas operations
Amano Jitsugyol Improve profit structure dramatically
l Expanded business base and grew profits
Net sales2007
¥67.1 billion
2009
¥92.4 billion
Operating income2007
¥1.3 billion
2009
¥2.7 billion
l Strengthened business base through capital and business alliance with Amano Jitsugyo
Asahi Food & Healthcarel Enhanced brand power of MINTIA and other core brands
Wakodol Grew core businesses such as baby foods and powdered infant formula
Amano Jitsugyol Developed new businesses and grew direct marketing business
: Food Business
Results of the Third Medium-Term Management Plan
Future Topics
Food Business* As part of the formulation “Long-Term Vision 2015” and “Medium-Term Management Plan 2012,” the Group’s
food and pharmaceuticals operation was renamed the “food business.”

31
Reinforcing Brands and Seeking Group Synergies in Areas of Strength
Toshio MoriDirector and Corporate Officer in Charge of Food Business
l Aging demographics, long-term decline in population
l Diversification of lifestyles
l Increasing health consciousness
l Growing demand for safety and reliability
l Distribution-side changes such as increasing prominence of Internet supermarkets and realignment of distribution system
l Acceleration of industry realignment
Pursue self-generated growth for each Group company
Aim for annual average growth rate of 6% and
operating income ratio of 5% or higher
Asahi Food & Healthcarel Further expand existing businesses and cultivate new businesses
l Strengthen corporate structure by improving profitability
Wakodol Solidify market position in existing businesses
l Expand business base by cultivating new businesses
Amano Jitsugyol Enhance the power of the Amano brand
l Achieve one of the highest levels of profitability in the industry
The food business market includes business fields and prod-ucts that have the potential to grow despite the long-term downtrend in the Japanese population. With consumer pref-erences and lifestyles growing increasingly diverse, obtaining an accurate understanding of these changing needs will allow us to tap into this potential.
The Asahi Breweries Group’s food business is centered around Asahi Food & Healthcare Co., Ltd., Wakodo Co., Ltd.
and Amano Jitsugyo Co., Ltd. Each company works to build up brands and develop new products in the categories where it has the greatest strengths. At the same time, we seek to organically harness synergies between the strengths of Group companies in areas such as technology infrastructure, pro-curement, production, distribution, and marketing. In this way, we both provide customers with new value and enhance profitability.
Business Environment Medium-Term Management Plan 2012: Targets and Strategies
32 Our Strategies
2009 BUSInESS OVERVIEWSales in the food and pharmaceuticals business rose 16.7% year on
year to ¥92.4 billion, with operating income climbing 41.2% to ¥2.7
billion. This steady improvement reflected the rollout of strategies tai-
lored to characteristics unique to each Group company, which culmi-
nated in sales expansion in mainstay products. Performance also
benefited from contributions from the full-year earnings of newly con-
solidated subsidiaries.
Asahi Food & Healthcare Co., Ltd. promoted business develop-
ment and expansion and reinforced its business base, guided by a
strategy focused on “growth, structural reform, and ensuring safety
and reliability.” The successive launch of new and revamped products
and aggressive sales promotions prompted brisk performance in our
core products—MINTIA breath mint tablets, BALANCEUP nutritionally
balanced snack bars, Dear-Natura brand supplements, and quasi-drug
product EBIOS, a pure brewer’s yeast preparation tablet. The result
was significant sales growth. Similarly, the direct marketing business
saw a substantial 51% increase in sales from the previous year, as we
moved forward with diversifying our sales channels.
Profits, however, declined for the year despite profit growth, which
was attributed mainly to increased sales and lower costs due to greater
capacity utilization rates at production sites. This outcome stemmed
largely from higher personnel and fixed costs from our integration with
Sunwell Co., Ltd., as well as upfront investments in the form of adver-
tising and sales promotion expenses. The aim of the latter was to cul-
tivate brands and attract customers in the direct marketing business to
promote smooth business expansion in 2010.
Wakodo Co., Ltd., following a management policy of “further
accelerating growth,” took steps to strengthen and expand its business
base in a severe market environment, characterized by the launch of
new products and low-pricing strategies by competitors. Specifically,
the company worked to revamp products and bolster its brands in other
ways by leveraging expertise in “infant-safe quality” honed in baby
products over the years. These efforts culminated in brisk performance
from the company’s mainstay brands—powdered infant formula brands
Hai Hai and Gun Gun, and the Goo-Goo Kitchen baby food brand—
resulting in steady sales growth.
In terms of profit, Wakodo saw profit levels improve steadily
thanks to lower costs for raw materials and a better product mix. This
positive result came despite aggressive investment in advertising and
sales promotion expenses in order to cultivate and strengthen brands.
Elsewhere, Amano Jitsugyo Co., Ltd. worked to expand its busi-
ness and boost profitability, with the aim of emerging as the undis-
puted leader in Japan’s freeze-dried food market. In addition to
realizing year-on-year growth in commercial-use sales through out-
sourced production for food companies, the company saw significant
growth in its direct marketing business, resulting in record sales for the
year. Where profit is concerned, Amano Jitsugyo strove for improved
profitability by trimming fixed costs and raising product prices, and by
promoting more robust cooperation with companies throughout the
Asahi Breweries Group.
Among other measures, we sought in this segment to generate
MINTIA BALANCEUP
Launch of Food Seasonings Business Utilizing Yeast Discovered by Asahi Breweries, Ltd.
As the shift toward greater health consciousness and a preference for foods free of additives and preservatives gains momentum worldwide,
particularly in developed countries, market scale continues to grow for yeast extract as a natural food ingredient. In light of this trend, in
February 2009, we established a joint venture with Mitsui & Co., Ltd. called Advanced Yeast Technologies Japan, Ltd. that will manufacture
and sell yeast extract as a natural seasoning.
The joint venture will sell high-value-added yeast extract that uses original extraction technologies and four strains of yeast containing
high concentrations of certain constituents first discovered by Asahi Breweries, Ltd., including glutamic acid, which adds greater depth of
flavor to the yeast. Asahi Breweries, Ltd. will allow the company to which production has been outsourced access to its yeast strains and
cultivation technology. Asahi Food & Healthcare Co., Ltd., meanwhile, will contribute its extract manufacturing technology and expertise in
blending and formulation to the production company.
: Food Business
Asahi Food & Healthcare Co., Ltd.
Wakodo Co., Ltd.

33
synergies between operating companies by promoting joint procure-
ment designed to reduce unit costs for raw materials, joint delivery to
cut distribution costs, and encouraging entry into new product devel-
opment fields.
PLAnS AnD STRATEGIES FOR 2010Beyond strengthening core brands in 2010, we will propose high-
added-value products for a wide range of ages by promoting further
synergies among operating companies. Similarly, we will move quickly
to meet our target operating income ratio of 5% for 2012 outlined in
the Medium-Term Management Plan 2012 by pursuing greater SCM
efficiency for the business as a whole. Consequently, we are aiming for
sales of ¥99.0 billion (up 7.1% year on year) and operating income of
¥3.7 billion (up 34.8%) for this business in 2010.
Asahi Food & Healthcare Co., Ltd. is targeting sales of ¥47.5 bil-
lion (up 7.7%) and operating income of ¥1.7 billion (up 64.3%). The
company will look to accelerate growth driven by sales expansion, as
well as boost production and marketing efficiency. Another focus will
be the drive to transform core brands MINTIA and BALANCEUP into
mega-brands through the aggressive launch of new and revamped
products. Asahi Food & Healthcare will also take steps to expand the
business base for the direct marketing and seasonings businesses, two
operations where substantial growth is projected going forward.
Miso Soup
Goo-Goo KitchenInfant formula Lebens Milk Hai Hai
Sales Operating income
FOODS SALES AnD OPERATInG InCOME(¥ billion)
The market environment surrounding Wakodo Co., Ltd. is likely to
remain a challenging one. Nevertheless, the company will seek to
enhance quality on all fronts, guided by a fundamental commitment to
food safety and reliability, with the goal of expanding the business
base in powdered infant formula, baby food, and other existing main-
stay businesses. Wakodo will also commence with the full-scale pro-
motion of powdered infant formula in China and ramp up the pace of
efforts to enter new markets. Through these actions, the company is
aiming for sales of ¥39.0 billion (up 7.7% year on year) and operating
income of ¥2.4 billion (up 8.8%).
Amano Jitsugyo Co., Ltd., as in 2009, will proactively invest
mainly in the expansion of its direct marketing business and the devel-
opment of products that stand apart in the marketplace. At the same
time, the company will seek to expand sales in new channels like
supermarkets and convenience stores, and in new areas. The latter will
see efforts to expand sales in the eastern part of Japan, as well as in
the Chubu and Kyushu regions. In addition, Amano Jitsugyo will focus
even more on enhancing production- and distribution-side efficiency,
as well as joint production development with Group companies. Conse-
quently, the company is targeting sales of ¥16.6 billion (up 3.8% year
on year) and operating income of ¥0.6 billion (up 29.5%).
99.0
79.2
92.4
2008 2009 2010(Target)
3.7
1.9
2.7
2008 2009 2010(Target)
0
20
40
60
80
100
0
1
2
4
3
Amano Jitsugyo Co., Ltd.
Asahi Food & Healthcare Co., Ltd.
45.8%
Other
0.01%
Wakodo Co., Ltd.
39.2%
Amano Jitsugyo Co., Ltd.
15.0%
FOOD SALES COMPOSITIOn BY COMPAnY
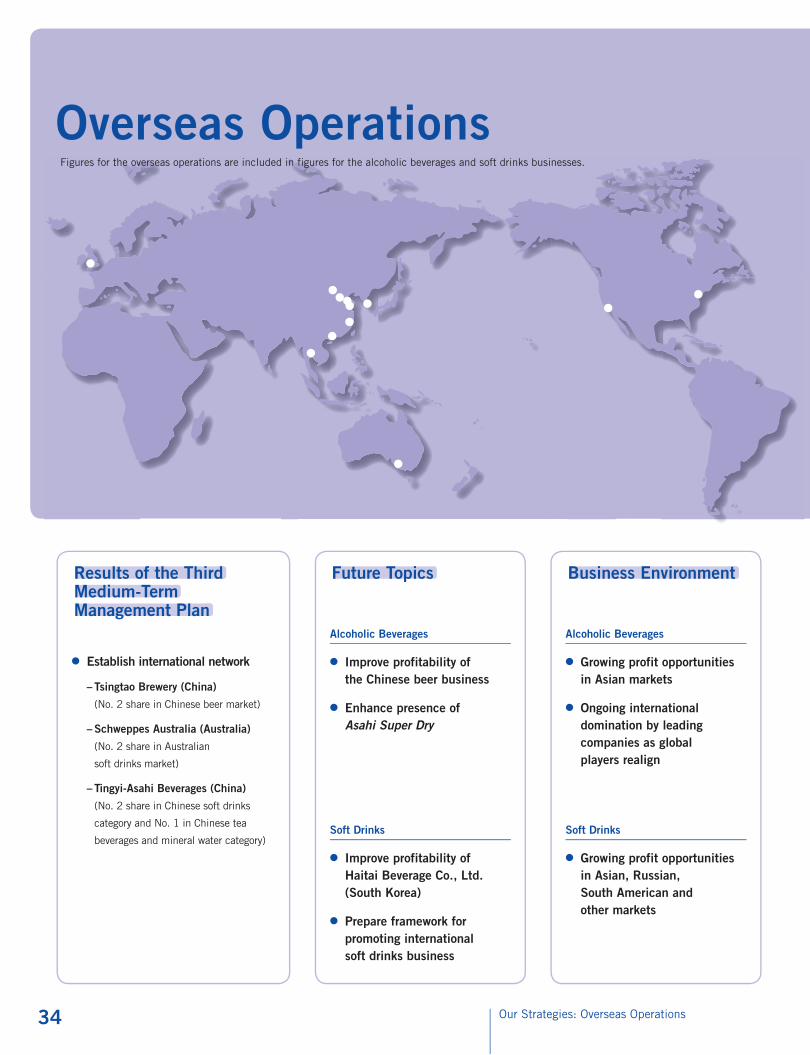
34 Our Strategies
Business EnvironmentFuture TopicsResults of the Third Medium-Term Management Plan
l Establish international network
– Tsingtao Brewery (China)
(No. 2 share in Chinese beer market)
– Schweppes Australia (Australia)
(No. 2 share in Australian
soft drinks market)
– Tingyi-Asahi Beverages (China)
(No. 2 share in Chinese soft drinks
category and No. 1 in Chinese tea
beverages and mineral water category)
Alcoholic Beverages
l Growing profit opportunities in Asian markets
l Ongoing international domination by leading companies as global players realign
Soft Drinks
l Growing profit opportunities in Asian, Russian, South American and other markets
Alcoholic Beverages
l Improve profitability of the Chinese beer business
l Enhance presence of Asahi Super Dry
Soft Drinks
l Improve profitability of Haitai Beverage Co., Ltd. (South Korea)
l Prepare framework for promoting international soft drinks business
: Overseas Operations
Overseas OperationsFigures for the overseas operations are included in figures for the alcoholic beverages and soft drinks businesses.
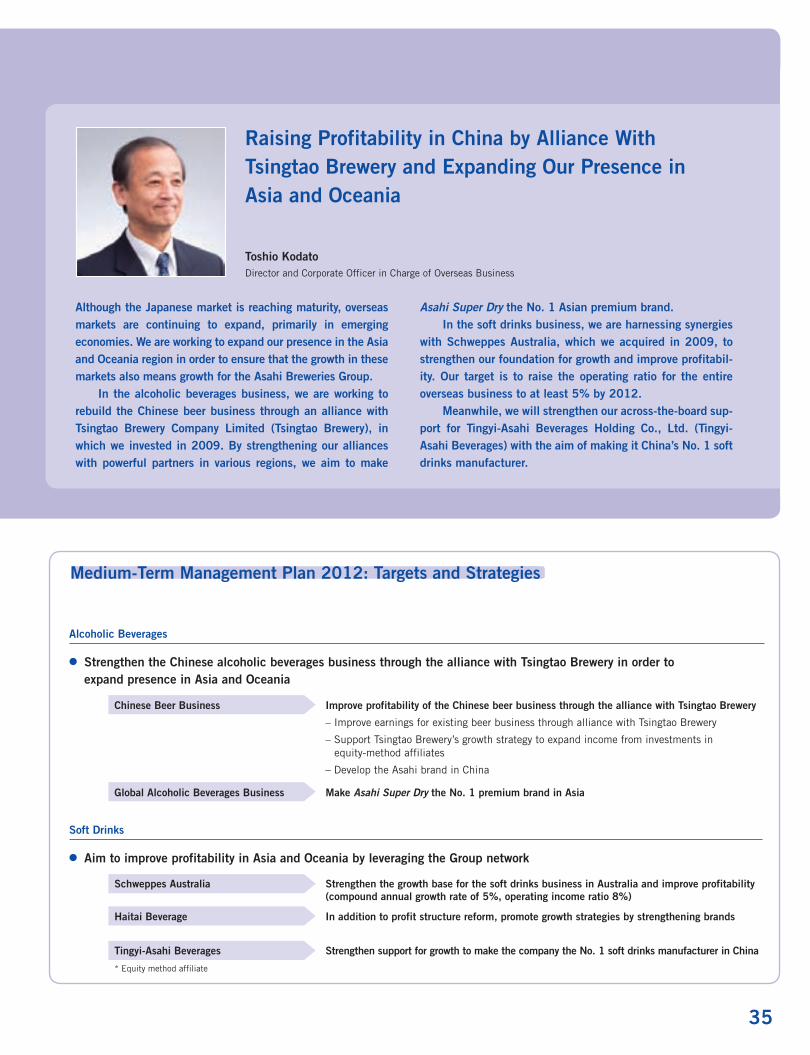
35
Medium-Term Management Plan 2012: Targets and Strategies
Alcoholic Beverages
l Strengthen the Chinese alcoholic beverages business through the alliance with Tsingtao Brewery in order to expand presence in Asia and Oceania
Chinese Beer Business Improve profitability of the Chinese beer business through the alliance with Tsingtao Brewery
– Improve earnings for existing beer business through alliance with Tsingtao Brewery
– Support Tsingtao Brewery’s growth strategy to expand income from investments in equity-method affiliates
– Develop the Asahi brand in China
Global Alcoholic Beverages Business Make Asahi Super Dry the no. 1 premium brand in Asia
Soft Drinks
l Aim to improve profitability in Asia and Oceania by leveraging the Group network
Schweppes Australia Strengthen the growth base for the soft drinks business in Australia and improve profitability (compound annual growth rate of 5%, operating income ratio 8%)
Haitai Beverage In addition to profit structure reform, promote growth strategies by strengthening brands
Tingyi-Asahi Beverages Strengthen support for growth to make the company the no. 1 soft drinks manufacturer in China
* Equity method affiliate
Raising Profitability in China by Alliance With Tsingtao Brewery and Expanding Our Presence in Asia and Oceania
Toshio KodatoDirector and Corporate Officer in Charge of Overseas Business
Although the Japanese market is reaching maturity, overseas markets are continuing to expand, primarily in emerging economies. We are working to expand our presence in the Asia and Oceania region in order to ensure that the growth in these markets also means growth for the Asahi Breweries Group.
In the alcoholic beverages business, we are working to rebuild the Chinese beer business through an alliance with Tsingtao Brewery Company Limited (Tsingtao Brewery), in which we invested in 2009. By strengthening our alliances with powerful partners in various regions, we aim to make
Asahi Super Dry the no. 1 Asian premium brand.In the soft drinks business, we are harnessing synergies
with Schweppes Australia, which we acquired in 2009, to strengthen our foundation for growth and improve profitabil-ity. Our target is to raise the operating ratio for the entire overseas business to at least 5% by 2012.
Meanwhile, we will strengthen our across-the-board sup-port for Tingyi-Asahi Beverages Holding Co., Ltd. (Tingyi-Asahi Beverages) with the aim of making it China’s no. 1 soft drinks manufacturer.

3636
China
Feature: Business in ChinaResponding Assertively to Growth in Emerging Markets
BEER BUSInESSChina is the world’s largest beer consumer country. In 2008, overall national consumption was 6
times as high as in 1990, and per-capita consumption rose approximately 5 times over the same
period*1. In light of this market expansion, the world’s leading beer companies have eagerly joined
the action, sparking fierce competition with local breweries.
In April 2009, the Asahi Breweries Group acquired a stake in Tsingtao Brewery, a company that
commands overwhelming brand power in China. In August the same year, we moved to create a
powerful partnership by signing a strategic alliance agreement with Tsingtao Brewery. Leveraging
this alliance, we will push ahead with outsourcing the production of Tsingtao Beer to breweries in
which the Group has previously invested, looking to reconfigure the profit base for our entire beer
business in China with greater speed.
The Asahi Breweries Group will support Tsingtao Brewery’s growth throughout the entire supply
chain. This commitment will help as we strive over the medium to long term to develop the Asahi
Breweries brand across China by leveraging Tsingtao Brewery’s production and sales network.
SOFT DRInKS BUSInESSChina’s soft drinks market is rapidly expanding, largely reflecting population growth and increased
purchasing power in the country. At the same time, the market is home to a large number of players
representing both global and local brands, resulting in a fiercely competitive environment.
The Asahi Breweries Group began investing in Tingyi-Asahi Beverages in 2004. Since then, the
company has grown steadily even in the current challenging environment. In 2009, Tingyi-Asahi
Beverages focused on marketing investment in tea beverages and mineral water, where it boasts
high market shares, and made strides in efficiency as utilization efficiency improved in step with
increased sales volume. As a result, the company posted substantial growth in sales and segment
results*2 for the year.
Our policy going forward is bolster key beverage brands, grow market share through aggressive
marketing investment, and to aim for further improvements in Tingyi-Asahi Beverages’ already unri-
valed cost competitiveness. By providing targeted support in production technology and quality
assurance in core categories, the Asahi Breweries Group is striving to realize greater growth for
Tingyi-Asahi Beverages.
*1 Source: Impact Databank 2009 Edition *2 Segment results = ordinary income – financial costs
PERFORMAnCE OF TSInGTAO BREWERY Net income (right scale) Net Sales (left scale)
05 06 07 08 090
4,000
8,000
12,000
16,000
20,000
0
300
600
900
1,200
1,500
1,253
17,761
(Million yuan)
PERFORMAnCE OF TInGYI (CAYMAn ISLAnD) HOLDInGS CORP (SOFT DRInKS OPERATIOnS)
Segment result (right scale) Net sales (left scale)
05 06 07 08 090
600
1,200
1,800
2,400
3,000
0
80
160
240
320
400
287
2,545
($ million)
02 0300 0198 99 04 05 06 07 08
China boasts the world’s largest population. According to U.n. projections, China’s population is expected to increase to
1.46 billion people by 2030. At the same time, the pace of growth of the country’s economy is also gaining speed, with
China looking increasingly likely to overtake Japan with the world’s second largest gross domestic product (GDP) in 2010.
Alongside this growth, technological innovation in manufacturing, logistics and a wide range of other areas, coupled with
elements such as the modernization of distribution channels and the market entry of new domestic and foreign companies,
is fanning expansion in China’s consumer market.
In this enticing Chinese market environment, the Asahi Breweries Group is moving assertively to forge a stronger business
base. The following is a brief introduction to just some of the steps being taken to this end.
Population: 1.34 billion
GDP Growth Rate: 9.0%
: Overseas OperationsOur Strategies

37
Europe Korea
America Australia
BEER BUSInESS (ExCLUDInG CHInA)In Asian markets, we are bolstering relationships with local partners in
order to raise the market presence of Asahi Super Dry. In Thailand, by
leveraging an alliance with leading local company Boon Rawd Brewery
Co., Ltd., we established a framework capable of utilizing the compa-
ny’s nationwide network as a powerful sales channel. In Taiwan, we
established ASAHI & MERCURIES CO., LTD., a joint venture with
MERCURIES AND ASSOCIATES, LTD., while in South Korea, we con-
tinued to enhance our local sales network through Lotte Asahi Liquor
Co., Ltd., our joint venture with the Lotte Group. In Hong Kong, we
took advantage of new access to the sales network of Carlsberg Hong
Kong, which holds the second leading share in Hong Kong’s beer
market, to pursue full-scale sales expansion for Asahi Super Dry, with
a focus on the on-promise market.
In the U.S. market, we worked hard to reinforce the base of the
market for Japanese restaurants and similar facilities and to raise brand
recognition in local markets in a bid for further growth. From January
2010, we began offering Asahi Super Dry in kegs in the U.S. market in
a full-fledged push to establish a foothold in the on-promise market.
Elsewhere, the Group continues to reinforce alliances with local
breweries, including through production and sales licensing agree-
ments with Shepherd Neame Ltd. in the U.K., and with Russia’s larg-
est beer producer, Baltika Breweries. In Europe, meanwhile, we are
promoting a number of priority products, including beer in kegs and
“steiny” containers, to raise the profile of the Asahi brand. In these
ways, we are developing a more robust presence for the Asahi Super
Dry brand through marketing activities that directly reflect local market
characteristics.
SOFT DRInKS BUSInESSAustralia: Schweppes AustraliaSchweppes Australia has seen morale surge and is off to a strong start
since becoming a wholly owned subsidiary of the Asahi Breweries
Group in April 2009. The Group’s emphasis on alcoholic beverages
and soft drinks has made it a good fit for the Australian company.
Schweppes Australia saw sales volume improve 7% year on year.
In addition to robust growth in core brands Schweppes, Solo, and
Pepsi, another beverage, Monster, performed well following its July
2009 debut. In terms of earnings, the company maintained profit
growth despite higher costs for raw materials as a result of higher costs
due to foreign currency exchange rates. Factors that enabled growth
included lower costs, the result of more efficient use of marketing
expenses and reductions in distribution costs and disposal losses, as
well as benefits from price increases implemented from May 2009.
In 2010, Schweppes Australia will continue promoting sales
growth by bolstering core brands and developing new sales channels,
while working to sustain profit growth by leveraging the expertise of the
Asahi Breweries Group to realize greater efficiency across the total
supply chain.
South Korea: Haitai BeverageEfforts in 2009 to use fixed costs more efficiently at Haitai Beverage in
South Korea, including through the integration and elimination of sales
and production bases, yielded steady results. However, escalating
prices for raw materials triggered by the won’s depreciation, coupled
with lackluster sales of Sunkist as a core brand, caused performance to
fall short of initial targets.
To achieve profitability early in 2010, a drive is under way to
promote sales growth by revamping the Sunkist brand and reaping
benefits from the launch of mineral water and other new products.
These benefits are expected to come atop contributions from addi-
tional profit structure reforms, including personnel reductions enabled
through improved sales route efficiency.
06 07 08 09 10(estimate)
0
250
500
750
1,000
0
20
40
60
80
58
863
PERFORMAnCE OF SCHWEPPES AUSTRALIA
(Million Australian dollars)
Operating income (right scale) Net sales (left scale)

38 Our Strategies38
Research and Development
Research and development at the Asahi Breweries Group is guided by the Group’s Long-Term Vision 2015 of striving to transform the
bounty of nature into the “Kando” of food while becoming a trusted company with global quality.
Our R&D organization includes headquarters specific to each of the Group’s businesses—alcoholic beverages, food and soft drinks—that
develop applicable products and technologies. The Corporate Research & Development Headquarters, meanwhile, promotes technological
developments and R&D leading to the creation of new businesses across the entire Group.
In conducting R&D activities, we actively promote joint research opportunities with universities and other public institutions in and outside
of Japan, as well as with other corporations. This cooperative approach enables the Group to consistently pursue state-of-the-art R&D activi-
ties, particularly through the adoption of cutting-edge technologies. We are also striving for greater selectivity and focus in R&D, both to
clarify accountability in the selection of research themes and to move forward with important themes faster.
More Specific R&D in Each Core Group Business
Promote R&D Encompassing the Entire Group
Department of General Affairs for Laboratories
Technical Information Office
Development Laboratories for Alcoholic Beverages
Research Laboratories for Food Safety Chemistry
Research & Development Laboratories for Sustainable Value Creation
Research Laboratories for Fundamental Technology of Food
Research Laboratories for Food Technology
Development Laboratories for Food Products
Research & Development Laboratories for Packaging
Research Laboratories of Brewing Technology
Research & Development Headquarters for Food & Health
Research & Development Headquarters for Beverages
Asahi Soft Drinks Co., Ltd.
Department of Research & Development Strategy
Trend Analysis Section
Quality Control Center
Research & Development Headquarters
Research & Development Headquarters for Alcoholic Beverages
Soft Drink Development Laboratory
Soft Drink Technology Laboratory
Corporate Research & Development Headquarters
Department of Intellectual Property
Marketing Headquarters
: Research and Development

39
Asahi The Master
Mitsuya Cider All Zero
Cooking is one application for yeast extract
The cellulase production process (old paper gradually breaking down over time)
Alcoholic BeveragesAsahi The Master, launched in May 2009, became the first domestic Japanese beer to win the
Gold Medal award in the pilsner category at the 2009 World Beer Championships (WBC), an
international beer-rating event held in the United States. The event featured 370 beer brands
submitted by manufacturers, importers and retailers from 26 countries, with the most beers (33
brands) appearing in the pilsner category.
Production of Asahi The Master is supervised by Group employees who have earned the
title “Master” from the Technical University Munich-Weihenstephan in Munich, Germany. The
finished product is the result of a meticulous brewing process that uses only the finest barley
and hops.
Soft DrinksFor Mitsuya Cider, a brand that celebrated 126 years in business in 2009, we took optimal
advantage of our “zero calorie, zero sugar, and zero preservatives” product development tech-
nology, honed through many years of experience. The result was Mitsuya Cider All Zero, a new
clear carbonated beverage that is lightly sweet and refreshing. The product has been well
received by consumers since its release in May 2009.
FoodIn February 2009, we established a joint venture with Mitsui & Co., Ltd. for the manufacture
and sale of yeast extract as a natural seasoning. The new company will sell high valued-added
yeast extracts developed primarily from our proprietary yeast fermentation and extract manufac-
turing technologies. The extracts are derived from four yeast strains first discovered by the Asahi
Breweries Group that contain high concentrations of glutamic acid and other constituents. As
greater health consciousness and the trend toward natural foods gain momentum worldwide, we
hope to use the sale of our yeast extract as an opportunity to expand the Group’s full range of
natural seasonings.
new BusinessesAsahi Breweries’ Research Laboratories for Fundamental Technology of Food was first in the
world to develop technology for the low-cost production of cellulase, an enzyme used to break-
down cellulose into sugar. Cellulase exists widely in nature, in products such as rice straw,
wheat straw and other typically unused plant resources.
Global demand for cellulase is increasing, particularly in food processing and in the field of
energy, where it is vital in the production of bioethanol. However, production technologies for
conventional cellulase have been costly, presenting a significant barrier to widespread adoption.
Research and development is now in progress for the use of cellulase in a broad array of
applications, particularly in the food processing and energy fields.

40
Group Management
Corporate Governance
1. Basic PolicyThe Asahi Breweries Group recognizes all our stakeholders as “custom-
ers” who provide us with support, starting with the consumers of our
products and also including shareholders, investors, suppliers, employ-
ees and local communities. To ensure our corporate activities satisfy
all these “customers” and to quickly adapt to an ever-evolving busi-
ness environment, we have identified corporate governance as a prior-
ity for management. We are therefore striving to strengthen Group
management, reinforce our relationship of trust with society and
enhance our social responsibility and management transparency.
2. Characteristic Features of Our Corporate Governance Structure
Asahi Breweries, Ltd. is bolstering corporate governance with the goal
of maintaining management soundness, transparency and efficiency.
Specifically we have adopted a “company with auditors” governance
framework, under which we strengthen management oversight func-
tions and preserve transparency by appointing outside directors. Asahi
Breweries, Ltd. has also introduced a Corporate Officer System,
designed to separate management duties from business execution, as
well as boost management decision-making speed, and realize more
efficient management overall.
Chairman of the Board
Basic Principles for Establishing an Internal Control System and various internal regulations (including Business Ethics Rule)
President
Board of Auditors Board of Directors
Alcoholic Beverages Business
Soft Drinks Business
Food Business
Others
Management Strategy Meeting Management Meeting
Enforcement Divisions and Group Companies
Shareholders’ Meeting
Appointment/Dismissal Appointment/Dismissal
Governance/Surveillance
Governance/Surveillance
Appointment/Dismissal
Appointment/Dismissal/Supervision
Cooperation
Cooperation
CooperationAudit
Advice/Support
Advice/Support
Audit Audit
Internal Audit
Audit Standing Corporate Auditors Outside Corporate
Auditors
Chairman of the Board President Company-employed
Directors Outside Directors
GeneralCounsel
AuditingFirm
Group CSR
Committee
Corporate Officers in Charge of Major Business Units
President Company-employed Directors
Nomination Committee Company-employed Directors Outside Directors
Compensation Committee Company-employed Directors Outside Directors
Audit Department
CORPORATE GOVERnAnCE STRUCTURE

41Group Management
Board of DirectorsThe Board of Directors consists of 14 directors, including 3 outside
directors (as of March 31, 2010). Outside directors are chosen from a
pool of exceptional external candidates who qualify as independent
directors. Outside directors have varied career backgrounds, with some
having served as corporate executives, educators, and as advisory gov-
ernment committee members prior to their appointments. The wealth
of experience and keen insight of our current outside directors are
reflected in the continued transparency of the Board’s decision-making
processes and management oversight.
In 2000, Asahi Breweries, Ltd. significantly reduced the number
of directors, in the interest of realizing greater management efficiency
and timelier decision-making.
In 2009, the Board of Directors held 11 regular meetings, with
outside directors Mr. Yamaguchi, Ms. Bando, and Mr. Tanaka attending
10, 11 and 8 meetings, respectively. (Because Mr. Tanaka was elected
at the Company’s 85th Ordinary General Meeting of Shareholders on
March 26, 2009, only 9 meetings have been held since he took up his
post.) In addition to the abovementioned meetings, the Board of Direc-
tors adopted two resolutions without holding a formal meeting, as per-
mitted by Article 370 of Japan’s Corporate Law.
Nomination and Compensation CommitteesComplete fairness and transparency in the appointment and compen-
sation of senior officers are achieved by the Nomination Committee
and the Compensation Committee, which serve as advisory bodies to
the Board of Directors. Outside directors are present among the direc-
tors that comprise the membership of each committee.
The Nomination Committee consists of a total of four officers, of
whom two are Company-employed directors and two are outside direc-
tors. The committee is chaired by a Company-employed director, and is
responsible for recommending candidates for director, corporate officer
or auditor to the Board of Directors. The committee met once in 2009.
The Compensation Committee is also comprised of four officers,
of whom two are Company-employed directors and two are outside
directors. The committee is chaired by an outside director, and is
responsible for proposing compensation systems and packages for
directors and corporate officers to the Board of Directors. The commit-
tee met twice in 2009, and mainly forwarded proposals regarding the
amount of bonuses for senior officers.
Board of AuditorsThe Board of Auditors is responsible for supervising and auditing the
management of the Company and the performance of duties by direc-
tors. The Board of Auditors consists of five auditors, including three
outside auditors. Selected from a pool of exceptional candidates who
qualify as independent auditors, the experience and insight gained
from the varying backgrounds of the outside auditors, a former top
executive, a lawyer and a university professor, is evident as they audit
the management of Asahi Breweries, Ltd. from multiple perspectives.
In 2009, the Board of Auditors held eight meetings, of which Mr.
Sakurai attended eight, Mr. Nakamura attended seven, and Mr. Ishizaki
attended eight.
Outside Director
naoki TanakaPresident, Center for International Public Policy StudiesAppointed Outside Director of Asahi Breweries, Ltd. in 2009
Comments from Outside Director
Asahi Breweries conducted an ongoing demonstration project in ethanol production in
Iejima, Okinawa, through to March 2010. The goal of this joint research with the
National Agricultural Research Center for Kyushu Okinawa Region was to establish a
high-speed, high-concentration fermentation process for bio-ethanol using a high-yield
variety of sugarcane. In my view, this project is highly significant as an attempt to ben-
efit the Earth. I hope that it will help to show ways of using renewable energy involving
agricultural corporations and government agencies, and in a business context too. In
promoting the project, we inevitably have to consider ways to draw it out from under the
rubric of agriculture protection policies. On this point, I hope to do what I can to bring
this about after establishing my views on the economies of the business model.

42
3. Corporate Officer SystemIntroduction of a Corporate Officer SystemAsahi Breweries, Ltd. has introduced a Corporate Officer System to
ensure timely execution of operations and clarify responsibilities and
authority. Corporate officers are granted the authority by the Board of
Directors to execute operations and are responsible for the timely exe-
cution of operations. Meanwhile, directors are entrusted with the mis-
sion of formulating Group management strategies and making key
decisions on Group management for strengthening and developing the
Group, in addition to supervising the execution of operations.
Management Strategy Meeting and Management MeetingTwo high-level meetings share the responsibility of quickly executing
decisions made by the Board of Directors. The Management Strategy
Meeting deliberates matters pertaining to the direction of the entire
Group. The Management Meeting, meanwhile, is charged with decid-
ing specific matters concerning business execution. The Management
Strategy Meeting is chaired by the chairman and representative direc-
tor, while the Management Meeting is chaired by the president and
representative director. These meetings maintain the accountability of
directors for the entire Group and the responsibility of the president
and representative director and corporate officers for the alcoholic bev-
erages business, thereby clarifying responsibilities and accelerating
decision-making. To maximize operational efficiency, at each meeting
progress is controlled and assessed based on an objective and rational
management index. In order to ensure the legality of the decision-
making process employed for major issues and to further enhance
compliance management, each meeting is attended by at least one
standing corporate auditor.
Internal Audits and Accounting AuditsTo enable auditors to efficiently conduct their auditing duties, Asahi
Breweries, Ltd. assigns two full-time staff to attend to the needs of the
Board of Auditors, enabling auditors’ full attendance at important meet-
ings and facilitating the review of authorized documents at all times.
With respect to internal audits, the 11-member Audit Department,
under the direct control of the President, has been established as the
internal organ responsible for conducting audits based on Group-wide
auditing standards and our annual audit plan to ensure proper and
effective business execution across the entire Group. In addition to
reports individually filed with each audit, twice a year, general reviews
of the audits are submitted to the Management Strategy Meeting to be
used as the basis for new policies.
The auditors, Internal Audit Department and accounting auditor
work in concert by exchanging information through briefings and by
transmitting copies of auditing reports periodically, and as needed. In
2009, the Board of Auditors held five briefings with the accounting
auditor and three briefings with the Internal Audit Department, respec-
tively. The Internal Audit Department held four meetings with the
accounting auditor.
4. Compensation for Directors and AuditorsResolutions regarding compensation for senior officers become agenda
items for the Board of Directors following deliberations that take into
account the compensation systems and packages for directors and cor-
porate officers proposed by the Compensation Committee. In 2009,
fixed salaries comprised around 80% of compensation for directors,
with the performance-based portion roughly accounting for another
20%. (Note: All performance-based compensation was short term). For
auditors, compensation consisted entirely of fixed salaries (monthly
compensation), reflecting the abolishment of the Company’s system of
benefits from April 2009. (Refer below.)
Asahi Breweries, Ltd. decided at a meeting of the Board of Direc-
tors held on February 6, 2007, to abolish the system of retirement
benefits for directors and auditors and to include the relevant amount
in their annual salaries. Retirement benefits were traditionally paid as
compensation to directors and auditors at a future date, and the deci-
sion to include compensation equivalent to retirement benefits in the
annual salary was made in response to the adoption of a one-year term
of office. At the same February 6 meeting, the Board of Directors also
decided to make no new allotments to the stock option system that had
been implemented as part of the compensation system for directors,
auditors and executive officers, on the grounds that even if they were
able to execute their rights under insider trading regulations, it would
be difficult to sell the rights at a later date, so that their function as an
incentive was unsustainable.
Compensation for Directors and Auditors (FY2009)(¥ million) Salary Bonus Total
Company-employed Directors (Total: 9) ¥407.1 ¥98.7 ¥505.8
Outside Directors (Total: 2) 28.8 8.1 36.9
Corporate Auditors (Total: 2) 63.0 — 63.0
Outside Auditors (Total: 3) 32.0 — 32.0

43Group Management
Accounting Auditor CompensationIn fiscal 2009, audit fees payable to the accounting auditor amounted
to ¥192 million for an attestation agreement and ¥2 million in other
compensation.
5. Internal Control SystemResponse to the Financial Products Transaction Law (Japanese SOX Act)In response to the Japanese SOX Act, Asahi Breweries, Ltd. has put an
evaluation and reporting framework in place that includes a set of
guidelines, “Basic Regulations for Evaluation and Reporting of Inter-
nal Control for Financial Reporting,” and the establishment of the
Internal Control Evaluation Office as an organization to conduct inde-
pendent evaluation of managers.
Based on evaluation results for fiscal 2009, the Company has
determined that, as of December 31, 2009, it has an effective internal
control system with respect to financial reporting. This assessment was
corroborated by an audit of the internal control system performed by
the outside auditors.
Development of Internal Control System Based on the Corporate LawPursuant to Japan’s Corporate Law, in 2006, Asahi Breweries, Ltd.
established the Basic Principles for Establishing an Internal Control
System. In drafting these Basic Principles, we analyzed and evaluated
the current system at Asahi Breweries, Ltd. and the Asahi Breweries
Group to determine the proper course of action. Based on these Basic
Principles, we are presently developing an internal control system that
will encompass the entire Asahi Breweries Group. With respect to both
risk management and compliance, we are establishing systems and
guidelines that reflect the Basic Principles as we conduct control
activities (see p. 44 for more details). All major Group companies,
specifically Asahi Soft Drinks Co., Ltd., Wakodo Co., Ltd., The Nikka
Whisky Distilling Co., Ltd., and Asahi Food & Healthcare Co., Ltd.,
have also drafted their own basic principles in this area.
In 2009, we added language to the Basic Principles for Establishing
an Internal Control System regarding zero tolerance of criminal organiza-
tions and our internal control system with respect to financial reporting.
Going forward, we anticipate that business growth will trigger
expansion in both the number of Group companies and the regions
where we operate. This growth notwithstanding, we are committed to
extensively embedding our internal control system throughout the
entire Group. At the same time, we will constantly strive to remain
aware of regulatory reforms and social trends in each business and
operating region, responding proactively to any changes that emerge.
6. Renewal of Takeover Defense MeasuresWith the approval of the shareholders at the 83rd Annual Sharehold-
ers’ Meeting held on March 27, 2007, Asahi Breweries, Ltd. adopted
countermeasures against the large-scale purchase of its shares (“take-
over defense measures”). The takeover defense measures define pro-
cedures for measures to be taken in the event that the Company
becomes the target of a large-scale attempt to purchase its shares.
Such measures include (1) requiring the person conducting the pur-
chase (“the purchaser”) to provide necessary and sufficient informa-
tion in advance, (2) securing the time necessary for gathering and
examining information concerning the purchase, and (3) presenting
management’s own plan or an alternative proposal to shareholders of
the Company, or conducting negotiations with the purchaser.
The potential for abusive share purchases remains a risk in
Japan’s current legal framework. Asahi Breweries, Ltd. believes it
should therefore continue to maintain highly transparent procedures
capable of providing shareholders with sufficient information and
decision-making opportunity should the Company suddenly become
the target of a large-scale attempt to purchase its shares. Accordingly,
with the approval of shareholders, Asahi Breweries, Ltd. renewed its
takeover defense measures at the 86th Annual Shareholders’ Meeting
held on March 26, 2010.

44
In 2006, the Asahi Breweries Group established the Asahi Breweries
Group Risk Management Principal Rules and the Risk Management
Procedures. The Principal Rules define the basic issues related to risk
management. The Risk Management Procedures define specific man-
agement processes based on the Principal Rules. The goal in drafting
these rules and procedures is to prevent all types of risks surrounding
the business and to strengthen our risk management system for
responding to emergency situations in order to realize a stable and
sustainable business foundation.
The Asahi Breweries Risk Management Committee, established in
line with the Group Principal Rules, is comprised of four directors and
one executive officer. The committee meets at least once a year to dis-
cuss and decide guidelines for related activities as a whole, as well as
priority measures to be taken, based on the results of a risk survey, and
reviews the content of measures and the progress of plans concerning
major risks. The committee also maintains close contact with supervi-
sors and staff responsible for promoting risk management in each
department at Head Office and in each major business unit within the
Group. The goal here is to conduct preventive activities at the organiza-
tional level to avoid the occurrence of risks on a daily basis.
In 2009, the committee focused mainly on measures to address
new strains of influenza.
Asahi Breweries, Ltd. promotes compliance throughout the Group
under the leadership of the Asahi Breweries Group Corporate Ethics
Committee—comprising directors, executive officers and legal advi-
sors—by appointing trained compliance promotion staff in each place
of business and Group company, providing thorough training on the
Business Ethics Rule and enhancing awareness of compliance among
employees.
The Group has appointed Legal Promoters (LPs), Senior Legal
Promoters (SLPs), and Legal Promoters for Governmental Regulations
(GLPs) to further strengthen our compliance structure. Appointees to
each of these positions are selected from among the Group’s regular
employees. As of the end of 2009, approximately 130 LPs, 30 SLPs
and 30 GLPs have been assigned.
Together with efforts to upgrade and enhance training and semi-
nars, questionnaires and other activities, we are taking steps to further
embed the Group’s in-depth approach to compliance. Through compli-
ance training targeting LPs in particular in 2009, we were able to
create deeper understanding of the most up-to-date know-how relating
to compliance initiatives targeting the environment, business partners,
employees, and other stakeholders.
Risk Management Compliance
Secretariat
Asahi Breweries Risk Management Committee
Head Office Departments
Business Unit (including Group Companies)
Asahi Breweries Group Corporate Ethics Committee
Secretariat
General Manager in Charge of Legal Management
General Manager, General Affairs and Legal Management Department
General Affairs and Legal Department
Head Office Managers
Legal Promoter for Governmental Regulations
Senior Legal Promoter (SLP)
Legal Promoter (LP)
Business Units Managers(including Group companies)
Business Unit: Manager, General Affairs and Secretary Department
Business Unit: Managers
COMPLIAnCE PROMOTIOn SYSTEMRISK MAnAGEMEnT PROMOTIOn SYSTEM

45Group Management
Board of Directors, Auditors and Corporate Officers (As of March 26, 2010)
1. Hitoshi OgitaChairman of the Board
2. naoki IzumiyaPresident
3. Kazuo MotoyamaExecutive Vice President
4. Masatoshi TakahashiSenior Managing Director and Senior Managing Corporate Officer
5. Akiyoshi KojiManaging Director and Managing Corporate Officer
6. noriyuki KarasawaManaging Director and Managing Corporate Officer
7. Katsuyuki KawatsuraManaging Director and Managing Corporate Officer
8. Toshihiko nagaoDirector and Corporate Officer
9. Toshio MoriDirector and Corporate Officer
10 Toshio KodatoDirector and Corporate Officer
11. Yoshihiro TonozukaDirector and Corporate Officer
12. nobuo YamaguchiDirector
13. Mariko BandoDirector
14. naoki TanakaDirector
Managing Corporate OfficersYuji NinomiyaAkira MatsunobuFumio YamasakiKenji TaniguchiMasafumi TaninoTakayoshi KanayaHideaki Takemoto
Standing Corporate AuditorsYoshihiro GotoYoshifumi Nishino
Outside AuditorsTakahide SakuraiNaoto NakamuraTadashi Ishizaki
Corporate OfficersMakoto SugiuraNorio NaitoShoji TsumuraTakami MaruyamaKatsutoshi TakahashiShinichi HiranoSeiichi IshikawaKenkichi AokiHirohisa ShibuyaMasaru Nohara
Hiroshi KatagiriKazunori ShibataShiro IkedaKiminari MarutaYukihiro ShiraishiYukio KakegaiKazuya ArakedaHiroshi KawashitaYoshihide Okuda
Board of Directors
Auditors Corporate Officers
1
3
7
11
5
9
13 14
2
4
8
12
6
10

46
CSR Policy of the Asahi Breweries Group (Drafted January 2010)
The Asahi Breweries Group, through its business activities worldwide, is committed to
contributing to the development of a sustainable society.
In addition to strict compliance with all relevant laws and rules in the countries and
regions where the Group operates, we voluntarily and vigorously promote activities designed to
fulfill our social responsibility from a global perspective.
Beyond these actions, we strive through the creation of new social value to deliver
enjoyment in ways that people across the globe can partake in.
With this goal in mind, we work together with those around us to consider our best course
to achieving this end, followed by appropriate action.
Corporate Social Responsibility (CSR)
The Asahi Breweries Group and CSRThe Asahi Breweries Group is committed to striving to transform the bounty of nature into the “Kando” of food while becoming a trusted company
with global quality. Guided by this approach, we conduct corporate activities in ways that uphold our corporate philosophy of pursuing customer
satisfaction. In all business activities worldwide, we are determined to meet our social responsibility as a corporate citizen through environmentally
and socially conscious business actions. At the same time, we strive to create social value, and work to promote the sustainable development of
both society and the Asahi Breweries Group.

47Group Management
The Asahi Breweries Group Statement on BiodiversityIn its business activities, the Asahi Breweries Group makes use of water,
grains, and other natural resources. As such, the Group has formulated
the Statement on Biodiversity, designed to respect biodiversity and pro-
tect the bounties of nature so that we can pass them on to the next gen-
eration. Under this declaration, we will act in a biodiversity- conscious
manner based on the three core policies of protecting the natural envi-
ronments where plants and ani-
mals live, valuing the bounties of
nature, and working together with
people around the world.
In formulating this statement
the Asahi Breweries Group estab-
lished a Biodiversity Committee.
The committee evaluated the ways
in which the Group shares and
applies knowledge related to bio-
diversity, and considered what
path the Group should take going
forward. After further verification
from experts and relevant third
parties, the Group as a whole will
promote activities that take biodiversity into account.
In addition, four Group companies—Asahi Breweries, Ltd., Asahi
Soft Drinks Co., Ltd., Asahi Food & Healthcare Co., Ltd. and Wakodo Co.,
Ltd.—have launched a joint project for product development that takes
into account the environments and connections between living things.
Formulation of the Asahi Breweries Group Environmental Vision 2020In March 2010, the Asahi Breweries Group formulated Environmental
Vision 2020 to strengthen environmental preservation activities
throughout the Group. In order to realize a sustainable society for the
future, the Group will place importance on working to reduce the envi-
ronmental burden of its production and business activities and value
its relationships with the individuals in society, including the next gen-
eration. With this goal in view, the Group as a whole will promote initia-
tives to preserve the environment.
Product Development Project
Asahi Breweries Asahi Soft Drinks
Asahi Food & HealthcareWakodo
Reduce CO2
Build a low-carbon society
Protect the Bounties of NaturePreserve biodiversity
The business of the Asahi Breweries Group revolves
around harnessing water, grains, and other natural resources.
When the global environment and human society are sustainable,
we can deliver safe and reliable products to our customers.
Companies and consumers alike need to respond quickly and
concretely to the current global environmental changes.
It is the common mission of the human race to build a
society that can coexist with the global environment.
To contribute to the realization of a sustainable society,
the Asahi Breweries Group will actively work to address
environmental issues, based on the four themes of
building a low-carbon society, building a recycling-oriented society,
preserving biodiversity, and raising awareness of the bounties of nature.
Asahi Breweries GroupEnvironmental Vision 2020
Bringing the Best of Nature to Tomorrow
Four Themes
Recycle ResourcesBuild a recycling-oriented society
Communicate the Importance of NatureRaise awareness of the bounties of nature
840,000 tons
5% reduction
10% reduction
Reduce CO2 emissions volume of the
Asahi Breweries Group by
30%
(Tons)
20080
100,000
200,000
300,000
400,000
500,000
600,000
700,000
800,000
900,000
2012 2015 2020 (Year)
CO2 EMISSIOnS VOLUME OF THE ASAHI BREWERIES GROUP

48
Appropriate Drinking HabitsSince ancient times, alcoholic beverages have been produced around
the world as a cultural asset that brings delight and pleasure into daily
life. At the same time, however, inappropriate drinking habits are asso-
ciated with a number of social problems.
The Asahi Breweries Group believes it is our serious responsibility
as an alcoholic beverage maker to lead the way in solving these prob-
lems. In 2004, this commitment culminated in the drafting of The
Asahi Breweries Group’s Basic Philosophy for Promotion of Moderate &
Responsible Drinking. Based on this philosophy, we are developing
alliances within the industry to prevent problems associated with
improper drinking habits such as underage drinking, drunk driving,
drinking during pregnancy, and binge drinking, in addition to taking
steps Group-wide to raise awareness against improper drinking.
In 2009, Asahi continued its participation in the “STOP! Under-
age Drinking” campaign run by the Brewers Association of Japan, pro-
moting awareness among both adults and minors. In addition, Asahi
Breweries has created a pamphlet distributed free of charge each year
in April to incoming college students in Japan. The company has also
created a free educational tool for primary school students. In 2009,
the tool won the Outstanding Performance Award in the Printed
Material Division of the 7th Consumer Education Material Recognition
held by the National Institute on Consumer Education.
Social Contribution“Refreshingly Sustainable” ProjectLeveraging the sales scope of Asahi Super Dry, a beer brand that has
sold over 100 million cases*1, Asahi Breweries, Ltd. has been developing
its “Refreshingly Sustainable” Project as a unique social contribution
activity since 2009. Promoted in
each of Japan’s 47 prefectures,
the project donates ¥1 for each
eligible item*2 sold in each pre-
fecture to the protection and
preservation of the local environ-
ment and cultural treasures.
The project was imple-
mented twice, in the spring and in
the fall of 2009. The initial spring
campaign netted ¥219,792,528
in donations nationwide. For the fall campaign, this figure was
¥460,952,200, resulting in a grand total of more than ¥680,744,728 in
donations for the entire year.
Asahi Breweries will run the project twice again in the spring and
fall of 2010, and plans to continue in 2011 as well. In conjunction
with the campaign, Asahi Breweries actively encourages employees to
volunteer locally as part of ongoing efforts to contribute to the com-
munity through its business activities.
*1 One case is equivalent to 20 bottles (633ml each).*2 Initial campaign: 500ml and 350ml cans; Second campaign: 500ml and
350ml cans and large (633ml) and medium (500ml) bottles.
Total Donation
First Project ¥219,792,528
Second Project ¥460,952,200

494949Financial Section
50 Eleven-Year Summary
52 Management’s Discussion and Analysis
62 Consolidated Balance Sheets
64 Consolidated Statements of Income
65 Consolidated Statements of Changes in Net Assets
66 Consolidated Statements of Cash Flows
67 Notes to Consolidated Financial Statements
86 Independent Auditors’ Report
Financial Section
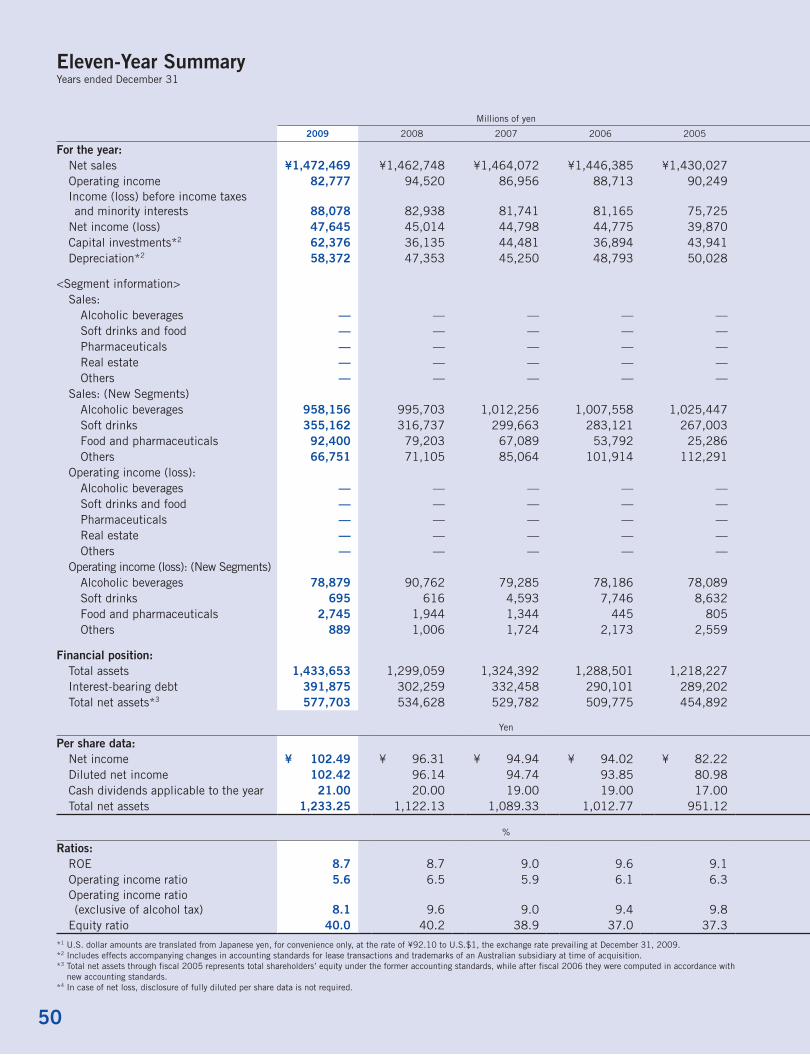
50
Millions of yen Millions of yenThousands of U.S. dollars*1
2009 2008 2007 2006 2005 2004 2003 2002 2001 2000 1999 2009
For the year: Net sales ¥1,472,469 ¥1,462,748 ¥1,464,072 ¥1,446,385 ¥1,430,027 ¥1,444,226 ¥1,400,302 ¥1,375,267 ¥1,433,364 ¥1,399,108 ¥1,396,898 $15,987,720 Operating income 82,777 94,520 86,956 88,713 90,249 101,273 78,984 69,341 77,777 76,550 80,122 898,773 Income (loss) before income taxes and minority interests 88,078 82,938 81,741 81,165 75,725 58,369 48,681 32,483 18,611 (18,116) 15,038 956,330 Net income (loss) 47,645 45,014 44,798 44,775 39,870 30,596 23,210 14,754 13,617 (15,707) 4,082 517,318 Capital investments*2 62,376 36,135 44,481 36,894 43,941 40,134 38,184 41,257 64,829 66,518 63,149 677,264 Depreciation*2 58,372 47,353 45,250 48,793 50,028 51,339 53,101 51,546 52,901 51,790 43,840 633,789
<Segment information> Sales: Alcoholic beverages — — — — — — — — 1,179,412 1,127,737 1,114,441 — Soft drinks and food — — — — — — — — 201,772 216,191 229,704 — Pharmaceuticals — — — — — — — — — — — — Real estate — — — — — — — — 3,058 4,194 3,897 — Others — — — — — — — — 49,122 50,986 48,856 — Sales: (New Segments) Alcoholic beverages 958,156 995,703 1,012,256 1,007,558 1,025,447 1,078,931 1,067,136 1,057,029 1,101,620 10,403,431 Soft drinks 355,162 316,737 299,663 283,121 267,003 217,380 185,738 173,773 192,526 3,856,265 Food and pharmaceuticals 92,400 79,203 67,089 53,792 25,286 22,163 21,547 14,232 14,561 1,003,257 Others 66,751 71,105 85,064 101,914 112,291 125,752 125,881 130,233 124,657 724,767 Operating income (loss): Alcoholic beverages — — — — — — — — 92,635 86,774 86,037 — Soft drinks and food — — — — — — — — (1,485) 2,009 6,972 — Pharmaceuticals — — — — — — — — — — — — Real estate — — — — — — — — 1,833 2,717 1,623 — Others — — — — — — — — (816) (758) 94 — Operating income (loss): (New Segments) Alcoholic beverages 78,879 90,762 79,285 78,186 78,089 90,872 72,452 69,145 76,809 856,449 Soft drinks 695 616 4,593 7,746 8,632 8,114 2,645 (4,086) (2,079) 7,546 Food and pharmaceuticals 2,745 1,944 1,344 445 805 (599) 169 8 406 29,804 Others 889 1,006 1,724 2,173 2,559 2,935 3,399 3,855 2,476 9,653
Financial position: Total assets 1,433,653 1,299,059 1,324,392 1,288,501 1,218,227 1,250,818 1,244,410 1,294,738 1,341,103 1,389,827 1,405,507 15,566,265 Interest-bearing debt 391,875 302,259 332,458 290,101 289,202 303,089 336,285 402,206 417,167 503,371 502,327 4,254,896 Total net assets*3 577,703 534,628 529,782 509,775 454,892 417,828 398,153 387,539 385,965 356,009 383,474 6,272,562
Yen Yen U.S. dollars
Per share data: Net income ¥ 102.49 ¥ 96.31 ¥ 94.94 ¥ 94.02 ¥ 82.22 ¥ 62.52 ¥ 46.80 ¥ 28.90 ¥ 27.00 ¥ (31.54) ¥ 8.20 $ 1.11 Diluted net income 102.42 96.14 94.74 93.85 80.98 60.64 44.58 27.46 25.25 —*4 8.11 1.11 Cash dividends applicable to the year 21.00 20.00 19.00 19.00 17.00 15.00 13.00 13.00 13.00 12.00 12.00 0.23 Total net assets 1,233.25 1,122.13 1,089.33 1,012.77 951.12 860.66 810.19 770.86 752.25 715.04 777.04 13.39
% %
Ratios: ROE 8.7 8.7 9.0 9.6 9.1 7.5 5.9 3.8 3.7 (4.2) 1.1 Operating income ratio 5.6 6.5 5.9 6.1 6.3 7.0 5.6 5.0 5.4 5.5 5.7 Operating income ratio (exclusive of alcohol tax) 8.1 9.6 9.0 9.4 9.8 11.4 9.2 8.3 9.0 9.2 9.7 Equity ratio 40.0 40.2 38.9 37.0 37.3 33.4 32.0 29.9 28.8 25.6 27.3
*1 U.S. dollar amounts are translated from Japanese yen, for convenience only, at the rate of ¥92.10 to U.S.$1, the exchange rate prevailing at December 31, 2009.*2 Includes effects accompanying changes in accounting standards for lease transactions and trademarks of an Australian subsidiary at time of acquisition.*3 Total net assets through fiscal 2005 represents total shareholders’ equity under the former accounting standards, while after fiscal 2006 they were computed in accordance with
new accounting standards.*4 In case of net loss, disclosure of fully diluted per share data is not required.
Eleven-Year SummaryYears ended December 31

51Financial Section
Millions of yen Millions of yenThousands of U.S. dollars*1
2009 2008 2007 2006 2005 2004 2003 2002 2001 2000 1999 2009
For the year: Net sales ¥1,472,469 ¥1,462,748 ¥1,464,072 ¥1,446,385 ¥1,430,027 ¥1,444,226 ¥1,400,302 ¥1,375,267 ¥1,433,364 ¥1,399,108 ¥1,396,898 $15,987,720 Operating income 82,777 94,520 86,956 88,713 90,249 101,273 78,984 69,341 77,777 76,550 80,122 898,773 Income (loss) before income taxes and minority interests 88,078 82,938 81,741 81,165 75,725 58,369 48,681 32,483 18,611 (18,116) 15,038 956,330 Net income (loss) 47,645 45,014 44,798 44,775 39,870 30,596 23,210 14,754 13,617 (15,707) 4,082 517,318 Capital investments*2 62,376 36,135 44,481 36,894 43,941 40,134 38,184 41,257 64,829 66,518 63,149 677,264 Depreciation*2 58,372 47,353 45,250 48,793 50,028 51,339 53,101 51,546 52,901 51,790 43,840 633,789
<Segment information> Sales: Alcoholic beverages — — — — — — — — 1,179,412 1,127,737 1,114,441 — Soft drinks and food — — — — — — — — 201,772 216,191 229,704 — Pharmaceuticals — — — — — — — — — — — — Real estate — — — — — — — — 3,058 4,194 3,897 — Others — — — — — — — — 49,122 50,986 48,856 — Sales: (New Segments) Alcoholic beverages 958,156 995,703 1,012,256 1,007,558 1,025,447 1,078,931 1,067,136 1,057,029 1,101,620 10,403,431 Soft drinks 355,162 316,737 299,663 283,121 267,003 217,380 185,738 173,773 192,526 3,856,265 Food and pharmaceuticals 92,400 79,203 67,089 53,792 25,286 22,163 21,547 14,232 14,561 1,003,257 Others 66,751 71,105 85,064 101,914 112,291 125,752 125,881 130,233 124,657 724,767 Operating income (loss): Alcoholic beverages — — — — — — — — 92,635 86,774 86,037 — Soft drinks and food — — — — — — — — (1,485) 2,009 6,972 — Pharmaceuticals — — — — — — — — — — — — Real estate — — — — — — — — 1,833 2,717 1,623 — Others — — — — — — — — (816) (758) 94 — Operating income (loss): (New Segments) Alcoholic beverages 78,879 90,762 79,285 78,186 78,089 90,872 72,452 69,145 76,809 856,449 Soft drinks 695 616 4,593 7,746 8,632 8,114 2,645 (4,086) (2,079) 7,546 Food and pharmaceuticals 2,745 1,944 1,344 445 805 (599) 169 8 406 29,804 Others 889 1,006 1,724 2,173 2,559 2,935 3,399 3,855 2,476 9,653
Financial position: Total assets 1,433,653 1,299,059 1,324,392 1,288,501 1,218,227 1,250,818 1,244,410 1,294,738 1,341,103 1,389,827 1,405,507 15,566,265 Interest-bearing debt 391,875 302,259 332,458 290,101 289,202 303,089 336,285 402,206 417,167 503,371 502,327 4,254,896 Total net assets*3 577,703 534,628 529,782 509,775 454,892 417,828 398,153 387,539 385,965 356,009 383,474 6,272,562
Yen Yen U.S. dollars
Per share data: Net income ¥ 102.49 ¥ 96.31 ¥ 94.94 ¥ 94.02 ¥ 82.22 ¥ 62.52 ¥ 46.80 ¥ 28.90 ¥ 27.00 ¥ (31.54) ¥ 8.20 $ 1.11 Diluted net income 102.42 96.14 94.74 93.85 80.98 60.64 44.58 27.46 25.25 —*4 8.11 1.11 Cash dividends applicable to the year 21.00 20.00 19.00 19.00 17.00 15.00 13.00 13.00 13.00 12.00 12.00 0.23 Total net assets 1,233.25 1,122.13 1,089.33 1,012.77 951.12 860.66 810.19 770.86 752.25 715.04 777.04 13.39
% %
Ratios: ROE 8.7 8.7 9.0 9.6 9.1 7.5 5.9 3.8 3.7 (4.2) 1.1 Operating income ratio 5.6 6.5 5.9 6.1 6.3 7.0 5.6 5.0 5.4 5.5 5.7 Operating income ratio (exclusive of alcohol tax) 8.1 9.6 9.0 9.4 9.8 11.4 9.2 8.3 9.0 9.2 9.7 Equity ratio 40.0 40.2 38.9 37.0 37.3 33.4 32.0 29.9 28.8 25.6 27.3
*1 U.S. dollar amounts are translated from Japanese yen, for convenience only, at the rate of ¥92.10 to U.S.$1, the exchange rate prevailing at December 31, 2009.*2 Includes effects accompanying changes in accounting standards for lease transactions and trademarks of an Australian subsidiary at time of acquisition.*3 Total net assets through fiscal 2005 represents total shareholders’ equity under the former accounting standards, while after fiscal 2006 they were computed in accordance with
new accounting standards.*4 In case of net loss, disclosure of fully diluted per share data is not required.

52
Management’s Discussion and Analysis
Overview
Market TrendsIn the fiscal year ended December 31, 2009, Japan’s economy contin-
ued to face harsh economic conditions, marked by steady deterioration
in the employment environment and lackluster consumer spending in
the wake of the global financial crisis that originated in the United
States. The trajectory of these metrics remained largely unchanged
despite signs that the economy is headed toward recovery, thanks to
government-backed economic stimulus measures.
In the alcoholic beverages industry, while sales of new genre bev-
erages rose substantially, reflecting more conservative consumer
spending habits due to weak economic conditions, sales of beer and
happoshu faltered. As a result, sales in the overall market for beer-type
beverages ended 2.1% lower year on year on a taxable shipment
volume basis. Sales in alcoholic beverages other than beer-type bever-
ages were flat overall, despite revitalized performance in the market for
whisky and spirits.
In the soft drinks industry, overall industry sales volume is esti-
mated to have declined by around 3%, attributed mainly to economic
weakness and irregular weather during the summer.
In this climate, the Asahi Breweries Group worked during the final
year of its Third Medium-Term Management Plan to enhance the Group
management base in several ways. In addition to strengthening each
segment, key actions designed to establish growth and earnings bases
for the Group’s next generation of businesses included efforts to
develop an optimal production system not limited by any single busi-
ness framework.
Net SalesIn fiscal 2009, net sales for the Asahi Breweries Group increased ¥9.7
billion, or 0.7%, year on year, to ¥1,472.5 billion ($15,987.7 million).
Sales in the alcoholic beverages business declined ¥37.5 billion,
or 3.8% year on year, to ¥958.2 billion, largely reflecting lower sales
for beer-type beverages. In the soft drinks business, sales rose ¥38.4
billion, or 12.1%, to ¥355.2 billion, while sales in the food business
increased ¥13.2 billion, or 16.7%, to ¥92.4 billion.
In sales composition by segment, the alcoholic beverages busi-
ness saw its share decrease from 68.1% in the previous fiscal year to
65.1%, while the soft drinks business’ share increased from 21.7% to
24.1%, and the food business’ share increased from 5.4% to 6.3%.
Sales from the alcoholic beverages business and the soft drinks
business include net sales from the Group’s overseas business. Overseas
sales increased ¥35.2 billion, or 81.3%, year on year, to ¥78.5 billion,
primarily from the recent consolidation of Schweppes Australia.
Operating IncomeFor the consolidated fiscal year, operating income decreased ¥11.7
billion, or 12.4%, year on year, to ¥82.8 billion. This result owed to
several factors, including lower sales volume in the alcoholic beverages
business, a higher cost of sales accompanying revisions to Japan’s tax
system, increased depreciation costs due to revisions to the years of
useful life for property, plant and equipment, and an increased burden
for amortization of goodwill in the soft drinks business related to
Schweppes Australia.05 06 07 08 09
29.3
56.4
27.825.1 24.5
23.320.1
15.9
55.6
19.3
55.2
20.2
53.1
23.7
50.6
0
20
40
100
80
60
PRODuCT ShARE IN ThE BEER-TYPE BEvERAgES MARkET BY gENRE
(%)
Beer Happoshu New genre
* Based on taxable shipments
05 06 07 08 09
92.466.8
1,025.4
267.0 283.1 299.7 316.7 355.225.3
112.3
1,007.6
53.8
101.9
1,012.3
67.185.1
995.7
79.271.1
958.2
0
400
800
1,600
1,200
NET SAlES BY SEgMENT
(¥ billion)
Alcoholic beverages Soft drinks Food and pharmaceuticals
Others
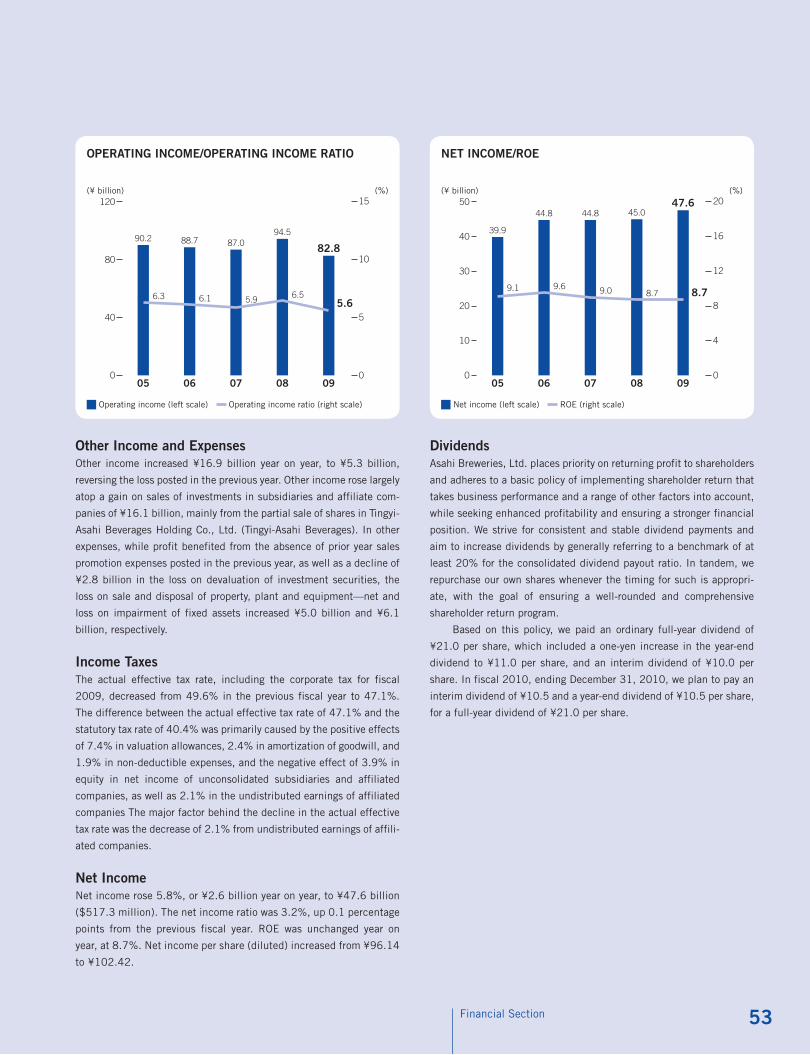
53Financial Section
Other Income and ExpensesOther income increased ¥16.9 billion year on year, to ¥5.3 billion,
reversing the loss posted in the previous year. Other income rose largely
atop a gain on sales of investments in subsidiaries and affiliate com-
panies of ¥16.1 billion, mainly from the partial sale of shares in Tingyi-
Asahi Beverages Holding Co., Ltd. (Tingyi-Asahi Beverages). In other
expenses, while profit benefited from the absence of prior year sales
promotion expenses posted in the previous year, as well as a decline of
¥2.8 billion in the loss on devaluation of investment securities, the
loss on sale and disposal of property, plant and equipment—net and
loss on impairment of fixed assets increased ¥5.0 billion and ¥6.1
billion, respectively.
Income TaxesThe actual effective tax rate, including the corporate tax for fiscal
2009, decreased from 49.6% in the previous fiscal year to 47.1%.
The difference between the actual effective tax rate of 47.1% and the
statutory tax rate of 40.4% was primarily caused by the positive effects
of 7.4% in valuation allowances, 2.4% in amortization of goodwill, and
1.9% in non-deductible expenses, and the negative effect of 3.9% in
equity in net income of unconsolidated subsidiaries and affiliated
companies, as well as 2.1% in the undistributed earnings of affiliated
companies The major factor behind the decline in the actual effective
tax rate was the decrease of 2.1% from undistributed earnings of affili-
ated companies.
Net IncomeNet income rose 5.8%, or ¥2.6 billion year on year, to ¥47.6 billion
($517.3 million). The net income ratio was 3.2%, up 0.1 percentage
points from the previous fiscal year. ROE was unchanged year on
year, at 8.7%. Net income per share (diluted) increased from ¥96.14
to ¥102.42.
DividendsAsahi Breweries, Ltd. places priority on returning profit to shareholders
and adheres to a basic policy of implementing shareholder return that
takes business performance and a range of other factors into account,
while seeking enhanced profitability and ensuring a stronger financial
position. We strive for consistent and stable dividend payments and
aim to increase dividends by generally referring to a benchmark of at
least 20% for the consolidated dividend payout ratio. In tandem, we
repurchase our own shares whenever the timing for such is appropri-
ate, with the goal of ensuring a well-rounded and comprehensive
shareholder return program.
Based on this policy, we paid an ordinary full-year dividend of
¥21.0 per share, which included a one-yen increase in the year-end
dividend to ¥11.0 per share, and an interim dividend of ¥10.0 per
share. In fiscal 2010, ending December 31, 2010, we plan to pay an
interim dividend of ¥10.5 and a year-end dividend of ¥10.5 per share,
for a full-year dividend of ¥21.0 per share.
05 06 07 08 09
82.8
6.3
90.2
6.1
88.7
5.9
87.0
6.5
94.5
5.6
0
40
80
120
0
5
10
15
OPERATINg INCOME/OPERATINg INCOME RATIO
(¥ billion) (%)
Operating income (left scale) Operating income ratio (right scale)
05 06 07 08 09
47.6
9.1
39.9
9.6
44.8
9.0
44.8
8.7
45.0
8.7
0
10
20
50
40
30
0
4
8
20
16
12
NET INCOME/ROE
(¥ billion) (%)
Net income (left scale) ROE (right scale)
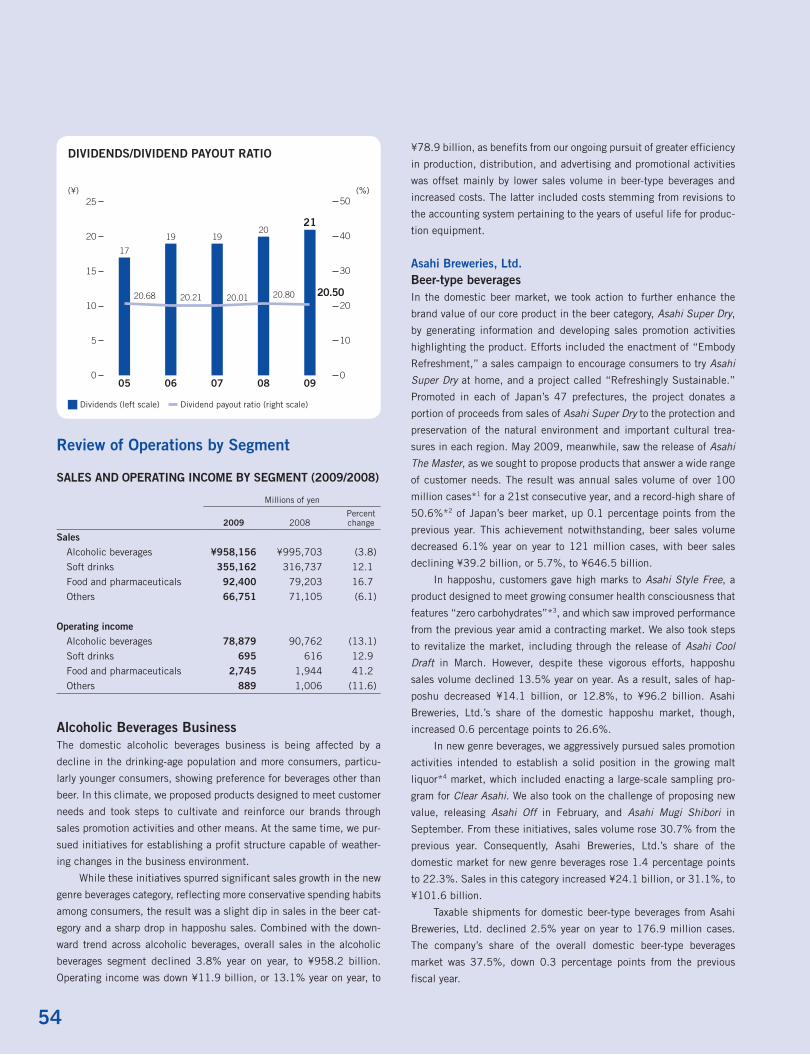
54
Review of Operations by Segment
SAlES AND OPERATINg INCOME BY SEgMENT (2009/2008)
Millions of yen
2009 2008Percent change
Sales Alcoholic beverages ¥958,156 ¥995,703 (3.8)
Soft drinks 355,162 316,737 12.1
Food and pharmaceuticals 92,400 79,203 16.7
Others 66,751 71,105 (6.1)
Operating income Alcoholic beverages 78,879 90,762 (13.1)
Soft drinks 695 616 12.9
Food and pharmaceuticals 2,745 1,944 41.2
Others 889 1,006 (11.6)
Alcoholic Beverages BusinessThe domestic alcoholic beverages business is being affected by a
decline in the drinking-age population and more consumers, particu-
larly younger consumers, showing preference for beverages other than
beer. In this climate, we proposed products designed to meet customer
needs and took steps to cultivate and reinforce our brands through
sales promotion activities and other means. At the same time, we pur-
sued initiatives for establishing a profit structure capable of weather-
ing changes in the business environment.
While these initiatives spurred significant sales growth in the new
genre beverages category, reflecting more conservative spending habits
among consumers, the result was a slight dip in sales in the beer cat-
egory and a sharp drop in happoshu sales. Combined with the down-
ward trend across alcoholic beverages, overall sales in the alcoholic
beverages segment declined 3.8% year on year, to ¥958.2 billion.
Operating income was down ¥11.9 billion, or 13.1% year on year, to
¥78.9 billion, as benefits from our ongoing pursuit of greater efficiency
in production, distribution, and advertising and promotional activities
was offset mainly by lower sales volume in beer-type beverages and
increased costs. The latter included costs stemming from revisions to
the accounting system pertaining to the years of useful life for produc-
tion equipment.
Asahi Breweries, ltd.Beer-type beveragesIn the domestic beer market, we took action to further enhance the
brand value of our core product in the beer category, Asahi Super Dry,
by generating information and developing sales promotion activities
highlighting the product. Efforts included the enactment of “Embody
Refreshment,” a sales campaign to encourage consumers to try Asahi
Super Dry at home, and a project called “Refreshingly Sustainable.”
Promoted in each of Japan’s 47 prefectures, the project donates a
portion of proceeds from sales of Asahi Super Dry to the protection and
preservation of the natural environment and important cultural trea-
sures in each region. May 2009, meanwhile, saw the release of Asahi
The Master, as we sought to propose products that answer a wide range
of customer needs. The result was annual sales volume of over 100
million cases*1 for a 21st consecutive year, and a record-high share of
50.6%*2 of Japan’s beer market, up 0.1 percentage points from the
previous year. This achievement notwithstanding, beer sales volume
decreased 6.1% year on year to 121 million cases, with beer sales
declining ¥39.2 billion, or 5.7%, to ¥646.5 billion.
In happoshu, customers gave high marks to Asahi Style Free, a
product designed to meet growing consumer health consciousness that
features “zero carbohydrates”*3, and which saw improved performance
from the previous year amid a contracting market. We also took steps
to revitalize the market, including through the release of Asahi Cool
Draft in March. However, despite these vigorous efforts, happoshu
sales volume declined 13.5% year on year. As a result, sales of hap-
poshu decreased ¥14.1 billion, or 12.8%, to ¥96.2 billion. Asahi
Breweries, Ltd.’s share of the domestic happoshu market, though,
increased 0.6 percentage points to 26.6%.
In new genre beverages, we aggressively pursued sales promotion
activities intended to establish a solid position in the growing malt
liquor*4 market, which included enacting a large-scale sampling pro-
gram for Clear Asahi. We also took on the challenge of proposing new
value, releasing Asahi Off in February, and Asahi Mugi Shibori in
September. From these initiatives, sales volume rose 30.7% from the
previous year. Consequently, Asahi Breweries, Ltd.’s share of the
domestic market for new genre beverages rose 1.4 percentage points
to 22.3%. Sales in this category increased ¥24.1 billion, or 31.1%, to
¥101.6 billion.
Taxable shipments for domestic beer-type beverages from Asahi
Breweries, Ltd. declined 2.5% year on year to 176.9 million cases.
The company’s share of the overall domestic beer-type beverages
market was 37.5%, down 0.3 percentage points from the previous
fiscal year.
05 06 07 08 09
21
20.68
17
20.21
19
20.01
19
20.80
20
20.50
0
5
10
25
20
15
0
10
20
50
40
30
DIvIDENDS/DIvIDEND PAYOuT RATIO
(¥) (%)
Dividends (left scale) Dividend payout ratio (right scale)

55Financial Section
As a result, sales of beer-type beverages declined ¥29.2 billion,
or 3.3% from the previous year, to ¥844.3 billion.
*1 One case is equivalent to 20 large bottles (663ml each).*2 Beer market share based on statistical data on taxable shipment volume
from Japan’s top five beer companies.*3 Based on nutrition labeling standards, sugar content of less than 0.5g
(per 100ml) is indicated as “zero carbohydrate.”*4 “Malt liquor” refers to a new wheat beverage genre that blends malt-
based happoshu (malt content of less than 50%) with wheat-based spirits (liquor).
Alcoholic beverages other than beer-type beveragesOverall sales of other alcoholic beverages—shochu, RTD beverages,
whisky and spirits, and wine—decreased ¥6.6 billion, or 5.1%, to
¥123.1 billion. As customer needs in this area diversify, we worked to
cultivate uniquely advantaged leading brands while making progress
on profit structure reform, which focused largely on striving to use
advertising and sales promotion expenses more efficiently. As a result
of these efforts, we achieved an operating income ratio of 6%.
ShochuFor shochu, we vigorously pursued sales promotion activities targeting
core brands Kanoka and Satsuma Tsukasa, with the goal of enhancing
our position in the brisk markets for Ko- and Otsu-type shochu blends
and potato shochu. Despite these efforts, however, sales declined
4.6% year on year to ¥50.3 billion.
Ready-to-Drink (RTD) beveragesIn Ready-to-Drink (RTD) beverages, sales were firm for Asahi Slat, a
well-received beverage that has both juicy bits of fruit and the lowest
number of calories*1 in its class. Elsewhere, we took steps to propose
a full lineup of products alongside our core products Asahi Cocktail
Partner and Asahi Shunka Shibori. Nevertheless, sales fell 2.7% year
on year to ¥30.6 billion.
Whisky and SpiritsIn whisky and spirits, brisk sales of core brand Black Nikka Clear Blend
continued, leading to year-on-year growth for a third consecutive year.
The quality of the Nikka brand, moreover, was recognized on the world
stage when Taketsuru 21 Years Old was named “World’s Best Blended
Malt Whisky” at the World Whiskies Awards*2 in April 2009, and
received the highest honor in the whisky category at the International
Spirits Challenge*3 in October. These accolades notwithstanding, sales
decreased 5.5% from the previous year to ¥26.0 billion.
WineIn wine, we revamped our Antioxidant-Free Organic Wine series of
domestic wines to further groom the Sainte Neige brand. For imported
wines, along with handling the Lanson champagne brand for the first
time, we strove to expand sales through more robust brand appeal and
a diverse product lineup centered on key brands like Baron Philippe
de Rothschild and Louis Latour. However, sales declined 16.3% to
¥12.4 billion.
*1 Based on comparison of products sold in the canned chu-hi market as of December 2009.
*2 An international contest focused exclusively on whisky, chiefly sponsored by U.K.-based Whisky Magazine.
*3 An international contest covering the full range of spirits, chiefly spon-sored by Drinks International, an exclusive publisher of alcoholic beverage-related material based in the U.K.
Overseas Alcoholic Beverages BusinessIn the overseas alcoholic beverages business, we acquired shares in
Tsingtao Brewery Company Limited (Tsingtao Brewery) enabling Asahi
Breweries to build an evolving, long-term partnering relationship with
Tsingtao Brewery. Accordingly, we moved to strengthen this strategic
partnership in our beer business in China, for one that takes optimal
advantage of Tsingtao Brewery’s brand power and firm business base
in China’s beer market, together with our own skills in production,
quality management, and product development technology.
26.6%
56.8%
41.7%13.4%
23.3%
5.2%11.0%
14.0%
8.2%
50.6%
26.6%
22.3%
BEER-TYPE BEvERAgES BY ShARE (2009)
Asahi Breweries Company A Company B Company C
Beer
happoshu
New genre
05 06 07 08 09
101.6
123.1
726.2
147.4108.6 124.7 110.3 96.2
45.9
133.4
718.1
67.2
135.3
705.5
61.7
136.4
685.7
77.5
129.7
646.5
0
300
600
1,200
900
SAlES BY CATEgORY (BEER, hAPPOShu, NEw gENRE, AND OThER AlCOhOlIC BEvERAgES)
(¥ billion)
Beer Happoshu New genre Other alcoholic beverages
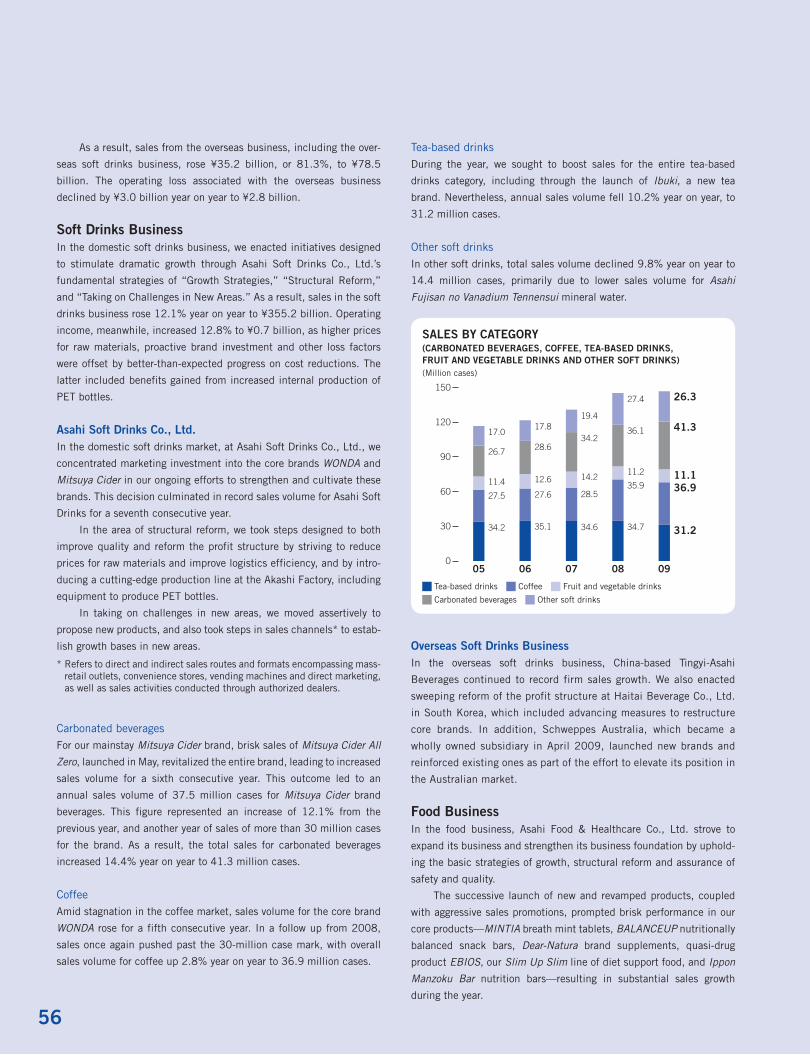
56
As a result, sales from the overseas business, including the over-
seas soft drinks business, rose ¥35.2 billion, or 81.3%, to ¥78.5
billion. The operating loss associated with the overseas business
declined by ¥3.0 billion year on year to ¥2.8 billion.
Soft Drinks BusinessIn the domestic soft drinks business, we enacted initiatives designed
to stimulate dramatic growth through Asahi Soft Drinks Co., Ltd.’s
fundamental strategies of “Growth Strategies,” “Structural Reform,”
and “Taking on Challenges in New Areas.” As a result, sales in the soft
drinks business rose 12.1% year on year to ¥355.2 billion. Operating
income, meanwhile, increased 12.8% to ¥0.7 billion, as higher prices
for raw materials, proactive brand investment and other loss factors
were offset by better-than-expected progress on cost reductions. The
latter included benefits gained from increased internal production of
PET bottles.
Asahi Soft Drinks Co., ltd.In the domestic soft drinks market, at Asahi Soft Drinks Co., Ltd., we
concentrated marketing investment into the core brands WONDA and
Mitsuya Cider in our ongoing efforts to strengthen and cultivate these
brands. This decision culminated in record sales volume for Asahi Soft
Drinks for a seventh consecutive year.
In the area of structural reform, we took steps designed to both
improve quality and reform the profit structure by striving to reduce
prices for raw materials and improve logistics efficiency, and by intro-
ducing a cutting-edge production line at the Akashi Factory, including
equipment to produce PET bottles.
In taking on challenges in new areas, we moved assertively to
propose new products, and also took steps in sales channels* to estab-
lish growth bases in new areas.
* Refers to direct and indirect sales routes and formats encompassing mass-retail outlets, convenience stores, vending machines and direct marketing, as well as sales activities conducted through authorized dealers.
Carbonated beveragesFor our mainstay Mitsuya Cider brand, brisk sales of Mitsuya Cider All
Zero, launched in May, revitalized the entire brand, leading to increased
sales volume for a sixth consecutive year. This outcome led to an
annual sales volume of 37.5 million cases for Mitsuya Cider brand
beverages. This figure represented an increase of 12.1% from the
previous year, and another year of sales of more than 30 million cases
for the brand. As a result, the total sales for carbonated beverages
increased 14.4% year on year to 41.3 million cases.
CoffeeAmid stagnation in the coffee market, sales volume for the core brand
WONDA rose for a fifth consecutive year. In a follow up from 2008,
sales once again pushed past the 30-million case mark, with overall
sales volume for coffee up 2.8% year on year to 36.9 million cases.
Tea-based drinksDuring the year, we sought to boost sales for the entire tea-based
drinks category, including through the launch of Ibuki, a new tea
brand. Nevertheless, annual sales volume fell 10.2% year on year, to
31.2 million cases.
Other soft drinksIn other soft drinks, total sales volume declined 9.8% year on year to
14.4 million cases, primarily due to lower sales volume for Asahi
Fujisan no Vanadium Tennensui mineral water.
Overseas Soft Drinks BusinessIn the overseas soft drinks business, China-based Tingyi-Asahi
Beverages continued to record firm sales growth. We also enacted
sweeping reform of the profit structure at Haitai Beverage Co., Ltd.
in South Korea, which included advancing measures to restructure
core brands. In addition, Schweppes Australia, which became a
wholly owned subsidiary in April 2009, launched new brands and
reinforced existing ones as part of the effort to elevate its position in
the Australian market.
Food BusinessIn the food business, Asahi Food & Healthcare Co., Ltd. strove to
expand its business and strengthen its business foundation by uphold-
ing the basic strategies of growth, structural reform and assurance of
safety and quality.
The successive launch of new and revamped products, coupled
with aggressive sales promotions, prompted brisk performance in our
core products—MINTIA breath mint tablets, BALANCEUP nutritionally
balanced snack bars, Dear-Natura brand supplements, quasi-drug
product EBIOS, our Slim Up Slim line of diet support food, and Ippon
Manzoku Bar nutrition bars—resulting in substantial sales growth
during the year.
05 06 07 08 09
11.1
41.3
26.3
34.2
27.5 27.6 28.535.9 36.9
11.4
26.7
17.0
35.1
12.6
28.6
17.8
34.6
14.2
34.2
19.4
34.7
11.2
36.1
27.4
31.2
0
30
60
150
120
90
SAlES BY CATEgORY
(CARBONATED BEvERAgES, COFFEE, TEA-BASED DRINkS, FRuIT AND vEgETABlE DRINkS AND OThER SOFT DRINkS)(Million cases)
Tea-based drinks Coffee Fruit and vegetable drinks
Carbonated beverages Other soft drinks

57Financial Section
Wakodo Co., Ltd., meanwhile, pursued initiatives designed to
reinforce its business base and expand business, guided by a manage-
ment policy of “further accelerating growth.” Taking advantage of its
expertise in “infant-safe quality” honed in baby products over the
years as a fundamental strength, Wakodo moved to reinforce its
brands, which included the revamp of several products. Brisk perfor-
mance from mainstay brands, including powdered infant formula
brands Hai Hai and Gun Gun, and baby food brand Goo-Goo Kitchen
resulted in sales growth for the year.
Meanwhile, Amano Jitsugyo Co., Ltd. worked to expand its busi-
ness and boost profitability, with the aim of emerging as the undis-
puted leader in Japan’s freeze-dried food market. In addition to
realizing year-on-year growth in commercial-use sales through out-
sourced production, the company saw significant growth in its direct
marketing business, resulting in record sales for the year. The company
also looked for ways to enhance its own profitability through closer ties
with other Asahi Breweries Group companies.
As a result of the above actions, and with the inclusion of operating
results from Amano Jitsugyo Co., Ltd. and growth in sales of core prod-
ucts, sales in the food business climbed 16.7% year on year to ¥92.4
billion. Operating income rose 41.2% year on year to ¥2.7 billion.
Other BusinessesIn other businesses, sales declined mainly due to the reorganization of
our wholesale business. As a result, total sales for other businesses
decreased 6.1% year on year to ¥66.8 billion and operating income
fell 11.6% year on year to ¥0.9 billion.
Outlook for Fiscal 2010
As the initial year of Medium-Term Management Plan 2012, formu-
lated to realize the Group’s Long-Term Vision 2015, fiscal 2010 will
see management resources channeled into strengthening brands for
core products in each business, and a continued push to enhance cost
competitiveness, in a bid to bolster the earnings power of the entire
Group. Similarly, we will implement optimal financial and cash flow
strategies with the goal of lifting the corporate value of the Asahi
Breweries Group as a whole. In terms of investment, with a focus pri-
marily on the alcoholic beverages and soft drinks businesses, we are
exploring and enacting strategic business investments and business
alliances both domestically and overseas, giving priority to strengthen-
ing our growth base. We will also pursue capital investment opportuni-
ties, with emphasis on creating more efficient production and
distribution systems, and on environmental investment.
Consequently, we are forecasting net sales of ¥1,500.0 billion
(up 1.9% year on year), operating income of ¥96.0 billion (up 16.0%)
and net income of ¥52.0 billion (up 9.1%) for the fiscal year ending
December 31, 2010.
liquidity and Capital Resources
Asahi Breweries, Ltd. gains its capital resources principally from cash
flows generated by operating activities, loans from financial institu-
tions, and the issuance of company bonds, and as a management
policy regards the reduction of interest-bearing debt as a priority issue.
However, we make flexible use of our financial liabilities according to
the need for capital resources to invest. Potential investments include
capital expenditure to enhance the management base and increase
efficiency, and strategic investments such as M&As. When financing
needs arise, we respond with due consideration to procurement meth-
ods that will result in the lowest possible interest cost. Daily financing
needs are, in principle, met through short-term loans and the issuance
of commercial paper.
The Asahi Breweries Group has also introduced a cash manage-
ment service (or CMS) that channels excess funds of each Group com-
pany to Asahi Breweries, Ltd., where these funds are centrally managed.
This service enables the Company to take steps aimed at both improv-
ing capital efficiency and minimizing financing costs.
As a result, the outstanding balance of interest-bearing debt
amounted to ¥391.9 billion as of the end of 2009, up ¥89.6 billion
from the previous fiscal year-end. This balance primarily reflected an
increase in cash flows used in investing activities, mainly for the acqui-
sition of a soft drinks business in Australia and shares of Tsingtao
Brewery. The outstanding balance was approximately one-fourth of its
all-time peak in fiscal 1992. In addition, during the year under review
the debt-equity ratio was 0.7, compared to 4.9 in fiscal 1992.
Asahi Breweries, Ltd. has earned an A+ rating from Rating and
Investment Information, Inc., an AA– rating from the Japan Credit
Rating Agency, Ltd., an A– rating from Standard & Poor’s (S&P), and
an A– rating from Fitch Ratings, Ltd.
05 06 07 08 09
391.9
0.64
289.2
0.61
290.1
0.65
332.5
0.58
302.3
0.68
0
100
200
400
300
0
0.3
0.6
1.2
0.9
INTEREST-BEARINg DEBT AND D/E RATIO
(¥ billion) (Times)
Interest-bearing debt (left scale) D/E ratio (right scale)

58
Capital Investments*
Capital investments for the fiscal year ended December 31, 2009,
increased ¥26.2 billion from ¥36.1 billion in the previous fiscal year,
to ¥62.4 billion. This growth resulted primarily from ongoing capital
investment in the alcoholic beverages business, including upgrades to
existing equipment and energy-saving measures; the acquisition in the
soft drinks business of Schweppes Australia trademarks; and strategic
capital investment to enhance production system efficiency in Japan.
Consolidated depreciation* costs totaled ¥58.4 billion.
* Includes effects accompanying changes in accounting standards for lease transactions and trademarks of an Australian subsidiary at time of acquisition.
Assets, liabilities and Net Assets
Consolidated total assets as of the end of fiscal 2009 increased by
¥134.6 billion, or 10.4% compared with the previous fiscal year-end,
to ¥1,433.7 billion ($15,566.3 million). This growth was primarily
due to the new consolidation of Schweppes Australia from the acquisi-
tion of a soft drinks business in Australia, and an increase in invest-
ment securities from the acquisition of shares in Tsingtao Brewery.
Return on assets (ROA) deteriorated 0.8 points to 6.6%.
Current assets increased ¥15.7 billion, or 3.8%, year on year, to
¥428.0 billion. This was mainly due to an increase in cash and time
deposits, and in notes and accounts receivable. Trade receivable turn-
over was 5.5 times, compared to 5.4 times in the previous fiscal year.
Inventories turnover was 15.1 times, a decline of 0.5 percentage
points from 15.6 times recorded for the previous year.
Property, plant and equipment decreased ¥7.7 billion, or 1.3%,
year on year, to ¥599.1 billion, as a result of an increase in accumu-
lated depreciation, despite increases in machinery and equipment
mainly from the consolidation of Schweppes Australia. Investments
and other assets increased ¥126.6 billion, or 45.2% year on year, to
¥406.5 billion, mainly reflecting an increasing in goodwill due to the
consolidation of Schweppes Australia and an increase in investment
securities from the acquisition of shares in Tsingtao Brewery.
Total liabilities increased ¥91.5 billion, or 12.0%, from the previ-
ous fiscal year-end, to ¥855.9 billion. Current liabilities increased
¥57.7 billion, or 11.2% year on year, to ¥573.8 billion. This reflected
a 50.7% rise in bank loans, a 35.6% increase in long-term debt due
within one year, and a 4.3-fold increase in commercial paper. Long-
term liabilities rose ¥33.8 billion, or 13.6%, to ¥282.2 billion, pri-
marily due to an increase of 8.3% in company bonds and a 26.8%
increase in long-term debt.
Total net assets increased ¥43.1 billion, or 8.1%, to ¥577.7
billion. Shareholders’ equity minus minority interests was ¥573.5 bil-
lion, up ¥51.9 billion, or 9.9%, compared to ¥521.6 billion in the
previous fiscal year. This resulted from an increase in retained earnings
from the posting of consolidated net income, along with an increase in
foreign currency translation adjustments, primarily from exchange rate
fluctuations for the Australian dollar.
As a result, the equity ratio declined 0.2 percentage points to
40.0%.
05 06 07 08 09
62.4
50.0 48.845.3 47.4
58.4
43.9
36.9
44.5
36.1
0
20
40
80
60
CAPITAl INvESTMENTS AND DEPRECIATION
(¥ billion)
Capital investments Depreciation
05 06 07 08 09
1,433.7
7.4
1,218.2
7.2
1,288.5
6.9
1,324.4
7.4
1,299.1
6.6
0
500
1,000
1,500
0
4
8
12
TOTAl ASSETS AND ROA
(¥ billion) (%)
Total assets (left scale) ROA (right scale)

59Financial Section
Cash Flows
For the fiscal year ended December 31, 2009, net cash provided by
operating activities increased ¥0.3 billion year on year to ¥106.4
billion. This result came despite increased corporate tax payments,
and was due in large part to an increase in income before income taxes
and minority interests and in interest and dividend income.
Net cash used in investing activities went primarily toward acquir-
ing a soft drinks business in Australia and the acquisition of shares in
Tsingtao Brewery. Consequently, outflows for investing activities
increased ¥122.4 billion from the previous year to ¥180.6 billion.
Net cash provided by financing activities increased ¥124.9
billion year on year to ¥78.5 billion, primarily from capital procured
for M&A activity.
As a result, cash and cash equivalents at the fiscal year-end
increased ¥5.4 billion to ¥18.1 billion.
Research and Development
R&D expenses for the year under review were ¥9.3 billion, represent-
ing an increase of 2.9% year on year.
05 06 07 08 09
15.1
5.4
16.7
5.4
16.2
5.3
16.0
5.4
15.6
5.5
0
5
10
20
15
TRADE RECEIvABlE TuRNOvER AND INvENTORIES TuRNOvER
(Times)
Trade receivable turnover Inventories turnover
05 06 07 08 09
577.7
37.3
454.9
37.0
509.8
38.9
529.8
40.2
534.6
40.0
0
150
300
600
450
0
20
40
80
60
TOTAl NET ASSETS AND EquITY RATIO
(¥ billion) (%)
Total net assets (left scale) Equity ratio (right scale)
05 06 07 08 09
106.4
–180.6
–44.5 –35.7
–82.2
–22.2
–117.8
36.1
–58.2–46.4
78.587.2105.8
69.6
106.1
–250
–200
–150
150
100
50
–50
–100
0
CASh FlOwS
(¥ billion)
Cash flows from operating activities Cash flows from investing activities Cash flows from financing activities
05 06 07 08 09
9,342
8,292 8,484 8,6279,075
0
2,000
4,000
10,000
8,000
6,000
R&D ExPENSES
(¥ million)

60
Business Risk
1. Effects of market and economic trends and demographic change in Japan
The alcoholic beverages business accounts for approximately 65% of
sales for the Asahi Breweries Group, a considerable portion of which is
generated by the Japanese market. Future trends in the Japanese
economy may have a significant effect on domestic consumption of
alcoholic beverages. Furthermore, a continually declining population,
fewer childbirths and the ongoing aging of the Japanese population
may affect consumption of soft drinks and food as well as alcoholic
beverages, and in turn may affect the business performance and finan-
cial condition of the Asahi Breweries Group.
2. Higher liquor tax ratesIn the event that consumption tax or liquor tax rates are raised,
consumption of alcoholic beverages, soft drinks, or foods and phar-
maceuticals may decline due to higher sales prices, potentially
affecting the business performance and financial condition of the
Asahi Breweries Group.
3. Dependence on a specific productBeer-type beverage sales constitute an important part of sales for the
Asahi Breweries Group. The Asahi Breweries Group endeavors to
increase sales by improving its lineup of products for alcoholic bever-
ages apart from beer-type beverages, while also expanding businesses
other than the alcoholic beverages business, including soft drinks, and
food and pharmaceuticals. Nevertheless, unforeseen circumstances,
such as a significant drop in consumption of beer-type beverages due
to trends in market demand, may affect the business performance and
financial condition of the Asahi Breweries Group.
4. Food safetyThe Asahi Breweries Group upholds its management principle of deliv-
ering the highest quality to customers, and ensures food safety by
implementing an uncompromising system of inspection and control
throughout the Group. Nevertheless, the food industry currently faces
various problems, including bird flu, BSE, residual agricultural chemi-
cals, genetic engineering and the proper indication of allergy causing
substances. The Asahi Breweries Group is strengthening its efforts to
proactively identify such risks, and to implement countermeasures
before they materialize. Nevertheless, the occurrence of incidents
beyond the scope of such measures implemented by the Group may
affect the business performance and financial condition of the Asahi
Breweries Group.
5. Fluctuations in material pricesThe prices of main raw materials used for Asahi Breweries Group prod-
ucts fluctuate according to such factors as weather conditions and
natural disasters. Rising costs may lead to higher production costs that
cannot be passed on to sales prices depending on prevailing market
conditions, and may affect the business performance and financial
condition of the Asahi Breweries Group.
6. Effects of weather conditions, natural disasters and othersWith respect to the alcoholic beverage and soft drink sales of the Asahi
Breweries Group, stagnant markets caused by abnormal weather or vari-
able weather conditions may affect the volume of sales. Furthermore,
sudden occurrences of various catastrophes, natural disasters and
unforeseeable accidents that could damage production and logistics
facilities may result in loss of assets, the reporting of losses on unshipped
products, expenditures on facility repairs and opportunity loss due to
disruptions in production and logistics, and in turn, affect the business
performance and financial condition of the Asahi Breweries Group.
7. Risks related to information systemsThe Asahi Breweries Group possesses personal information on a great
number of customers obtained through sales promotion campaigns,
direct marketing and other activities. To prevent such information from
being lost, misused or falsified, the Group implements appropriate
security measures related to the system and other aspects of informa-
tion management. Nevertheless, the occurrence of unpredictable inci-
dents including power outages, disasters, defective software or
equipment, computer virus infections and illegal access may present
risks including the breakdown, shutdown or temporary disruption of the
information system, and therefore, could cause the erasure, leakage or
falsification of internal information, including customer information.
Such incidents may impede operations and in turn affect the business
performance and financial condition of the Asahi Breweries Group.
8. Risks related to overseas operationsThe Asahi Breweries Group pursues business operations in Asia and
Oceania, mainly in China, as well as in Europe and North America. The
Group endeavors to proactively identify risks and to implement concrete
and appropriate countermeasures before they materialize. Nevertheless,
occurrences of incidents such as those listed below, which are unfore-
seeable or beyond the scope of prediction, may affect the business per-
formance and financial condition of the Asahi Breweries Group.
• Unpredictable revisions in the tax system, laws and regulations
• Changes in political and economic factors
• Social and economic disruption caused by the outbreak of epidemics
such as SARS or bird flu
• Changes in the market or foreign exchange rates that are beyond
prediction
• Social and economic disruption caused by acts of terrorism or war
• Occurrence of natural disasters such as earthquakes

61Financial Section
9. Risks related to the environmentAsahi Breweries Group endeavors to thoroughly implement waste recy-
cling, energy conservation, reduction of CO2 emissions and the recy-
cling of containers, and complies with the relevant environmental laws
and regulations while conducting its businesses. Nevertheless, regula-
tory revisions that drive significant increases in costs due to invest-
ments in new facilities and changes in methods of waste disposal may
affect the business performance and financial condition of the Asahi
Breweries Group.
10. Risks related to changes in laws and regulationsIn pursuing its businesses in Japan, the Asahi Breweries Group is
placed under the regulatory control of various laws, including the
Liquor Tax Law, the Food Sanitation Law and the Product Liability Law.
The Group also operates under the control of laws and regulations in
other countries in which it operates. Changes in such laws and regula-
tions, or the unexpected introduction of new laws and regulations may
affect the business performance and financial condition of the Asahi
Breweries Group.
11. Trends in the control of alcoholic beveragesTo fulfill its corporate social responsibility (CSR) as a company that
produces and sells alcoholic beverages, the Asahi Breweries Group
exercises the utmost care in expressions used in advertisements and
information on container labels, and is actively involved in educating
the public on responsible drinking to prevent underage drinking and
consumption by pregnant and breast-feeding women. Nevertheless,
considering that problems related to alcohol have become an interna-
tional issue, regulations that significantly exceed expectations and
result in a decline in consumption may affect the business perfor-
mance and financial condition of the Asahi Breweries Group.
12. Risks related to litigationIn pursuing its businesses, the Asahi Breweries Group complies with
relevant regulations and makes the utmost effort to ensure employees
understand and practice regulatory compliance. Nevertheless, the
Group faces risks of litigation in undertaking its businesses both in
Japan and abroad. Lawsuits against the Asahi Breweries Group and/or
the impact of such lawsuits may affect the business performance and
financial condition of the Asahi Breweries Group.
13. Fluctuations in value of owned assetsSudden drops in the value of land, marketable securities and other
assets owned by the Asahi Breweries Group, or changes in the business
environment, could affect the business performance and financial
condition of the Asahi Breweries Group.
14. Retirement benefitsRetirement benefit liabilities and retirement benefit costs for employ-
ees and former employees of the Asahi Breweries Group are calculated
based on the discount rate used in actuarial calculations and the rate
of expected returns on pension assets. Major fluctuations in precondi-
tions, including changes in the market price of pension assets, interest
rates and/or pension system, may affect the business performance and
financial condition of the Asahi Breweries Group.
15. Business and capital alliancesThe Asahi Breweries Group pursues business and capital alliances with
companies in Japan and overseas to establish bases for growth in line
with its medium-term management plan. There is the possibility, how-
ever, that these alliances could fail to yield synergies as initially pro-
jected due to the impact of changes in the business environment on
the Asahi Breweries Group, its alliance partners, or companies in which
the Group is invested, or other factors. Moreover, changes of this kind
in the business environment could cause deterioration in the busi-
nesses, management, or financial condition of alliance partners and
invested companies. Adverse effects of this type could negatively
impact the businesses, operating results and financial condition of the
Asahi Breweries Group.
Furthermore, the need to amortize a substantial amount of goodwill
stemming from investment, or to post significant impairment losses
caused by slumping business performance at invested companies, could
adversely affect the operating results of the Asahi Breweries Group.

62
Millions of yen
Thousands of U.S. dollars
(Note 1)
Assets 2009 2008 2007 2009
Current assets: Cash and time deposits (Notes 3 and 8) ¥ 19,584 ¥ 12,772 ¥ 11,628 $ 212,639 Notes and accounts receivable: Trade 274,559 265,048 278,239 2,981,097 Other 13,721 18,019 13,209 148,979 Allowance for doubtful accounts (7,666) (6,045) (6,576) (83,236) Securities (Note 5) — 302 52 — Inventories (Note 4) 97,442 97,040 90,436 1,058,002 Deferred income tax assets (Note 10) 11,176 9,009 6,931 121,346 Other current assets (Note 3) 19,232 16,199 17,293 208,817 Total current assets 428,048 412,344 411,212 4,647,644
Property, plant and equipment (Notes 8 and 13): Land 184,433 185,202 180,760 2,002,530 Buildings and structures 416,591 413,984 413,711 4,523,247 Machinery and equipment 657,872 633,995 632,142 7,143,018 Others 10,572 — — 114,788 Construction in progress 6,382 6,090 3,447 69,294
1,275,850 1,239,271 1,230,060 13,852,877 Less accumulated depreciation (676,742) (632,479) (607,341) (7,347,904) Net property, plant and equipment 599,108 606,792 622,719 6,504,973
Investments and other assets: Goodwill (Note 13) 100,314 60,676 65,326 1,089,185 Investment securities (Note 5) 83,989 88,237 104,067 911,933 Investments in unconsolidated subsidiaries and affiliated companies (Note 5) 124,476 58,402 56,575 1,351,531 Long-term loans receivable 4,976 6,034 5,759 54,029 Deferred income tax assets (Note 10) 21,021 24,212 18,983 228,241 Other non-current assets 71,721 42,362 39,751 778,729 Total investments and other assets 406,497 279,923 290,461 4,413,648
¥1,433,653 ¥1,299,059 ¥1,324,392 $15,566,265
See accompanying notes.
Consolidated Balance SheetsAsahi Breweries, Ltd. and Consolidated SubsidiariesYears ended December 31, 2009, 2008 and 2007
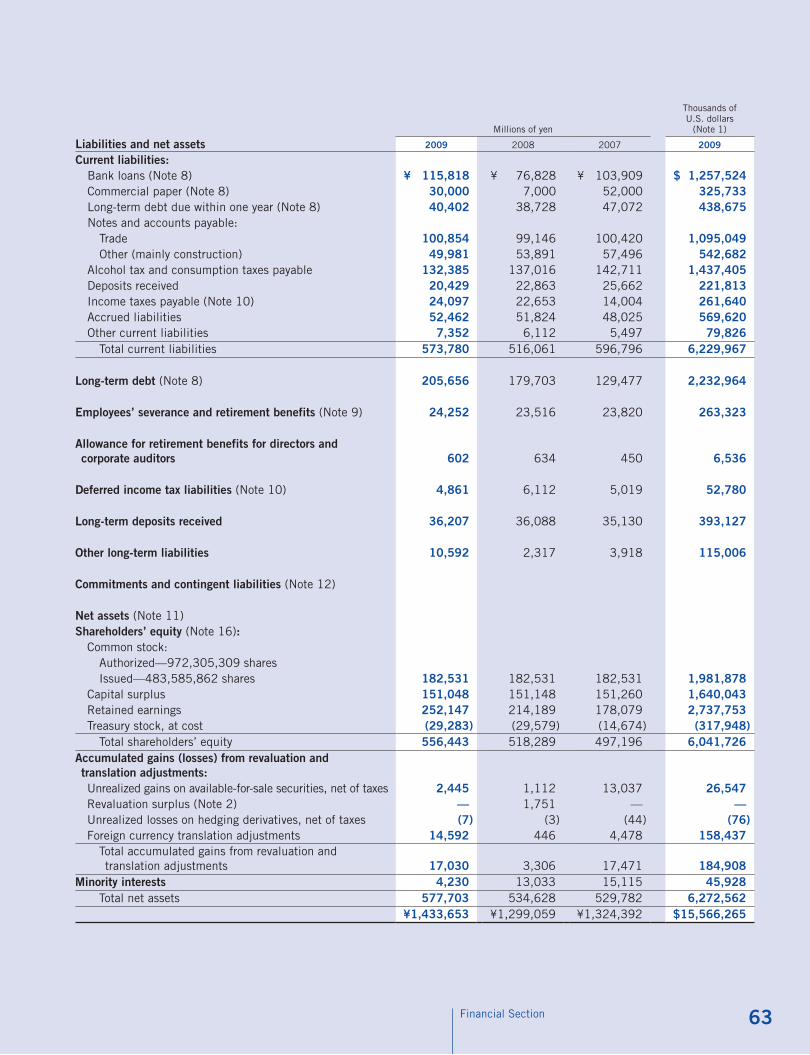
63Financial Section
Millions of yen
Thousands of U.S. dollars
(Note 1)
liabilities and net assets 2009 2008 2007 2009
Current liabilities: Bank loans (Note 8) ¥ 115,818 ¥ 76,828 ¥ 103,909 $ 1,257,524 Commercial paper (Note 8) 30,000 7,000 52,000 325,733 Long-term debt due within one year (Note 8) 40,402 38,728 47,072 438,675 Notes and accounts payable: Trade 100,854 99,146 100,420 1,095,049 Other (mainly construction) 49,981 53,891 57,496 542,682 Alcohol tax and consumption taxes payable 132,385 137,016 142,711 1,437,405 Deposits received 20,429 22,863 25,662 221,813 Income taxes payable (Note 10) 24,097 22,653 14,004 261,640 Accrued liabilities 52,462 51,824 48,025 569,620 Other current liabilities 7,352 6,112 5,497 79,826 Total current liabilities 573,780 516,061 596,796 6,229,967
long-term debt (Note 8) 205,656 179,703 129,477 2,232,964
Employees’ severance and retirement benefits (Note 9) 24,252 23,516 23,820 263,323
Allowance for retirement benefits for directors and corporate auditors 602 634 450 6,536
Deferred income tax liabilities (Note 10) 4,861 6,112 5,019 52,780
long-term deposits received 36,207 36,088 35,130 393,127
Other long-term liabilities 10,592 2,317 3,918 115,006
Commitments and contingent liabilities (Note 12)
Net assets (Note 11)Shareholders’ equity (Note 16): Common stock: Authorized—972,305,309 shares Issued—483,585,862 shares 182,531 182,531 182,531 1,981,878 Capital surplus 151,048 151,148 151,260 1,640,043 Retained earnings 252,147 214,189 178,079 2,737,753 Treasury stock, at cost (29,283) (29,579) (14,674) (317,948) Total shareholders’ equity 556,443 518,289 497,196 6,041,726Accumulated gains (losses) from revaluation and translation adjustments: Unrealized gains on available-for-sale securities, net of taxes 2,445 1,112 13,037 26,547 Revaluation surplus (Note 2) — 1,751 — — Unrealized losses on hedging derivatives, net of taxes (7) (3) (44) (76) Foreign currency translation adjustments 14,592 446 4,478 158,437 Total accumulated gains from revaluation and translation adjustments 17,030 3,306 17,471 184,908Minority interests 4,230 13,033 15,115 45,928 Total net assets 577,703 534,628 529,782 6,272,562
¥1,433,653 ¥1,299,059 ¥1,324,392 $15,566,265

64
Millions of yen
Thousands of U.S. dollars
(Note 1)2009 2008 2007 2009
Net sales (Note 18) ¥1,472,469 ¥1,462,748 ¥1,464,072 $15,987,720
Costs and expenses (Note 18): Cost of sales 508,293 479,999 466,592 5,518,925 Alcohol tax 450,151 473,487 494,589 4,887,633 Selling, general and administrative expenses 431,248 414,742 415,935 4,682,389
1,389,692 1,368,228 1,377,116 15,088,947Operating income (Note 18) 82,777 94,520 86,956 898,773
Other income (expenses): Interest and dividend income 2,756 1,798 2,048 29,924 Interest expenses (4,629) (5,194) (5,021) (50,261) Equity in net income of unconsolidated subsidiaries and affiliated companies 8,512 9,106 9,011 92,421 Gain (loss) on sale of securities—net (Note 5) (99) 32 (701) (1,075) Gain on sales of investments in subsidiaries and affiliated companies 16,090 — — 174,702 Loss on sale and disposal of property, plant and equipment—net (9,176) (4,213) (5,441) (99,631) Gain (loss) on foreign currency exchange 1,815 (1,245) — 19,707 Loss on devaluation of investment securities (788) (3,598) (344) (8,556) Prior year sales promotion expenses (Note 14) — (3,114) — — Loss on adjustment to estimated usage ratio of gift coupons — — (1,545) — Loss on impairment of fixed assets (Notes 13 and 18) (8,318) (2,197) (1,388) (90,315) Other—net (862) (2,957) (1,834) (9,359)
5,301 (11,582) (5,215) 57,557Income before income taxes and minority interests 88,078 82,938 81,741 956,330Income taxes (Note 10): Current 42,370 39,574 31,227 460,043 Deferred (899) 1,548 5,543 (9,761)
41,471 41,122 36,770 450,282Income before minority interests 46,607 41,816 44,971 506,048
Minority interests in net gain (loss) of consolidated subsidiaries 1,038 3,198 (173) 11,270
Net income ¥ 47,645 ¥ 45,014 ¥ 44,798 $ 517,318
YenU.S. dollars
(Note 1)2009 2008 2007 2009
Amounts per share of common stock: Net income ¥102.49 ¥96.31 ¥94.94 $1.11 Diluted net income 102.42 96.14 94.74 1.11 Cash dividends applicable to the year 21.00 20.00 19.00 0.23
See accompanying notes.
Consolidated Statements of IncomeAsahi Breweries, Ltd. and Consolidated SubsidiariesYears ended December 31, 2009, 2008 and 2007
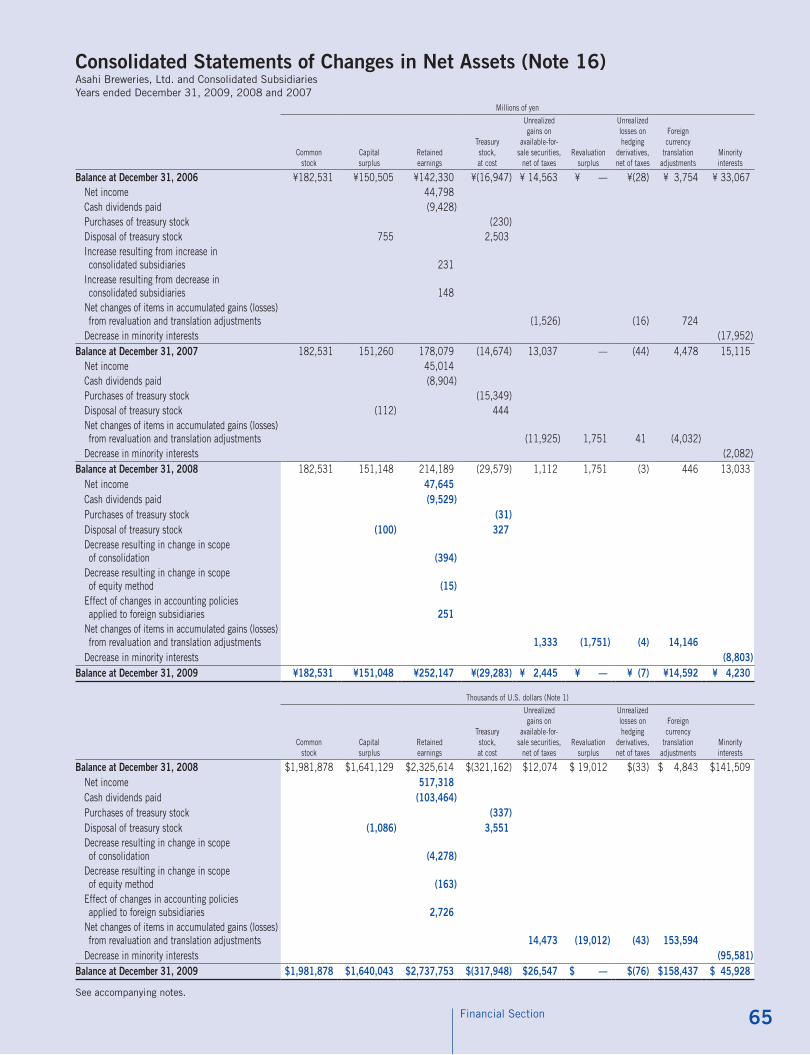
65Financial Section
Millions of yen
Common stock
Capital surplus
Retained earnings
Treasury stock, at cost
Unrealized gains on
available-for- sale securities,
net of taxesRevaluation
surplus
Unrealized losses on hedging
derivatives, net of taxes
Foreign currency
translation adjustments
Minority interests
Balance at December 31, 2006 ¥182,531 ¥150,505 ¥142,330 ¥(16,947) ¥ 14,563 ¥ — ¥(28) ¥ 3,754 ¥ 33,067 Net income 44,798 Cash dividends paid (9,428) Purchases of treasury stock (230) Disposal of treasury stock 755 2,503 Increase resulting from increase in consolidated subsidiaries 231 Increase resulting from decrease in consolidated subsidiaries 148 Net changes of items in accumulated gains (losses) from revaluation and translation adjustments (1,526) (16) 724 Decrease in minority interests (17,952)Balance at December 31, 2007 182,531 151,260 178,079 (14,674) 13,037 — (44) 4,478 15,115 Net income 45,014 Cash dividends paid (8,904) Purchases of treasury stock (15,349) Disposal of treasury stock (112) 444 Net changes of items in accumulated gains (losses) from revaluation and translation adjustments (11,925) 1,751 41 (4,032) Decrease in minority interests (2,082)Balance at December 31, 2008 182,531 151,148 214,189 (29,579) 1,112 1,751 (3) 446 13,033 Net income 47,645 Cash dividends paid (9,529) Purchases of treasury stock (31) Disposal of treasury stock (100) 327 Decrease resulting in change in scope of consolidation (394) Decrease resulting in change in scope of equity method (15) Effect of changes in accounting policies applied to foreign subsidiaries 251 Net changes of items in accumulated gains (losses) from revaluation and translation adjustments 1,333 (1,751) (4) 14,146 Decrease in minority interests (8,803)Balance at December 31, 2009 ¥182,531 ¥151,048 ¥252,147 ¥(29,283) ¥ 2,445 ¥ — ¥ (7) ¥14,592 ¥ 4,230
Thousands of U.S. dollars (Note 1)
Common stock
Capital surplus
Retained earnings
Treasury stock, at cost
Unrealized gains on
available-for- sale securities,
net of taxesRevaluation
surplus
Unrealized losses on hedging
derivatives, net of taxes
Foreign currency
translation adjustments
Minority interests
Balance at December 31, 2008 $1,981,878 $1,641,129 $2,325,614 $(321,162) $12,074 $ 19,012 $(33) $ 4,843 $141,509 Net income 517,318 Cash dividends paid (103,464) Purchases of treasury stock (337) Disposal of treasury stock (1,086) 3,551 Decrease resulting in change in scope of consolidation (4,278) Decrease resulting in change in scope of equity method (163) Effect of changes in accounting policies applied to foreign subsidiaries 2,726 Net changes of items in accumulated gains (losses) from revaluation and translation adjustments 14,473 (19,012) (43) 153,594 Decrease in minority interests (95,581)Balance at December 31, 2009 $1,981,878 $1,640,043 $2,737,753 $(317,948) $26,547 $ — $(76) $158,437 $ 45,928
See accompanying notes.
Consolidated Statements of Changes in Net Assets (Note 16)Asahi Breweries, Ltd. and Consolidated SubsidiariesYears ended December 31, 2009, 2008 and 2007

66
Millions of yen
Thousands of U.S. dollars
(Note 1)2009 2008 2007 2009
Cash flows from operating activities: Income before income taxes and minority interests ¥ 88,078 ¥ 82,938 ¥ 81,741 $ 956,330 Depreciation 58,372 47,353 45,250 633,789 Loss on impairment of fixed assets 8,318 2,197 1,388 90,315 Increase (decrease) in provision for employees’ severance and retirement benefits 765 (3,272) (3,908) 8,306 Decrease in allowance for doubtful accounts (754) (530) (3,481) (8,187) Interest and dividend income (2,756) (1,798) (2,048) (29,924) Interest expenses 4,629 5,194 5,021 50,260 Equity in net income of unconsolidated subsidiaries and affiliated companies (8,512) (9,105) (9,011) (92,421) Loss (gain) on sale of securities—net 99 (32) 701 1,075 Loss on devaluation of investment securities 788 3,598 344 8,556 Loss on adjustment to estimated usage ratio of gift coupons — — 1,545 — Gain on sales of investments in subsidiaries and affiliated companies (16,090) — — (174,702) Loss on sale and disposal of property, plant and equipment—net 9,176 4,213 5,441 99,631 Decrease (increase) in notes and accounts receivable (891) 15,576 (2,049) (9,674) Decrease (increase) in inventories 5,043 (6,956) 1,343 54,756 Increase (decrease) in notes and accounts payable (excluding construction) (2,820) (4,105) (2,716) (30,619) Increase (decrease) in accrued alcohol tax payable (4,910) (5,971) 1,833 (53,312) Increase (decrease) in accrued consumption taxes payable 267 422 (132) 2,899 Bonuses paid to directors and corporate auditors (349) (279) (150) (3,789) Other 7,777 12,315 (6,298) 84,442 Subtotal 146,230 141,758 114,814 1,587,731 Interest and dividends received 7,162 2,067 6,479 77,763 Interest paid (4,605) (5,192) (5,200) (50,000) Income taxes paid (42,429) (32,539) (46,520) (460,684) Net cash provided by operating activities 106,358 106,094 69,573 1,154,810Cash flows from investing activities: Payments for time deposits (3,365) (651) (715) (36,536) Proceeds from time deposits 2,243 1,296 35 24,354 Proceeds from sales of securities — 4 5,120 — Payments for purchases of property, plant and equipment (35,120) (36,193) (35,435) (381,325) Proceeds from sale of property, plant and equipment 1,203 743 2,909 13,062 Payments for purchases of intangible assets (23,418) (4,524) (5,969) (254,267) Proceeds from sales of intangible assets 9 1 126 98 Payments for purchases of investment securities (82,838) (8,560) (28,649) (899,436) Proceeds from sale of investment securities 39,330 1,167 333 427,036 Purchase of investments in subsidiaries (15,362) (2,928) (52,091) (166,797) Payments for purchase of investments in subsidiaries resulting in change in scope of consolidation (60,044) (5,420) — (651,944) Proceeds from sale of investments in subsidiaries resulting in change in scope of consolidation — 2,154 — — Payments for sale of investments in subsidiaries resulting in change in scope of consolidation (19) (174) (850) (206) Payments for loans receivable (3,375) (3,234) (3,209) (36,645) Proceeds from collections of loans receivable 2,629 3,585 2,924 28,545 Other (2,511) (5,501) (2,357) (27,264) Net cash used in investing activities (180,638) (58,235) (117,828) (1,961,325)Cash flows from financing activities: Increase (decrease) in bank loans 61,616 (72,095) 66,104 669,012 Repayments of lease obligations (1,124) — — (12,204) Proceeds from long-term debt 42,000 24,148 18,210 456,026 Repayments of long-term debt (19,740) (34,377) (24,773) (214,332) Proceeds from bonds and convertible debentures issued 25,000 70,175 25,000 271,444 Redemption of bonds (20,000) (10,000) (40,000) (217,155) Payments for purchases of treasury stock (31) (15,349) (231) (337) Cash dividends paid (9,529) (8,904) (9,428) (103,464) Cash dividends paid to minority interest in consolidated subsidiaries (61) (98) (435) (662) Contribution from minority interests in consolidated subsidiaries 716 — 321 7,774 Other (302) 135 1,358 (3,279) Net cash provided by (used in) financing activities 78,545 (46,365) 36,126 852,823Effect of exchange rate change on cash and cash equivalents 643 (537) (182) 6,982Net increase (decrease) in cash and cash equivalents 4,908 957 (12,311) 53,290Cash and cash equivalents at beginning of year 12,698 11,741 23,778 137,872Increase in cash and cash equivalents due to change in scope of consolidation 476 — 274 5,168Cash and cash equivalents at end of year (Note 3) ¥ 18,082 ¥ 12,698 ¥ 11,741 $ 196,330
Consolidated Statements of Cash FlowsAsahi Breweries, Ltd. and Consolidated SubsidiariesYears ended December 31, 2009, 2008 and 2007

67Financial Section
1. Basis of Presenting Consolidated Financial Statements
The accompanying consolidated financial statements of Asahi Breweries, Ltd. (the “Company”) and its consolidated subsidiaries have been prepared in accordance with the provisions set forth in the Japanese Financial Instruments and Exchange Law and its related accounting regulations, and in conformity with accounting principles generally accepted in Japan (“Japanese GAAP”), which are different in certain respects as to application and disclosure require-ments of International Financial Reporting Standards.
Prior to the year ended December 31, 2009, the accounts of consolidated overseas subsidiaries are based on their accounting records maintained in conformity with generally accepted accounting principles prevailing in the respective countries of domicile. As discussed in Note 2, the accounts of consoli-dated overseas subsidiaries for the year ended December 31, 2009 are prepared in accordance with either International Financial Reporting Standards or U.S. generally accepted accounting principles, with adjustments for the specified six items as applicable.
The accompanying consolidated financial statements have been reformatted and translated into English with some expanded descriptions from the consolidated financial statements of the Company prepared in accordance with Japanese GAAP and filed with the appropriate Local Finance Bureau of the Ministry of Finance as required by the Financial Instruments and Exchange Law. Certain supplementary information included in the statutory Japanese lan-guage consolidated financial statements is not presented in the accompanying consolidated financial statements.
The translation of the Japanese yen amounts into U.S. dollars is included solely for the convenience of readers outside Japan, using the prevailing exchange rate at December 31, 2009, which was ¥92.10 to U.S. $1.00. The translations should not be construed as representations of what the Japanese yen amounts have been, could have been, or could in the future be when converted into U.S. dollars at this or any other rate of exchange.
2. Significant Accounting Policies
CONSOlIDATIONThe consolidated financial statements include the accounts of the Company and its significant subsidiaries (collectively, the “Companies”) (39 domestic and 16 overseas subsidiaries for 2009, 39 domestic and 11 overseas subsidiaries for 2008, and 40 domestic and 11 overseas subsidiaries for 2007). All signifi-cant intercompany transactions and account balances are eliminated in consolidation.
In the elimination of investments in subsidiaries, the assets and liabilities of subsidiaries, including the portion attributable to minority shareholders, are evaluated using the fair value at the time the Company acquired control of the respective subsidiaries.
Effective January 1, 2009, the Company adopted “Practical Solution on Unification of Accounting Policies Applied to Foreign Subsidiaries for Consoli-dated Financial Statements” ( Practical Issues Task Force (PITF) No. 18 issued by the Accounting Standards Board of Japan (“ASBJ”) on March 17, 2006) which prescribes: PITF No. 18 requires that accounting policies and procedures applied by a parent company and its subsidiaries to similar transactions and events under similar circumstances should, in principle, be unified for the preparation of the consolidated financial statements. PITF No. 18, however, as a tentative measure, allows a parent company to prepare consolidated financial statements using foreign subsidiaries’ financial statements prepared in accor-dance with either International Financial Reporting Standards or U.S. generally accepted accounting principles. In this case, adjustments for the following six items are required in the consolidation process so that their impact on net income are accounted for in accordance with Japanese GAAP unless the impact is not material.(1) Goodwill not subject to amortization(2) Actuarial gains and losses of defined-benefit retirement plans recognized outside profit or loss(3) Capitalized expenditures for research and development activities(4) Fair value measurement of investment properties, and revaluation of property, plant and equipment and intangible assets(5) Retrospective treatment of a change in accounting policies(6) Accounting for net income attributable to minority interests
As a result of adopting PITF No. 18, effective January 1, 2009, retained earnings at January 1, 2009 was decreased by ¥251 million ($2,726 thousand).In addition, as a result, operating income decreased by ¥1,377 million ($14,951 thousand), and income before income taxes and minority interests
decreased by ¥1,416 million ($15,375 thousand) for the year ended December 31, 2009. The effects on segment information are disclosed in Note 18.
gOODwIllThe difference between acquisition cost and net assets acquired is shown as goodwill and amortized over 5 to 20 years on a straight-line basis.
EquITY METhODInvestments in certain unconsolidated subsidiaries and affiliated companies are accounted for by the equity method and, accordingly, stated at cost adjusted for equity in undistributed earnings and losses from the date of acquisition.
Notes to Consolidated Financial StatementsAsahi Breweries, Ltd. and Consolidated Subsidiaries
68
CONSOlIDATED STATEMENTS OF CASh FlOwSIn preparing the consolidated statements of cash flows, cash on hand, readily available deposits and short-term highly liquid investments with maturities of not exceeding three months at the time of purchase are considered to be cash and cash equivalents.
AllOwANCE FOR DOuBTFul ACCOuNTSAllowance for doubtful accounts is provided in an amount sufficient to cover probable losses on collection. It consists of the estimated uncollectible amount with respect to certain identified doubtful receivables and an amount calculated using the actual percentage of collection losses.
SECuRITIESSecurities are classified as (a) securities held for trading purposes (hereafter, “trading securities”), (b) debt securities intended to be held to maturity (here-after, “held-to-maturity debt securities”), (c) equity securities issued by subsidiaries and affiliated companies, or (d) all other securities that are not classified in any of the above categories (hereafter, “available-for-sale securities”). The Companies do not have trading securities.
Held-to-maturity debt securities are stated at amortized cost. Equity securities issued by subsidiaries and affiliated companies which are not consoli-dated nor accounted for using the equity method are stated at moving-average cost.
Available-for-sale securities with available fair market values are stated at fair market value. Unrealized gains and losses on these securities are reported, net of applicable income taxes, as a separate component of net assets. Realized gains and losses on sale of such securities are computed using moving-average cost.
If the market value of held-to-maturity debt securities, equity securities issued by unconsolidated subsidiaries and affiliated companies, and available-for-sale securities, declines significantly, such securities are stated at fair market value and the difference between fair market value and the carrying amount is recognized as a loss in the period of the decline. Debt securities with no available fair market value are stated at amortized cost, net of the amount consid-ered not collectible. If the fair market value of equity securities issued by unconsolidated subsidiaries and affiliated companies not on the equity method is not readily available, such securities should be written down to net asset value with a corresponding charge in the statements of income in the event the net asset value declines significantly. In these cases, such fair market value or the net asset value will be the carrying amount of the securities at the beginning of the next year.
INvENTORIESPrior to January 1, 2009, merchandise, finished goods and work in process were stated at cost determined mainly by the average method, and raw materials and supplies were stated at cost determined mainly by the moving average method. Effective January 1, 2009, the Company and its consolidated domestic subsidiaries adopted a new accounting standard “Accounting Standard for Measurement of Inventories” (ASBJ Statement No. 9 issued on July 5, 2006) and stated them respectively at the lower of cost (average method) or net realizable value and the lower of cost (moving average method) or net realizable value.
The new accounting standard requires that inventories held for sale in the ordinary course of business be measured at the lower of cost or net realizable value, which is defined as the selling price less additional estimated manufacturing costs and estimated direct selling expenses. Replacement cost may be used in place of the net selling value, if appropriate.
As a result of the adoption of the new accounting standard, operating income decreased by ¥1,558 million ($16,916 thousand), and income before income taxes and minority interests decreased by ¥89 million ($966 thousand) for the year ended December 31, 2009.
The effects on segment information are disclosed in Note 18.
PROPERTY, PlANT AND EquIPMENTProperty, plant and equipment are carried substantially at cost. Depreciation is provided by the straight-line method with respect to production facilities and by the declining-balance method with respect to remaining assets, except for the buildings acquired on or after April 1, 1998, which are depreciated using the straight-line method due to the amendments to the Corporation Tax Law. Estimated useful lives of the assets are as follows:
Buildings and structures 3–50 yearsMachinery and equipment 2–20 years
The Company and its consolidated domestic subsidiaries have changed their depreciation methods for assets acquired on and after April 1, 2007 in accordance with fiscal 2007 amendments of the Japanese Corporation Tax Law, the Law to Amend Part of the Income Tax Law (March 30, 2007, Law No. 6) and the Cabinet Order to Amend Part of the Corporation Tax Law (Cabinet Order No. 83, March 30, 2007). The impact of this change on profits or losses was insignificant.
Japanese tax regulations allow a company to defer capital gains on the sale of real estate if the company intends to offset such gains against the cost of newly acquired property, plant and equipment. When such accounting is followed, the cost of the new property, plant and equipment is reduced to the extent of the deferred capital gains, thereby affecting related depreciation charges and accumulated depreciation.
Effective January 1, 2008, due to the revision of the Corporate Tax Law, the allowable depreciation limits of the assets acquired before March 31, 2007 are depreciated evenly over 5 years from the following year when it would be depreciated up to allowable limit for depreciation. As a consequence, operating income and income before income taxes and minority interests decreased by ¥1,978 million for the year ended December 31, 2008, respectively. The effects of this accounting change on segment information are disclosed in Note 18.
In accordance with the Company’s review of the useful lives based on the recent actual usable years when the Corporation Tax Law of Japan was revised, the Company and its consolidated domestic subsidiaries have changed the useful lives for tangible fixed assets in the year ended December 31, 2009. The effect of this change in useful lives on the operating income and income before income taxes and minority interests decreased by ¥5,885 million ($63,898 thousand) for the year ended December 31, 2009. The effects of this change in useful lives on segment information are disclosed in Note 18.
69Financial Section
ACCOuNTINg FOR lEASE TRANSACTIONS AS lESSEEPrior to January 1, 2009, the Company and its consolidated domestic subsidiaries accounted for finance leases which do not transfer ownership of the leased property to the lessees as operating leases with disclosure of certain “as if capitalized” information in the notes to the consolidated financial statements.
Effective January 1, 2009, the Company and its consolidated domestic subsidiaries adopted the “Accounting Standards for Lease Transactions” (ASBJ Statement No. 13, issued on March 30, 2007) and “Guidance on Accounting Standard for Lease Transactions” (ASBJ Guidance No. 16, issued on March 30, 2007) and capitalized finance leases which commenced on and after January 1, 2009, except for certain immaterial or short-term finance leases, which are accounted for as operating leases. As permitted, finance leases which commenced prior to January 1, 2009 and have been accounted for as operating leases, continue to be accounted for as operating leases with disclosure of certain “as if capitalized” information.
Depreciation or amortization expense is calculated by a straight-line method over the lease’s term.The effect of this change on profits or losses is insignificant.
INCOME TAxESThe Companies recognized tax effects of temporary differences between the carrying amounts of assets and liabilities for tax and financial reporting. The asset and liability approach is used to recognize deferred income tax assets and liabilities for the expected future tax consequences of temporary differences.
EMPlOYEES’ SEvERANCE AND RETIREMENT BENEFITSThe Companies’ basic severance and retirement benefits consist of two types of plans; a defined benefit pension plan and an unfunded lump-sum payment plan. In addition, the Company has a defined contribution pension plan and an advance payment system for the employees’ retirement plan.
The liabilities and expenses for severance and retirement benefits are determined based on the amounts actuarially calculated using certain assumptions.The Companies provided allowance for employees’ severance and retirement benefits at the balance sheet date based on the estimated amounts of
projected benefit obligation and the fair value of the plan assets at that date.Actuarial gains and losses are recognized as expenses using the straight-line method over the average of the estimated remaining service lives of mainly
10 years commencing with the following period.Prior service costs are recognized as expenses using the straight-line method over the average of the estimated remaining service lives of mainly 10 years.
AllOwANCE FOR RETIREMENT BENEFITS FOR DIRECTORS AND CORPORATE AuDITORSDirectors and corporate auditors of certain consolidated subsidiaries are entitled, in most circumstances, to lump-sum severance payments based on current rates of pay, length of services and certain other factors. These consolidated subsidiaries accrue 100% of obligations based on their rules required under the assumption that all directors and corporate auditors retired at the balance sheet date. Payments of retirement benefits to directors and corporate auditors are subject to approval of the shareholders’ meeting.
At the annual shareholders’ meetings of the Company and several of its consolidated subsidiaries held in March 2007, the proposal of the termination of their retirement benefit programs for directors and corporate auditors (under which payments would be made at the time of each person’s retirement) was approved. Accordingly, the Company and those consolidated subsidiaries reversed the entire amount of their allowances for retirement benefits for directors and corporate auditors, and recorded unpaid balances of these retirement benefits as of December 31, 2007, in the “Other long-term liabilities” of the bal-ance sheets.
TRANSlATION OF FOREIgN CuRRENCY ACCOuNTS AND FINANCIAl STATEMENTSReceivables and payables denominated in foreign currencies are translated into Japanese yen at the exchange rates of the balance sheet dates, and differ-ences arising from the translation are included in the statements of income as a gain or loss.
The financial statements of foreign subsidiaries and affiliated companies are translated into Japanese yen at the exchange rates prevailing on the balance sheet dates for assets and liabilities and at the historical exchange rates for shareholders’ equity. All revenue and expense accounts are translated at the average rates of exchange during the fiscal period.
DERIvATIvE FINANCIAl INSTRuMENTSThe accounting standard for financial instruments requires companies to state derivative financial instruments at fair value and to recognize changes in the fair value as gains or losses unless derivative financial instruments are used for hedging purposes.
If derivative financial instruments are used as hedges and meet certain hedging criteria, the Companies defer recognition of gains or losses resulting from changes in fair value of derivative financial instruments until the related losses or gains on the hedged items are recognized.
However, in cases where interest rate swap contracts are used as hedge and meet certain hedging criteria, the net amount to be paid or received under the interest rate swap contract is added to or deducted from the interest on the assets or liabilities for which the swap contract was executed.
AMOuNTS PER ShARE OF COMMON STOCkNet income per share is computed based upon the average number of shares of common stock outstanding during the period.
Cash dividends per share have been presented on an accrual basis and include dividends to be approved after the balance sheet date, but applicable to the year then ended.
REvAluATION SuRPluSDue to the change of the accounting standard in a foreign country, an overseas subsidiary revaluated its lands based on the results of real-estate appraisals as of December 31, 2008. As a result of this change, “revaluation surplus” is recorded in net assets. The amount of revaluation surplus, net of taxes, is ¥1,751 million as of December 31, 2008.
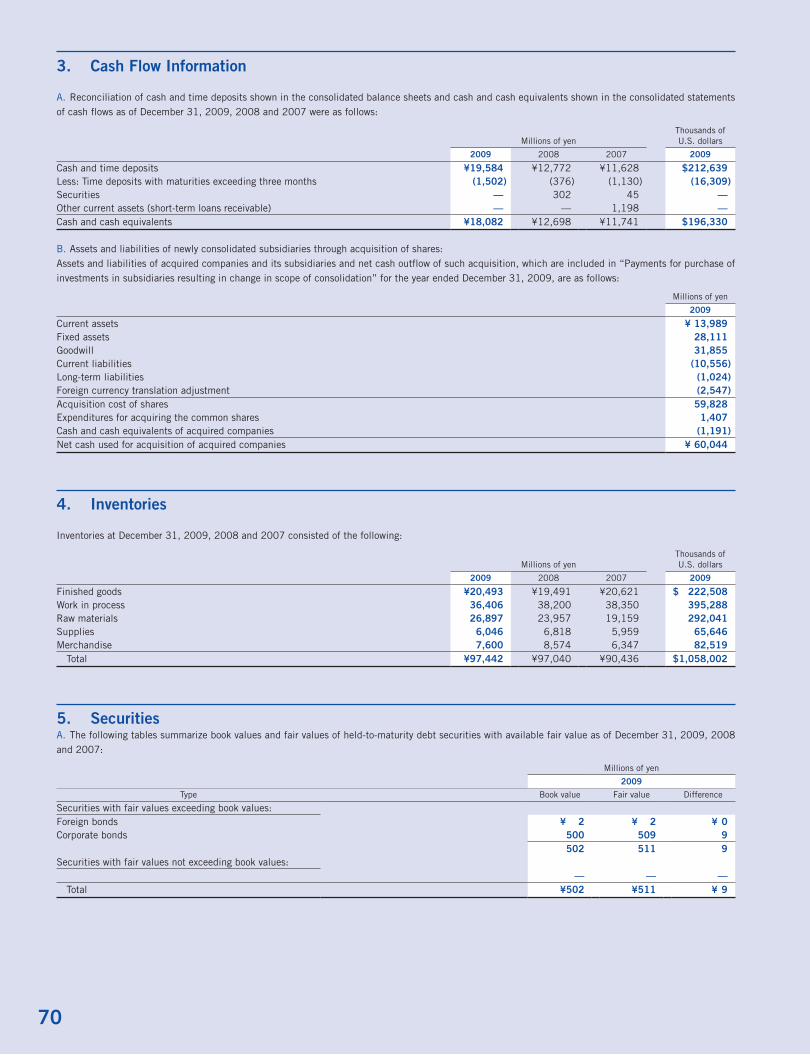
70
3. Cash Flow Information
A. Reconciliation of cash and time deposits shown in the consolidated balance sheets and cash and cash equivalents shown in the consolidated statements of cash flows as of December 31, 2009, 2008 and 2007 were as follows:
Millions of yenThousands of U.S. dollars
2009 2008 2007 2009
Cash and time deposits ¥19,584 ¥12,772 ¥11,628 $212,639Less: Time deposits with maturities exceeding three months (1,502) (376) (1,130) (16,309)Securities — 302 45 —Other current assets (short-term loans receivable) — — 1,198 —Cash and cash equivalents ¥18,082 ¥12,698 ¥11,741 $196,330
B. Assets and liabilities of newly consolidated subsidiaries through acquisition of shares:Assets and liabilities of acquired companies and its subsidiaries and net cash outflow of such acquisition, which are included in “Payments for purchase of investments in subsidiaries resulting in change in scope of consolidation” for the year ended December 31, 2009, are as follows:
Millions of yen
2009
Current assets ¥ 13,989Fixed assets 28,111Goodwill 31,855Current liabilities (10,556)Long-term liabilities (1,024)Foreign currency translation adjustment (2,547)Acquisition cost of shares 59,828Expenditures for acquiring the common shares 1,407Cash and cash equivalents of acquired companies (1,191)Net cash used for acquisition of acquired companies ¥ 60,044
4. Inventories
Inventories at December 31, 2009, 2008 and 2007 consisted of the following:
Millions of yenThousands of U.S. dollars
2009 2008 2007 2009
Finished goods ¥20,493 ¥19,491 ¥20,621 $ 222,508Work in process 36,406 38,200 38,350 395,288Raw materials 26,897 23,957 19,159 292,041Supplies 6,046 6,818 5,959 65,646Merchandise 7,600 8,574 6,347 82,519 Total ¥97,442 ¥97,040 ¥90,436 $1,058,002
5. SecuritiesA. The following tables summarize book values and fair values of held-to-maturity debt securities with available fair value as of December 31, 2009, 2008 and 2007:
Millions of yen
2009
Type Book value Fair value Difference
Securities with fair values exceeding book values:Foreign bonds ¥ 2 ¥ 2 ¥ 0Corporate bonds 500 509 9
502 511 9Securities with fair values not exceeding book values:
— — — Total ¥502 ¥511 ¥ 9

71Financial Section
Millions of yen
2008
Type Book value Fair value Difference
Securities with fair values exceeding book values:¥— ¥— ¥—
Securities with fair values not exceeding book values:— — —
Total ¥— ¥— ¥—
Millions of yen
2007
Type Book value Fair value Difference
Securities with fair values exceeding book values:Foreign securities ¥71 ¥76 ¥ 5
71 76 5Securities with fair values not exceeding book values:
0 0 — Total ¥71 ¥76 ¥ 5
Thousands of U.S. dollars
2009
Type Book value Fair value Difference
Securities with fair values exceeding book values:Foreign bonds $ 22 $ 22 $ 0Corporate bonds 5,429 5,527 98
5,451 5,549 98Securities with fair values not exceeding book values:
— — — Total $5,451 $5,549 $98
B. The following tables summarize acquisition costs and book values of available-for-sale securities with available fair value as of December 31, 2009, 2008 and 2007:
Millions of yen
2009
Type Acquisition cost Book value Difference
Securities with book values exceeding acquisition costs:Equity securities ¥37,321 ¥49,071 ¥11,750Others 49 53 4
37,370 49,124 11,754Securities with book values not exceeding acquisition costs:Equity securities 24,090 17,785 (6,305)Others 87 73 (14)
24,177 17,858 (6,319) Total ¥61,547 ¥66,982 ¥ 5,435
Millions of yen
2008
Type Acquisition cost Book value Difference
Securities with book values exceeding acquisition costs:Equity securities ¥19,749 ¥30,124 ¥10,375
19,749 30,124 10,375Securities with book values not exceeding acquisition costs:Equity securities 45,152 38,057 (7,095)Corporate bonds 1 1 0Others 143 118 (25)
45,296 38,176 (7,120) Total ¥65,045 ¥68,300 ¥ 3,255
Millions of yen
2007
Type Acquisition cost Book value Difference
Securities with book values exceeding acquisition costs:Equity securities ¥44,118 ¥68,882 ¥24,764Corporate bonds 1 1 0Others 100 101 1
44,219 68,984 24,765Securities with book values not exceeding acquisition costs:Equity securities 15,824 14,172 (1,652)Others 105 87 (18)
15,929 14,259 (1,670) Total ¥60,148 ¥83,243 ¥23,095
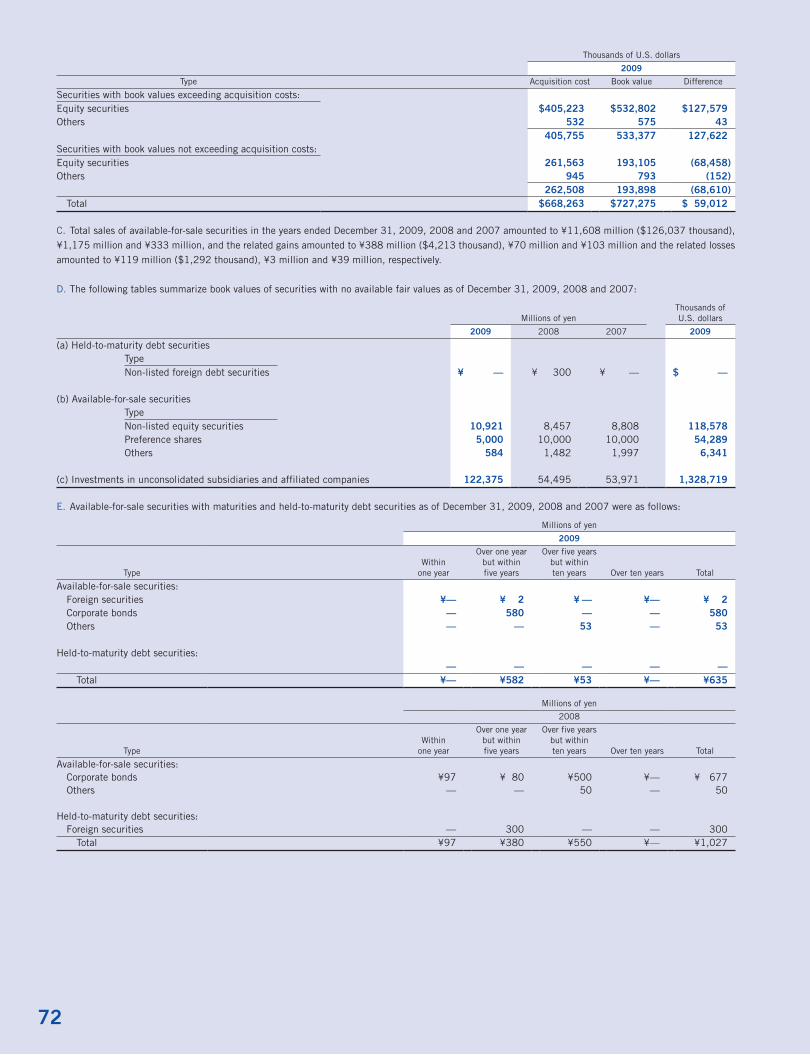
72
Thousands of U.S. dollars
2009
Type Acquisition cost Book value Difference
Securities with book values exceeding acquisition costs:Equity securities $405,223 $532,802 $127,579Others 532 575 43
405,755 533,377 127,622Securities with book values not exceeding acquisition costs:Equity securities 261,563 193,105 (68,458)Others 945 793 (152)
262,508 193,898 (68,610) Total $668,263 $727,275 $ 59,012
C. Total sales of available-for-sale securities in the years ended December 31, 2009, 2008 and 2007 amounted to ¥11,608 million ($126,037 thousand), ¥1,175 million and ¥333 million, and the related gains amounted to ¥388 million ($4,213 thousand), ¥70 million and ¥103 million and the related losses amounted to ¥119 million ($1,292 thousand), ¥3 million and ¥39 million, respectively.
D. The following tables summarize book values of securities with no available fair values as of December 31, 2009, 2008 and 2007:
Millions of yenThousands of U.S. dollars
2009 2008 2007 2009
(a) Held-to-maturity debt securitiesTypeNon-listed foreign debt securities ¥ — ¥ 300 ¥ — $ —
(b) Available-for-sale securitiesTypeNon-listed equity securities 10,921 8,457 8,808 118,578Preference shares 5,000 10,000 10,000 54,289Others 584 1,482 1,997 6,341
(c) Investments in unconsolidated subsidiaries and affiliated companies 122,375 54,495 53,971 1,328,719
E. Available-for-sale securities with maturities and held-to-maturity debt securities as of December 31, 2009, 2008 and 2007 were as follows:
Millions of yen
2009
TypeWithin
one year
Over one year but within five years
Over five years but within ten years Over ten years Total
Available-for-sale securities: Foreign securities ¥— ¥ 2 ¥ — ¥— ¥ 2 Corporate bonds — 580 — — 580 Others — — 53 — 53
Held-to-maturity debt securities:— — — — —
Total ¥— ¥582 ¥53 ¥— ¥635
Millions of yen
2008
TypeWithin
one year
Over one year but within five years
Over five years but within ten years Over ten years Total
Available-for-sale securities: Corporate bonds ¥97 ¥ 80 ¥500 ¥— ¥ 677 Others — — 50 — 50
Held-to-maturity debt securities: Foreign securities — 300 — — 300 Total ¥97 ¥380 ¥550 ¥— ¥1,027
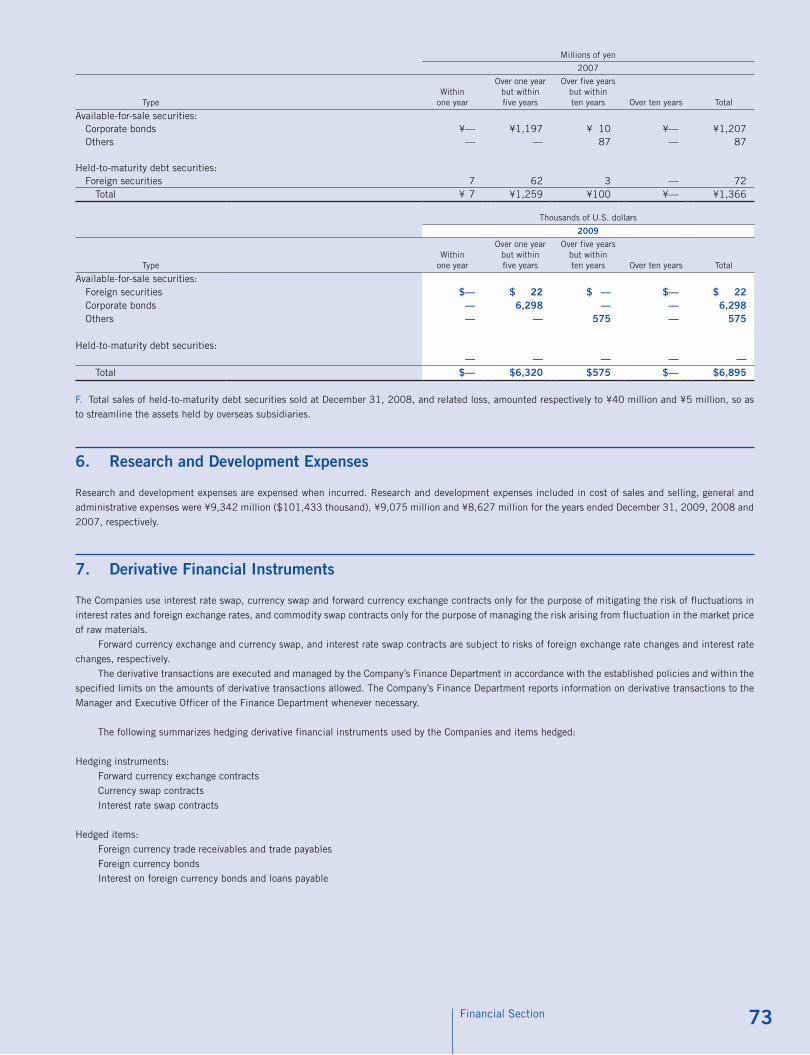
73Financial Section
Millions of yen
2007
TypeWithin
one year
Over one year but within five years
Over five years but within ten years Over ten years Total
Available-for-sale securities: Corporate bonds ¥— ¥1,197 ¥ 10 ¥— ¥1,207 Others — — 87 — 87
Held-to-maturity debt securities: Foreign securities 7 62 3 — 72 Total ¥ 7 ¥1,259 ¥100 ¥— ¥1,366
Thousands of U.S. dollars
2009
TypeWithin
one year
Over one year but within five years
Over five years but within ten years Over ten years Total
Available-for-sale securities: Foreign securities $— $ 22 $ — $— $ 22 Corporate bonds — 6,298 — — 6,298 Others — — 575 — 575
Held-to-maturity debt securities:— — — — —
Total $— $6,320 $575 $— $6,895
F. Total sales of held-to-maturity debt securities sold at December 31, 2008, and related loss, amounted respectively to ¥40 million and ¥5 million, so as to streamline the assets held by overseas subsidiaries.
6. Research and Development Expenses
Research and development expenses are expensed when incurred. Research and development expenses included in cost of sales and selling, general and administrative expenses were ¥9,342 million ($101,433 thousand), ¥9,075 million and ¥8,627 million for the years ended December 31, 2009, 2008 and 2007, respectively.
7. Derivative Financial Instruments
The Companies use interest rate swap, currency swap and forward currency exchange contracts only for the purpose of mitigating the risk of fluctuations in interest rates and foreign exchange rates, and commodity swap contracts only for the purpose of managing the risk arising from fluctuation in the market price of raw materials.
Forward currency exchange and currency swap, and interest rate swap contracts are subject to risks of foreign exchange rate changes and interest rate changes, respectively.
The derivative transactions are executed and managed by the Company’s Finance Department in accordance with the established policies and within the specified limits on the amounts of derivative transactions allowed. The Company’s Finance Department reports information on derivative transactions to the Manager and Executive Officer of the Finance Department whenever necessary.
The following summarizes hedging derivative financial instruments used by the Companies and items hedged:
Hedging instruments:Forward currency exchange contractsCurrency swap contractsInterest rate swap contracts
Hedged items:Foreign currency trade receivables and trade payablesForeign currency bondsInterest on foreign currency bonds and loans payable

74
Fair market value information of the derivative financial instruments is as follows:
Millions of yen
2009
Classification Type
Notional amount of contract
Notional amount due over one year
Fair market value
Unrealized gain
Forward currency exchange contracts Long (buy) (U.S. dollar) ¥2,656 — ¥2,635 ¥(21) Long (buy) (GB pound) 579 — 552 (27)
Short (sell) (U.S. dollar) 534 — 545 11 Total ¥3,769 — ¥3,732 ¥(37)Commodity swap contracts Payable fixed price/Receivable floating price ¥ 540 ¥ 636 ¥ 96 Total ¥ 540 — ¥ 636 ¥ 96
Millions of yen
2008
Classification Type
Notional amount of contract
Notional amount due over one year
Fair market value
Unrealized gain
Forward currency exchange contracts Short (sell) (U.S. dollar) ¥3,216 — ¥3,011 ¥205 Total ¥3,216 — ¥3,011 ¥205
Thousands of U.S. dollars
2009
Classification Type
Notional amount of contract
Notional amount due over one year
Fair market value
Unrealized gain
Forward currency exchange contracts Long (buy) (U.S. dollar) $28,838 — $28,610 $ (228) Long (buy) (GB pound) 6,287 — 5,994 (293)
Short (sell) (U.S. dollar) 5,798 — 5,917 119 Total $40,923 — $40,521 $ (402)Commodity swap contracts Payable fixed price/Receivable floating price $ 5,863 $ 6,906 $ 1,043 Total $ 5,863 — $ 6,906 $1,043
Derivative financial instruments that qualify as a hedge and are accounted for using the deferred hedge accounting method are not disclosed in the above table.
8. Bank loans, Commercial Paper and long-term Debt
Bank loans at December 31, 2009, 2008 and 2007 were represented by short-term notes or overdrafts, bearing interest at average rates of 1.11% per annum for 2009, 1.93% per annum for 2008 and 1.41% per annum for 2007.
The Company has entered into a yen domestic commercial paper program with a current maximum facility amount of ¥200,000 million ($2,171,553 thousand). There were outstanding balances of ¥30,000 million ($325,733 thousand), ¥7,000 million and ¥52,000 million at December 31, 2009, 2008 and 2007, respectively.

75Financial Section
Long-term debt at December 31, 2009, 2008 and 2007 consisted of the following:
Millions of yenThousands of U.S. dollars
2009 2008 2007 2009
Domestic debentures: 0.61% debentures due in 2008 ¥ — ¥ — ¥ 10,000 $ — 0.84% debentures due in 2009 — 20,000 20,000 — 1.34% debentures due in 2010 15,000 15,000 15,000 162,866 1.55% debentures due in 2011 15,000 15,000 15,000 162,866 1.72% debentures due in 2012 10,000 10,000 10,000 108,578 0.63% debentures due in 2012 15,000 — — 162,866 1.88% debentures due in 2014 10,000 10,000 10,000 108,578 0.92% debentures due in 2014 10,000 — — 108,578 Zero coupon convertible bonds due in 2023 35,156 35,168 — 381,715 Zero coupon convertible bonds due in 2028 35,000 35,000 — 380,022
Long-term loans, principally from banks, insurance companies and agricultural cooperatives: Secured loans due through 2013 at interest rates of mainly 1.15% to 6.39% 4,769 9,507 10,659 51,781 Unsecured loans due through 2015 at interest rates of mainly 0.75% to 5.75% 96,133 68,756 85,890 1,043,789
246,058 218,431 176,549 2,671,639Amount due within one year (40,402) (38,728) (47,072) (438,675)
¥205,656 ¥179,703 ¥129,477 $2,232,964
Assets, at book value, pledged as collateral for loans totaling ¥4,769 million ($51,781 thousand), ¥9,907 million and ¥12,469 million, respectively, at December 31, 2009, 2008 and 2007 were as follows:
Millions of yenThousands of U.S. dollars
2009 2008 2007 2009
Deposit ¥ — ¥ — ¥ 101 $ —Land 16,733 29,888 27,162 181,683Buildings and structures 6,563 8,171 9,045 71,259Machinery and equipment 535 1,291 2,900 5,809
¥23,831 ¥39,350 ¥39,208 $258,751
The aggregate annual maturities of long-term debt at December 31, 2009 were as follows:
Years ending December 31, Millions of yenThousands of U.S. dollars
2010 ¥ 40,402 $ 438,6752011 22,009 238,9682012 72,379 785,8742013 15,112 164,0832014 20,000 217,1552015 and thereafter 76,156 826,884
¥246,058 $2,671,639
9. Employees’ Severance and Retirement Benefits
Employees’ severance and retirement benefits included in the liability section of the consolidated balance sheets as of December 31, 2009, 2008 and 2007 consist of the following:
Millions of yenThousands of U.S. dollars
2009 2008 2007 2009
Projected benefit obligation ¥ 89,691 ¥ 87,251 ¥ 86,265 $ 973,844Less fair value of pension assets (42,749) (36,687) (42,652) (464,159)Less fair value of employees’ retirement benefit trust (18,709) (14,904) (21,338) (203,138)Unrecognized actuarial differences (15,133) (18,857) (2,407) (164,311)Unrecognized prior service cost 2,196 2,640 3,091 23,844Prepaid pension cost 8,956 4,073 861 97,242Employees’ severance and retirement benefits ¥ 24,252 ¥ 23,516 ¥ 23,820 $ 263,322
The discount rates used by the Companies are mainly 2.0% for the years ended December 31, 2009, 2008 and 2007, respectively.The pension assets of the funded contributory pension plan is not included in the fair value of pension assets above because the amount of pension
assets can not be calculated reasonably. The contribution to the funded contributory pension plan is reported as severance and retirement benefit expenses.
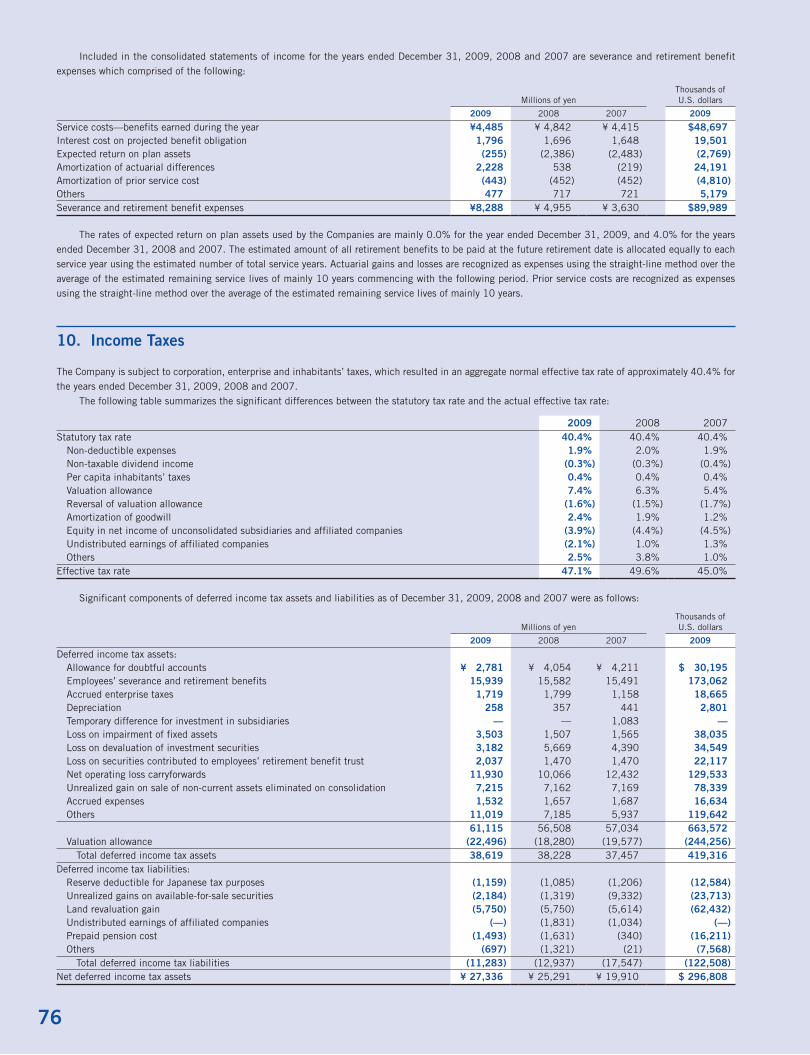
76
Included in the consolidated statements of income for the years ended December 31, 2009, 2008 and 2007 are severance and retirement benefit expenses which comprised of the following:
Millions of yenThousands of U.S. dollars
2009 2008 2007 2009
Service costs—benefits earned during the year ¥4,485 ¥ 4,842 ¥ 4,415 $48,697Interest cost on projected benefit obligation 1,796 1,696 1,648 19,501Expected return on plan assets (255) (2,386) (2,483) (2,769)Amortization of actuarial differences 2,228 538 (219) 24,191Amortization of prior service cost (443) (452) (452) (4,810)Others 477 717 721 5,179Severance and retirement benefit expenses ¥8,288 ¥ 4,955 ¥ 3,630 $89,989
The rates of expected return on plan assets used by the Companies are mainly 0.0% for the year ended December 31, 2009, and 4.0% for the years ended December 31, 2008 and 2007. The estimated amount of all retirement benefits to be paid at the future retirement date is allocated equally to each service year using the estimated number of total service years. Actuarial gains and losses are recognized as expenses using the straight-line method over the average of the estimated remaining service lives of mainly 10 years commencing with the following period. Prior service costs are recognized as expenses using the straight-line method over the average of the estimated remaining service lives of mainly 10 years.
10. Income Taxes
The Company is subject to corporation, enterprise and inhabitants’ taxes, which resulted in an aggregate normal effective tax rate of approximately 40.4% for the years ended December 31, 2009, 2008 and 2007.
The following table summarizes the significant differences between the statutory tax rate and the actual effective tax rate:
2009 2008 2007Statutory tax rate 40.4% 40.4% 40.4% Non-deductible expenses 1.9% 2.0% 1.9% Non-taxable dividend income (0.3%) (0.3%) (0.4%) Per capita inhabitants’ taxes 0.4% 0.4% 0.4% Valuation allowance 7.4% 6.3% 5.4% Reversal of valuation allowance (1.6%) (1.5%) (1.7%) Amortization of goodwill 2.4% 1.9% 1.2% Equity in net income of unconsolidated subsidiaries and affiliated companies (3.9%) (4.4%) (4.5%) Undistributed earnings of affiliated companies (2.1%) 1.0% 1.3% Others 2.5% 3.8% 1.0%Effective tax rate 47.1% 49.6% 45.0%
Significant components of deferred income tax assets and liabilities as of December 31, 2009, 2008 and 2007 were as follows:
Millions of yenThousands of U.S. dollars
2009 2008 2007 2009
Deferred income tax assets: Allowance for doubtful accounts ¥ 2,781 ¥ 4,054 ¥ 4,211 $ 30,195 Employees’ severance and retirement benefits 15,939 15,582 15,491 173,062 Accrued enterprise taxes 1,719 1,799 1,158 18,665 Depreciation 258 357 441 2,801 Temporary difference for investment in subsidiaries — — 1,083 — Loss on impairment of fixed assets 3,503 1,507 1,565 38,035 Loss on devaluation of investment securities 3,182 5,669 4,390 34,549 Loss on securities contributed to employees’ retirement benefit trust 2,037 1,470 1,470 22,117 Net operating loss carryforwards 11,930 10,066 12,432 129,533 Unrealized gain on sale of non-current assets eliminated on consolidation 7,215 7,162 7,169 78,339 Accrued expenses 1,532 1,657 1,687 16,634 Others 11,019 7,185 5,937 119,642
61,115 56,508 57,034 663,572 Valuation allowance (22,496) (18,280) (19,577) (244,256) Total deferred income tax assets 38,619 38,228 37,457 419,316Deferred income tax liabilities: Reserve deductible for Japanese tax purposes (1,159) (1,085) (1,206) (12,584) Unrealized gains on available-for-sale securities (2,184) (1,319) (9,332) (23,713) Land revaluation gain (5,750) (5,750) (5,614) (62,432) Undistributed earnings of affiliated companies (—) (1,831) (1,034) (—) Prepaid pension cost (1,493) (1,631) (340) (16,211) Others (697) (1,321) (21) (7,568) Total deferred income tax liabilities (11,283) (12,937) (17,547) (122,508)Net deferred income tax assets ¥ 27,336 ¥ 25,291 ¥ 19,910 $ 296,808

77Financial Section
The net deferred tax assets as of December 31, 2009 consisted of deferred income tax assets included in current assets and fixed assets amounting to ¥11,176 million ($121,347 thousand) and ¥21,021 million ($228,241 thousand), respectively, and deferred income tax liabilities included in current lia-bilities and long-term liabilities amounting to ¥0 million ($0 thousand) and ¥4,861 million ($52,780 thousand), respectively.
The net deferred tax assets as of December 31, 2008 consisted of deferred income tax assets included in current assets and fixed assets amounting to ¥9,009 million and ¥24,212 million, respectively, and deferred income tax liabilities included in current liabilities and long-term liabilities amounting to ¥1,818 million and ¥6,112 million, respectively.
The net deferred tax assets as of December 31, 2007 consisted of deferred income tax assets included in current assets and fixed assets amounting to ¥6,931 million and ¥18,983 million, respectively, and deferred income tax liabilities included in other current liabilities and long-term liabilities amounting to ¥986 million and ¥5,019 million, respectively.
11. Net Assets
The Japanese Corporate Law (“the Law”) became effective on May 1, 2006, replacing the Japanese Commercial Code (“the Code”).Under the Japanese laws and regulations, the entire amount paid for new shares is required to be designated as common stock. However, a company
may, by a resolution of the Board of Directors, designate an amount not exceeding one-half of the prices of the new shares as additional paid-in capital, which is included in capital surplus.
Under the Law, in cases where dividend distribution of surplus is made, the smaller of an amount equal to 10% of the dividend and the excess, if any, of 25% of common stock over the total of additional paid-in-capital and legal earnings reserve must be set aside as additional paid-in-capital or legal earnings reserve. Legal earnings reserve is included in retained earnings in the accompanying consolidated balance sheets.
Under the Code, companies were required to set aside an amount equal to at least 10% of cash dividends and other cash appropriations as legal earnings reserve until the total of legal earnings reserve and additional paid-in capital equaled 25% of common stock.
Under the Code, legal earnings reserve and additional paid-in capital could be used to eliminate or reduce a deficit by a resolution of the shareholders’ meeting or could be capitalized by a resolution of the Board of Directors. Under the Law, both of these appropriations generally require a resolution of the shareholders’ meeting.
Additional paid-in capital and legal earnings reserve may not be distributed as dividends. Under the Code, however, additional paid-in capital and legal earnings reserve may be transferred to retained earnings by the resolution of the shareholders’ meeting as long as the total amount of legal earnings reserve and additional paid-in capital remained equal to or exceeded 25% of common stock. Under the Law, all additional paid-in-capital and all legal earnings reserve may be transferred to other capital surplus and retained earnings, respectively, which are potentially available for dividends.
The maximum amount that the Company can distribute as dividends is calculated based on the non-consolidated financial statements of the Company in accordance with the Law.
At the annual shareholders’ meeting held on March 26, 2010, the shareholders resolved cash dividends amounting to ¥5,115 million ($55,537 thousand). Such appropriations have not been accrued in the consolidated financial statements as of December 31, 2009, and are recognized in the period in which they were resolved.
12. Commitments and Contingent liabilities
The Companies were contingently liable as guarantors for borrowings of unconsolidated subsidiaries, affiliated companies, employees and others, including letters of awareness and keep-well agreements, in the amount of ¥1,276 million ($13,855 thousand) as of December 31, 2009.
13. Impairment of Fixed Assets
The Company and its domestic consolidated subsidiaries have grouped their fixed assets principally based on their offices or factories, while considering mutual supplementation of the cash flows.
For fixed assets in the real estate business and idle properties, each property is considered to constitute a group. Headquarters and welfare facilities were classified as corporate assets because they do not generate cash flows independently from other assets or group of assets. The recoverable amount of each group of assets is the higher amount of net selling price (fair value less costs to sell) or value in use.
Loss on impairment of fixed assets for the year ended December 31, 2009 consisted of the following:
Use Location Type of assetsAssets used for business (Alcoholic beverages) Beijing (China) Buildings and structures, Machinery, equipment
and vehicles, Tools, furniture and fixturesAsset for rent Saitama (Saitama) and 5 others Buildings and structures, LandIdle properties Yuhutsu-gun (Hokkaido) Buildings and structures, LandOthers — Goodwill

78
The carrying amounts of certain assets used for alcoholic beverages business were devalued to their recoverable amounts, since the expected future revenue was considered to be unrealizable. Carrying amounts of certain assets for rent were devalued to their recoverable amounts, since they were considered not to be recoverable with their fair market value substantially declining. Carrying amounts of certain idle properties were devalued to their recoverable amounts, due to substantial decline in the fair market value. A part of the goodwill reported in overseas subsidiaries of alcoholic beverages and their soft drinks businesses was devaluated to its recoverable amount, since the expected future revenue was considered to be unrealizable. As a result, the Company recognized loss on impairment in the amount of ¥8,318 million ($90,315 thousand), which consisted of buildings and structures of ¥1,632 million ($17,720 thousand), Machinery, equipment and vehicles of ¥1,943 million ($21,097 thousand), Tools, furniture and fixtures of ¥12 million ($130 thou-sand), Land of ¥2,341 million ($25,418 thousand) and goodwill of ¥2,390 million ($25,950 thousand).
The Company used a net selling price based on real-estate appraisal for the related assets, and the value in use was calculated by discounting future cash flows at interest rates of 4.3% to 8.3%.
Loss on impairment of fixed assets for the year ended December 31, 2008 consisted of the following:
Use Location Type of assetsAssets used for business (Logistics) Kasumigaura (Ibaraki) Buildings and structuresIdle properties Kashiwa (Chiba) Buildings and structuresOthers — Goodwill
The carrying amounts of certain assets used for logistics business were devalued to their recoverable amounts, since they were considered not to be recoverable under the changed business circumstances. Carrying amounts of certain idle properties, as a result of the shutdown of the business office were devalued to their recoverable amounts, due to a substantial decline in the fair market value. The goodwill of soft drinks business was devaluated to its recover-able amount, since the expected future revenue at the time of initial acquisition was considered to be unrealizable. As a result, the Company recognized loss on impairment in the amount of ¥2,197 million ($24,135 thousand), which consisted of buildings and structures of ¥315 million ($3,460 thousand) and goodwill of ¥1,882 million ($20,675 thousand).
The Company used a net selling price based on real-estate appraisal for the related assets, and the value in use was calculated by discounting future cash flows at interest rates of 4.3% to 7.3%.
Loss on impairment of fixed assets for the year ended December 31, 2007 consisted of the following:
Use Location Type of assetsAssets used for business (Foods) Sakura (Tochigi) Buildings and structuresOthers — Goodwill
The carrying amounts of certain assets used for foods business were devalued to their recoverable amounts by the decision to sell them in the year ended December 31, 2007. The goodwill of foods and pharmaceutical business was devaluated to its recoverable amount, since the expected future revenue at the time of initial acquisition was considered to be unrealizable. As a result, the Company recognized loss on impairment in the amount of ¥1,388 million, which consisted of buildings and structures of ¥99 million and goodwill of ¥1,289 million.
The Company used a net selling price based on the sales agreement for the related assets, and the value in use was calculated by discounting future cash flows at an interest rate of 4.3%.
14. Prior Year Sales Promotion Expenses
Prior to fiscal year 2008, the Company had accrued sales promotion expenses based on an invoice from wholesalers which was calculated by the volume of sales from wholesalers to retailers and other factors. In 2008, the Company developed a billing system so that it was able to estimate the amount of sales and sales promotion expenses to retailers on a timely basis. Therefore, the Company changed the method of calculation of sales promotion expenses based on an estimate at the end of month from 2008.
Prior year sales promotion expenses represent such expenses related to sales and other factors in the prior year.
15. Information for Certain leases
As discussed in Note 2, finance leases commenced prior to January 1, 2009, which do not transfer ownership to lessees, are accounted for as operating leases.
A summary of assumed amounts of acquisition cost, accumulated depreciation and net book value at December 31, 2009, 2008 and 2007 was as follows:
Millions of yenThousands of U.S. dollars
2009 2008 2007 2009
Machinery, furniture and fixtures and others Acquisition cost ¥52,804 ¥67,714 ¥74,118 $573,333 Accumulated depreciation 29,785 33,881 38,753 323,398 Net book value 23,019 33,833 35,365 249,935

79Financial Section
Future lease payments as of December 31, 2009, 2008 and 2007, net of interest, under such leases were summarized as follows:
Millions of yenThousands of U.S. dollars
2009 2008 2007 2009
Due within one year ¥10,371 ¥12,564 ¥12,399 $112,606Due after one year 13,694 22,751 24,125 148,686
¥24,065 ¥35,315 ¥36,524 $261,292
Lease payments, depreciation equivalents and amounts representing interest under the finance leases which are accounted for in the same manner as operating leases for the years ended December 31, 2009, 2008 and 2007 were as follows:
Millions of yenThousands of U.S. dollars
2009 2008 2007 2009
Lease payments ¥13,966 ¥16,005 ¥15,362 $151,640Depreciation equivalents 12,935 14,281 13,788 140,445Amounts representing interest 985 1,531 1,466 10,695
Differences between total lease expenses and acquisition costs of the leased properties comprise interest expense equivalent. Interest expense equiva-lent is allocated using the interest method over the lease terms.
16. Shareholders’ Equity
Changes in the number of shares issued and treasury stock outstanding during the years ended December 31, 2009, 2008 and 2007 are as follows:
Common stock issued2009 2008 2007
Balance at beginning of year 483,585,862 483,585,862 483,585,862Decrease due to retirement of treasury stock — — —Balance at end of year 483,585,862 483,585,862 483,585,862
Treasury stock outstanding2009 2008 2007
Balance at beginning of year 18,762,163 11,124,073 12,888,400Increase due to purchase of odd stock 22,664 186,391 57,027Increase due to purchase of treasury stock based on article 797 paragraph 1 of the Corporate Law — — 51,500Increase due to purchase of treasury stock (Purchased by subsidiaries) — — 20,300Increase due to purchase of treasury stock based on resolution of the board of directors — 7,759,900 —Decrease due to exercise of stock options (205,200) (291,900) (316,000)Decrease due to stock exchanges — — (1,361,915)Decrease due to sales of treasury stock (Sold by subsidiaries) — — (212,654)Decrease for other reasons (2,661) (16,301) (2,585)Balance at end of year 18,576,966 18,762,163 11,124,073
17. Stock Option Plans
The following tables summarize contents of stock options as of December 31, 2009, 2008 and 2007.
Company name Asahi Breweries, Ltd.Date of the annual shareholders’ meeting March 30, 2000Position and number of grantees Directors and Executive Officers: 38Class and number of stock Common Stock: 99,000Date of issue March 30, 2000Condition of settlement of rights No provisionsPeriod grantees provide service in return for stock options No provisionsPeriod subscription rights are to be exercised From January 1, 2005 to March 29, 2010
Company name Asahi Breweries, Ltd.Date of the annual shareholders’ meeting March 29, 2001Position and number of grantees Directors and Executive Officers: 30Class and number of stock Common Stock: 344,000Date of issue March 29, 2001Condition of settlement of rights No provisionsPeriod grantees provide service in return for stock options No provisionsPeriod subscription rights are to be exercised From January 1, 2005 to March 28, 2011
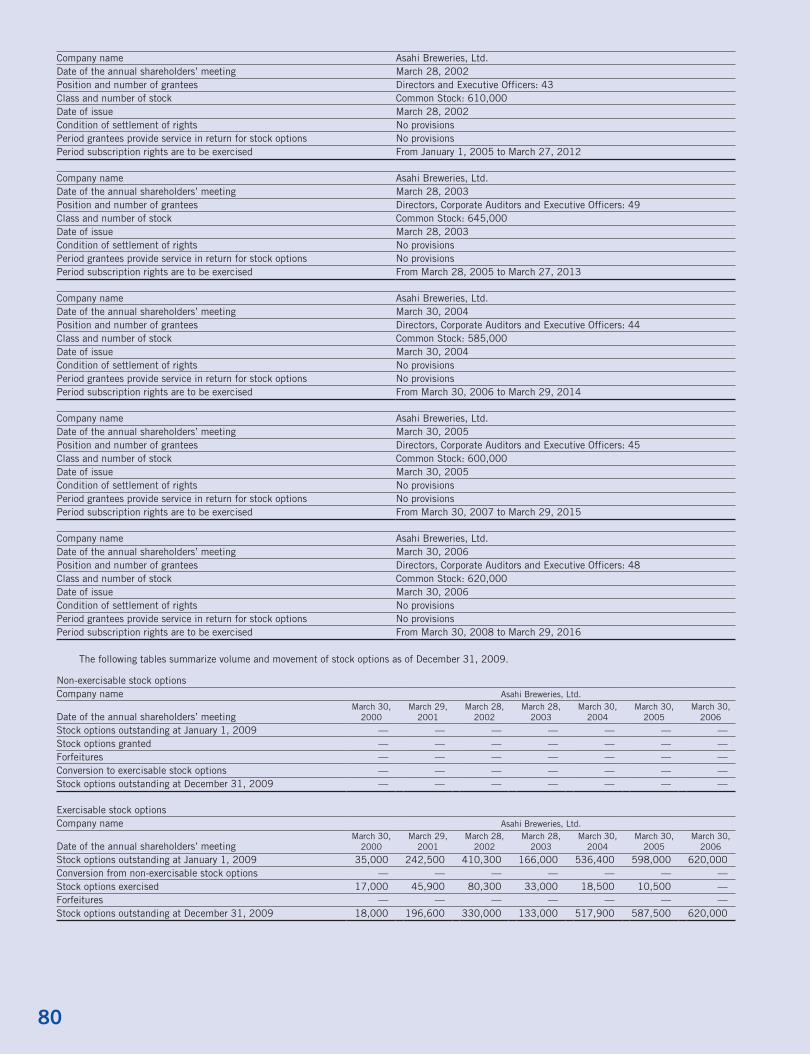
80
Company name Asahi Breweries, Ltd.Date of the annual shareholders’ meeting March 28, 2002Position and number of grantees Directors and Executive Officers: 43Class and number of stock Common Stock: 610,000Date of issue March 28, 2002Condition of settlement of rights No provisionsPeriod grantees provide service in return for stock options No provisionsPeriod subscription rights are to be exercised From January 1, 2005 to March 27, 2012
Company name Asahi Breweries, Ltd.Date of the annual shareholders’ meeting March 28, 2003Position and number of grantees Directors, Corporate Auditors and Executive Officers: 49Class and number of stock Common Stock: 645,000Date of issue March 28, 2003Condition of settlement of rights No provisionsPeriod grantees provide service in return for stock options No provisionsPeriod subscription rights are to be exercised From March 28, 2005 to March 27, 2013
Company name Asahi Breweries, Ltd.Date of the annual shareholders’ meeting March 30, 2004Position and number of grantees Directors, Corporate Auditors and Executive Officers: 44Class and number of stock Common Stock: 585,000Date of issue March 30, 2004Condition of settlement of rights No provisionsPeriod grantees provide service in return for stock options No provisionsPeriod subscription rights are to be exercised From March 30, 2006 to March 29, 2014
Company name Asahi Breweries, Ltd.Date of the annual shareholders’ meeting March 30, 2005Position and number of grantees Directors, Corporate Auditors and Executive Officers: 45Class and number of stock Common Stock: 600,000Date of issue March 30, 2005Condition of settlement of rights No provisionsPeriod grantees provide service in return for stock options No provisionsPeriod subscription rights are to be exercised From March 30, 2007 to March 29, 2015
Company name Asahi Breweries, Ltd.Date of the annual shareholders’ meeting March 30, 2006Position and number of grantees Directors, Corporate Auditors and Executive Officers: 48Class and number of stock Common Stock: 620,000Date of issue March 30, 2006Condition of settlement of rights No provisionsPeriod grantees provide service in return for stock options No provisionsPeriod subscription rights are to be exercised From March 30, 2008 to March 29, 2016
The following tables summarize volume and movement of stock options as of December 31, 2009.
Non-exercisable stock optionsCompany name Asahi Breweries, Ltd.
Date of the annual shareholders’ meetingMarch 30,
2000March 29,
2001March 28,
2002March 28,
2003March 30,
2004March 30,
2005March 30,
2006
Stock options outstanding at January 1, 2009 — — — — — — —Stock options granted — — — — — — —Forfeitures — — — — — — —Conversion to exercisable stock options — — — — — — —Stock options outstanding at December 31, 2009 — — — — — — —
Exercisable stock optionsCompany name Asahi Breweries, Ltd.
Date of the annual shareholders’ meetingMarch 30,
2000March 29,
2001March 28,
2002March 28,
2003March 30,
2004March 30,
2005March 30,
2006
Stock options outstanding at January 1, 2009 35,000 242,500 410,300 166,000 536,400 598,000 620,000Conversion from non-exercisable stock options — — — — — — —Stock options exercised 17,000 45,900 80,300 33,000 18,500 10,500 —Forfeitures — — — — — — —Stock options outstanding at December 31, 2009 18,000 196,600 330,000 133,000 517,900 587,500 620,000

81Financial Section
The following tables summarize price information of stock options as of December 31, 2009.
Company name Asahi Breweries, Ltd.
Date of the annual shareholders’ meetingMarch 30,
2000March 29,
2001March 28,
2002March 28,
2003March 30,
2004March 30,
2005March 30,
2006
Exercise price ¥1,115 ¥1,185 ¥1,090 ¥ 830 ¥1,205 ¥1,374 ¥1,688Average market price of the stock at the time of exercise 1,432 1,372 1,397 1,352 1,351 1,401 —
The following tables summarize volume and movement of stock options as of December 31, 2008.
Non-exercisable stock optionsCompany name Asahi Breweries, Ltd.
Date of the annual shareholders’ meetingMarch 30,
2000March 29,
2001March 28,
2002March 28,
2003March 30,
2004March 30,
2005March 30,
2006
Stock options outstanding at January 1, 2008 — — — — — — 620,000Stock options granted — — — — — — —Forfeitures — — — — — — —Conversion to exercisable stock options — — — — — — 620,000Stock options outstanding at December 31, 2008 — — — — — — —
Exercisable stock optionsCompany name Asahi Breweries, Ltd.
Date of the annual shareholders’ meetingMarch 30,
2000March 29,
2001March 28,
2002March 28,
2003March 30,
2004March 30,
2005March 30,
2006
Stock options outstanding at January 1, 2008 58,000 276,500 518,600 260,000 567,000 600,000 —Conversion from non-exercisable stock options — — — — — — 620,000Stock options exercised 23,000 34,000 108,300 94,000 30,600 2,000 —Forfeitures — — — — — — —Stock options outstanding at December 31, 2008 35,000 242,500 410,300 166,000 536,400 598,000 620,000
The following tables summarize price information of stock options as of December 31, 2008.
Company name Asahi Breweries, Ltd.
Date of the annual shareholders’ meetingMarch 30,
2000March 29,
2001March 28,
2002March 28,
2003March 30,
2004March 30,
2005March 30,
2006
Exercise price ¥1,115 ¥1,185 ¥1,090 ¥ 830 ¥1,205 ¥1,374 ¥1,688Average market price of the stock at the time of exercise 1,851 1,854 1,856 1,882 1,918 1,923 —
The following tables summarize volume and movement of stock options as of December 31, 2007.
Non-exercisable stock optionsCompany name Asahi Breweries, Ltd.
Date of the annual shareholders’ meetingMarch 30,
2000March 29,
2001March 28,
2002March 28,
2003March 30,
2004March 30,
2005March 30,
2006
Stock options outstanding at January 1, 2007 — — — — — 600,000 620,000Stock options granted — — — — — — —Forfeitures — — — — — — —Conversion to exercisable stock options — — — — — 600,000 —Stock options outstanding at December 31, 2007 — — — — — — 620,000
Exercisable stock optionsCompany name Asahi Breweries, Ltd.
Date of the annual shareholders’ meetingMarch 30,
2000March 29,
2001March 28,
2002March 28,
2003March 30,
2004March 30,
2005March 30,
2006
Stock options outstanding at January 1, 2007 72,000 326,000 576,100 437,000 585,000 — —Conversion from non-exercisable stock options — — — — — 600,000 —Stock options exercised 14,000 49,500 57,500 177,000 18,000 — —Forfeitures — — — — — — —Stock options outstanding at December 31, 2007 58,000 276,500 518,600 260,000 567,000 600,000 —
The following table summarizes price information of stock options as of December 31, 2007.
Company name Asahi Breweries, Ltd.
Date of the annual shareholders’ meetingMarch 30,
2000March 29,
2001March 28,
2002March 28,
2003March 30,
2004March 30,
2005March 30,
2006
Exercise price ¥1,115 ¥1,185 ¥1,090 ¥ 830 ¥1,205 ¥1,374 ¥1,688Average market price of the stock at the time of exercise 1,900 1,890 1,883 1,884 1,851 — —
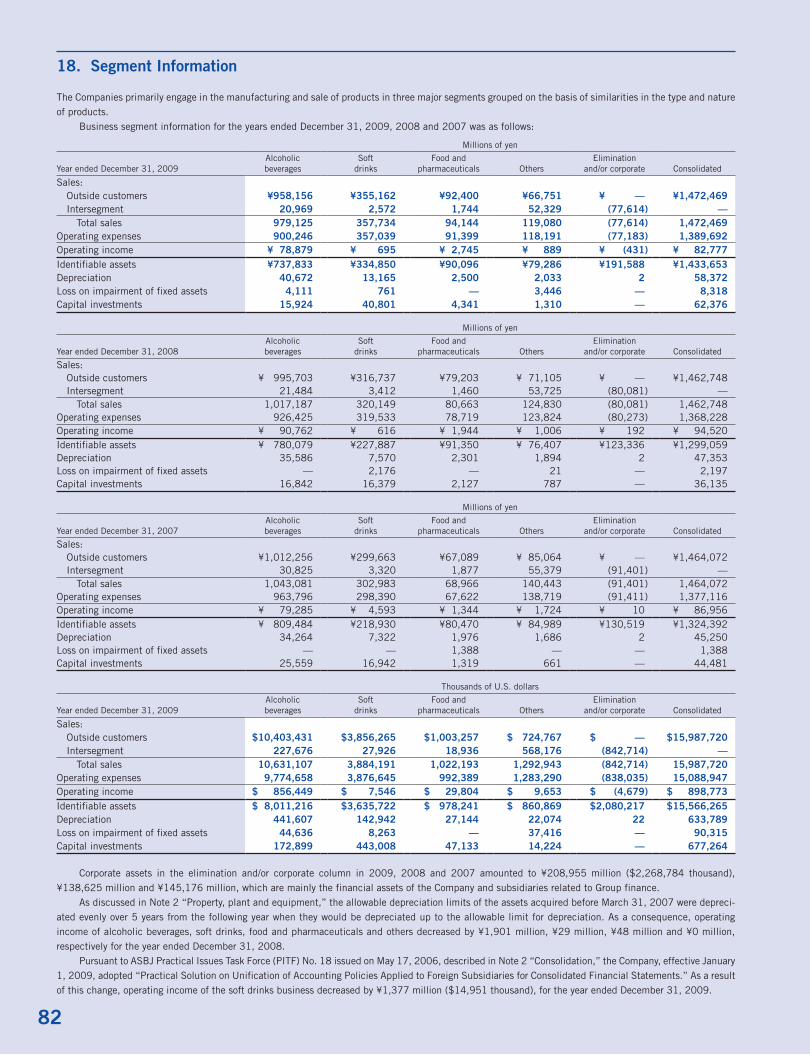
82
18. Segment Information
The Companies primarily engage in the manufacturing and sale of products in three major segments grouped on the basis of similarities in the type and nature of products.
Business segment information for the years ended December 31, 2009, 2008 and 2007 was as follows:
Millions of yen
Year ended December 31, 2009Alcoholic beverages
Soft drinks
Food and pharmaceuticals Others
Elimination and/or corporate Consolidated
Sales: Outside customers ¥958,156 ¥355,162 ¥92,400 ¥66,751 ¥ — ¥1,472,469 Intersegment 20,969 2,572 1,744 52,329 (77,614) — Total sales 979,125 357,734 94,144 119,080 (77,614) 1,472,469Operating expenses 900,246 357,039 91,399 118,191 (77,183) 1,389,692Operating income ¥ 78,879 ¥ 695 ¥ 2,745 ¥ 889 ¥ (431) ¥ 82,777Identifiable assets ¥737,833 ¥334,850 ¥90,096 ¥79,286 ¥191,588 ¥1,433,653Depreciation 40,672 13,165 2,500 2,033 2 58,372Loss on impairment of fixed assets 4,111 761 — 3,446 — 8,318Capital investments 15,924 40,801 4,341 1,310 — 62,376
Millions of yen
Year ended December 31, 2008Alcoholic beverages
Soft drinks
Food and pharmaceuticals Others
Elimination and/or corporate Consolidated
Sales: Outside customers ¥ 995,703 ¥316,737 ¥79,203 ¥ 71,105 ¥ — ¥1,462,748 Intersegment 21,484 3,412 1,460 53,725 (80,081) — Total sales 1,017,187 320,149 80,663 124,830 (80,081) 1,462,748Operating expenses 926,425 319,533 78,719 123,824 (80,273) 1,368,228Operating income ¥ 90,762 ¥ 616 ¥ 1,944 ¥ 1,006 ¥ 192 ¥ 94,520Identifiable assets ¥ 780,079 ¥227,887 ¥91,350 ¥ 76,407 ¥123,336 ¥1,299,059Depreciation 35,586 7,570 2,301 1,894 2 47,353Loss on impairment of fixed assets — 2,176 — 21 — 2,197Capital investments 16,842 16,379 2,127 787 — 36,135
Millions of yen
Year ended December 31, 2007Alcoholic beverages
Soft drinks
Food and pharmaceuticals Others
Elimination and/or corporate Consolidated
Sales: Outside customers ¥1,012,256 ¥299,663 ¥67,089 ¥ 85,064 ¥ — ¥1,464,072 Intersegment 30,825 3,320 1,877 55,379 (91,401) — Total sales 1,043,081 302,983 68,966 140,443 (91,401) 1,464,072Operating expenses 963,796 298,390 67,622 138,719 (91,411) 1,377,116Operating income ¥ 79,285 ¥ 4,593 ¥ 1,344 ¥ 1,724 ¥ 10 ¥ 86,956Identifiable assets ¥ 809,484 ¥218,930 ¥80,470 ¥ 84,989 ¥130,519 ¥1,324,392Depreciation 34,264 7,322 1,976 1,686 2 45,250Loss on impairment of fixed assets — — 1,388 — — 1,388Capital investments 25,559 16,942 1,319 661 — 44,481
Thousands of U.S. dollars
Year ended December 31, 2009Alcoholic beverages
Soft drinks
Food and pharmaceuticals Others
Elimination and/or corporate Consolidated
Sales: Outside customers $10,403,431 $3,856,265 $1,003,257 $ 724,767 $ — $15,987,720 Intersegment 227,676 27,926 18,936 568,176 (842,714) — Total sales 10,631,107 3,884,191 1,022,193 1,292,943 (842,714) 15,987,720Operating expenses 9,774,658 3,876,645 992,389 1,283,290 (838,035) 15,088,947Operating income $ 856,449 $ 7,546 $ 29,804 $ 9,653 $ (4,679) $ 898,773Identifiable assets $ 8,011,216 $3,635,722 $ 978,241 $ 860,869 $2,080,217 $15,566,265Depreciation 441,607 142,942 27,144 22,074 22 633,789Loss on impairment of fixed assets 44,636 8,263 — 37,416 — 90,315Capital investments 172,899 443,008 47,133 14,224 — 677,264
Corporate assets in the elimination and/or corporate column in 2009, 2008 and 2007 amounted to ¥208,955 million ($2,268,784 thousand), ¥138,625 million and ¥145,176 million, which are mainly the financial assets of the Company and subsidiaries related to Group finance.
As discussed in Note 2 “Property, plant and equipment,” the allowable depreciation limits of the assets acquired before March 31, 2007 were depreci-ated evenly over 5 years from the following year when they would be depreciated up to the allowable limit for depreciation. As a consequence, operating income of alcoholic beverages, soft drinks, food and pharmaceuticals and others decreased by ¥1,901 million, ¥29 million, ¥48 million and ¥0 million, respectively for the year ended December 31, 2008.
Pursuant to ASBJ Practical Issues Task Force (PITF) No. 18 issued on May 17, 2006, described in Note 2 “Consolidation,” the Company, effective January 1, 2009, adopted “Practical Solution on Unification of Accounting Policies Applied to Foreign Subsidiaries for Consolidated Financial Statements.” As a result of this change, operating income of the soft drinks business decreased by ¥1,377 million ($14,951 thousand), for the year ended December 31, 2009.

83Financial Section
Pursuant to ASBJ Statement No. 9 issued on July 5, 2006, described in Note 2 “Inventories,” the Company and its consolidated domestic subsidiaries adopted “Accounting Standard for Measurement of Inventories.” As a consequence, operating income of alcoholic beverages, soft drinks, food and pharma-ceuticals and others decreased by ¥656 million ($7,123 thousand), ¥730 million ($7,926 thousand), ¥170 million ($1,846 thousand) and ¥3 million ($33 thousand), respectively for the year ended December 31, 2009.
As discussed in Note 2 “Property, plant and equipment,” in accordance with the revised Japanese Corporate Tax Law and its regulations, the Company and its consolidated domestic subsidiaries have changed the useful lives for tangible fixed assets in the year ended December 31, 2009. As a consequence, the operating income of the alcoholic beverages and soft drinks businesses decreased by ¥5,961 million ($64,723 thousand) and ¥24 million ($261 thou-sand), respectively, and operating income of food and pharmaceutical business and others increased by ¥100 million ($1,086 thousand) and ¥1 million ($11 thousand), respectively for the year ended December 31, 2009.
Sales outside Japan and sales to foreign customers are less than 10% of the Company’s consolidated net sales for 2009, 2008 and 2007. Therefore, geographical segment information and the overseas sales information are not disclosed.
19. Business Combinations
Transactions applied to purchase method during the year ended December 31, 2009(1) OuTlINE OF ThE TRANSACTIONS(a) Name and business of acquired company
SCHWEPPES HOLDINGS PTY LTDProduction and sales of soft drinks
(b) Outline and purpose of the transactionIn the food and health businesses, the Asahi Breweries Group is to strengthen the operating domain mainly in Asia, and to promote the formulation of the value chain to realize further secure, safe, and high-quality goods with attractive and innovative ideas. In the quest to realize these activities, the Asahi Breweries Group is pursuing the growth of its existing subsidiaries and the synergy between its existing subsidiaries and new operating bases by further investments and aiming to establish the Asahi Breweries Group’s growth path.
As for the soft drinks business, one of the pillars of the Asahi Breweries Group’s operations, the Asahi Breweries Group is aiming to expand the operat-ing base mainly through Asahi Soft Drinks Co., Ltd. in the Japanese domestic market as well as strengthen management bases of Haitai Beverage Co., Ltd. With a significant growth in sales of Tingyi-Asahi-Itochu Beverages Holding Co. Ltd., the Asahi Breweries Group has tried to expand the operating bases in the soft drinks business in Asia, and advanced investments for new businesses as well as promising markets.
By this acquisition, the Asahi Breweries Group is to obtain an operating base not only in Asia but also in Oceania. It is the Asahi Breweries Group’s policy to strengthen its overseas operating bases and accelerate its further growth by realizing group synergies.
(c) Effective date of business combinationApril 3, 2009
(d) Legal form of business combinationShare acquisition by cash
(e) Name of the company after business combinationsSCHWEPPES HOLDING PTY LTD
(f) Share of voting rights acquired100%
(2) PERIOD OF OPERATION OF ACquIRED COMPANY INCluDED IN ThE ACCOMPANYINg CONSOlIDATED FINANCIAl STATEMENTSFrom April 1, 2009 to December 31, 2009
(3) ACquISITION COST OF ACquIRED COMPANY AND ITS BREAkDOwN
Millions of yenThousands of U.S. dollars
Acquisition cost of shares ¥59,828 $649,598Expenditures for acquiring the common shares 1,406 15,266Acquisition cost—Net ¥61,234 $664,864
(4) gOODwIll, REASON FOR RECOgNIzINg gOODwIll, AMORTIzATION METhOD AND AMORTIzATION TERM(a) Amount of goodwill
¥31,855 million(b) Reason for recognizing goodwill
Rationally estimated future excess earning power being expected based on the future business operation.(c) Method and term to amortize goodwill
Straight-line method over 20 years(5) ASSETS AND lIABIlITIES OF ThE ACquIRED COMPANY AS OF ThE DATE OF ThE BuSINESS COMBINATION
Millions of yenThousands of U.S. dollars
Current assets ¥13,989 $151,889Fixed assets 28,111 305,223Total assets ¥42,100 $457,112Current liabilities ¥10,556 $114,615Long-term liabilities 1,024 11,118Total liabilities ¥11,580 $125,733
Note: Amount of goodwill as mentioned in (4), (a) is not included in the above amount of assets and liabilities.

84
(6) ESTIMATED IMPACT ON CONSOlIDATED FINANCIAl RESulTS IF ThE BuSINESS COMBINATION hAD BEEN COMPlETED AT ThE BEgINNINg OF ThE FISCAl YEAR (JANuARY 1, 2009) (uNAuDITED)
Millions of yenThousands of U.S. dollars
Sales ¥13,643 $148,132Operating income 553 6,004Income before income taxes and minority interests 670 7,275Net income 342 3,713Net income per share (yen and U.S. dollars, respectively) ¥ 0.74 $ 0.01
Note: The above estimated amounts were the amounts of the difference between pro forma sales and income calculated as if the business combination had been completed at the beginning of the fiscal year and sales and income per the Company’s consolidated financial statements.
Net income per share was calculated by dividing net income by average number of shares during this fiscal year.
Transactions under common control during the year ended December 31, 2008(1) OuTlINE OF ThE TRANSACTIONS(a) Name and business of combined entity
Divided company: Asahi Soft Drinks Co., Ltd. (“ASD”), Production and sales of soft drinksSuccessor company: Asahi Beverage Service Co., Ltd. (“ABS”), Vending machine sales of soft drinks. (On April 1, 2008, the company name was changed from Asahi Beverage Service Co., Ltd. to Asahi Calpis Beverage Co., Ltd. (“ACB”))Merging company: Asahi Calpis Beverage Co., Ltd. (“ACB”)Merged company: Asahi Calpis Beverage Co., Ltd. (“ACB”) and others (“CBs”), Vending machine sales of soft drinks. (On April 1, 2008, the company name was changed from Asahi Beverage Service Co., Ltd. to Asahi Calpis Beverage Co., Ltd. (“ACB”))
(b) Form of business combinationTransactions under common control (Divestiture of vending machine operation business of ASD and merger with vending machine operating companies.)
(c) Name of the entity after the reorganizationAsahi Soft Drinks Co., Ltd.Asahi Calpis Beverage Co., Ltd.
(d) Outline and purpose of the transactionASD, a consolidated subsidiary of the Company, and, Calpis Co., Ltd. (CALPIS) integrated the vending machine operation business of both companies. The integration aimed at strengthening the relationship of both companies which have entered into a mutual operation contract of the vending machine business since 2001, and becoming more competitive in the vending machine operation business. ACB, which is engaged in the vending machine opera-tion business, was established as a joint venture between ASD and CALPIS in December 2007. ACB acquired all shares of ABS, a subsidiary of ASD and several subsidiaries of CALPIS including CBs, in January 2008. ASD divided and transferred the vending machine business to ABS in April 2008. ACB merged with several subsidiaries of ACB and completed integration of their vending machine operation business in October 2008.
(2) ACCOuNTINg METhODThese transactions were accounted for as a business combination among entities under common control.
Transactions under common control during the year ended December 31, 2007(1) OuTlINE OF ThE TRANSACTIONS(a) Name and business of combined entity
Wakodo Co., Ltd. (“Wakodo”), Food and pharmaceutical business:Manufacture and sale of powdered milk, baby food, food for automatic merchandising, household foods, powdered milk for business use, medicinal sup-plies, quasi drugs, cosmetics, sanitary goods and miscellaneous goods
(b) Form of business combinationTransaction under common control (making Wakodo a wholly-owned subsidiary by exchange of shares)
(c) Name of the entity after the reorganizationWakodo Co., Ltd.
(d) Outline and purpose of the transactionThe Company acquired 5,403,631 shares of Wakodo through a tender offer from April 25, 2006 until May 15, 2006. As a result, the Company held 90.97% of Wakodo’s outstanding shares (92.49% of its voting rights). This conflicted with the delisting standard of the Tokyo Stock Exchange on Decem-ber 31, 2006 and the shares were delisted at the end of April 2007.
Under this circumstance, the Company and Wakodo agreed to make Wakodo a wholly-owned subsidiary of the Company through an acquisition of all the remaining outstanding shares of Wakodo owned by its minority shareholders in exchange for the Company’s shares. The reasons for this exchange of shares are as follows:• Redeeming capital invested by Wakodo’s shareholders• Gaining profits from the effects of synergies in the future by keeping ownership of the Company’s stocks• Achieving speedy and efficient Asahi Breweries Group management by making Wakodo a wholly-owned subsidiary of the Company
(2) ACCOuNTINg METhODAs such share exchange was a transaction with minority shareholders of the transactions under common control, the whole amount of minority interests
have been reversed by making the wholly-owned subsidiary. The difference between the amount of additional investment and the decrease in minority interests was accounted for as goodwill.

85Financial Section
(3) ADDITIONAl ACquISITION OF ShARES OF ThE SuBSIDIARY(a) Acquisition cost
Millions of yen
Common shares ¥2,917Expenditures for acquiring the common shares 83Acquisition cost ¥3,000
(b) Share exchange ratio, its basis for determination, number of shares delivered and its values(i) Type of shares and share exchange ratioCommon sharesAsahi Breweries, Ltd. 1: Wakodo Co., Ltd. 2.9(ii) Basis for determination of share exchange ratio The Company and Wakodo requested Morgan Stanley Securities, Ltd. (“Morgan Stanley”) and Daiwa Securities SMBC Co., Ltd. (“Daiwa SMBC”) to calculate the share exchange ratio as an independent third party. The Company and Wakodo comprehensively decided the share exchange ratio, based on the analysis and opinion presented by Morgan Stanley and Daiwa SMBC after careful consideration and discussion.(iii) Number of shares delivered and values1,554,269 shares¥2,917 million(to consolidated subsidiaries: 192,354 shares ¥361 million)
(c) Goodwill, reason for recognizing goodwill, amortization method and amortization term(i) Amount of goodwill¥863 million(ii) Reason for recognizing goodwill The Company and Wakodo determined the share exchange ratio considering the market price. As a result, the amount of additional investment exceeded the amount of decrease in minority interests by this additional investment.(iii) Method and term to amortize goodwillStraight-line method over 20 years
20. Related Party Transactions
ASBJ Statement No. 11, “Accounting Standard for Related Party Disclosures” and ASBJ Guidance No. 13, “Guidance on Accounting Standard for Related Party Disclosures” issued by the Accounting Standards Boards of Japan on October 17, 2006, require certain additional related party disclosures effective for years beginning on or after January 1, 2009. Pursuant to the new accounting standards, condensed financial information of all 33 equity method affiliates including Tingyi-Asahi-Itochu Beverages Holding Co. Ltd. and its 28 affiliates is disclosed for the year ended December 31, 2009 as follows:
Millions of yenThousands of U.S. dollars
Total current assets ¥123,933 $1,345,635Total fixed assets 242,154 2,629,251Total current liabilities 155,496 1,688,339Total long-term liabilities 27,326 296,699Total shareholders’ equity 183,716 1,994,745Net sales 265,619 2,884,028Income before income taxes and minority interests 27,140 294,680Net income 22,374 242,932
21. Subsequent Event
Appropriations of retained earningsThe following appropriations of retained earnings, which have not been reflected in the accompanying consolidated financial statements for the year ended December 31, 2009, were approved at a general meeting of the shareholders of the Company held on March 26, 2010:
Millions of yenThousands of U.S. dollars
Cash dividends (¥11.0 per share) ¥5,115 $55,537
86
Independent Auditors’ Report
To the Board of Directors ofAsahi Breweries, ltd.
We have audited the accompanying consolidated balance sheets of ASAHI BREWERIES, LTD. (a Japanese corpora-
tion) and consolidated subsidiaries as of December 31, 2009, 2008 and 2007, and the related consolidated
statements of income, changes in net assets and cash flows for each of the three years in the period ended
December 31, 2009, expressed in Japanese yen. These consolidated financial statements are the responsibility of
the Company’s management. Our responsibility is to independently express an opinion on these consolidated
financial statements based on our audits.
We conducted our audits in accordance with auditing standards generally accepted in Japan. Those standards
require that we plan and perform the audit to obtain reasonable assurance about whether the financial statements
are free of material misstatement. An audit includes examining, on a test basis, evidence supporting the amounts
and disclosures in the financial statements. An audit also includes assessing the accounting principles used and
significant estimates made by management, as well as evaluating the overall financial statement presentation. We
believe that our audits provide a reasonable basis for our opinion.
In our opinion, the consolidated financial statements referred to above present fairly, in all material respects,
the consolidated financial position of ASAHI BREWERIES, LTD. and consolidated subsidiaries as of December
31, 2009, 2008 and 2007, and the consolidated results of their operations and their cash flows for each of
the three years in the period ended December 31, 2009, in conformity with accounting principles generally
accepted in Japan.
The U.S. dollar amounts in the accompanying consolidated financial statements with respect to the year ended
December 31, 2009 are presented solely for convenience. Our audit also included the translation of yen amounts
into U.S. dollar amounts and, in our opinion, such translation has been made on the basis described in Note 1 to
the consolidated financial statements.
Tokyo, Japan
March 26, 2010

87Fact Sheets
Fact SheetsMarket Information
01 Beer consumption—top 10 countries*1
global beer market
(Millions of barrels)
1995 2002 2003 2004 2005 2006 2007 2008
China 132.4 203.2 211.2 240.6 263.6 288.9 324.8 351.9
United States 185.9 198.1 198.1 199.7 200.0 202.7 205.1 205.6
Russia 16.8 57.2 63.1 70.1 74.3 81.8 93.8 93.3
Brazil 68.2 73.9 72.4 74.4 77.9 81.3 87.1 88.3
Germany 94.6 85.5 82.8 81.5 81.0 82.2 78.3 77.7
Mexico 34.8 43.6 45.1 46.4 47.9 50.5 54.0 54.8
Japan*2 60.8 59.1 56.1 56.4 53.9 54.0 53.4 52.1
United Kingdom 50.4 50.6 51.4 50.4 48.1 47.4 45.3 43.8
Poland 12.9 22.8 24.2 24.9 26.2 27.7 29.8 30.4
Spain 23.0 26.2 28.5 29.4 29.5 29.8 30.4 27.8
02 world’s top 10 beer brands*1 in 2008 03 Per capita beer consumption in major nations in 2008
*1 Excludes non-alcoholic brews. *2 Includes happoshu and new genre.Source: Impact Databank 2009 Edition
*1 Includes exports and license volume.*2 One U.S. barrel = 1.173477653 hectoliters.Source: Impact Databank 2009 Edition
*1 Consumption tax represents the consumption tax in Japan, value-added tax in European countries, and retail sales tax in the U.S.*2 Cash values (liquor tax, consumption taxes) shown in yen per 633 milliliters.*3 Foreign exchange rates were: €1 = ¥135.53; U.S.$1 = ¥96.01; £1 = ¥159.54 (based on TTM rate as of June 2009).*4 Figures for the U.S. based on survey conducted in Los Angeles.Source: Brewers Association of Japan (June 2009)
04 Ratio of liquor tax and consumption tax*1,4 in retail prices for beer in major nations
05 Beer tax and consumption tax*1,2,3,4 in major nations
* Based on total population. One U.S. gallon = 3.785 liters.Source: Impact Databank 2009 Edition
Budweiser Snow Skol Miller BrahmaHeineken Coors TsingtaoCorona Asahi0
20
40
60
80
19.6
77.5
52.0
30.3 28.7 27.623.824.8 22.2 20.6
(Millions of barrels*2)
Germany UnitedKingdom
UnitedStates
Japan France China0
10
20
30
8.2
29.2
22.320.6
12.6
8.3
(Gallons per person*)
0
20
40
60
80
100 54.4
40.44.8
54.8
5.4
17.3
77.3
4.3
16.1
79.6
5.88.5
85.7
29.6
16.0
Japan Germany UnitedStates
France UnitedKingdom
0
40
80
120
160
37
139
155
16
11
47
36
7
33
2612
30
1868
105
Japan Germany UnitedStates
France UnitedKingdom
(%) Beer tax amount Consumption tax amount(Yen) Ratio of liquor tax Ratio of consumption tax Pre-tax retail price

88
06 Taxable shipment volume in Japan in 2009
Japan’s alcoholic beverages market Refer to inside front cover for details on beer-type beverage categories (beer, happoshu, and new genre beverages).
07 Comparison of liquor taxes per 350 milliliters
Compiled from National Tax Agency reference materials.
ConsumerMaker Wholesaler
Retailer
Supermarket
Convenience store
Discount store (outlet)
Bars and restaurants
License required for wholesaling alcoholic beverages.
License required for retailing over-the-counter alcoholic beverages.
Beer
33.8%
Sake
7.5%
Whisky
1.0%Other
1.2%Shochu
11.2%
Happoshu
13.3%Zasshu (brewed liquor; includes no-malt beverages)
8.4%
Liqueurs (includes RTD beverages and no-malt beverages)
17.8%
Wines (includes RTD beverages)
2.9%
Spirits (includes RTD beverages)
2.8%total
9,050,805kl
* Beer-type beverages: their tax amounts are derived from representative products in the market.
08 Distribution route of Japan’s alcoholic beverages industry
77.0
47.0
28.0
28.0
28.0
28.0
28.0
Alcoholic beverages Malt component ratio Alcohol content Tax amount (Yen)
Beer* 67% and above 5.0%
Happoshu* Below 25% 5.5%
Liqueurs* Below 50% 5.0%
Zasshu* 0% 5.0%
Liqueurs (canned chu-hi) — 7.0%
Sparkling Wine (low-alcohol) — 8.0%
Wines — 12.0%
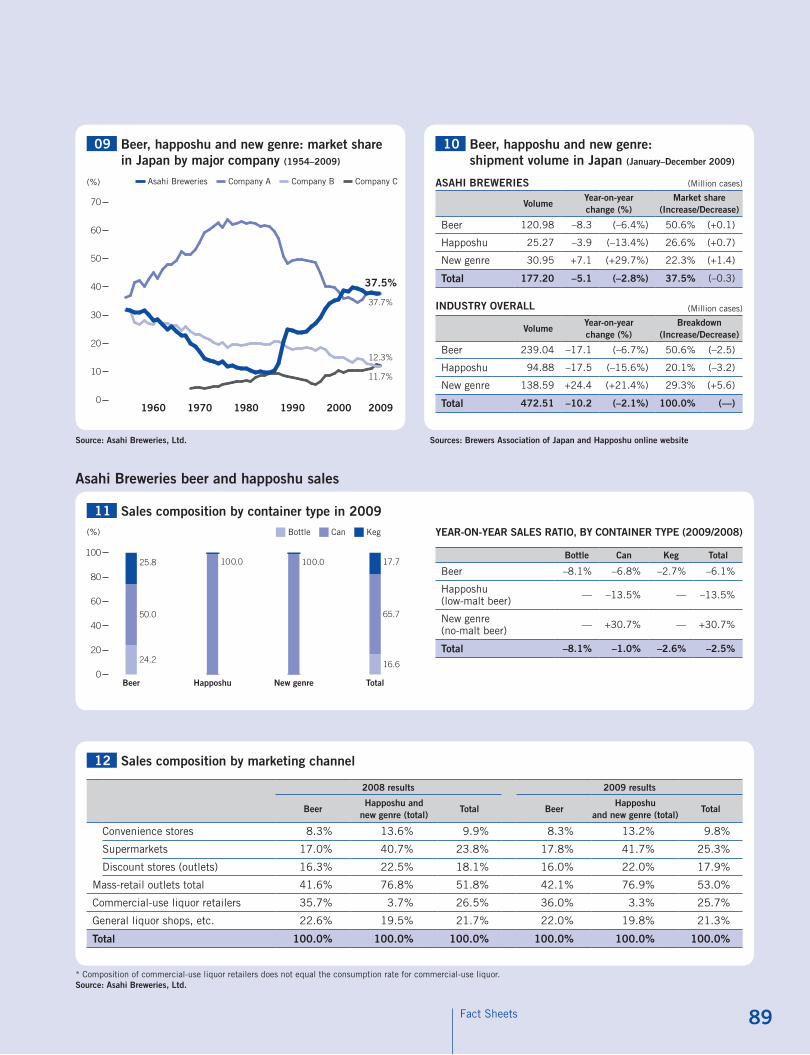
89Fact Sheets
10 Beer, happoshu and new genre: shipment volume in Japan (January–December 2009)
09 Beer, happoshu and new genre: market share in Japan by major company (1954–2009)
* Composition of commercial-use liquor retailers does not equal the consumption rate for commercial-use liquor.Source: Asahi Breweries, ltd.
2008 results 2009 results
Beerhapposhu and
new genre (total)Total Beer
happoshu and new genre (total)
Total
Convenience stores 8.3% 13.6% 9.9% 8.3% 13.2% 9.8%
Supermarkets 17.0% 40.7% 23.8% 17.8% 41.7% 25.3%
Discount stores (outlets) 16.3% 22.5% 18.1% 16.0% 22.0% 17.9%
Mass-retail outlets total 41.6% 76.8% 51.8% 42.1% 76.9% 53.0%
Commercial-use liquor retailers 35.7% 3.7% 26.5% 36.0% 3.3% 25.7%
General liquor shops, etc. 22.6% 19.5% 21.7% 22.0% 19.8% 21.3%
Total 100.0% 100.0% 100.0% 100.0% 100.0% 100.0%
ASAhI BREwERIES (Million cases)
volumeYear-on-year change (%)
Market share (Increase/Decrease)
Beer 120.98 –8.3 (–6.4%) 50.6% (+0.1)
Happoshu 25.27 –3.9 (–13.4%) 26.6% (+0.7)
New genre 30.95 +7.1 (+29.7%) 22.3% (+1.4)
Total 177.20 –5.1 (–2.8%) 37.5% (–0.3)
INDuSTRY OvERAll (Million cases)
volumeYear-on-year change (%)
Breakdown (Increase/Decrease)
Beer 239.04 –17.1 (–6.7%) 50.6% (–2.5)
Happoshu 94.88 –17.5 (–15.6%) 20.1% (–3.2)
New genre 138.59 +24.4 (+21.4%) 29.3% (+5.6)
Total 472.51 –10.2 (–2.1%) 100.0% (—)
YEAR-ON-YEAR SAlES RATIO, BY CONTAINER TYPE (2009/2008)
Bottle Can keg Total
Beer –8.1% –6.8% –2.7% –6.1%
Happoshu (low-malt beer) — –13.5% — –13.5%
New genre (no-malt beer) — +30.7% — +30.7%
Total –8.1% –1.0% –2.6% –2.5%
12 Sales composition by marketing channel
Source: Asahi Breweries, ltd. Sources: Brewers Association of Japan and happoshu online website
11 Sales composition by container type in 2009
Asahi Breweries beer and happoshu sales
0
20
40
60
80
100
Beer Happoshu New genre Total
24.2
25.8
50.0
100.0 100.0
16.6
17.7
65.7
1960 1970 1980 1990 20092000
37.7%
11.7%
12.3%
37.5%
0
10
20
30
40
50
60
70
(%) Asahi Breweries Company A Company B Company C
(%) Bottle Can Keg
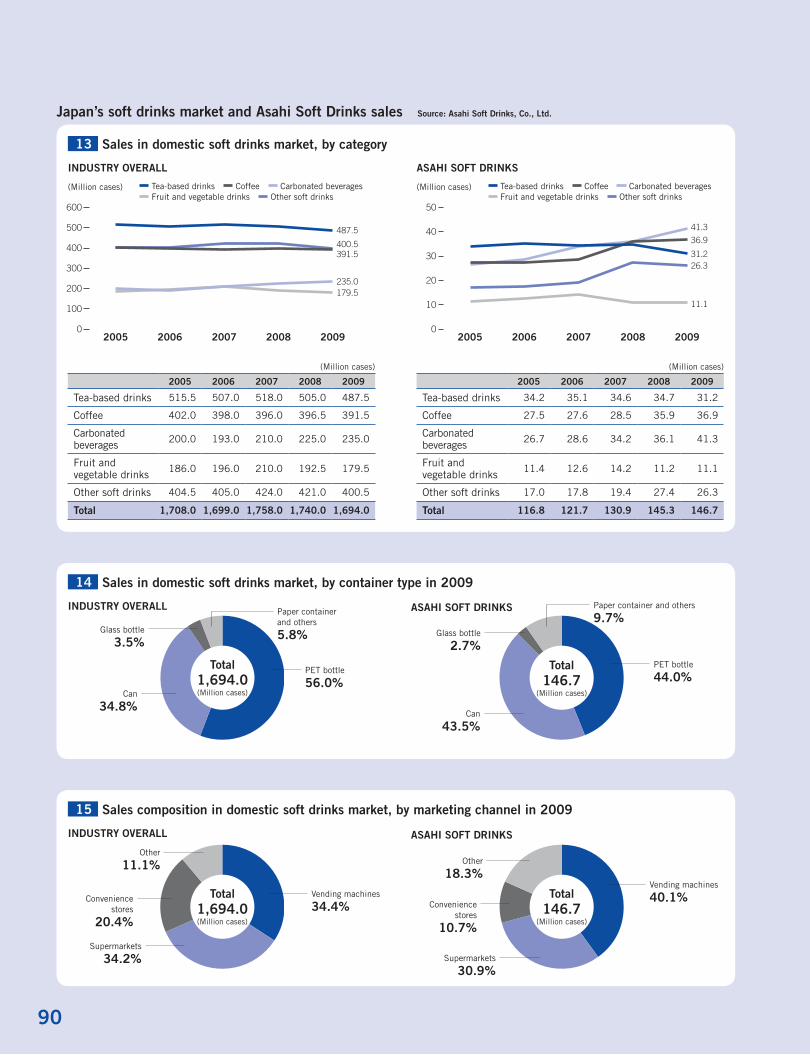
90
Japan’s soft drinks market and Asahi Soft Drinks sales Source: Asahi Soft Drinks, Co., ltd.
13 Sales in domestic soft drinks market, by category
14 Sales in domestic soft drinks market, by container type in 2009
15 Sales composition in domestic soft drinks market, by marketing channel in 2009
INDuSTRY OvERAll
INDuSTRY OvERAll
ASAhI SOFT DRINkS
ASAhI SOFT DRINkS
(Million cases)
2005 2006 2007 2008 2009
Tea-based drinks 515.5 507.0 518.0 505.0 487.5
Coffee 402.0 398.0 396.0 396.5 391.5
Carbonated beverages 200.0 193.0 210.0 225.0 235.0
Fruit and vegetable drinks 186.0 196.0 210.0 192.5 179.5
Other soft drinks 404.5 405.0 424.0 421.0 400.5
Total 1,708.0 1,699.0 1,758.0 1,740.0 1,694.0
Paper container and others
5.8%
Paper container and others
9.7%
0
20
10
30
40
50
31.2
41.3
36.9
26.3
11.1
2005 2006 2007 2008 20090
200
100
300
400
500
600
391.5
487.5
400.5
235.0179.5
2005 2006 2007 2008 2009
(Million cases) Tea-based drinks Coffee Carbonated beverages Fruit and vegetable drinks Other soft drinks
(Million cases) Tea-based drinks Coffee Carbonated beverages Fruit and vegetable drinks Other soft drinks
PET bottle
56.0%
PET bottle
44.0%Can
34.8%Can
43.5%
Glass bottle
3.5%Glass bottle
2.7%
Other
11.1% Other
18.3%Vending machines
34.4%
Vending machines
40.1%
Supermarkets
34.2% Supermarkets
30.9%
Convenience stores
20.4%Convenience
stores
10.7%
Total1,694.0(Million cases)
Total1,694.0(Million cases)
Total146.7
(Million cases)
Total146.7
(Million cases)
INDuSTRY OvERAll ASAhI SOFT DRINkS
(Million cases)
2005 2006 2007 2008 2009
Tea-based drinks 34.2 35.1 34.6 34.7 31.2
Coffee 27.5 27.6 28.5 35.9 36.9
Carbonated beverages 26.7 28.6 34.2 36.1 41.3
Fruit and vegetable drinks 11.4 12.6 14.2 11.2 11.1
Other soft drinks 17.0 17.8 19.4 27.4 26.3
Total 116.8 121.7 130.9 145.3 146.7
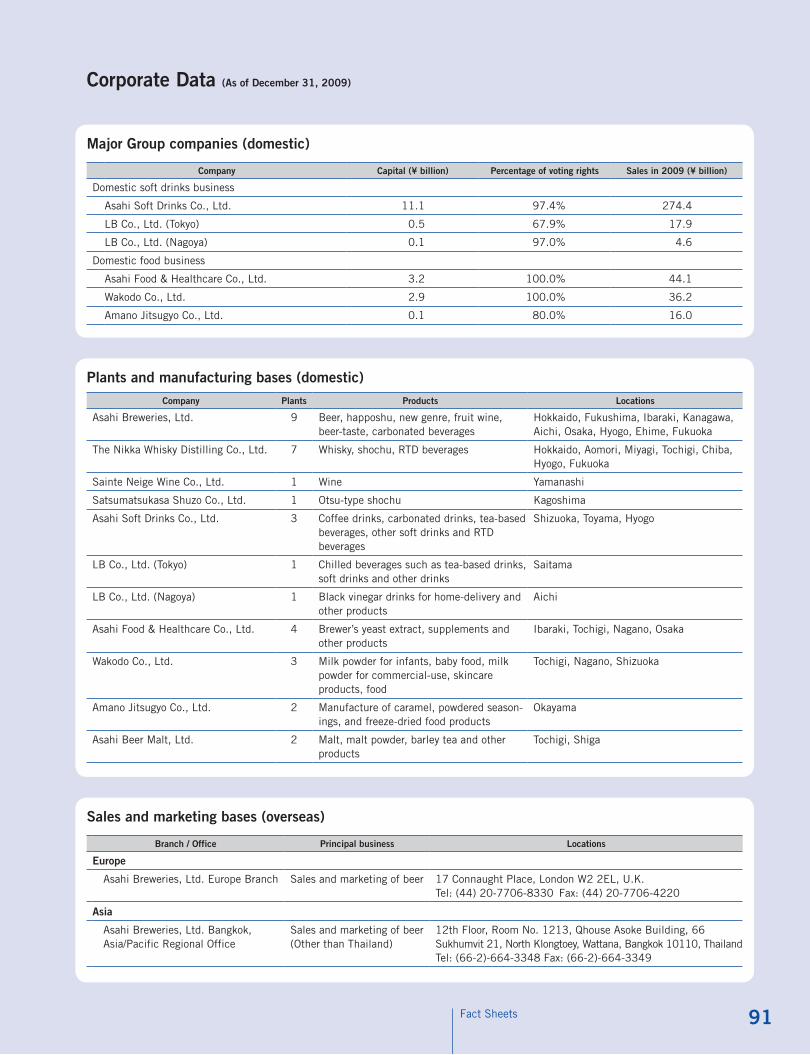
91Fact Sheets
Corporate Data (As of December 31, 2009)
Major group companies (domestic)
Sales and marketing bases (overseas)
Company Capital (¥ billion) Percentage of voting rights Sales in 2009 (¥ billion)
Domestic soft drinks business
Asahi Soft Drinks Co., Ltd. 11.1 97.4% 274.4
LB Co., Ltd. (Tokyo) 0.5 67.9% 17.9
LB Co., Ltd. (Nagoya) 0.1 97.0% 4.6
Domestic food business
Asahi Food & Healthcare Co., Ltd. 3.2 100.0% 44.1
Wakodo Co., Ltd. 2.9 100.0% 36.2
Amano Jitsugyo Co., Ltd. 0.1 80.0% 16.0
Branch / Office Principal business locations
Europe
Asahi Breweries, Ltd. Europe Branch Sales and marketing of beer 17 Connaught Place, London W2 2EL, U.K.Tel: (44) 20-7706-8330 Fax: (44) 20-7706-4220
Asia
Asahi Breweries, Ltd. Bangkok, Asia/Pacific Regional Office
Sales and marketing of beer (Other than Thailand)
12th Floor, Room No. 1213, Qhouse Asoke Building, 66 Sukhumvit 21, North Klongtoey, Wattana, Bangkok 10110, ThailandTel: (66-2)-664-3348 Fax: (66-2)-664-3349
Plants and manufacturing bases (domestic)Company Plants Products locations
Asahi Breweries, Ltd. 9 Beer, happoshu, new genre, fruit wine, beer-taste, carbonated beverages
Hokkaido, Fukushima, Ibaraki, Kanagawa, Aichi, Osaka, Hyogo, Ehime, Fukuoka
The Nikka Whisky Distilling Co., Ltd. 7 Whisky, shochu, RTD beverages Hokkaido, Aomori, Miyagi, Tochigi, Chiba, Hyogo, Fukuoka
Sainte Neige Wine Co., Ltd. 1 Wine Yamanashi
Satsumatsukasa Shuzo Co., Ltd. 1 Otsu-type shochu Kagoshima
Asahi Soft Drinks Co., Ltd. 3 Coffee drinks, carbonated drinks, tea-based beverages, other soft drinks and RTD beverages
Shizuoka, Toyama, Hyogo
LB Co., Ltd. (Tokyo) 1 Chilled beverages such as tea-based drinks, soft drinks and other drinks
Saitama
LB Co., Ltd. (Nagoya) 1 Black vinegar drinks for home-delivery and other products
Aichi
Asahi Food & Healthcare Co., Ltd. 4 Brewer’s yeast extract, supplements and other products
Ibaraki, Tochigi, Nagano, Osaka
Wakodo Co., Ltd. 3 Milk powder for infants, baby food, milk powder for commercial-use, skincare products, food
Tochigi, Nagano, Shizuoka
Amano Jitsugyo Co., Ltd. 2 Manufacture of caramel, powdered season-ings, and freeze-dried food products
Okayama
Asahi Beer Malt, Ltd. 2 Malt, malt powder, barley tea and other products
Tochigi, Shiga

92
Major group companies (overseas)
Company CapitalPercentage of voting rights
Principal business locations
united States
Asahi Beer U.S.A., Inc. US$32 million 100.0% Sales and marketing of beer
headquarters & los Angeles Branch: 3625 Del Amo Blvd., Suite 250, Torrance, CA 90503, u.S.A.
Tel: (1) 310-214-9051 Fax: (1) 310-542-5108
New York Branch: 300 hamilton Ave., Suite 209, white Plains, NY 10606, u.S.A.
Tel: (1) 914-288-0788 Fax: (1) 914-288-0744
Europe
Buckinghamshire Golf Company Limited
£40.0 million 100.0% Ownership and management of a golf club
Denham Court Drive, Denham Buckinghamshire uB9 5Bg, u.k.
Tel: (44) 1895-835-777 Fax: (44) 1895-835-210
Asia
Hangzhou Xihu Beer Asahi Co., Ltd.
RMB276 million
55.0% Production and sales of beer
545 xixi Road, hangzhou, zhejiang, China
Tel: (86) 571-8502-1919 Fax: (86) 571-8512-2654
Yantai Beer Tsingtao Asahi Co., Ltd.
RMB219 million
51.0% Production and sales of beer
100 huanshan Road Yantai, Shandong, China
Tel: (86) 535-608-2283 Fax: (86) 535-608-6279
Beijing Beer Asahi Co., Ltd. RMB609 million
72.8% Production and sales of beer
North 1 Yanqi Road, Yanqi Industrial Development zone, huairou District, Beijing, China
Tel: (86) 10-6567-7001 Fax: (86) 10-6566-6885
Shenzhen Tsingtao Beer Asahi Co., Ltd.
RMB249 million
29.0% Production and sales of beer
hongqiaotou village, Songgang Town Baoan District, Shenzhen, China
Tel: (86) 755-2705-8200 Fax: (86) 755-2705-7146
Asahi Beer (Shanghai) Product Services Co., Ltd.
RMB345 million
100.0% Sales of beer and soft drinks
No. 1205, 12th Floor, westgate Mall 1038 Nanjing Rd. (w), Shanghai, China
Tel: (86) 21-6267-2052 Fax: (86) 21-6267-2082
Tingyi-Asahi Beverages Holding Co., Ltd.
US$10 thousand
40.0% Production and sales of soft drinks
No. 15, 3rd Avenue, T.E.D.A, Tianjin, China
Tel: (86) 22-6529-8888 Fax: (86) 22-6529-8877
Haitai Beverage Co., Ltd. KRW94,140 million
58.0% Production and sales of soft drinks
17th Floor, CBS Bldg., 917-1, Mok-Dong, Yangchon-gu, Seoul, 158-050 korea
Tel: (82) 2-3219-7114 Fax: (82) 2-2651-9084
Schweppes Australia Pty Ltd. AU$200 million
100.0% Production and sales of soft drinks
level 5, 111 Cecil Street, South Melbourne vIC 3205, Australia
Tel: (61) 3-8866-3888 Fax: (61) 3-8866-3879

The Asahi Breweries Group is anchored by alcoholic beverages, including beer-type*1, shochu, and RTD (ready-to-
drink) beverages, whisky and spirits, and wine, also handling soft drinks and chilled beverages in its soft drinks business, along with
functional foods, baby foods and other products in the food business. The Group controls powerful brands in the Japanese market, including
Asahi Super Dry beer in the alcoholic beverages business and WONDA canned coffee in the soft drinks business. Overseas, the Group is
broadening its business horizons through partnerships with Tsingtao Brewery Company Limited (Tsingtao Brewery) and Tingyi-Asahi Beverages
Holding Co., Ltd. in China, the acquisition of Schweppes Australia, and other actions.
P4
HEAD OFFICE23-1, Azumabashi 1-chome, Sumida-ku, Tokyo 130-8602, JapanTel: +81-3-5608-5126Fax: +81-3-5608-7121URL: http://www.asahibeer.co.jp/english
DATE OF ESTABLISHMENTSeptember 1, 1949
MAJOR DOMESTIC OFFICES AND BREWERIESRegional Headquarters and Branches: 20Breweries: 9Laboratories: 9
NUMBER OF OVERSEAS OFFICESBusiness Offices: 3
NUMBER OF EMPLOYEESConsolidated: 17,316Non-consolidated: 3,719
FISCAL YEAR-END DATEDecember 31, on an annual basis
DIVIDENDSYear-end: To shareholders of record on December 31Interim: To shareholders of record on June 30
PAID-IN CAPITAL¥182,531 million
NUMBER OF SHARES OF COMMON STOCK ISSUED483,585,862
NUMBER OF SHAREHOLDERS119,908 (4,458 more than last fiscal year)
ORDINARY GENERAL MEETING OF SHAREHOLDERSThe ordinary general meeting of shareholders of the Company is normally held in March each year in Tokyo, Japan. In addition, the Company may hold an extraordinary meeting of shareholders as necessary, giving at least two weeks prior notice to shareholders.
Investor Information (As of December 31, 2009)
COMPOSITION OF SHAREHOLDERS (%)
Financial institutions 37.8
Overseas corporations, etc. 26.8
Individuals, other 16.9
Other corporations 16.3
Securities companies 2.2
* Treasury stock is included under “Individuals, other.”
MAJOR SHAREHOLDERS
Shareholder NamePercentage of
voting rights (%)
Japan Trustee Services Bank, Ltd. (Trust Account) 4.5%
The Master Trust Bank of Japan, Ltd. (Trust Account) 4.4%
Asahi Kasei Corporation 3.9%
The Dai-ichi Mutual Life Insurance Company 3.5%
Fukoku Mutual Life Insurance Company 3.5%
Sumitomo Mitsui Banking Corporation 1.9%
The Sumitomo Trust & Banking Co., Ltd. 1.7%
Sumitomo Life Insurance Company 1.5%
Mizuho Corporate Bank, Ltd. 1.2%
The Norinchukin Bank 1.2%
* While Asahi Breweries, Ltd. owns 18,576,000 shares of treasury stock, it is not included with the major shareholders listed above.
STOCK EXCHANGE LISTINGSTokyo Stock Exchange, Osaka Securities Exchange
NEWSPAPER FOR OFFICIAL NOTICENihon Keizai Shimbun
TRANSFER AGENT AND REGISTRAR STOCK TRANSFER AGENT: The Sumitomo Trust & Banking Co., Ltd. 2-3-1 Yaesu, Chuo-ku, Tokyo
HANDLING OFFICE: The Sumitomo Trust & Banking Co., Ltd. Stock Transfer Agency Department 1-4-4 Marunouchi, Chiyoda-ku, Tokyo
AUDITORKPMG AZSA & Co.
2009/1 2009/3 2009/5 2009/7 2009/9 2009/11
(¥)
(million shares)
0
5
10
20
15
1,000
1,200
1,400
1,600
SHARE PRICE RANGE AND TRADING VOLUME ON THE TOKYO STOCK EXCHANGE (COMMON STOCK)
93
Corporate Philosophy
The Asahi Breweries Group aims to satisfy its customers
with the highest levels of quality and integrity,
while contributing to the promotion of
healthy living and the enrichment of society worldwide.
Long-Term Vision 2015
Striving for transforming the bounty of nature into the “Kando” of food while becoming a trusted company with global quality.Corporate Brand Statement
Share the “Kando”*2
Always creating new value moves people’s hearts and forms a strong bond. Always imagining a fresh
tomorrow moves people’s hearts and helps them shine. Sharing these emotional experiences with as many
people as possible—this is the mission of the Asahi Breweries Group.
2 Financial Highlights 4 Our Vision 4 Special Feature: Our Commitment 8 To Our Shareholders and Friends
10 Our Strategies 10 A Message From New Group President
Naoki Izumiya 18 Review of Operations Asahi at a Glance 20 Alcoholic Beverages Business 26 Soft Drinks Business 30 Food Business 34 Overseas Operations 38 Research and Development
Contents
Long-Term Vision 2015, our vision for the Asahi Breweries Group by 2015, comprises two parts: a Group management philosophy and a
corporate brand statement. Based on the statement of purpose and the code of conduct outlined in the management philosophy, we will
strive to realize our long-term vision by pursuing the goal of creating fresh value set out in the corporate brand statement.
*1 In this report, “beer” refers to beverages made from malt (at least two-thirds) and supplementary ingredients from a government-specified list (including malt, barley, hops, rice, corn and starch).
“Happoshu” refers to beverages with less than two-thirds malt content and containing other ingredients not specified for use in beer. Happoshu is defined as a sparkling alcoholic beverage that contains malt or barley as an ingredient. “New genre beverages” refers to beverages that taste like beer but cannot
be categorized as either beer or happoshu. Two types of new genre beverages are currently available on the market: malt-type, which blends malt-based happoshu with another type of alcohol such as spirits; and non-malt type, which uses soy beans or other ingredients in place of malt.
*2 Kando is an emotion experienced in various ways. It can be an extreme satisfaction, an extraordinary feeling beyond one’s expectations, and/or a sensitively touching and moving sensation.

Asahi World
Asahi Breweries, Ltd.ANNUAL REPORT 2009
Annual R
eport 20
09
ASAHI BREWERIES, LTD.http://www.asahibeer.co.jp/english
For more IR information, please contact our Investor Relations Office
(Public Relations Department)
1-23-1, Azumabashi, Sumida-ku, Tokyo 130-8602, Japan
Tel: +81-3-5608-5126 Fax: +81-3-5608-7121
E-mail: [email protected]
Recommended