H A M P T O N R O A D S T R A N S I T
Annual Financial Statements
Transportation District Commission of Hampton Roads Hampton, Virginia
Years EndedJune 30 , 2016 & 2015
TRANSPORTATION DISTRICT COMMISSION OF HAMPTON ROADS TABLE OF CONTENTS
INTRODUCTORY SECTION Organizational Chart ......................................................................................................................................... 1 Members of the Commission ............................................................................................................................ 2 Executive Leadership Team and Finance Staff ................................................................................................ 3 GFOA Certificate of Achievement for Excellence in Financial Reporting ......................................................... 4
FINANCIAL SECTION Report of Independent Auditor ...................................................................................................................... 5-7 Management’s Discussion and Analysis .................................................................................................... 8-12
FINANCIAL STATEMENTS Statements of Net Position ....................................................................................................................... 13 Statements of Revenue, Expenses, and Changes in Net Position .......................................................... 14 Statements of Cash Flows ................................................................................................................. 15-16 Notes to Financial Statements ........................................................................................................... 17-44
REQUIRED SUPPLEMENTARY INFORMATION Schedule of Changes in Net Pension Liability (Asset) and Related Ratios.............................................. 45-46 Schedule of Employer Contributions ........................................................................................................ 47-48 Notes to Required Supplementary Information ........................................................................................ 49-50
SUPPLEMENTARY INFORMATION Enterprise Fund - Transit Activity Schedule of Revenue - Actual and Budgeted .......................................................................................... 51 Enterprise Fund - Transit Activity Schedule of Expenses - Actual and Budgeted ......................................................................................... 52
STATISTICAL SECTION Net Position and Changes in Net Position - Last Ten Years .......................................................................... 53 Demographic and Operating Statistics - Last Ten Years ............................................................................... 54 Operating Indicators - Last Ten Years ...................................................................................................... 55-56
COMPLIANCE SECTION Report of Independent Auditor on Internal Control Over Financial Reporting and on Compliance and Other Matters Based on an Audit of Financial Statements Performed in Accordance with Government Auditing Standards ....................................................... 57-58 Report of Independent Auditor on Compliance with for Each Major Program and on Internal Control Over Compliance Required by the Uniform Guidance .................. 59-60 Schedule of Expenditures of Federal Awards .......................................................................................... 61-62 Notes to Schedule of Expenditures of Federal Awards .................................................................................. 63 Schedule of Findings and Questioned Costs ................................................................................................. 64 Schedule of Prior Year Audit Findings and Corrective Action Plan ............................................................... 65

INTRODUCTORY SECTION

TRANSPORTATION DISTRICT COMMISSION OF HAMPTON ROADS ORGANIZATIONAL CHART JUNE 30, 2016
1
TDCHRCommission
Internal AuditorMargaret Denoncourt
President and CEOWilliam Harrell
Assistant to the Presidentfor Organizational Advancement
Brian Smith
Chief Financial OfficerBrandon Singleton
Chief Information Officer/Chief Technology Officer
Alesia Cain
Chief Human Resources OfficerKimberly Ackerman
Chief Transit Operations OfficerJames Price
Chief Planning and Development Officer
Ray Amoruso
Interim Chief Safety and Security OfficerVelvet Smiley
Chief Engineering and Facilities Officer
Sibyl Pappas
Director of Marketingand Communications
Gene Cavasos
AttorneyRobert Travers
General Counsel*David Burton
Williams Mullen
Commission TreasurerBrandon Singleton
Note: The General Counsel and Internal Auditor report to the president/CEO on daily business matters; but they serve at the pleasure of the Commission and have direct access to the commission as required. *Additional support provided by Attorney.

TRANSPORTATION DISTRICT COMMISSION OF HAMPTON ROADS MEMBERS OF THE COMMISSION JUNE 30, 2016
2
CHAIRMAN
James P. Toscano (resigned May 31, 2016)
City of Norfolk
VICE – CHAIRMAN/ACTING CHAIRMAN (as of June 1, 2016)
James L. Wood
City of Virginia Beach
COMMISSIONERS
Linwood Branch
City of Virginia Beach
Douglas W. Fuller City of Chesapeake
Robert R. Harper, Jr.
City of Hampton
Charles B. Hunter City of Portsmouth
Jennifer Mitchell
Virginia Department of Rail and Public Transportation
William J. Moffett City of Hampton
Allen C. Tanner, Jr.
City of Newport News
Richard W. West City of Chesapeake
Barclay C. Winn
City of Norfolk
Patricia P. Woodbury City of Newport News
Kenneth I. Wright City of Portsmouth

TRANSPORTATION DISTRICT COMMISSION OF HAMPTON ROADS EXECUTIVE LEADERSHIP TEAM AND FINANCE STAFF JUNE 30, 2016
3
EXECUTIVE LEADERSHIP TEAM
President and Chief Executive Officer William E. Harrell
Chief Financial Officer Brandon K. Singleton
Chief Human Resources Officer Kimberly Ackerman
Chief Planning and Development Officer Raymond Amoruso
Chief Information Officer/Chief Technology Officer Alesia Cain
Interim Chief Safety and Security Officer Velvet Smiley
Chief Environmental and Facilities Officer Sibyl Pappas
Chief Transit Operations Officer James E. Price, Jr.
FINANCE STAFF
Director of Finance Sylvia L. Shanahan
Assistant Director of Finance Debbie L. Ball
Finance Manager Hien Hoang
Director of Budget and Finance Angela Glass
Director of Procurement Dyanne Sampson
Manager of Revenue Services Sheri Dixon

TRANSPORTATION DISTRICT COMMISSION OF HAMPTON ROADS GFOA CERTIFICATE OF ACHIEVEMENT FOR EXCELLENCE IN FINANCIAL REPORTING
4

FINANCIAL SECTION
5
Report of Independent Auditor Commissioners Transportation District Commission of Hampton Roads Hampton, Virginia Report on the Financial Statements We have audited the accompanying financial statements of the Transportation District Commission of Hampton Roads (the “Commission”), as of and for the year ended June 30, 2016, and the related notes to financial statements, as listed in the table of contents. Management’s Responsibility for the Financial Statements Management is responsible for the preparation and fair presentation of these financial statements in accordance with accounting principles generally accepted in the United States of America; this includes the design, implementation, and maintenance of internal control relevant to the preparation and fair presentation of financial statements that are free from material misstatement, whether due to fraud or error. Auditors’ Responsibility Our responsibility is to express an opinion on these financial statements based on our audit. We conducted our audit in accordance with auditing standards generally accepted in the United States of America, the standards applicable to the financial audits contained in Government Auditing Standards, issued by the Comptroller General of the United States and the Specification for Audits of Authorities, Boards, and Commissions issued by the Auditor of Public Accounts of the Commonwealth of Virginia. Those standards and specifications require that we plan and perform the audit to obtain reasonable assurance about whether the financial statements are free from material misstatement. An audit involves performing procedures to obtain audit evidence about the amounts and disclosures in the financial statements. The procedures selected depend on the auditors’ judgment, including the assessment of the risks of material misstatement of the financial statements, whether due to fraud or error. In making those risk assessments, the auditor considers internal control relevant to the entity’s preparation and fair presentation of the financial statements in order to design audit procedures that are appropriate in the circumstances, but not for the purpose of expressing an opinion on the effectiveness of the entity’s internal control. Accordingly, we express no such opinion. An audit also includes evaluating the appropriateness of accounting policies used and the reasonableness of significant accounting estimates made by management, as well as evaluating the overall presentation of the financial statements. We believe that the audit evidence we have obtained is sufficient and appropriate to provide a basis for our audit opinion. Opinion In our opinion, the financial statements referred to above present fairly, in all material respects, the financial position of the Commission, as of June 30, 2016, and the changes in financial position and cash flows thereof for the year then ended in accordance with accounting principles generally accepted in the United States of America.

6
Prior Period Financial Statements The financial statements of the Commission, as of June 30, 2015, were audited by other auditors whose report dated November 24, 2015, expressed an unmodified opinion on those statements. Other Matters Required Supplementary Information Accounting principles generally accepted in the United States of America require that the management’s discussion and analysis on pages 8-12 and the pension information on pages 45-50 be presented to supplement the basic financial statements. Such information, although not a part of the basic financial statements, is required by the Government Auditing Standards Board, who considers it to be an essential part of financial reporting for placing the basic financial statements in an appropriate operational, economic, or historical context. We have applied certain limited procedures to the required supplementary information in accordance with auditing standards generally accepted in the United States of America, which consisted of inquiries of management about the methods of preparing the information and comparing the information for consistency with management’s responses to our inquiries, the basic financial statements, and other knowledge we obtained during our audits of the financial statements. We do not express an opinion or provide any assurance on the information because the limited procedures do not provide us with sufficient evidence to express an opinion or provide any assurance. Other Information Our audit was conducted for the purpose of forming an opinion on the financial statements. The Introductory Section, Supplementary Information, and Statistical Section, as listed in the table of contents, are presented for purposes of additional analysis and are not a required part of the basic financial statements. The Schedule of Expenditures of Federal Awards is presented for purposes of additional analysis as required by Title 2 U.S. Code of Federal Regulations (CFR) Part 200, Uniform Administrative Requirements, Cost Principles, and Audit Requirements for Federal Awards, and is not a required part of the basic financial statements. The Supplementary Information and the Schedule of Expenditures of Federal Awards are the responsibility of management and were derived from and relate directly to the underlying accounting and other records used to prepare the basic financial statements. Such information has been subjected to the auditing procedures applied in the audit of the basic financial statements and certain additional procedures, including comparing and reconciling such information directly to the underlying accounting and other records used to prepare the basic financial statements or to the basic financial statements themselves, and other additional procedures in accordance with auditing standards generally accepted in the United States of America. In our opinion, the Supplementary Information and the Schedule of Expenditures of Federal Awards are fairly stated in all material respects in relation to the basic financial statements as a whole. The Introductory and Statistical Sections have not been subjected to the auditing procedures applied in the audit of the basic financial statements and, accordingly, we do not express an opinion or provide any assurance on them.
7
Other Reporting Required by Government Auditing Standards In accordance with Government Auditing Standards, we have also issued our report dated December 14, 2016, on our consideration of the Commission’s internal control over financial reporting and on our tests of its compliance with certain provisions of laws, regulations, contracts, grant agreements, and other matters. The purpose of that report is to describe the scope of our testing of internal control over financial reporting and compliance and the results of that testing, and not to provide an opinion on the internal control over financial reporting or on compliance. That report is an integral part of an audit performed in accordance with Government Auditing Standards in considering the Commission’s internal control over financial reporting and compliance.
Virginia Beach, Virginia December 14, 2016
TRANSPORTATION DISTRICT COMMISSION OF HAMPTON ROADS MANAGEMENT’S DISCUSSION AND ANALYSIS JUNE 30, 2016 AND 2015
8
The following Management Discussion and Analysis (“MD&A”) of the Transportation District Commission of Hampton Roads’ (“Commission”) activities and financial performance provides the reader with an introduction and overview to the basic financial statements for the year ended June 30, 2016. Following this MD&A are the basic financial statements of the Commission together with the notes thereto which are essential to a full understanding of the data contained in the basic financial statements. We encourage readers to read the information presented in conjunction with additional information that we have furnished in the Commission’s basic financial statements, which follow this narrative. Financial Operations Highlights Below are highlights of the Commission’s activities for fiscal year 2016.
The increase in net position for 2016 was $1.4 million. The majority of this change is attributable to a large increase in Capital Grants proceeds due to the purchase and refurbishment of buses.
Operating revenue of $19.7 million were 8% or approximately $1.6 million less than fiscal year 2015, primarily due to decreased contract revenues and a decrease in ridership.
Operating expenses of $128.5 million (including depreciation and amortization) increased by 2% or $2.0 million due to increased personnel costs.
Subsidies and grants of $79.9 million were .3% or approximately $240 thousand less than fiscal year 2015.
At the end of the fiscal year, unrestricted net position was $(5.2) million, an increase of $1.7 million.
Overview of the Financial Statements
The Commission’s basic financial statements, the statement of net position, statement of revenue, expenses, and changes in net position, and statement of cash flows, are prepared on the accrual basis of accounting in accordance with U.S. generally accepted accounting principles promulgated by the Governmental Accounting Standards Board (“GASB”). The Commission is structured as a single enterprise fund with revenue recognized when earned, not when received. Expenses are recognized when incurred, not when they are paid. Capital assets are capitalized and, except land, are depreciated over their useful lives. Certain amounts are restricted for debt service and, where applicable, for construction activities. See the notes to basic financial statements for a summary of the Commission’s significant accounting policies.
TRANSPORTATION DISTRICT COMMISSION OF HAMPTON ROADS MANAGEMENT’S DISCUSSION AND ANALYSIS JUNE 30, 2016 AND 2015
9
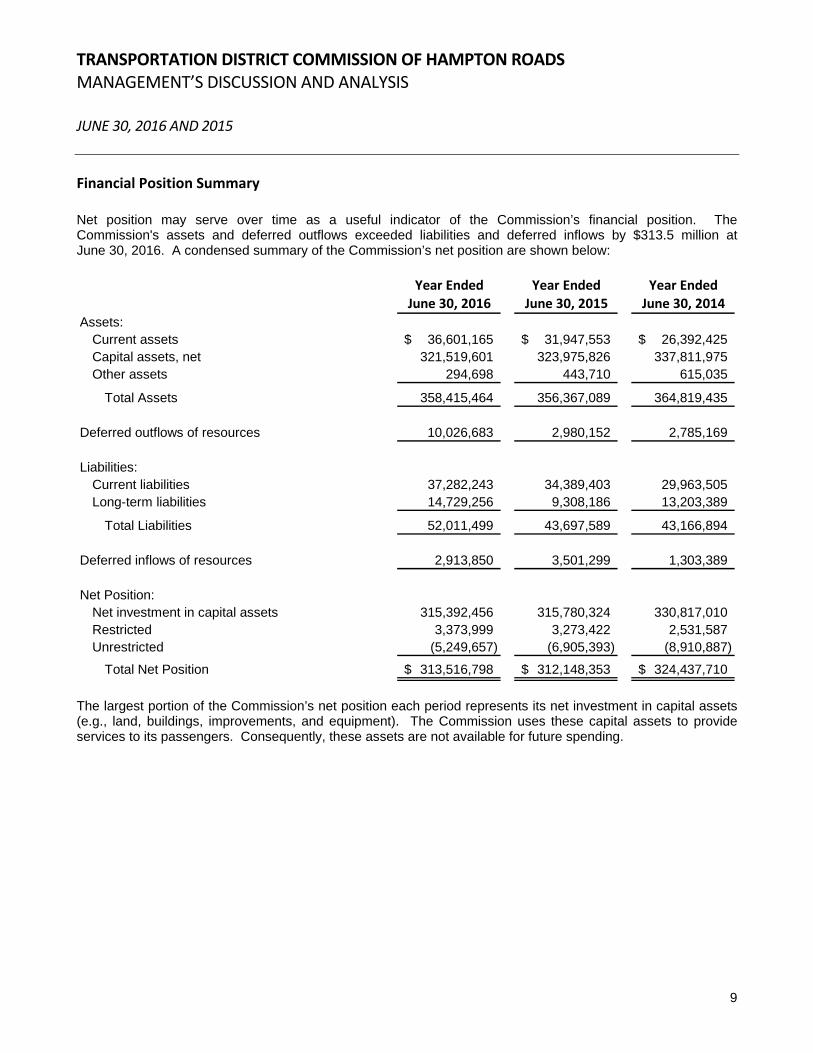
Financial Position Summary Net position may serve over time as a useful indicator of the Commission’s financial position. The Commission's assets and deferred outflows exceeded liabilities and deferred inflows by $313.5 million at June 30, 2016. A condensed summary of the Commission’s net position are shown below:
Year Ended Year Ended Year EndedJune 30, 2016 June 30, 2015 June 30, 2014
Assets:Current assets 36,601,165$ 31,947,553$ 26,392,425$ Capital assets, net 321,519,601 323,975,826 337,811,975 Other assets 294,698 443,710 615,035
Total Assets 358,415,464 356,367,089 364,819,435
Deferred outflows of resources 10,026,683 2,980,152 2,785,169
Liabilities:Current liabilities 37,282,243 34,389,403 29,963,505 Long-term liabilities 14,729,256 9,308,186 13,203,389
Total Liabilities 52,011,499 43,697,589 43,166,894
Deferred inflows of resources 2,913,850 3,501,299 1,303,389
Net Position:Net investment in capital assets 315,392,456 315,780,324 330,817,010 Restricted 3,373,999 3,273,422 2,531,587 Unrestricted (5,249,657) (6,905,393) (8,910,887)
Total Net Position 313,516,798$ 312,148,353$ 324,437,710$
The largest portion of the Commission’s net position each period represents its net investment in capital assets (e.g., land, buildings, improvements, and equipment). The Commission uses these capital assets to provide services to its passengers. Consequently, these assets are not available for future spending.
TRANSPORTATION DISTRICT COMMISSION OF HAMPTON ROADS MANAGEMENT’S DISCUSSION AND ANALYSIS JUNE 30, 2016 AND 2015
10
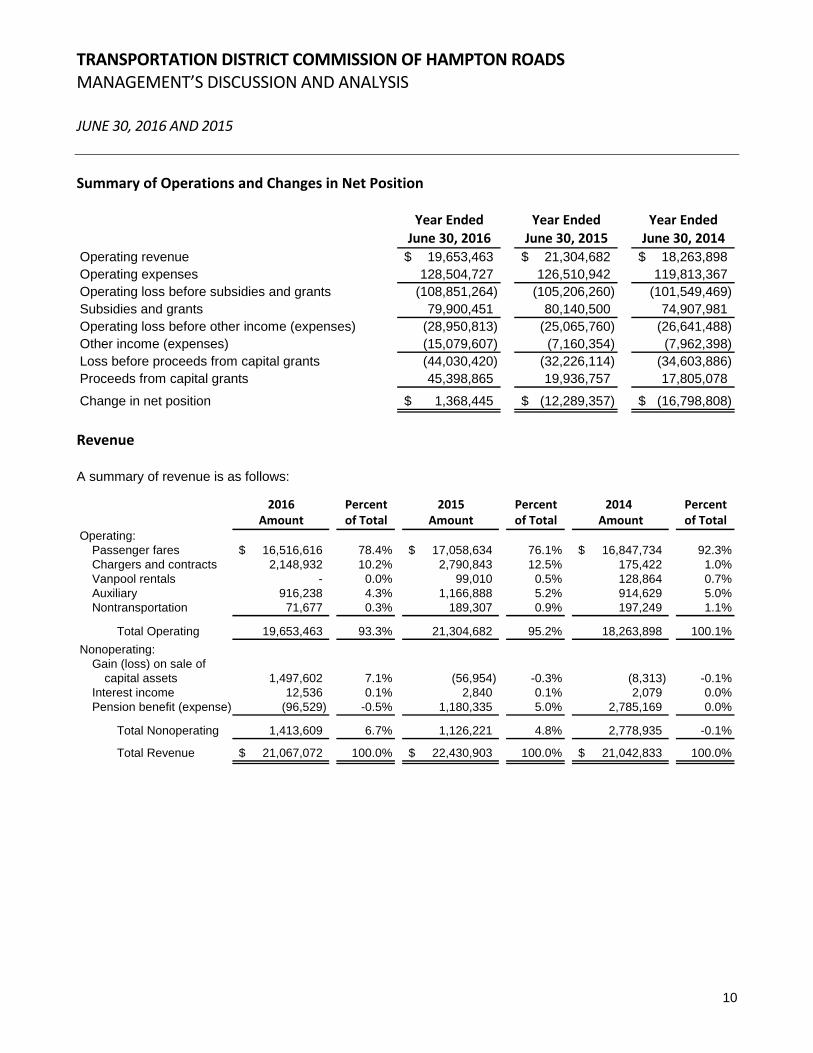
Summary of Operations and Changes in Net Position
Year Ended Year Ended Year EndedJune 30, 2016 June 30, 2015 June 30, 2014
Operating revenue 19,653,463$ 21,304,682$ 18,263,898$ Operating expenses 128,504,727 126,510,942 119,813,367 Operating loss before subsidies and grants (108,851,264) (105,206,260) (101,549,469) Subsidies and grants 79,900,451 80,140,500 74,907,981 Operating loss before other income (expenses) (28,950,813) (25,065,760) (26,641,488) Other income (expenses) (15,079,607) (7,160,354) (7,962,398) Loss before proceeds from capital grants (44,030,420) (32,226,114) (34,603,886) Proceeds from capital grants 45,398,865 19,936,757 17,805,078
Change in net position 1,368,445$ (12,289,357)$ (16,798,808)$
Revenue A summary of revenue is as follows:
2016 Percent 2015 Percent 2014 PercentAmount of Total Amount of Total Amount of Total
Operating:Passenger fares 16,516,616$ 78.4% 17,058,634$ 76.1% 16,847,734$ 92.3%Chargers and contracts 2,148,932 10.2% 2,790,843 12.5% 175,422 1.0%Vanpool rentals - 0.0% 99,010 0.5% 128,864 0.7%Auxiliary 916,238 4.3% 1,166,888 5.2% 914,629 5.0%Nontransportation 71,677 0.3% 189,307 0.9% 197,249 1.1%
Total Operating 19,653,463 93.3% 21,304,682 95.2% 18,263,898 100.1%
Nonoperating:Gain (loss) on sale of
capital assets 1,497,602 7.1% (56,954) -0.3% (8,313) -0.1%Interest income 12,536 0.1% 2,840 0.1% 2,079 0.0%Pension benefit (expense) (96,529) -0.5% 1,180,335 5.0% 2,785,169 0.0%
Total Nonoperating 1,413,609 6.7% 1,126,221 4.8% 2,778,935 -0.1%
Total Revenue 21,067,072$ 100.0% 22,430,903$ 100.0% 21,042,833$ 100.0%
TRANSPORTATION DISTRICT COMMISSION OF HAMPTON ROADS MANAGEMENT’S DISCUSSION AND ANALYSIS JUNE 30, 2016 AND 2015
11
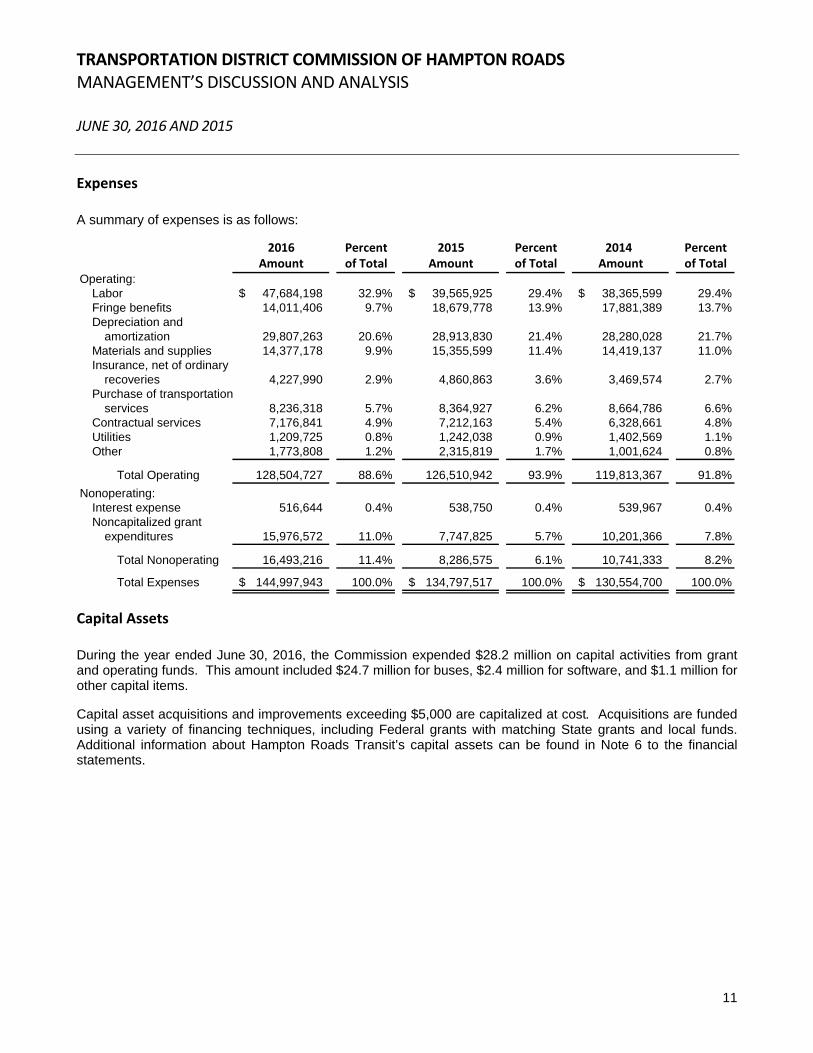
Expenses A summary of expenses is as follows:
2016 Percent 2015 Percent 2014 PercentAmount of Total Amount of Total Amount of Total
Operating:Labor 47,684,198$ 32.9% 39,565,925$ 29.4% 38,365,599$ 29.4%Fringe benefits 14,011,406 9.7% 18,679,778 13.9% 17,881,389 13.7%Depreciation and
amortization 29,807,263 20.6% 28,913,830 21.4% 28,280,028 21.7%Materials and supplies 14,377,178 9.9% 15,355,599 11.4% 14,419,137 11.0%Insurance, net of ordinary
recoveries 4,227,990 2.9% 4,860,863 3.6% 3,469,574 2.7%Purchase of transportation
services 8,236,318 5.7% 8,364,927 6.2% 8,664,786 6.6%Contractual services 7,176,841 4.9% 7,212,163 5.4% 6,328,661 4.8%Utilities 1,209,725 0.8% 1,242,038 0.9% 1,402,569 1.1%Other 1,773,808 1.2% 2,315,819 1.7% 1,001,624 0.8%
Total Operating 128,504,727 88.6% 126,510,942 93.9% 119,813,367 91.8%
Nonoperating:Interest expense 516,644 0.4% 538,750 0.4% 539,967 0.4%Noncapitalized grant
expenditures 15,976,572 11.0% 7,747,825 5.7% 10,201,366 7.8%
Total Nonoperating 16,493,216 11.4% 8,286,575 6.1% 10,741,333 8.2%
Total Expenses 144,997,943$ 100.0% 134,797,517$ 100.0% 130,554,700$ 100.0%
Capital Assets During the year ended June 30, 2016, the Commission expended $28.2 million on capital activities from grant and operating funds. This amount included $24.7 million for buses, $2.4 million for software, and $1.1 million for other capital items. Capital asset acquisitions and improvements exceeding $5,000 are capitalized at cost. Acquisitions are funded using a variety of financing techniques, including Federal grants with matching State grants and local funds. Additional information about Hampton Roads Transit’s capital assets can be found in Note 6 to the financial statements.

TRANSPORTATION DISTRICT COMMISSION OF HAMPTON ROADS MANAGEMENT’S DISCUSSION AND ANALYSIS JUNE 30, 2016 AND 2015
12
Debt At June 30, 2016, the Commission owed $17,000,000 against its $17,000,000 revolving line of credit, primarily due to the timing of government receivables. On June 1, 2006, the Commission entered into a financing arrangement with the Virginia Resources Authority (“VRA”), whereby VRA provided $12,770,000 of proceeds from a bond issuance to the Commission for the purchase of buses. Annual debt service began October 1, 2006, and the debt matures October 1, 2017. Interest is payable semiannually each April 1st and October 1st. Principal payments are due on October 1st of each year. On June 1, 2007, the Commission entered into a second financing arrangement with VRA, whereby VRA provided $4,975,000 of proceeds from a bond issuance to the Commission for the purchase of additional buses. Annual debt service began October 1, 2008, and the debt matures October 1, 2017. Interest is payable semiannually each April 1st and October 1st. Principal payments are due on October 1st of each year. At June 30, 2016, the Commission owed $3,970,000 on these bonds, with $1,940,000 of principal payments due in fiscal year 2017. More detailed information about Hampton Roads Transit’s long-term liabilities is presented in Note 9 to the financial statements. Request for Information This financial report is designed to provide a general overview of the Commission’s finances for all those interested. Questions concerning any of the information provided in this report or request for additional information should be addressed in writing to the Chief Financial Officer, Hampton Roads Transit, 3400 Victoria Boulevard, Hampton, VA 23661.

FINANCIAL STATEMENTS

TRANSPORTATION DISTRICT COMMISSION OF HAMPTON ROADS STATEMENTS OF NET POSITION JUNE 30, 2016 AND 2015
The accompanying notes to the financial statements are an integral part of these statements. 13
2016 2015ASSETSCurrent Assets:
Cash and cash equivalents 5,947,649$ 3,231,630$ Due from governments 23,643,374 21,259,143 Accounts receivable 880,540 732,862 Inventories 5,759,031 5,023,706 Prepaid expenses 370,571 1,700,212
Total Current Assets 36,601,165 31,947,553
Noncurrent Assets:Capital assets, net 321,519,601 323,975,826 Intangible assets, net 294,698 443,710 Net pension asset 405,939 -
Total Noncurrent Assets 322,220,238 324,419,536 Total Assets 358,821,403 356,367,089
Deferred Outflow of Resources:Deferred pension plan investment earnings 3,435,716 - Deferred pension change in assumptions 2,502,962 - Deferred pension contributions 3,055,327 2,980,152
Total Deferred Outflows of Resources 8,994,005 2,980,152 Total Assets and Deferred Outflow of Resources 367,815,408$ 359,347,241$
LIABILITIES AND NET POSITIONCurrent Liabilities:
Notes payable - bank 17,000,000$ 14,350,000$ Current portion of long-term debt 1,940,000 1,860,000 Current portion of long-term capital lease 369,834 357,764 Accounts payable 6,231,361 6,126,167 Accrued expenses 3,612,302 4,003,728 Self-insurance liability 4,373,999 4,273,422 Advanced capital contributions 3,754,747 3,418,322
Total Current Liabilities 37,282,243 34,389,403
Other Liabilities:Long-term capital lease 2,082,009 2,451,448 Long-term debt 2,030,000 3,970,000 Net pension liability 11,023,186 2,886,738
Total Other Liabilities 15,135,195 9,308,186 Total Liabilities 52,417,438 43,697,589
Deferred Inflow of Resources:Deferred pension plan investment earnings 836,832 - Deferred pension investment experience 1,044,340 3,501,299
Total Liabilities and Deferred Inflow of Resources 54,298,610 47,198,888
Net Position:Net investment in capital assets 315,392,456 315,780,324 Restricted 3,373,999 3,273,422 Unrestricted (5,249,657) (6,905,393)
Total Net Position 313,516,798 312,148,353 Total Liabilities and Net Position 367,815,408$ 359,347,241$
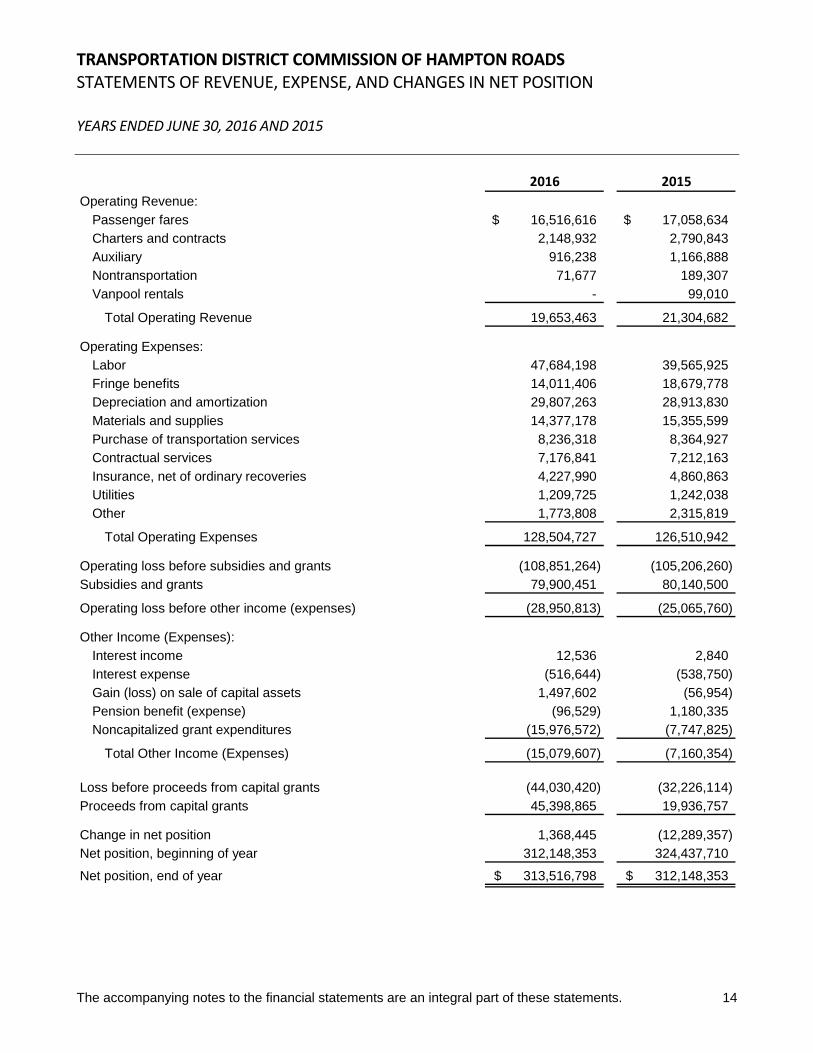
TRANSPORTATION DISTRICT COMMISSION OF HAMPTON ROADS STATEMENTS OF REVENUE, EXPENSE, AND CHANGES IN NET POSITION YEARS ENDED JUNE 30, 2016 AND 2015
The accompanying notes to the financial statements are an integral part of these statements. 14
2016 2015
Operating Revenue:
Passenger fares 16,516,616$ 17,058,634$
Charters and contracts 2,148,932 2,790,843
Auxiliary 916,238 1,166,888
Nontransportation 71,677 189,307
Vanpool rentals - 99,010
Total Operating Revenue 19,653,463 21,304,682
Operating Expenses:
Labor 47,684,198 39,565,925
Fringe benefits 14,011,406 18,679,778
Depreciation and amortization 29,807,263 28,913,830
Materials and supplies 14,377,178 15,355,599
Purchase of transportation services 8,236,318 8,364,927
Contractual services 7,176,841 7,212,163
Insurance, net of ordinary recoveries 4,227,990 4,860,863
Utilities 1,209,725 1,242,038
Other 1,773,808 2,315,819
Total Operating Expenses 128,504,727 126,510,942
Operating loss before subsidies and grants (108,851,264) (105,206,260)
Subsidies and grants 79,900,451 80,140,500
Operating loss before other income (expenses) (28,950,813) (25,065,760)
Other Income (Expenses):
Interest income 12,536 2,840
Interest expense (516,644) (538,750)
Gain (loss) on sale of capital assets 1,497,602 (56,954)
Pension benefit (expense) (96,529) 1,180,335
Noncapitalized grant expenditures (15,976,572) (7,747,825)
Total Other Income (Expenses) (15,079,607) (7,160,354)
Loss before proceeds from capital grants (44,030,420) (32,226,114)
Proceeds from capital grants 45,398,865 19,936,757
Change in net position 1,368,445 (12,289,357)
Net position, beginning of year 312,148,353 324,437,710
Net position, end of year 313,516,798$ 312,148,353$

TRANSPORTATION DISTRICT COMMISSION OF HAMPTON ROADS STATEMENTS OF CASH FLOWS YEARS ENDED JUNE 30, 2016 AND 2015
The accompanying notes to the financial statements are an integral part of these statements. 15
2016 2015Cash flows from operating activities:
Receipts from customers and users 19,505,785$ 21,002,101$ Payments to suppliers for goods and services (36,201,773) (37,332,049) Payments to employees (61,990,501) (57,903,403)
Net cash used in operating activities (78,686,489) (74,233,351)
Cash flows from noncapital financing activities:
Operating subsidies and grants received 79,900,451 80,140,500 Net increase in note payable - bank 2,650,000 850,000
Net cash provided by operating activities 82,550,451 80,990,500
Cash flows from capital and related financing activities:
Increase in advanced capital contributions 336,425 735,971 Interest expense (516,644) (538,750) Acquisition of capital assets and intangible assets (27,709,665) (15,020,636) Noncapitalized grant expenditures (15,976,572) (7,747,825) Proceeds from disposition of capital assets 1,908,712 56,760 Proceeds from capital grants 43,014,634 18,884,442 Payments on long-term capital lease (357,369) (2,809,212) Payments on long-term debt (1,860,000) (1,780,000)
Net cash used in capital and related financing activities (1,160,479) (8,219,250)
Cash flows from investing activities:
Interest income 12,536 2,840
Net change in cash and cash equivalents 2,716,019 (1,459,261) Cash and cash equivalents, beginning of year 3,231,630 4,690,891
Cash and cash equivalents,end of year 5,947,649$ 3,231,630$
Noncash transactions:Capital lease agreement to acquire seven buses -$ 3,127,291$
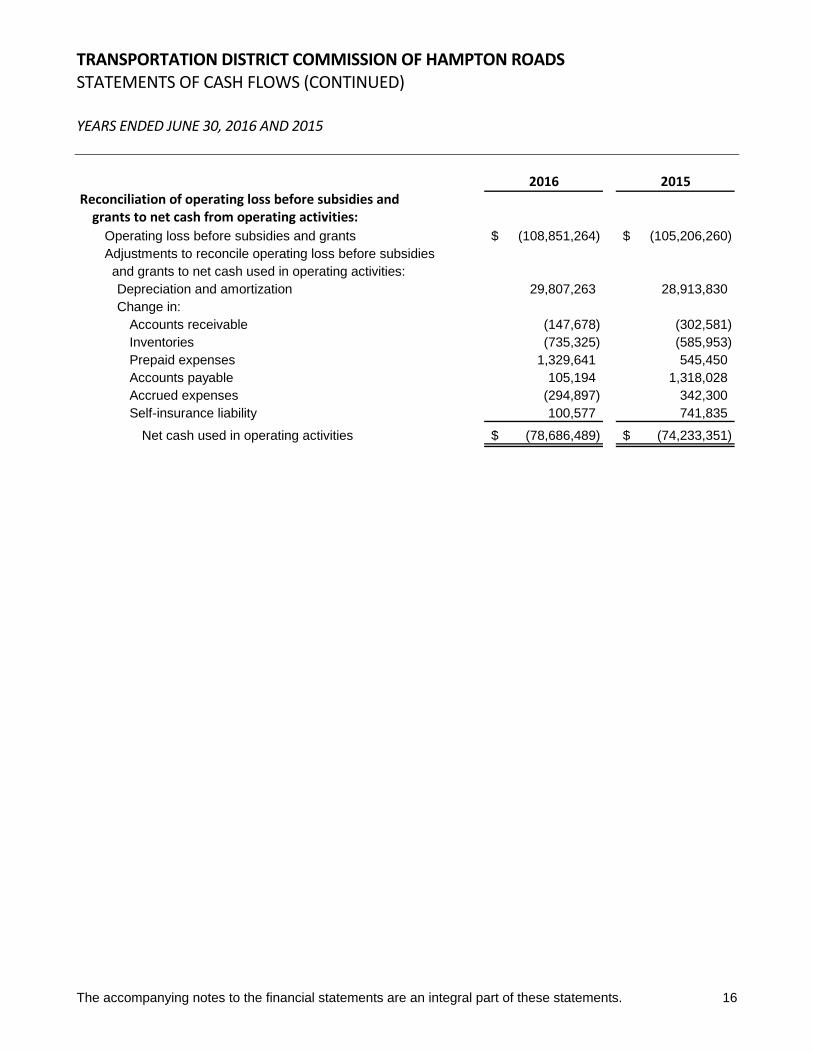
TRANSPORTATION DISTRICT COMMISSION OF HAMPTON ROADS STATEMENTS OF CASH FLOWS (CONTINUED) YEARS ENDED JUNE 30, 2016 AND 2015
The accompanying notes to the financial statements are an integral part of these statements. 16
2016 2015Reconciliation of operating loss before subsidies and grants to net cash from operating activities:
Operating loss before subsidies and grants (108,851,264)$ (105,206,260)$ Adjustments to reconcile operating loss before subsidies and grants to net cash used in operating activities:
Depreciation and amortization 29,807,263 28,913,830 Change in:
Accounts receivable (147,678) (302,581) Inventories (735,325) (585,953) Prepaid expenses 1,329,641 545,450 Accounts payable 105,194 1,318,028 Accrued expenses (294,897) 342,300 Self-insurance liability 100,577 741,835
Net cash used in operating activities (78,686,489)$ (74,233,351)$
TRANSPORTATION DISTRICT COMMISSION OF HAMPTON ROADS NOTES TO FINANCIAL STATEMENTS JUNE 30, 2016 AND 2015
17
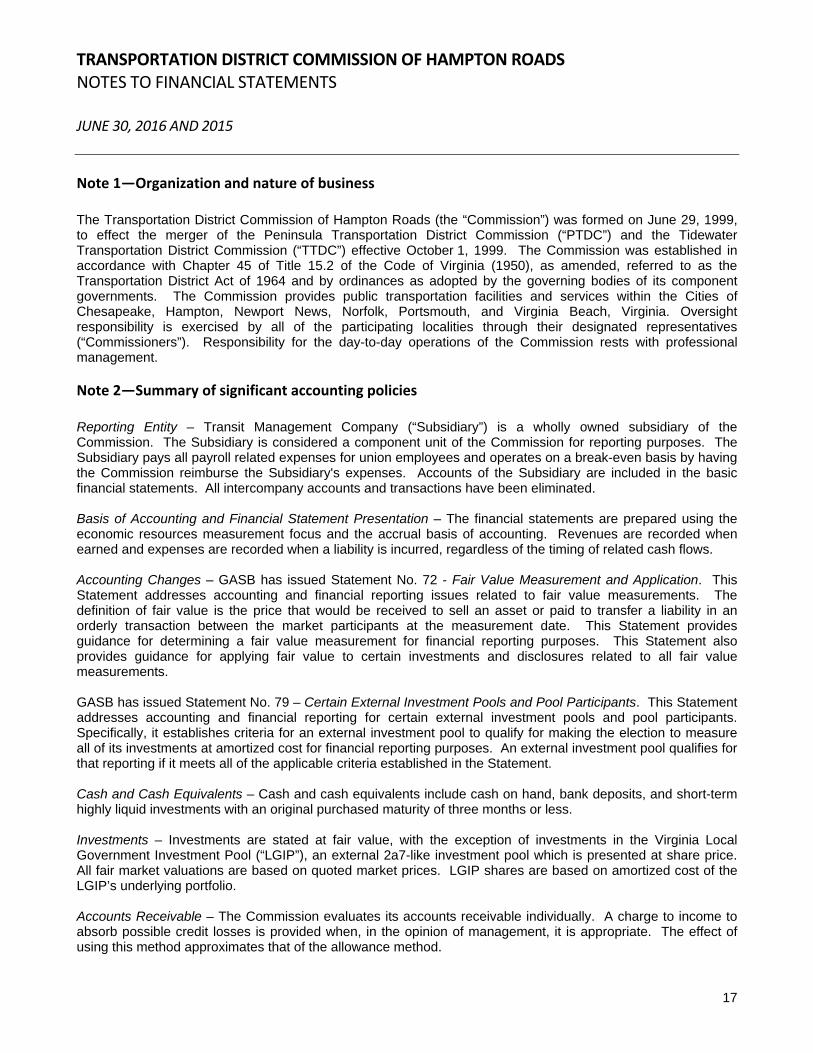
Note 1—Organization and nature of business The Transportation District Commission of Hampton Roads (the “Commission”) was formed on June 29, 1999, to effect the merger of the Peninsula Transportation District Commission (“PTDC”) and the Tidewater Transportation District Commission (“TTDC”) effective October 1, 1999. The Commission was established in accordance with Chapter 45 of Title 15.2 of the Code of Virginia (1950), as amended, referred to as the Transportation District Act of 1964 and by ordinances as adopted by the governing bodies of its component governments. The Commission provides public transportation facilities and services within the Cities of Chesapeake, Hampton, Newport News, Norfolk, Portsmouth, and Virginia Beach, Virginia. Oversight responsibility is exercised by all of the participating localities through their designated representatives (“Commissioners”). Responsibility for the day-to-day operations of the Commission rests with professional management. Note 2—Summary of significant accounting policies Reporting Entity – Transit Management Company (“Subsidiary”) is a wholly owned subsidiary of the Commission. The Subsidiary is considered a component unit of the Commission for reporting purposes. The Subsidiary pays all payroll related expenses for union employees and operates on a break-even basis by having the Commission reimburse the Subsidiary's expenses. Accounts of the Subsidiary are included in the basic financial statements. All intercompany accounts and transactions have been eliminated. Basis of Accounting and Financial Statement Presentation – The financial statements are prepared using the economic resources measurement focus and the accrual basis of accounting. Revenues are recorded when earned and expenses are recorded when a liability is incurred, regardless of the timing of related cash flows. Accounting Changes – GASB has issued Statement No. 72 - Fair Value Measurement and Application. This Statement addresses accounting and financial reporting issues related to fair value measurements. The definition of fair value is the price that would be received to sell an asset or paid to transfer a liability in an orderly transaction between the market participants at the measurement date. This Statement provides guidance for determining a fair value measurement for financial reporting purposes. This Statement also provides guidance for applying fair value to certain investments and disclosures related to all fair value measurements. GASB has issued Statement No. 79 – Certain External Investment Pools and Pool Participants. This Statement addresses accounting and financial reporting for certain external investment pools and pool participants. Specifically, it establishes criteria for an external investment pool to qualify for making the election to measure all of its investments at amortized cost for financial reporting purposes. An external investment pool qualifies for that reporting if it meets all of the applicable criteria established in the Statement. Cash and Cash Equivalents – Cash and cash equivalents include cash on hand, bank deposits, and short-term highly liquid investments with an original purchased maturity of three months or less. Investments – Investments are stated at fair value, with the exception of investments in the Virginia Local Government Investment Pool (“LGIP”), an external 2a7-like investment pool which is presented at share price. All fair market valuations are based on quoted market prices. LGIP shares are based on amortized cost of the LGIP’s underlying portfolio. Accounts Receivable – The Commission evaluates its accounts receivable individually. A charge to income to absorb possible credit losses is provided when, in the opinion of management, it is appropriate. The effect of using this method approximates that of the allowance method.

TRANSPORTATION DISTRICT COMMISSION OF HAMPTON ROADS NOTES TO FINANCIAL STATEMENTS JUNE 30, 2016 AND 2015
18
Note 2—Summary of significant accounting policies (continued) Inventories – Parts inventories are stated at the lower of cost or market using the average cost method. The cost of fuel and oil inventories is determined using the first-in, first-out (FIFO) method. Inventories are used for operations and are not for resale. Capital Assets – Capital assets, which include infrastructure, equipment, property (e.g., buses, ferries and docks, trolleys, and light rail vehicles), and intangible assets (e.g., computer software) are reported at cost and depreciated using the straight-line method based on estimated useful lives of 3-50 years. Capital assets other than equipment, property, and infrastructure assets are defined by Hampton Roads Transit (“HRT”) as an asset with initial individual cost of $5,000 or more with a useful life greater than one year. Donated assets are valued at their estimated acquisition value on the date donated. The cost of repairs and maintenance that do not add value or extend an asset’s life are not capitalized. When assets are retired or disposed of, the cost and accumulated depreciation are removed from the respective accounts and any gain or loss on disposition is recognized. Most property and equipment is acquired with grant proceeds so the method and use of proceeds from disposition of property and equipment is restricted by the grant requirements. Capital assets are depreciated using the straight-line method with estimated useful lives:
Years Buildings and improvements 10-50 Light rail vehicles and infrastructure 10-30 Ferries and docks 10-20 Buses 7-12 Equipment and other 3-13 Vehicles 3-4 Intangibles 3-5
Deferred Outflows/Inflows of Resources – In addition to assets, the statement of net position will sometimes report a separate section for deferred outflows of resources. This separate financial statement element represents a consumption of net position that applies to a future period and will not be recognized as an expense until that time. In addition to liabilities, the statements of financial position will sometimes report a separate section for deferred inflows of resources. This separate financial statement element represents an acquisition of net position that applies to a future period and will not be recognized as revenue until that time. Pensions – For purposes of measuring the net pension liability, deferred outflows of resources and deferred inflows of resources related to pensions, and pension expense, information about the fiduciary net position of the Transportation District Commission of Hampton Roads’ Retirement Plan and the additions to/deductions from the Transportation District Commission of Hampton Roads’ net fiduciary position have been determined on the same basis as they were reported by the Virginia Retirement System (“VRS”). For this purpose, benefit payments (including refunds of employee contributions) are recognized when due and payable in accordance with the benefit terms. Investments are reported at fair value. Revenue – Revenue is recognized when services are provided. Operating grant subsidies and expense reimbursements are recognized in accordance with the grant document or reimbursement agreement. Generally, these agreements provide for reimbursement to the Commission for operating expenses incurred. Operating subsidies from the municipalities provide for reimbursement to the Commission based on services provided within the various jurisdictions.
TRANSPORTATION DISTRICT COMMISSION OF HAMPTON ROADS NOTES TO FINANCIAL STATEMENTS JUNE 30, 2016 AND 2015
19
Note 2—Summary of significant accounting policies (continued) Net Position – Net position represents the residual interest in the Commission’s assets after liabilities are deducted and consist of three sections: invested in capital assets; restricted for self-insurance; and unrestricted. Invested in capital assets includes capital assets, net of accumulated depreciation, reduced by outstanding debt attributable to capital expenditures. The Commissions’ restricted amounts for self-insurance are expendable and relate to amounts restricted for the self-insurance liability. Unrestricted amounts may be designated for specific purposes by action of management or the board of commissioners. Budgets and Budgetary Accounting – The Commission’s annual budget for transit activities is a management tool that assists users in analyzing financial activity for its June 30, fiscal year. The Commission’s primary funding sources are federal and state grants and local subsidies, which have periods that may or may not coincide with the Commission’s fiscal year. These grants and subsidies are normally for a twelve-month period; however, they may be awarded for periods shorter or longer than twelve months. Because of the Commission’s dependency on federal, state, and local budgetary decisions, revenue estimates are based upon the best available information as to potential sources of funding. The Commission’s annual budget differs from that of a local government due to the uncertain nature of grant awards from other entities. The resultant annual budget is subject to constant change within the fiscal year due to:
• Increases/decreases in actual grant awards from those estimated; • Unanticipated grant awards not included in the budget; and • Expected grant awards that fail to materialize.
The Commissioners formally approve the annual budget but greater emphasis is placed on complying with the grant budget, whose terms and conditions are on a grant-by-grant basis. These terms and conditions usually specify the period during which costs may be incurred and outline budget restrictions or allowances. Estimates – The preparation of financial statements requires management to make estimates and assumptions that affect the reported amounts of assets, liabilities, revenue, and expenses and disclosure of contingent assets and liabilities for the reported period. Actual results could differ from those estimates and assumptions. Note 3—Cash and cash equivalents and investments Cash and cash equivalents Deposits – At June 30, 2016 and 2015, the carrying value of the Commission's deposits with banks was $2,782,919 and $1,623,300, respectively, and the bank balances were $3,330,949 and $2,605,608, respectively. All of the bank balance was insured by the Federal Deposit Insurance Corporation (“FDIC”) or collateralized in accordance with the Virginia Security for Public Deposits Act (“Act”). Under the Act, banks holding public deposits in excess of the amounts insured by the FDIC must pledge collateral in the amount of 50% of such excess deposits to a collateral pool in the name of the State Treasury Board. Savings and loan institutions are required to collateralize 100% of deposits in excess of FDIC limits. The State Treasury Board is responsible for monitoring compliance with the collateralization and reporting requirements of the Act and for notifying local governments of compliance by banks and savings and loans. At June 30, 2016 and 2015, the Commission had $2,783,442 and $1,228,268, respectively, invested in money market funds which are valued at amortized cost. These cash equivalents are not insured by FDIC or the Act and are, therefore, subject to investment risk.

TRANSPORTATION DISTRICT COMMISSION OF HAMPTON ROADS NOTES TO FINANCIAL STATEMENTS JUNE 30, 2016 AND 2015
20
Note 3—Cash and cash equivalents and investments (continued) Investments Investment Policy – In accordance with the Code of Virginia and other applicable laws, including regulations, the Commission’s investment policy (“Policy”) permits investments in U.S. government obligations, obligations of the Commonwealth of Virginia or political subdivisions thereof, prime quality commercial paper, and certain corporate notes, bankers acceptances, repurchase agreements, negotiable certificates of deposit, bank deposit notes, mutual funds that invest exclusively in securities specifically permitted under the Policy, and the State Treasurer’s Local Government Investment Pool (the Virginia LGIP, a 2a-7 like pool). Pursuant to the Code of Virginia, the Treasury Board of the Commonwealth sponsors the LGIP and has delegated certain functions to the State Treasurer. The LGIP reports to the Treasury Board at their regularly scheduled monthly meetings. The LGIP values portfolio securities by the amortized cost method and on a monthly basis this valuation is compared to current market to monitor any variance. The LGIP is in compliance with the requirements of GASB Statement 79 and elects to measure its investments at amortized cost for financial reporting. Therefore, participants in LGIP should also measure their investments in the LGIP at amortized cost for financial reporting. The Policy establishes an investment committee consisting of the Chief Financial Officer, the President and Chief Executive Officer. The members of this committee meet quarterly to determine general investment strategies and to monitor results. The investment committee includes in its deliberations such topics as: economic outlook, portfolio diversification and maturity structure, potential risks to Commission funds, authorized depositories and dealers, and the target rate of return on the investment portfolio. According to GASB 72, investments in the LGIP should be excluded from measurement at Fair Value and thus exempt from the Fair Value Hierarchy Classifications. Credit Risk – As required by state statue, the Policy requires that commercial paper have a short-term debt rating of not less than “A-1” (or its equivalent) from at least two of the following: Moody’s Investors Service, Standard & Poor’s, and Fitch Investor’s Service. Corporate notes, negotiable certificates of deposit, and bank deposit notes maturing in less than one year must have a short-term debt rating of at least “A-1” by Standard & Poor’s and “P-1” by Moody’s Investor Service. Notes having a maturity of greater than one year must be rated “AA” by Standard & Poor’s and “Aa” by Moody’s Investor Service. At June 30, 2016 and 2015, 100% of the Commission’s cash equivalents were invested in money market funds and the State Treasurers Local Government Investment Pool. The Virginia LGIP operates in a manner consistent with the SEC’s Rule 2a-7 of the Investment Company Act of 1940 and in accordance with the requirements of Statement No. 31 of the Government Accounting Standards Board “2a7-Like External Investment Pools.” LGIP shares are based on amortized cost of the LGIP’s underlying portfolio. The fair value of the Commission’s position in the pool is the same as the value of the pool shares. Concentration of Credit Risk – The Commission’s main depository is selected through a formal procurement process at least once every five years. The Chief Financial Officer selects dealers, brokers, and other depositories after a competitive evaluation process. In selecting depositories or dealers, the creditworthiness of the institutions, financial stability, credit characteristics, financial history, and interest rates offered are considered. Preferences are given to depositories located within the six cities of the transportation district. Dealers and financial institutions seeking to establish eligibility for the Commission’s competitive certificate of deposit purchase programs for amounts not covered under FDIC or FSLIC insurance submits information as required, which shall be reviewed by the investment committee.

TRANSPORTATION DISTRICT COMMISSION OF HAMPTON ROADS NOTES TO FINANCIAL STATEMENTS JUNE 30, 2016 AND 2015
21
Note 3—Cash and cash equivalents and investments (continued) Before accepting funds or engaging in investment transactions with the Commission, the supervising officer at each depository submits a certification evidencing that he or she has reviewed the investment policies and objectives and agrees to disclose potential conflicts or risks to public funds that might arise out of business transactions between the depository and the Commission. All financial institutions shall agree to exercise due diligence in monitoring the activities of other officers and subordinate staff members engaged in transaction with this entity. Employees of any firm or financial institution offering securities or investment to the Commission are trained in the precautions appropriate to public sector investments and are required to familiarize themselves with the Commission’s investment objectives and constraints. Interest Rate Risk – As a means of limiting exposure to fair value losses arising from rising interest rates, the Commission’s Policy limits the investment of operating funds to investments with a stated maturity of no more than five years from the date of purchase. The carrying values and weighted average maturity, if applicable, of the Commission’s cash and cash equivalents were as follows:
Fair Value Fair Value
Investment Type 2016 2015
Money market funds - Virginia LGIP 381,288$ 380,062$ Other money market funds 2,783,442 1,228,268
Total cash equivalents 3,164,730 1,608,330 Total bank deposits 2,782,919 1,623,300
Total cash and cash equivalents 5,947,649$ 3,231,630$
Fair Value – The Commission categorizes its fair value measurements within the fair value hierarchy established by generally accepted accounting principles. The hierarchy base on the valuation inputs used to measure the fair value of the asset. Level 1 inputs are quoted prices in active markets for identical assets; Level 2 inputs are significant other observable inputs; Level 3 inputs are significant unobservable inputs. PFM Funds investments in U.S. Treasury securities of $2.8 million are valued using quoted market prices (Level 1 inputs) Custodial Credit Risk – The assets of the Commission shall be secured through third party custody and safekeeping procedures. Bearer instruments shall be held only through third party institutions. Investment officials shall be bonded to protect against possible embezzlement and malfeasance. Unless prevailing practices or economic circumstances dictate otherwise, ownership shall be protected through third-party custodial safekeeping.
TRANSPORTATION DISTRICT COMMISSION OF HAMPTON ROADS NOTES TO FINANCIAL STATEMENTS JUNE 30, 2016 AND 2015
22
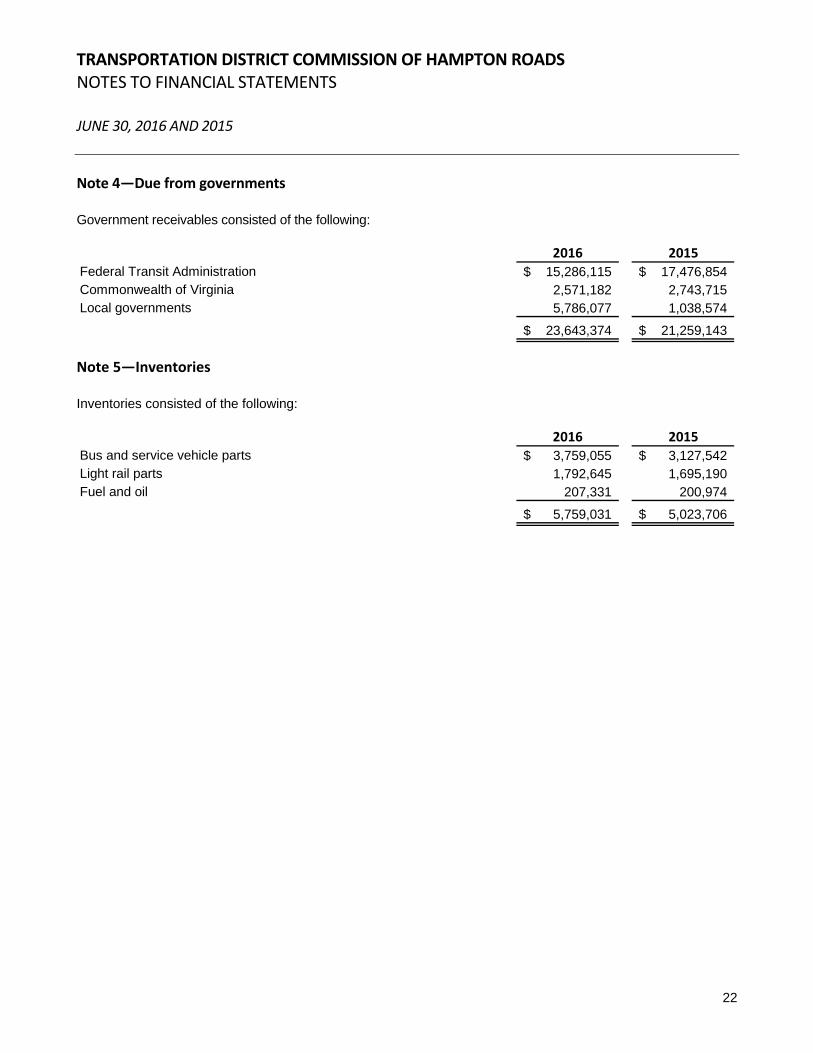
Note 4—Due from governments Government receivables consisted of the following:
2016 2015
Federal Transit Administration 15,286,115$ 17,476,854$ Commonwealth of Virginia 2,571,182 2,743,715 Local governments 5,786,077 1,038,574
23,643,374$ 21,259,143$
Note 5—Inventories Inventories consisted of the following:
2016 2015
Bus and service vehicle parts 3,759,055$ 3,127,542$ Light rail parts 1,792,645 1,695,190 Fuel and oil 207,331 200,974
5,759,031$ 5,023,706$

TRANSPORTATION DISTRICT COMMISSION OF HAMPTON ROADS NOTES TO FINANCIAL STATEMENTS JUNE 30, 2016 AND 2015
23
Note 6—Capital and intangible assets A summary of changes in capital assets follows:
Balance Balance
June 30, 2015 Increases Decreases June 30, 2016
Capital assets not being depreciated:
Land 9,008,964$ -$ 108,168$ 8,900,796$ Construction in process:
Buildings and improvements 2,977,974 1,685,482 698,973 3,964,483Other 4,673,696 9,991,174 11,474,285 3,190,585
Total capital assets not being
depreciated 16,660,634 11,676,656 12,281,426 16,055,864
Capital assets being depreciated:
Buses 94,972,460 24,737,112 - 119,709,572Buildings and improvements 92,540,034 220,261 4,751,881 88,008,414Equipment 25,920,760 102,552 406,639 25,616,673Ferries and docks 7,259,864 - - 7,259,864Other 6,449,188 3,052,318 469,430 9,032,076Vehicles 9,345,712 114,903 1,235,178 8,225,437Intangibles 5,299,440 - 487,481 4,811,959Light rail 256,096,178 268 - 256,096,446
Total capital assets being
depreciated 497,883,636 28,227,414 7,350,609 518,760,441
Less accumulated depreciation and
amortization for:
Buses 66,086,113 7,349,386 255 73,435,244Buildings and improvements 30,990,626 4,493,016 4,500,599 30,983,043Equipment 21,051,957 1,297,569 305,666 22,043,860Ferries and docks 5,929,098 242,634 - 6,171,732Other 4,463,204 959,514 428,015 4,994,703Vehicles 5,378,237 1,703,654 1,207,975 5,873,916Intangibles 4,855,730 149,012 487,481 4,517,261Light rail 51,369,769 13,612,478 - 64,982,247
Total accumulated depreciation
and amortization 190,124,734 29,807,263 6,929,991 213,002,006 Total capital assets being
depreciated - net 307,758,902 (1,579,849) 420,618 305,758,435
Total capital assets - net 324,419,536$ 10,096,807$ 12,702,044$ 321,814,299$

TRANSPORTATION DISTRICT COMMISSION OF HAMPTON ROADS NOTES TO FINANCIAL STATEMENTS JUNE 30, 2016 AND 2015
24
Note 7—Unearned reimbursements ‐ net Amounts advanced (owed) by participating municipalities or the Commonwealth of Virginia pursuant to various operating subsidy and/or grant agreements are as follows:
2016 2015City of Chesapeake (124,023)$ 17,367$ City of Hampton (640,923) 9,798 City of Newport News (1,004,627) (100,008) City of Norfolk (1,973,481) 67,738 City of Portsmouth (38,652) 221,276 City of Virginia Beach (1,820,859) (422,185)
(5,602,565)$ (206,014)$
For 2016 and 2015, the amounts owed by participating municipalities are included in due from governments in the statements of net position. Note 8—Notes payable ‐ bank The Commission has a revolving line of credit of $17,000,000, which matures January 31, 2017. Advances on the lines of credit were collateralized by the pledging of all revenue, federal grants, and nonfederal operating subsidies of the Commission. Interest on advances is payable monthly at a fluctuating rate per annum equal to sixty-five (65%) of the London Interbank Offered Rate (LIBOR) plus one hundred sixty-five (165) basis points with a floor of 2%. At June 30, 2016 and 2015, the Commission owed $17,000,000 and $14,350,000, respectively, against the line of credit. Note 9—Long‐term debt Following is a summary of debt transactions of the Commission:
Beginning Ending Due Within
Balance Additions Reductions Balance One Year
Self-insurance 4,273,422$ 1,421,105$ 1,320,528$ 4,373,999$ 4,373,999$ Compensated absences 1,189,743 1,003,617 729,838 1,463,522 1,463,522 Debt 5,830,000 - 1,860,000 3,970,000 1,940,000 Capital lease 2,809,212 - 357,664 2,451,548 369,834 Net pension liability 2,886,738 14,129,951 6,399,442 10,617,247 -
11,525,950$ 14,129,951$ 8,617,106$ 17,038,795$ 2,309,834$
On June 1, 2006, the Commission entered into a financing arrangement with the Virginia Resources Authority (“VRA”), whereby VRA provided $12,770,000 of proceeds from the VRA’s issuance of Infrastructure Revenue Bonds, Series 2006A. The debt requires the Commission to pay interest at variable rates ranging from 3.5838% to 4.2416%. Interest is payable semiannually each April 1st and October 1st. Annual principal payments of varying amounts began October 1, 2007, through the termination date of October 1, 2017. Proceeds from the debt were used to establish a fund for the acquisition of buses and related equipment during fiscal year 2007.

TRANSPORTATION DISTRICT COMMISSION OF HAMPTON ROADS NOTES TO FINANCIAL STATEMENTS JUNE 30, 2016 AND 2015
25
Note 9—Long‐term debt (continued) On June 1, 2007, the Commission entered into a second financing arrangement with the Virginia Resources Authority, whereby VRA provided $4,975,000 of proceeds from the VRA’s issuance of Infrastructure Revenue Bonds, Series 2007A. The debt requires the Commission to pay interest at variable rates ranging from 4.10% to 4.595%. Interest is payable semiannually each April 1st and October 1st. Annual principal payments of varying amounts begin October 1, 2008, through the termination date of October 1, 2017. Proceeds from the debt were used to establish a fund for the acquisition of buses and related equipment during fiscal year 2008. During the term of the financing, title to the buses will remain with the Commission. To secure its obligations, VRA created a security interest in all of the property and equipment purchased with the proceeds. The Commission also agreed to maintain the equipment free of any liens, pledges and/or encumbrances of any kind. Debt service is as follows: Fiscal Years Ending June 30: Principal Interest
2017 1,940,000$ 122,774$ 2018 2,030,000 31,547
Total 3,970,000$ 154,321$
Note 10—Lease transactions Operating Leases – In 2008, the Commission entered into agreements to lease warehouse and storage facilities expiring in various years through February 2020. For 2016 and 2015, lease expense was $92,593 and $90,778, respectively. Capital Leases – In 2015, the Commission entered into a capital lease to purchase seven 40-foot buses to add to their fleet. The buses were capitalized at a cost of $3,127,291. Depreciation expense on the assets under lease of $260,575 is included in depreciation expense on the statements of revenue, expenses, and changes in net position and resulted in accumulated depreciation of $521,150. Future minimum lease payments under this lease are as follows. 2017 445,704$ 2018 445,704 2019 445,704 2020 445,7042021 445,704
Thereafter 482,846
Total future minimum lease payments 2,711,366
Less amounts representing interest (259,523)
Total principal due under capital lease obligation 2,451,843
Less current portion (369,834)
Long-term portion of capital lease obligation 2,082,009$
TRANSPORTATION DISTRICT COMMISSION OF HAMPTON ROADS NOTES TO FINANCIAL STATEMENTS JUNE 30, 2016 AND 2015
26
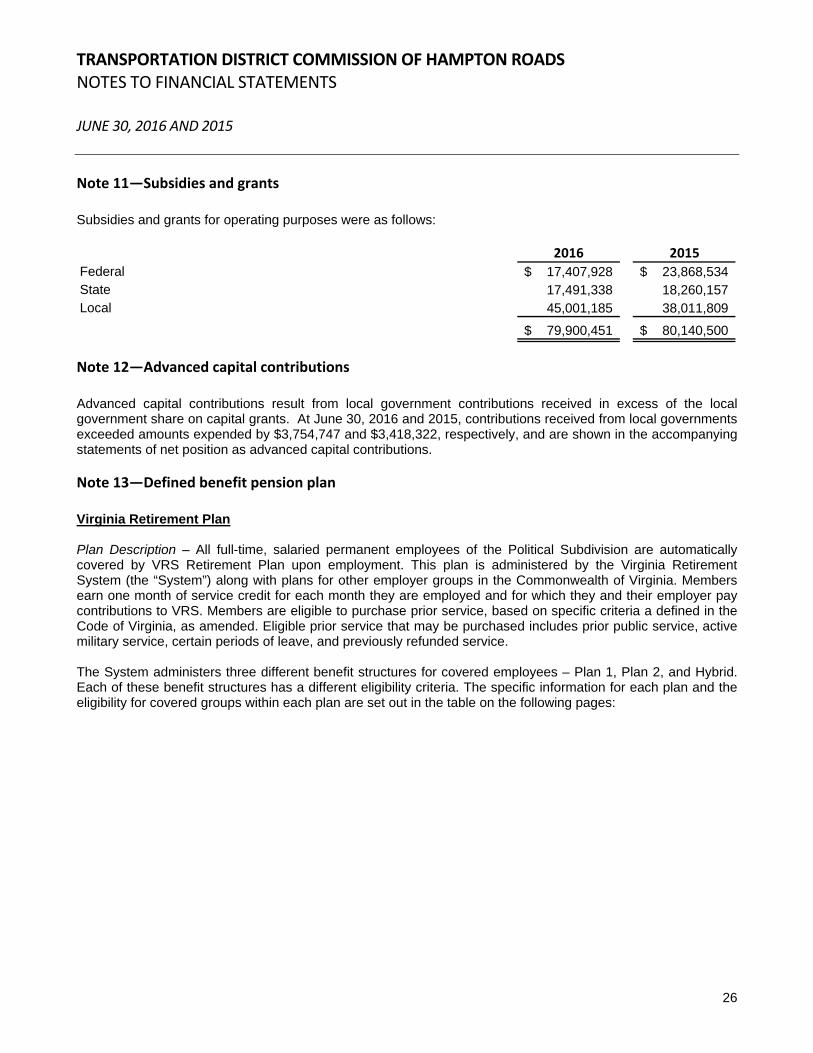
Note 11—Subsidies and grants Subsidies and grants for operating purposes were as follows:
2016 2015
Federal 17,407,928$ 23,868,534$ State 17,491,338 18,260,157 Local 45,001,185 38,011,809
79,900,451$ 80,140,500$
Note 12—Advanced capital contributions Advanced capital contributions result from local government contributions received in excess of the local government share on capital grants. At June 30, 2016 and 2015, contributions received from local governments exceeded amounts expended by $3,754,747 and $3,418,322, respectively, and are shown in the accompanying statements of net position as advanced capital contributions. Note 13—Defined benefit pension plan Virginia Retirement Plan Plan Description – All full-time, salaried permanent employees of the Political Subdivision are automatically covered by VRS Retirement Plan upon employment. This plan is administered by the Virginia Retirement System (the “System”) along with plans for other employer groups in the Commonwealth of Virginia. Members earn one month of service credit for each month they are employed and for which they and their employer pay contributions to VRS. Members are eligible to purchase prior service, based on specific criteria a defined in the Code of Virginia, as amended. Eligible prior service that may be purchased includes prior public service, active military service, certain periods of leave, and previously refunded service. The System administers three different benefit structures for covered employees – Plan 1, Plan 2, and Hybrid. Each of these benefit structures has a different eligibility criteria. The specific information for each plan and the eligibility for covered groups within each plan are set out in the table on the following pages:
TRANSPORTATION DISTRICT COMMISSION OF HAMPTON ROADS NOTES TO FINANCIAL STATEMENTS JUNE 30, 2016 AND 2015
27
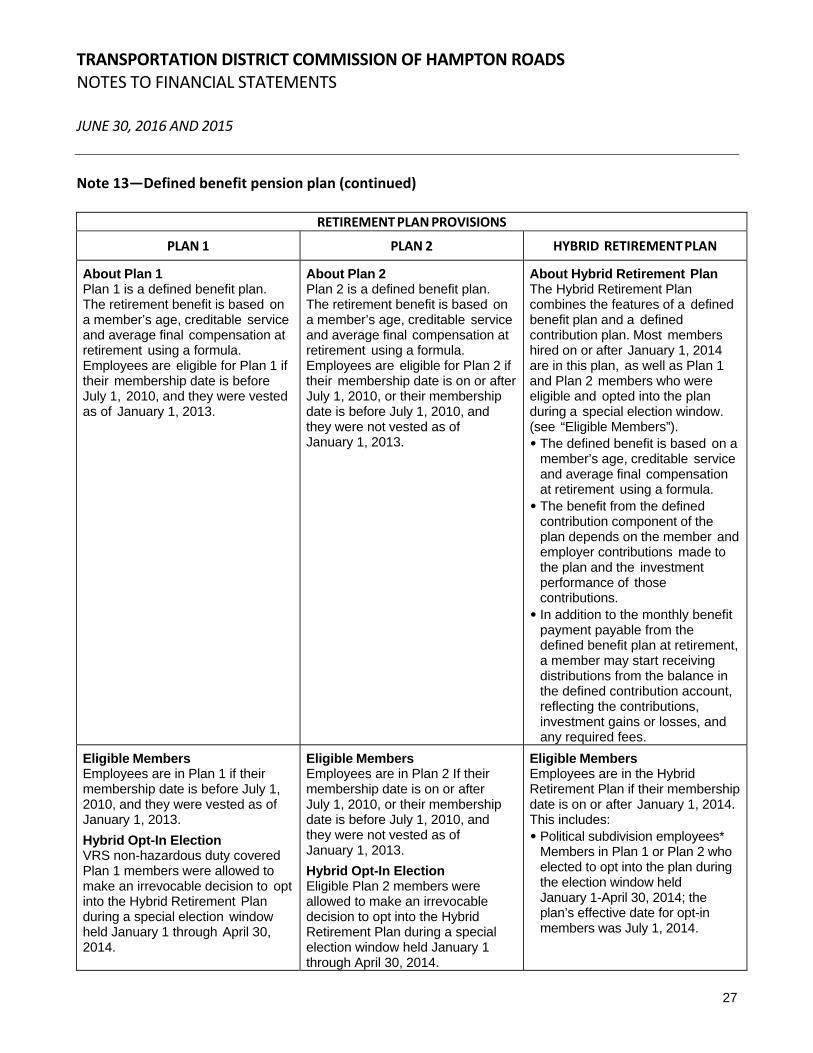
Note 13—Defined benefit pension plan (continued)
RETIREMENT PLAN PROVISIONS
PLAN 1 PLAN 2 HYBRID RETIREMENT PLAN
About Plan 1 Plan 1 is a defined benefit plan. The retirement benefit is based on a member’s age, creditable service and average final compensation at retirement using a formula. Employees are eligible for Plan 1 if their membership date is before July 1, 2010, and they were vested as of January 1, 2013.
About Plan 2 Plan 2 is a defined benefit plan. The retirement benefit is based on a member’s age, creditable service and average final compensation at retirement using a formula. Employees are eligible for Plan 2 if their membership date is on or after July 1, 2010, or their membership date is before July 1, 2010, and they were not vested as of January 1, 2013.
About Hybrid Retirement Plan The Hybrid Retirement Plan combines the features of a defined benefit plan and a defined contribution plan. Most members hired on or after January 1, 2014 are in this plan, as well as Plan 1 and Plan 2 members who were eligible and opted into the plan during a special election window. (see “Eligible Members”). • The defined benefit is based on a
member’s age, creditable service and average final compensation at retirement using a formula.
• The benefit from the defined contribution component of the plan depends on the member and employer contributions made to the plan and the investment performance of those contributions.
• In addition to the monthly benefit payment payable from the defined benefit plan at retirement, a member may start receiving distributions from the balance in the defined contribution account, reflecting the contributions, investment gains or losses, and any required fees.
Eligible Members Employees are in Plan 1 if their membership date is before July 1, 2010, and they were vested as of January 1, 2013.
Hybrid Opt-In Election VRS non-hazardous duty covered Plan 1 members were allowed to make an irrevocable decision to opt into the Hybrid Retirement Plan during a special election window held January 1 through April 30, 2014.
Eligible Members Employees are in Plan 2 If their membership date is on or after July 1, 2010, or their membership date is before July 1, 2010, and they were not vested as of January 1, 2013.
Hybrid Opt-In Election Eligible Plan 2 members were allowed to make an irrevocable decision to opt into the Hybrid Retirement Plan during a special election window held January 1 through April 30, 2014.
Eligible Members Employees are in the Hybrid Retirement Plan if their membership date is on or after January 1, 2014. This includes: • Political subdivision employees*
Members in Plan 1 or Plan 2 who elected to opt into the plan during the election window held January 1-April 30, 2014; the plan’s effective date for opt-in members was July 1, 2014.

TRANSPORTATION DISTRICT COMMISSION OF HAMPTON ROADS NOTES TO FINANCIAL STATEMENTS JUNE 30, 2016 AND 2015
28
Note 13—Defined benefit pension plan (continued)
The Hybrid Retirement Plan’s effective date for eligible Plan 1 members who opted in was July 1, 2014. If eligible deferred members returned to work during the election window, they were also eligible to opt into the Hybrid Retirement Plan.
Members who were eligible for an optional retirement plan (ORP) and had prior service under Plan 1 were not eligible to elect the Hybrid Retirement Plan and remain as Plan 1 or ORP.
The Hybrid Retirement Plan’s effective date for eligible Plan 2 members who opted in was July 1, 2014. If eligible deferred members returned to work during the election window, they were also eligible to opt into the Hybrid Retirement Plan.
Members who were eligible for an optional retirement plan (ORP) and have prior service under Plan 2 were not eligible to elect the Hybrid Retirement Plan and remain as Plan 2 or ORP.
*Non-Eligible Members Some employees are not eligible to participate in the Hybrid Retirement Plan. They include:
• Political subdivision employees who are covered by enhanced benefits for hazardous duty employees
Those employees eligible for an optional retirement plan (ORP) must elect the ORP plan or the Hybrid Retirement Plan. If these members have prior service under Plan 1 or Plan 2, they are not eligible to elect the Hybrid Retirement Plan and must select Plan 1 or Plan 2 (as applicable) or ORP.
Retirement Contributions Employees contribute 5% of their compensation each month to their member contribution account through a pre-tax salary reduction. Some political subdivisions elected to phase in the required 5% member contribution but all employees will be paying the full 5% by July 1, 2016. Member contributions are tax-deferred until they are withdrawn as part of a retirement benefit or as a refund. The employer makes a separate actuarially determined contribution to VRS for all covered employees. VRS invests both member and employer contributions to provide funding for the future benefit payment.
Retirement Contributions Employees contribute 5% of their compensation each month to their member contribution account through a pre-tax salary reduction. Some political subdivisions elected to phase in the required 5% member contribution but all employees will be paying the full 5% by July 1, 2016.
Retirement Contributions A member’s retirement benefit is funded through mandatory and voluntary contributions made by the member and the employer to both the defined benefit and the defined contribution components of the plan. Mandatory contributions are based on a percentage of the employee’s creditable compensation and are required from both the member and the employer. Additionally, members may choose to make voluntary contributions to the defined contribution component of the plan, and the employer is required to match those voluntary contributions according to specified percentages.
TRANSPORTATION DISTRICT COMMISSION OF HAMPTON ROADS NOTES TO FINANCIAL STATEMENTS JUNE 30, 2016 AND 2015
29
Note 13—Defined benefit pension plan (continued)
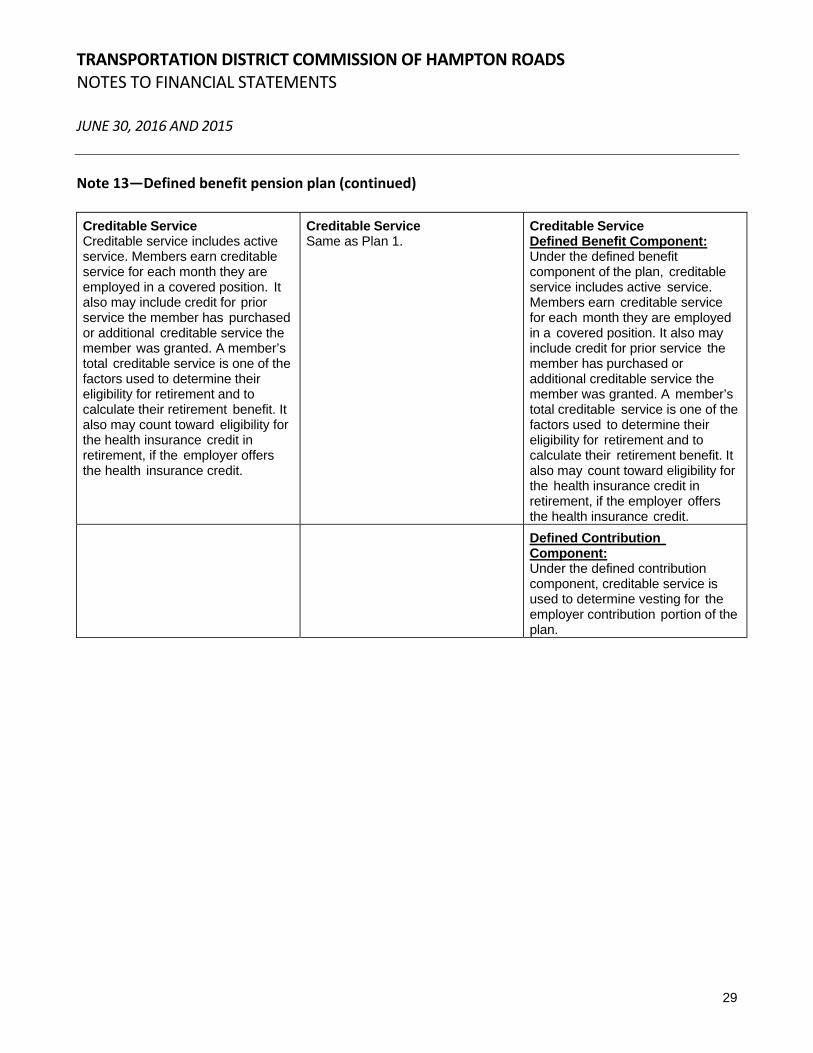
Creditable Service Creditable service includes active service. Members earn creditable service for each month they are employed in a covered position. It also may include credit for prior service the member has purchased or additional creditable service the member was granted. A member’s total creditable service is one of the factors used to determine their eligibility for retirement and to calculate their retirement benefit. It also may count toward eligibility for the health insurance credit in retirement, if the employer offers the health insurance credit.
Creditable Service Same as Plan 1.
Creditable Service Defined Benefit Component: Under the defined benefit component of the plan, creditable service includes active service. Members earn creditable service for each month they are employed in a covered position. It also may include credit for prior service the member has purchased or additional creditable service the member was granted. A member’s total creditable service is one of the factors used to determine their eligibility for retirement and to calculate their retirement benefit. It also may count toward eligibility for the health insurance credit in retirement, if the employer offers the health insurance credit.
Defined Contribution Component: Under the defined contribution component, creditable service is used to determine vesting for the employer contribution portion of the plan.

TRANSPORTATION DISTRICT COMMISSION OF HAMPTON ROADS NOTES TO FINANCIAL STATEMENTS JUNE 30, 2016 AND 2015
30
Note 13—Defined benefit pension plan (continued)
Vesting Vesting is the minimum length of service a member needs to qualify for a future retirement benefit. Members become vested when they have at least five years (60 months) of creditable service. Vesting means members are eligible to qualify for retirement if they meet the age and service requirements for their plan. Members also must be vested to receive a full refund of their member contribution account balance if they leave employment and request a refund. Members are always 100% vested in the contributions that they make.
Vesting Same as Plan 1.
Vesting Defined Benefit Component: Defined benefit vesting is the minimum length of service a member needs to qualify for a future retirement benefit. Members are vested under the defined benefit component of the Hybrid Retirement Plan when they reach five years (60 months) of creditable service. Plan 1 or Plan 2 members with at least five years (60 months) of creditable service who opted into the Hybrid Retirement Plan remain vested in the defined benefit component. Defined Contribution Component: Defined contribution vesting refers to the minimum length of service a member needs to be eligible to withdraw the employer contributions from the defined contribution component of the plan. Members are always 100% vested in the contributions that they make. Upon retirement or leaving covered employment, a member is eligible to withdraw a percentage of employer contributions to the defined contribution component of the plan, based on service. • After two years, a member is
50% vested and may withdraw 50% of employer contributions.
• After three years, a member is 75% vested and may withdraw 75% of employer contributions.
• After four or more years, a member is 100% vested and may withdraw 100% of employer contributions.
Distribution is not required by law until age 70½.
TRANSPORTATION DISTRICT COMMISSION OF HAMPTON ROADS NOTES TO FINANCIAL STATEMENTS JUNE 30, 2016 AND 2015
31
Note 13—Defined benefit pension plan (continued)
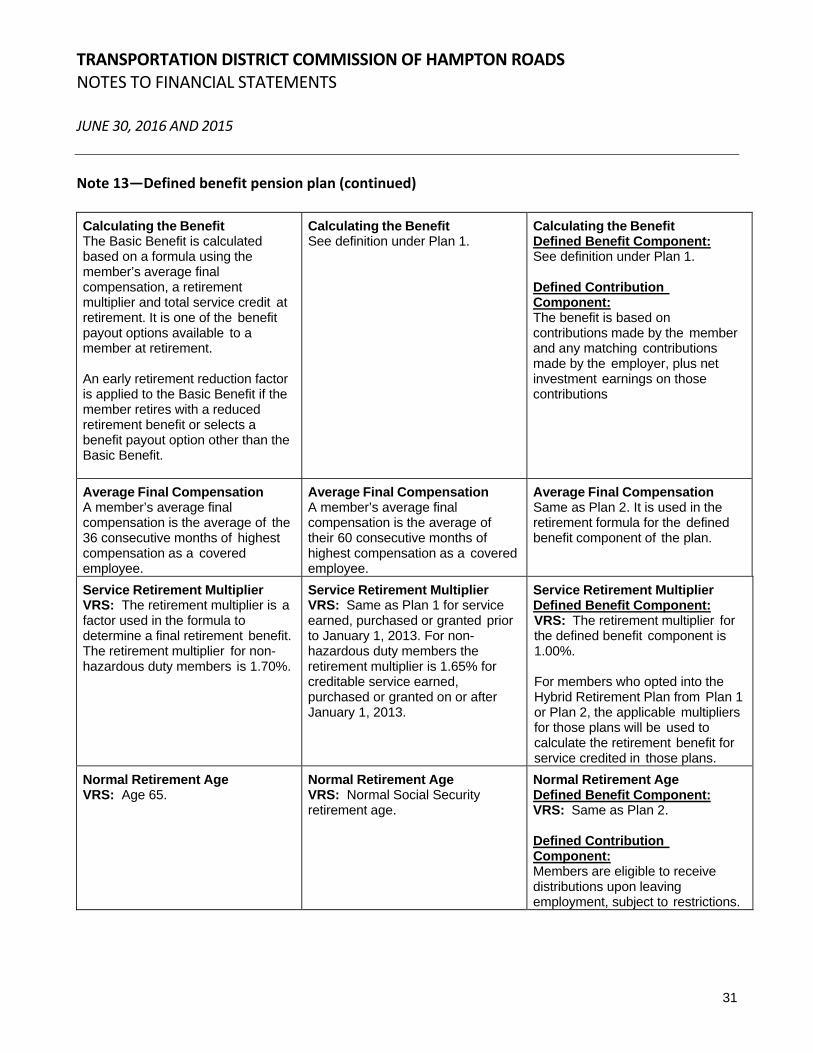
Calculating the Benefit The Basic Benefit is calculated based on a formula using the member’s average final compensation, a retirement multiplier and total service credit at retirement. It is one of the benefit payout options available to a member at retirement. An early retirement reduction factor is applied to the Basic Benefit if the member retires with a reduced retirement benefit or selects a benefit payout option other than the Basic Benefit.
Calculating the Benefit See definition under Plan 1.
Calculating the Benefit Defined Benefit Component: See definition under Plan 1. Defined Contribution Component: The benefit is based on contributions made by the member and any matching contributions made by the employer, plus net investment earnings on those contributions
Average Final Compensation A member’s average final compensation is the average of the 36 consecutive months of highest compensation as a covered employee.
Average Final Compensation A member’s average final compensation is the average of their 60 consecutive months of highest compensation as a covered employee.
Average Final Compensation Same as Plan 2. It is used in the retirement formula for the defined benefit component of the plan.
Service Retirement Multiplier VRS: The retirement multiplier is a factor used in the formula to determine a final retirement benefit. The retirement multiplier for non-hazardous duty members is 1.70%.
Service Retirement Multiplier VRS: Same as Plan 1 for service earned, purchased or granted prior to January 1, 2013. For non- hazardous duty members the retirement multiplier is 1.65% for creditable service earned, purchased or granted on or after January 1, 2013.
Service Retirement Multiplier Defined Benefit Component: VRS: The retirement multiplier for the defined benefit component is 1.00%.
For members who opted into the Hybrid Retirement Plan from Plan 1 or Plan 2, the applicable multipliers for those plans will be used to calculate the retirement benefit for service credited in those plans.
Normal Retirement Age VRS: Age 65.
Normal Retirement Age VRS: Normal Social Security retirement age.
Normal Retirement Age Defined Benefit Component: VRS: Same as Plan 2. Defined Contribution Component: Members are eligible to receive distributions upon leaving employment, subject to restrictions.
TRANSPORTATION DISTRICT COMMISSION OF HAMPTON ROADS NOTES TO FINANCIAL STATEMENTS JUNE 30, 2016 AND 2015
32
Note 13—Defined benefit pension plan (continued)
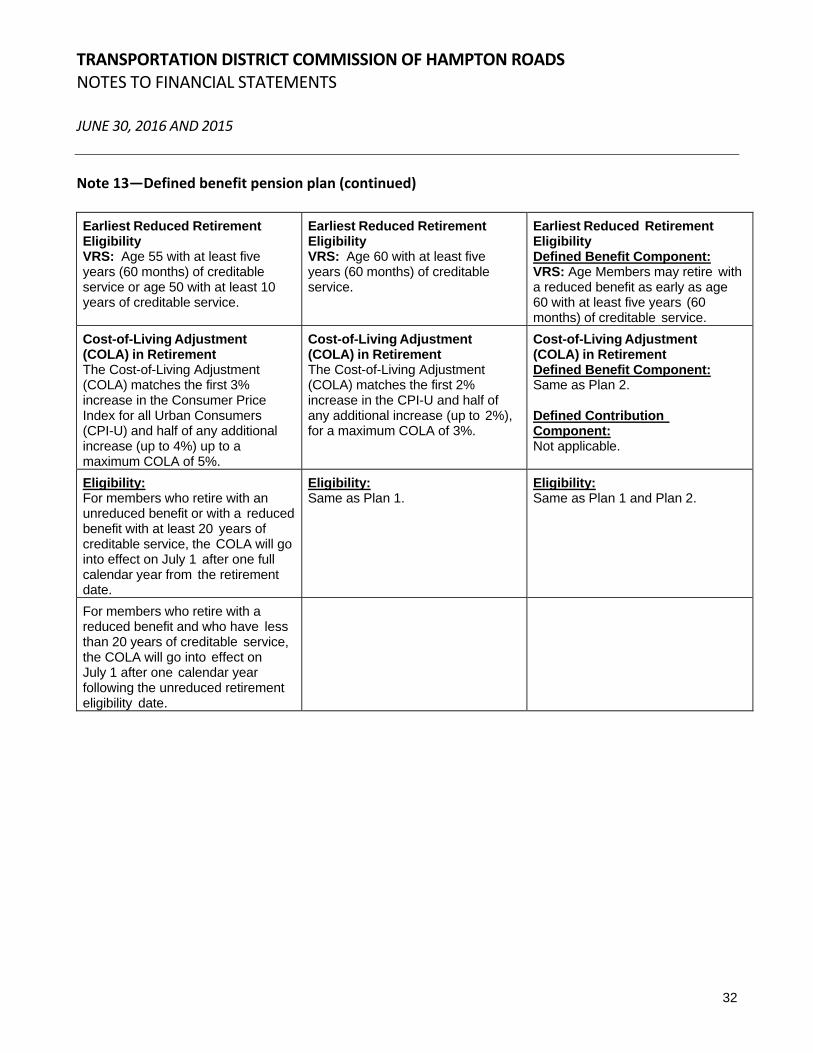
Earliest Reduced Retirement Eligibility VRS: Age 55 with at least five years (60 months) of creditable service or age 50 with at least 10 years of creditable service.
Earliest Reduced Retirement Eligibility VRS: Age 60 with at least five years (60 months) of creditable service.
Earliest Reduced Retirement Eligibility Defined Benefit Component: VRS: Age Members may retire with a reduced benefit as early as age 60 with at least five years (60 months) of creditable service.
Cost-of-Living Adjustment (COLA) in Retirement The Cost-of-Living Adjustment (COLA) matches the first 3% increase in the Consumer Price Index for all Urban Consumers (CPI-U) and half of any additional increase (up to 4%) up to a maximum COLA of 5%.
Cost-of-Living Adjustment (COLA) in Retirement The Cost-of-Living Adjustment (COLA) matches the first 2% increase in the CPI-U and half of any additional increase (up to 2%), for a maximum COLA of 3%.
Cost-of-Living Adjustment (COLA) in Retirement Defined Benefit Component: Same as Plan 2. Defined Contribution Component: Not applicable.
Eligibility: For members who retire with an unreduced benefit or with a reduced benefit with at least 20 years of creditable service, the COLA will go into effect on July 1 after one full calendar year from the retirement date.
Eligibility: Same as Plan 1.
Eligibility: Same as Plan 1 and Plan 2.
For members who retire with a reduced benefit and who have less than 20 years of creditable service, the COLA will go into effect on July 1 after one calendar year following the unreduced retirement eligibility date.
TRANSPORTATION DISTRICT COMMISSION OF HAMPTON ROADS NOTES TO FINANCIAL STATEMENTS JUNE 30, 2016 AND 2015
33
Note 13—Defined benefit pension plan (continued)
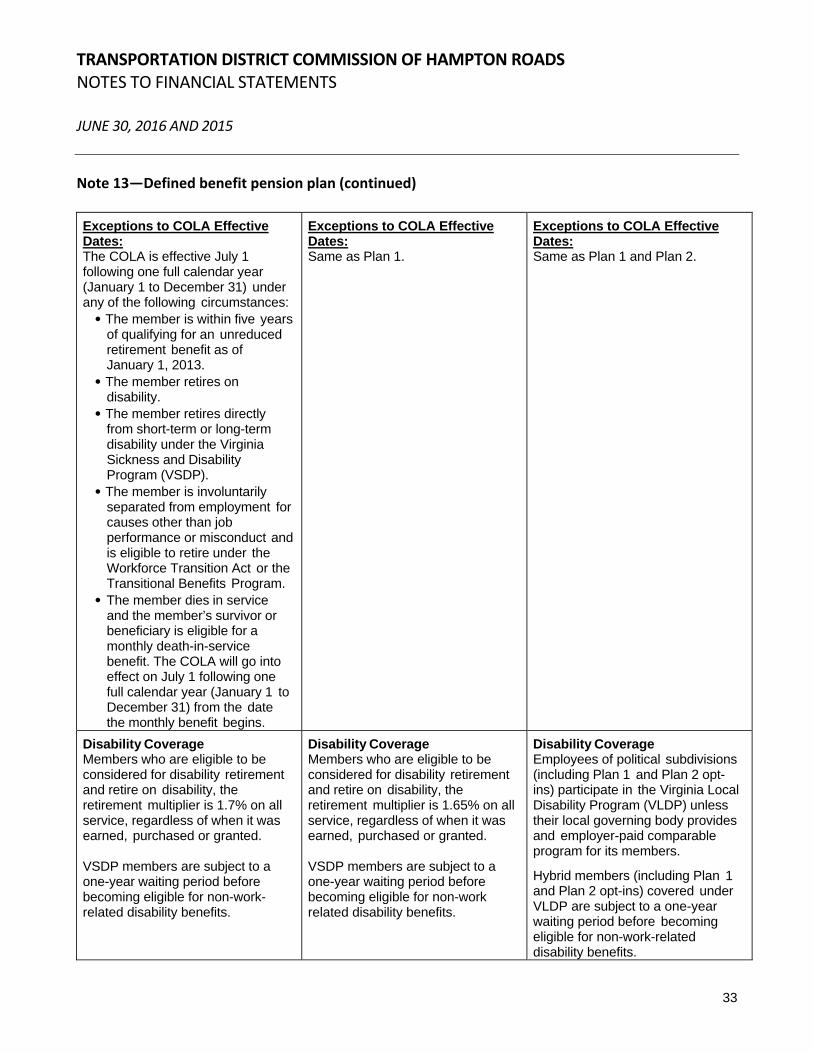
Exceptions to COLA Effective Dates: The COLA is effective July 1 following one full calendar year (January 1 to December 31) under any of the following circumstances: • The member is within five years
of qualifying for an unreduced retirement benefit as of January 1, 2013.
• The member retires on disability.
• The member retires directly from short-term or long-term disability under the Virginia Sickness and Disability Program (VSDP).
• The member is involuntarily separated from employment for causes other than job performance or misconduct and is eligible to retire under the Workforce Transition Act or the Transitional Benefits Program.
• The member dies in service and the member’s survivor or beneficiary is eligible for a monthly death-in-service benefit. The COLA will go into effect on July 1 following one full calendar year (January 1 to December 31) from the date the monthly benefit begins.
Exceptions to COLA Effective Dates: Same as Plan 1.
Exceptions to COLA Effective Dates: Same as Plan 1 and Plan 2.
Disability Coverage Members who are eligible to be considered for disability retirement and retire on disability, the retirement multiplier is 1.7% on all service, regardless of when it was earned, purchased or granted. VSDP members are subject to a one-year waiting period before becoming eligible for non-work- related disability benefits.
Disability Coverage Members who are eligible to be considered for disability retirement and retire on disability, the retirement multiplier is 1.65% on all service, regardless of when it was earned, purchased or granted. VSDP members are subject to a one-year waiting period before becoming eligible for non-work related disability benefits.
Disability Coverage Employees of political subdivisions (including Plan 1 and Plan 2 opt-ins) participate in the Virginia Local Disability Program (VLDP) unless their local governing body provides and employer-paid comparable program for its members.
Hybrid members (including Plan 1 and Plan 2 opt-ins) covered under VLDP are subject to a one-year waiting period before becoming eligible for non-work-related disability benefits.

TRANSPORTATION DISTRICT COMMISSION OF HAMPTON ROADS NOTES TO FINANCIAL STATEMENTS JUNE 30, 2016 AND 2015
34
Note 13—Defined benefit pension plan (continued)
Purchase of Prior Service Members may be eligible to purchase service from previous public employment, active duty military service, an eligible period of leave, or VRS refunded service as creditable service in their plan. Prior creditable service counts toward vesting, eligibility for retirement and the health insurance credit. Only active members are eligible to purchase prior service. When buying service, members must purchase their most recent period of service first. Members also may be eligible to purchase periods of leave without pay.
Purchase of Prior Service Same as Plan 1.
Purchase of Prior Service Defined Benefit Component: Same as Plan 1, with the following exceptions: Hybrid Retirement Plan
members are ineligible for ported service.
The cost for purchasing refunded service is the higher of 4% of creditable compensation or average final compensation.
Plan members have one year from their date of hire or return from leave to purchase all but refunded prior service at approximate normal cost / After that one-year period, the rate for most categories of service will change to actuarial cost.
Defined Contribution Component: Not applicable.
Employees Covered by Benefit Terms – As of the June 30, 2015, actuarial valuation, the following employees were covered by the benefit terms of the pension plan:
Number
81
Inactive Members:
Vested 31Nonvested 130Active elsewhere in VRS 46
Total Inactive Members 207
Active members 292
Total 580
Inactive members or their beneficiaries currently receiving benefits
TRANSPORTATION DISTRICT COMMISSION OF HAMPTON ROADS NOTES TO FINANCIAL STATEMENTS JUNE 30, 2016 AND 2015
35
Note 13—Defined benefit pension plan (continued) Contributions – The contributions requirement for active employees is governed by §51.1-145 of the Code of Virginia, as amended, but may be impacted as a result of funding options provided to political subdivisions by the Virginia General Assembly. Employees are required to contribute 5.00% of their compensation toward their retirement. Prior to July 1, 2012, all or part of the 5.00% member contribution may have been assumed by the employer. Beginning July 1, 2012, new employees were required to pay the 5.00% member contribution. In addition, for existing employees, employers were required to begin making the employee pay the 5.00% member contribution. This could be phased in over a period of up to 5 years and the employer is required to provide a salary increase equal to the amount of the increase in the employee-paid member contribution. The Commission contractually required contribution rate for the year ended June 30, 2016 was 5.99% of covered employee compensation. This rate was based on an actuarially determined rate from an actuarial valuation as of June 30, 2013. This rate, when combined with employee contributions, was expected to finance the costs of benefits earned by employee during the year, with an additional amount to finance any unfunded accrued liability. Contributions to the pension plan from the Commission were $977,271 and $1,029,823 for the years ended June 30, 2016 and 2015, respectively. Net Pension Liability – The Commission’s net pension liability was measured as of June 30, 2015. The total pension liability used to calculate the net pension liability was determined by an actuarial valuation performed as of June 30, 2014, using updated actuarial assumptions, applied to all periods included in the measurement and rolled forward to the measurement date of June 30, 2015. Actuarial Assumptions – The total pension liability for General Employees in the Commission’s Retirement Plan was based on an actuarial valuation as of June 30, 2013, using the Entry Age Normal actuarial cost method and the following assumptions, applied to all periods included in the measurement and rolled forward to the measurement date of June 30, 2015.
Inflation 2.5% Salary increases, including inflation 3.5% - 5.35% Investment rate of return 7.0%, net of pension plan investment expenses,
including inflation* * Administrative expenses as a percent of the market value of assets for the last experience study were found to be approximately 0.06% of the market assets for all of the VRS plans. This would provide an assumed investment return rate for GASB purposes of slightly more than the assumed 7.0%. However, since the difference was minimal, and a more conservative 7.0% investment return assumption provided a projected plan net position that exceeded the projected benefit payments, the long-term expected rate of return on investments was assumed to be 7.0% to simplify preparation of pension liabilities.
TRANSPORTATION DISTRICT COMMISSION OF HAMPTON ROADS NOTES TO FINANCIAL STATEMENTS JUNE 30, 2016 AND 2015
36
Note 13—Defined benefit pension plan (continued) Mortality rates: 14% of deaths are assumed to be service related. Largest 10 - Non-LEOS: Pre-Retirement:
RP-2000 Employee Mortality Table Projected with Scale AA to 2020 with males set forward 4 years and females were set back 2 years.
Post-Retirement: RP-2000 Combined Mortality Table Projected with Scale AA to 2020 with males set forward 1 year. Post-Disablement:
RP-2000 Disability Life Mortality Table Projected to 2020 with males set back 3 years and no provision for future mortality improvement.
All Others (Non 10 Largest) – Non-LEOS: Pre-Retirement:
RP-2000 Employee Mortality Table Projected with Scale AA to 2020 with males set forward 4 years and females were set back 2 years.
Post-Retirement: RP-2000 Combined Mortality Table Projected with Scale AA to 2020 with males set forward 1 year. Post-Disablement:
RP-2000 Disability Life Mortality Table Projected to 2020 with males set back 3 years and no provision for future mortality improvement.
The actuarial assumptions used in the June 30, 2014 valuation were based on the results of an actuarial experience study for the period from July 1, 2008 through June 30, 2012. Changes to the actuarial assumptions as a result of the experience study are as follows: Largest 10 - Non-LEOS:
- Update mortality table - Decrease in rates of service retirement - Decrease in rates of disability retirement - Reduce rates of salary increase by 0.25% per year
All Others (Non 10 Largest) - Non-LEOS:
- Update mortality table - Decrease in rates of service retirement - Decrease in rates of disability retirement - Reduce rates of salary increase by 0.25% per year

TRANSPORTATION DISTRICT COMMISSION OF HAMPTON ROADS NOTES TO FINANCIAL STATEMENTS JUNE 30, 2016 AND 2015
37
Note 13—Defined benefit pension plan (continued) Long-Term Expected Rate of Return – The long-term expected rate of return on pension investments was determined using a log-normal distribution analysis in which best-estimate ranges of expected future real rates of return (expected returns, net of pension investment expense, and inflation) are developed for each major asset class. These ranges are combined to produce the long-term expected rate of return by weighting the expected future real rates of return by the target asset allocation percentage and by adding expected inflation. The target asset allocation and best estimate of arithmetic real rates of return for each major asset class are summarized in the following table:
WeightedArithmetic AverageLong‐Term Long‐Term
Target Expected ExpectedAllocation Rate of Return Rate of Return
U.S. Equity 19.50% 6.46% 1.26%Developed Non U.S. Equity 16.50% 6.28% 1.04%Emerging Market Equity 6.00% 10.00% 0.60%Fixed Income 15.00% 0.09% 0.01%Emerging Debt 3.00% 3.51% 0.11%Rate Sensitive Credit 4.50% 3.51% 0.16%Non Rate Sensitive Credit 4.50% 5.00% 0.23%Convertibles 3.00% 4.81% 0.14%Public Real Estate 2.25% 6.12% 0.14%Private Real Estate 12.75% 7.10% 0.91%Private Equity 12.00% 10.41% 1.25%Cash 1.00% -1.50% -0.02%
Total 100.00% 5.83%
Inflation 2.50%
* Expected arithmetic nominal return 8.33%
Asset Class (Strategy)
*Using stochastic projection results provides an expected range of real rates of return over various time horizons. Looking at one year results produces an expected real return of 8.33% but also has a high standard deviation, which means there is high volatility. Over larger time horizons, the volatility declines significantly and provides a median return of 7.44%, including expected inflation of 2.50%.
TRANSPORTATION DISTRICT COMMISSION OF HAMPTON ROADS NOTES TO FINANCIAL STATEMENTS JUNE 30, 2016 AND 2015
38
Note 13—Defined benefit pension plan (continued) Discount Rate – The discount rate used to measure the total pension liability was 7.00%. The projection of cash flows used to determine the discount rate assumed that System member contributions will be made per the VRS Statutes and the employer contributions will be made in accordance with the VRS funding policy at rates equal to the difference between actuarially determined contribution rates adopted by the VRS Board of Trustees and the member rate. Through the fiscal year ending June 30, 2018, the rate contributed by the employer for the Political Subdivision Retirement Plan will be subject to the portion of the VRS Board-certified rates that are funded by the Virginia General Assembly. From July 1, 2018 on, participating employers are assumed to contribute 100% of the actuarially determined contribution rates. Based on those assumptions, the pension plan’s fiduciary net position was projected to be available to make all projected future benefit payments of current active and inactive employees. Therefore, the long-term expected rate of return was applied to all periods of projected benefit payments to determine the total pension liability. Changes in Net Pension Liability
Plan Net Pension
Total Pension Fiduciary Net Liability (Asset)
Liability (a) Position (b) (a) ‐ (b)
Balances at June 30, 2014 31,044,923$ 31,777,102$ (732,179)$
Changes for the year:
Service cost 1,645,945 - 1,645,945
Interest 2,132,186 - 2,132,186
Difference between expected and actual (264,067) - (264,067)
Contributions - employer - 934,294 (934,294) Contributions - employee - 789,916 (789,916) Net investment income - 1,483,386 (1,483,386) Benefit payments, including refunds of
employee contributions (1,170,235) (1,170,235) - Administrative expense - (19,456) 19,456 Net changes - (316) 316
Balances at June 30, 2015 33,388,752$ 33,794,691$ (405,939)$
Sensitivity of the Net Pension Liability to Changes in the Discount Rate – The following represents the net pension liability (asset) calculated using the stated discount rate, as well as what the net position liability (asset) would be if it were calculated using a stated discount rate that is one-percentage-point lower or one-percentage-point higher than the current rate:
1% Decrease Current Discount 1% Increase
6.00% Rate 7.00% 8.00%
Plan's net pension liability (asset) 4,103,021$ (405,939)$ (4,146,933)$
TRANSPORTATION DISTRICT COMMISSION OF HAMPTON ROADS NOTES TO FINANCIAL STATEMENTS JUNE 30, 2016 AND 2015
39
Note 13—Defined benefit pension plan (continued) Pension Expense and Deferred Outflows of Resources and Deferred Inflows of Resources Related to Pensions – For the year ended June 30, 2016, the Commission recognized pension expense of $370,738. At June 30, 2016, the Commission reported deferred outflows of resources and deferred inflows of resources related to pensions from the following sources:
Deferred DeferredOutflows Inflows
of Resources of ResourcesEmployer contributions made subsequent to measurement date 977,271$ -$ Difference between expected and actual experience - 199,503 Net difference between projected and actual earnings on
plan investments - 836,832
977,271$ 1,036,335$
$977,271 reported as deferred outflows of resources related to pensions resulting from the commissions contributions subsequent to the measurement date will be recognized as a reduction of the Net pension liability in fiscal year end June 30, 2017. Other amounts reported as deferred inflows of resources related to pensions as of June 30, 2016, will be recognized in pension expense as follows:
(394,155)$ 2018 (394,155) 2019 (394,154) 2020 146,129
(1,036,335)$
2017
Retirement Plan of the Transportation District Commission of Hampton Roads Plan Description – Effective January 1, 2012, the Transit Employees of Tidewater Disability and Retirement Allowance Plan and Retirement Plan of Hampton Roads Transportation District Commission merged to become Retirement Plan of the Transportation District Commission of Hampton Roads (“Plan”). The Plan represents Transit Management Company, a wholly owned subsidiary of the Commission, which covers principally those employees subject to the Commission's union bargaining agreement between the Commission and the Local Union 1177 (“Union”), Norfolk, Virginia, of the Amalgamated Transit Union, dated July 1, 2010. The Plan is a single employer defined benefit plan administered by the Transportation District Commission of Hampton Roads. The Plan provides pensions for all collectively bargained employees of HRT. For purposes of measuring the net pension liability, deferred outflows of resources and deferred inflows of resources related to pensions, and pension expense, information about the fiduciary net position of the plan and additions to/deductions from the plan’s fiduciary net position have been determined on the same basis as they are reported to the Commission. For this purpose, benefit payments (including refunds of employee contributions) are recognized when due and payable in accordance with the benefit terms.
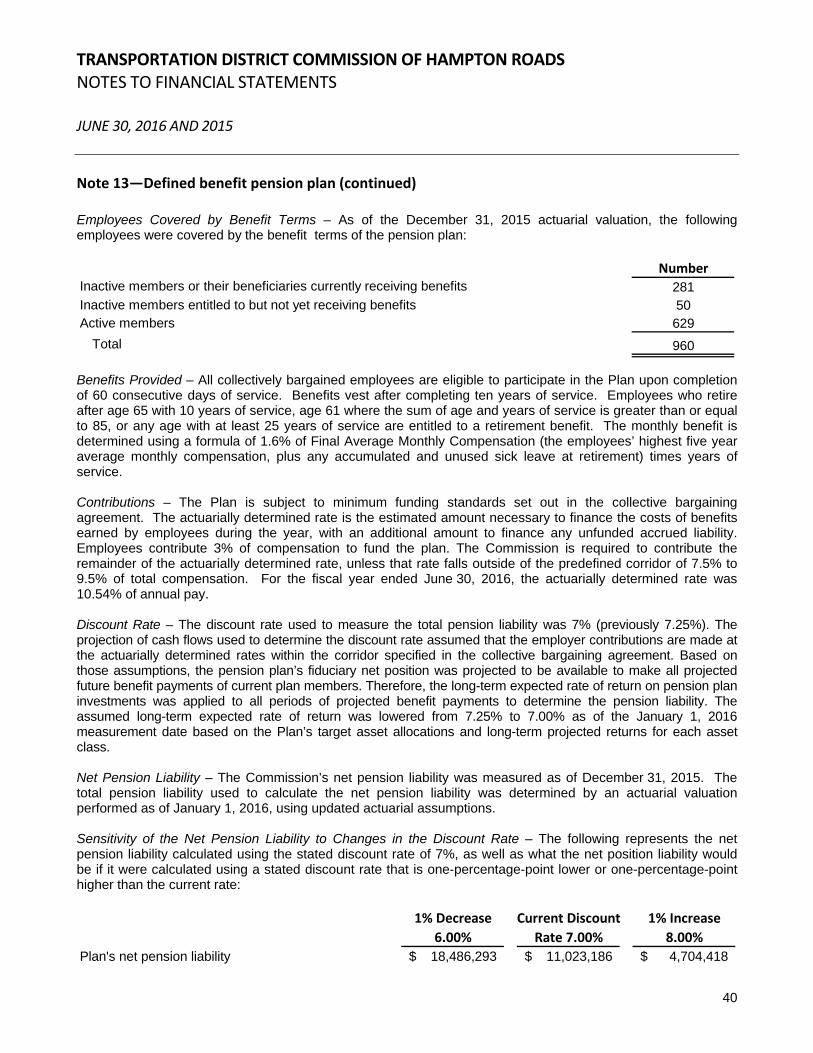
TRANSPORTATION DISTRICT COMMISSION OF HAMPTON ROADS NOTES TO FINANCIAL STATEMENTS JUNE 30, 2016 AND 2015
40
Note 13—Defined benefit pension plan (continued) Employees Covered by Benefit Terms – As of the December 31, 2015 actuarial valuation, the following employees were covered by the benefit terms of the pension plan:
Number
281Inactive members entitled to but not yet receiving benefits 50Active members 629
Total 960
Inactive members or their beneficiaries currently receiving benefits
Benefits Provided – All collectively bargained employees are eligible to participate in the Plan upon completion of 60 consecutive days of service. Benefits vest after completing ten years of service. Employees who retire after age 65 with 10 years of service, age 61 where the sum of age and years of service is greater than or equal to 85, or any age with at least 25 years of service are entitled to a retirement benefit. The monthly benefit is determined using a formula of 1.6% of Final Average Monthly Compensation (the employees’ highest five year average monthly compensation, plus any accumulated and unused sick leave at retirement) times years of service. Contributions – The Plan is subject to minimum funding standards set out in the collective bargaining agreement. The actuarially determined rate is the estimated amount necessary to finance the costs of benefits earned by employees during the year, with an additional amount to finance any unfunded accrued liability. Employees contribute 3% of compensation to fund the plan. The Commission is required to contribute the remainder of the actuarially determined rate, unless that rate falls outside of the predefined corridor of 7.5% to 9.5% of total compensation. For the fiscal year ended June 30, 2016, the actuarially determined rate was 10.54% of annual pay. Discount Rate – The discount rate used to measure the total pension liability was 7% (previously 7.25%). The projection of cash flows used to determine the discount rate assumed that the employer contributions are made at the actuarially determined rates within the corridor specified in the collective bargaining agreement. Based on those assumptions, the pension plan’s fiduciary net position was projected to be available to make all projected future benefit payments of current plan members. Therefore, the long-term expected rate of return on pension plan investments was applied to all periods of projected benefit payments to determine the pension liability. The assumed long-term expected rate of return was lowered from 7.25% to 7.00% as of the January 1, 2016 measurement date based on the Plan’s target asset allocations and long-term projected returns for each asset class. Net Pension Liability – The Commission’s net pension liability was measured as of December 31, 2015. The total pension liability used to calculate the net pension liability was determined by an actuarial valuation performed as of January 1, 2016, using updated actuarial assumptions. Sensitivity of the Net Pension Liability to Changes in the Discount Rate – The following represents the net pension liability calculated using the stated discount rate of 7%, as well as what the net position liability would be if it were calculated using a stated discount rate that is one-percentage-point lower or one-percentage-point higher than the current rate:
1% Decrease Current Discount 1% Increase
6.00% Rate 7.00% 8.00%
Plan's net pension liability 18,486,293$ 11,023,186$ 4,704,418$
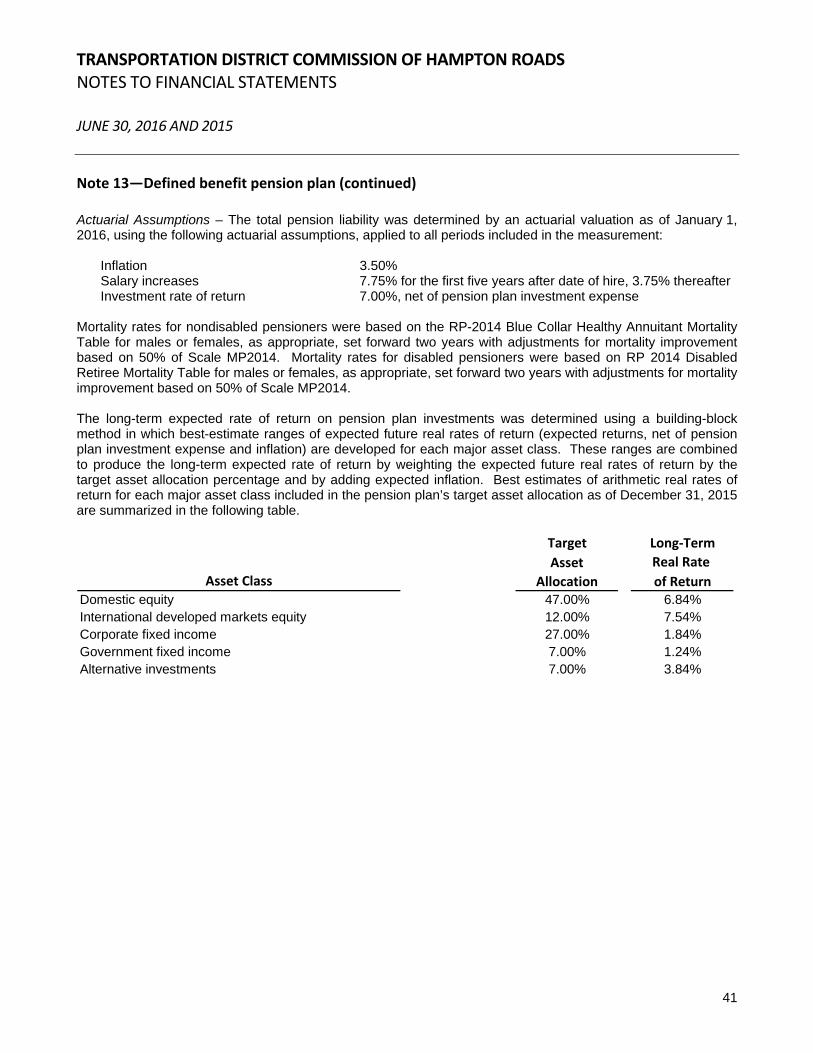
TRANSPORTATION DISTRICT COMMISSION OF HAMPTON ROADS NOTES TO FINANCIAL STATEMENTS JUNE 30, 2016 AND 2015
41
Note 13—Defined benefit pension plan (continued) Actuarial Assumptions – The total pension liability was determined by an actuarial valuation as of January 1, 2016, using the following actuarial assumptions, applied to all periods included in the measurement:
Inflation 3.50% Salary increases 7.75% for the first five years after date of hire, 3.75% thereafter Investment rate of return 7.00%, net of pension plan investment expense
Mortality rates for nondisabled pensioners were based on the RP-2014 Blue Collar Healthy Annuitant Mortality Table for males or females, as appropriate, set forward two years with adjustments for mortality improvement based on 50% of Scale MP2014. Mortality rates for disabled pensioners were based on RP 2014 Disabled Retiree Mortality Table for males or females, as appropriate, set forward two years with adjustments for mortality improvement based on 50% of Scale MP2014. The long-term expected rate of return on pension plan investments was determined using a building-block method in which best-estimate ranges of expected future real rates of return (expected returns, net of pension plan investment expense and inflation) are developed for each major asset class. These ranges are combined to produce the long-term expected rate of return by weighting the expected future real rates of return by the target asset allocation percentage and by adding expected inflation. Best estimates of arithmetic real rates of return for each major asset class included in the pension plan’s target asset allocation as of December 31, 2015 are summarized in the following table.
Target Long‐Term
Asset Real Rate
Allocation of ReturnDomestic equity 47.00% 6.84%International developed markets equity 12.00% 7.54%Corporate fixed income 27.00% 1.84%Government fixed income 7.00% 1.24%Alternative investments 7.00% 3.84%
Asset Class
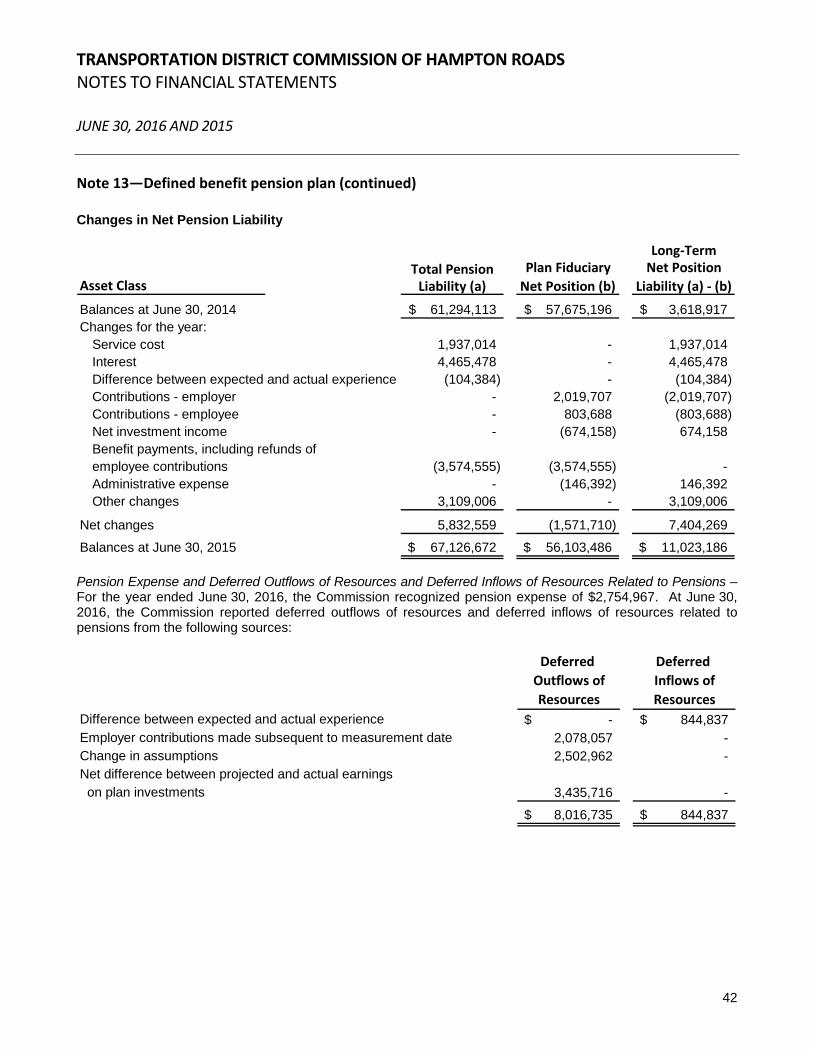
TRANSPORTATION DISTRICT COMMISSION OF HAMPTON ROADS NOTES TO FINANCIAL STATEMENTS JUNE 30, 2016 AND 2015
42
Note 13—Defined benefit pension plan (continued) Changes in Net Pension Liability
Long‐Term
Total Pension Plan Fiduciary Net Position
Liability (a) Net Position (b) Liability (a) ‐ (b)
Balances at June 30, 2014 61,294,113$ 57,675,196$ 3,618,917$ Changes for the year:
Service cost 1,937,014 - 1,937,014 Interest 4,465,478 - 4,465,478 Difference between expected and actual experience (104,384) - (104,384) Contributions - employer - 2,019,707 (2,019,707) Contributions - employee - 803,688 (803,688) Net investment income - (674,158) 674,158 Benefit payments, including refunds of employee contributions (3,574,555) (3,574,555) - Administrative expense - (146,392) 146,392 Other changes 3,109,006 - 3,109,006
Net changes 5,832,559 (1,571,710) 7,404,269
Balances at June 30, 2015 67,126,672$ 56,103,486$ 11,023,186$
Asset Class
Pension Expense and Deferred Outflows of Resources and Deferred Inflows of Resources Related to Pensions – For the year ended June 30, 2016, the Commission recognized pension expense of $2,754,967. At June 30, 2016, the Commission reported deferred outflows of resources and deferred inflows of resources related to pensions from the following sources:
Deferred Deferred
Outflows of Inflows of
Resources Resources
Difference between expected and actual experience -$ 844,837$ Employer contributions made subsequent to measurement date 2,078,057 - Change in assumptions 2,502,962 - Net difference between projected and actual earnings on plan investments 3,435,716 -
8,016,735$ 844,837$
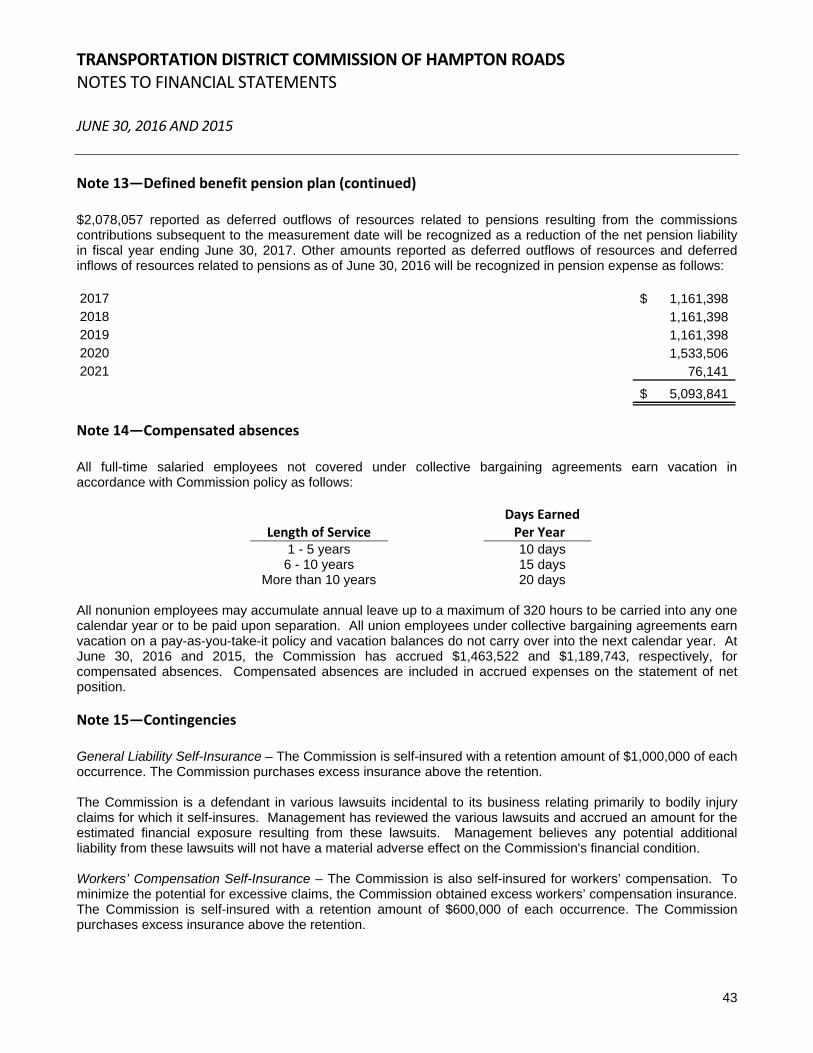
TRANSPORTATION DISTRICT COMMISSION OF HAMPTON ROADS NOTES TO FINANCIAL STATEMENTS JUNE 30, 2016 AND 2015
43
Note 13—Defined benefit pension plan (continued) $2,078,057 reported as deferred outflows of resources related to pensions resulting from the commissions contributions subsequent to the measurement date will be recognized as a reduction of the net pension liability in fiscal year ending June 30, 2017. Other amounts reported as deferred outflows of resources and deferred inflows of resources related to pensions as of June 30, 2016 will be recognized in pension expense as follows: 2017 1,161,398$ 2018 1,161,398 2019 1,161,398 2020 1,533,506 2021 76,141
5,093,841$
Note 14—Compensated absences All full-time salaried employees not covered under collective bargaining agreements earn vacation in accordance with Commission policy as follows:
Length of Service Days Earned Per Years
1 - 5 years 10 days 6 - 10 years 15 days
More than 10 years 20 days All nonunion employees may accumulate annual leave up to a maximum of 320 hours to be carried into any one calendar year or to be paid upon separation. All union employees under collective bargaining agreements earn vacation on a pay-as-you-take-it policy and vacation balances do not carry over into the next calendar year. At June 30, 2016 and 2015, the Commission has accrued $1,463,522 and $1,189,743, respectively, for compensated absences. Compensated absences are included in accrued expenses on the statement of net position. Note 15—Contingencies General Liability Self-Insurance – The Commission is self-insured with a retention amount of $1,000,000 of each occurrence. The Commission purchases excess insurance above the retention. The Commission is a defendant in various lawsuits incidental to its business relating primarily to bodily injury claims for which it self-insures. Management has reviewed the various lawsuits and accrued an amount for the estimated financial exposure resulting from these lawsuits. Management believes any potential additional liability from these lawsuits will not have a material adverse effect on the Commission's financial condition. Workers’ Compensation Self-Insurance – The Commission is also self-insured for workers’ compensation. To minimize the potential for excessive claims, the Commission obtained excess workers’ compensation insurance. The Commission is self-insured with a retention amount of $600,000 of each occurrence. The Commission purchases excess insurance above the retention.

TRANSPORTATION DISTRICT COMMISSION OF HAMPTON ROADS NOTES TO FINANCIAL STATEMENTS JUNE 30, 2016 AND 2015
44
Note 15—Contingencies (continued) Following is a summary of changes in self-insurance claims payable for the fiscal years ended June 30, 2016 and 2015:
Beginning Claims and Claim Ending
Balance Reserves Payments Balance
2016 4,273,422$ 1,421,105$ 1,320,528$ 4,373,999$ 2015 3,531,587 2,234,106 1,492,271 4,273,422
Federally Assisted Grant Programs – The Commission participates in a number of federally assisted grant programs. Although the Commission has been audited in accordance with the provisions of Uniform Guidance, these programs remain subject to financial and compliance audits by the grantors or their representatives. Such audits could lead to requests for reimbursements to the grantor agency for expenditures disallowed under the terms of the grant. Based on prior experience, the Commission believes such disallowances, if any, will not be significant.

REQUIRED SUPPLEMENTARY INFORMATION
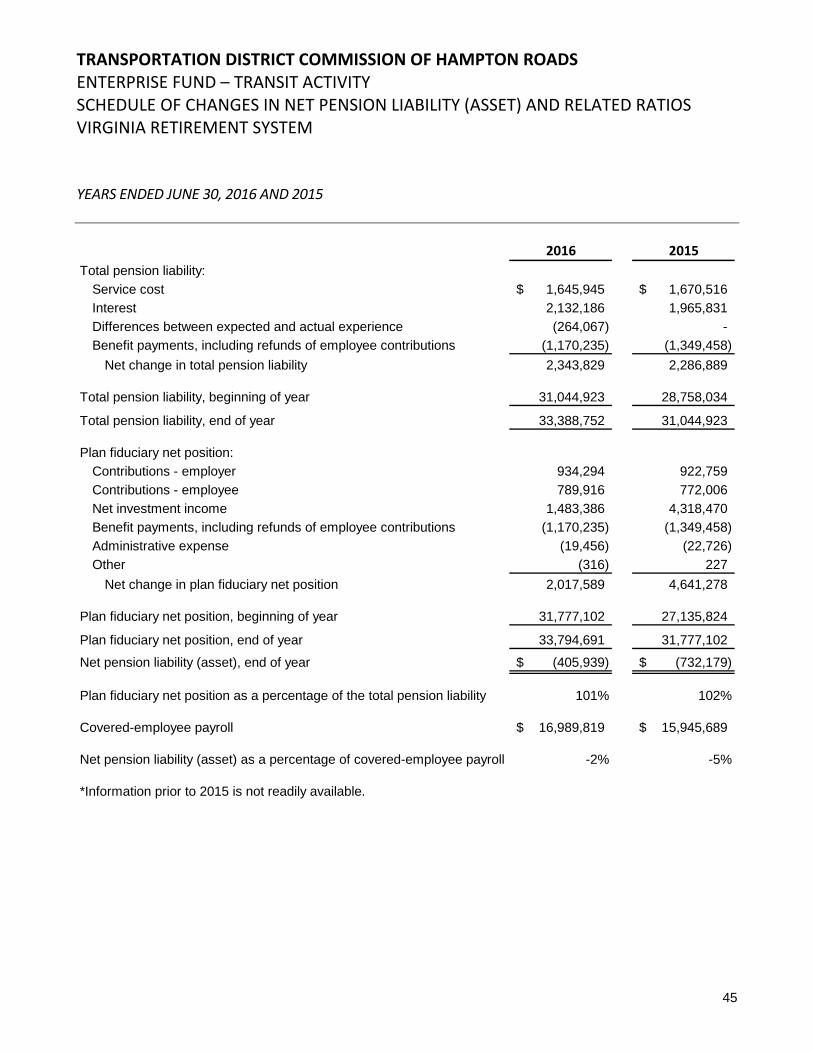
TRANSPORTATION DISTRICT COMMISSION OF HAMPTON ROADS ENTERPRISE FUND – TRANSIT ACTIVITY SCHEDULE OF CHANGES IN NET PENSION LIABILITY (ASSET) AND RELATED RATIOS VIRGINIA RETIREMENT SYSTEM YEARS ENDED JUNE 30, 2016 AND 2015
45
2016 2015
Total pension liability:
Service cost 1,645,945$ 1,670,516$
Interest 2,132,186 1,965,831
Differences between expected and actual experience (264,067) -
Benefit payments, including refunds of employee contributions (1,170,235) (1,349,458)
Net change in total pension liability 2,343,829 2,286,889
Total pension liability, beginning of year 31,044,923 28,758,034
Total pension liability, end of year 33,388,752 31,044,923
Plan fiduciary net position:
Contributions - employer 934,294 922,759
Contributions - employee 789,916 772,006
Net investment income 1,483,386 4,318,470
Benefit payments, including refunds of employee contributions (1,170,235) (1,349,458)
Administrative expense (19,456) (22,726)
Other (316) 227
Net change in plan fiduciary net position 2,017,589 4,641,278
Plan fiduciary net position, beginning of year 31,777,102 27,135,824
Plan fiduciary net position, end of year 33,794,691 31,777,102
Net pension liability (asset), end of year (405,939)$ (732,179)$
Plan fiduciary net position as a percentage of the total pension liability 101% 102%
Covered-employee payroll 16,989,819$ 15,945,689$
Net pension liability (asset) as a percentage of covered-employee payroll -2% -5%
*Information prior to 2015 is not readily available.

TRANSPORTATION DISTRICT COMMISSION OF HAMPTON ROADS ENTERPRISE FUND – TRANSIT ACTIVITY SCHEDULE OF CHANGES IN NET PENSION LIABILITY (ASSET) AND RELATED RATIOS RETIREMENT PLAN OF TRANSPORTATION DISTRICT COMMISSION YEARS ENDED JUNE 30, 2016 AND 2015
46
2016 2015
Total pension liability:
Service cost 1,937,014$ 1,992,694$
Interest 4,465,478 1,881,747
Differences between expected and actual experience (104,384) 1,256,437
Changes in assumptions 3,109,006 -
Benefit payments, including refunds of employee contributions (3,574,555) (3,488,251)
Net change in total pension liability 5,832,559 1,642,627
Total pension liability, beginning of year 61,294,113 59,651,486
Total pension liability, end of year 67,126,672 61,294,113
Plan fiduciary net position:
Contributions - employer 2,019,707 1,862,410
Contributions - employee 803,688 899,747
Net investment income (674,158) 4,588,910
Benefit payments, including refunds of employee contributions (3,574,555) (3,488,251)
Administrative expense (146,392) (127,927)
Other - 40,000
Net change in plan fiduciary net position (1,571,710) 3,774,889
Plan fiduciary net position, beginning of year 57,675,196 53,900,307
Plan fiduciary net position, end of year 56,103,486 57,675,196
Net pension liability, end of year 11,023,186$ 3,618,917$
Plan fiduciary net position as a percentage of the total pension liability 84% 94%
Covered-employee payroll 25,916,719$ 27,075,414$
Net pension liability as a percentage of covered-employee payroll 43% 13%
*Information prior to 2015 is not readily available

TRANSPORTATION DISTRICT COMMISSION OF HAMPTON ROADS SCHEDULE OF EMPLOYER CONTRIBUTIONS VIRGINIA RETIREMENT SYSTEM YEARS ENDED JUNE 30, 2016 AND 2015
47
Contributions in Contributions
Relation to Employer's as a % of
Contractually Contractually Contribution Covered Covered
Required Required Deficiency Employee Employee
Date Contribution Contribution (Excess) Payroll Payroll
2016 1,017,690$ 977,271$ 40,419$ 16,989,819$ 5.99%2015 1,029,823$ 1,029,823$ -$ 15,945,689$ 6.46%
*Information prior to 2015 is not readily available.
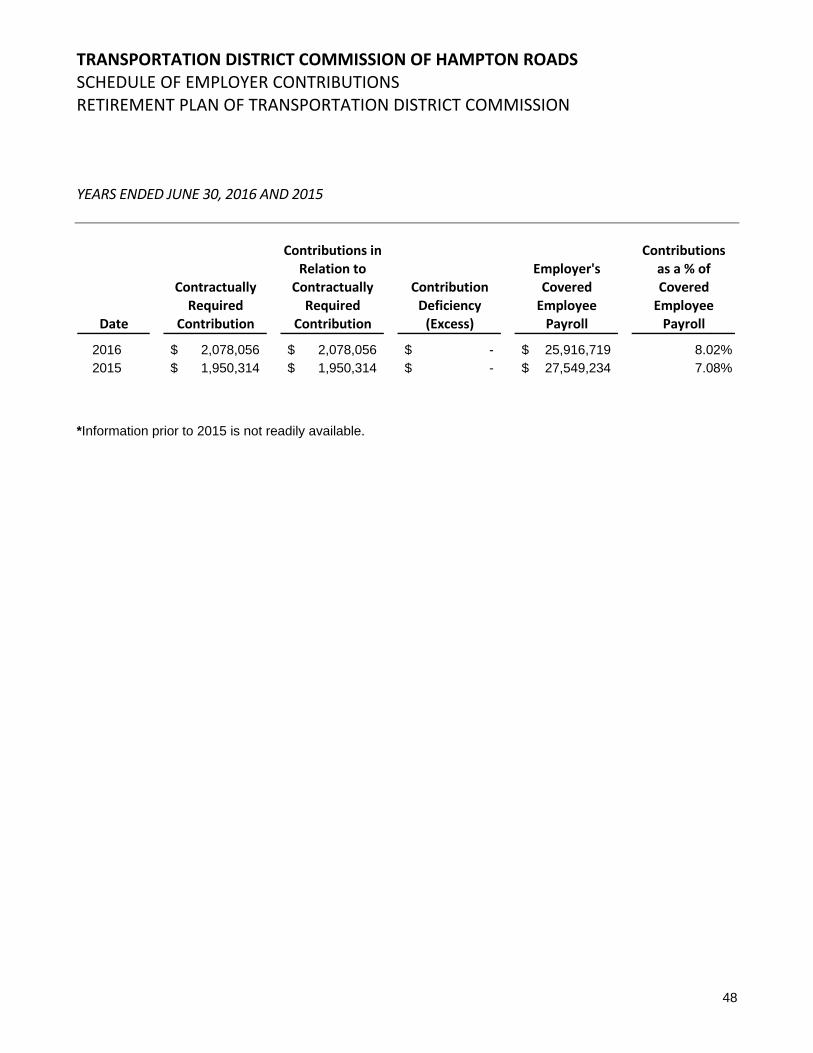
TRANSPORTATION DISTRICT COMMISSION OF HAMPTON ROADS SCHEDULE OF EMPLOYER CONTRIBUTIONS RETIREMENT PLAN OF TRANSPORTATION DISTRICT COMMISSION YEARS ENDED JUNE 30, 2016 AND 2015
48
Contributions in Contributions
Relation to Employer's as a % of
Contractually Contractually Contribution Covered Covered
Required Required Deficiency Employee Employee
Date Contribution Contribution (Excess) Payroll Payroll
2016 2,078,056$ 2,078,056$ -$ 25,916,719$ 8.02%2015 1,950,314$ 1,950,314$ -$ 27,549,234$ 7.08%
*Information prior to 2015 is not readily available.
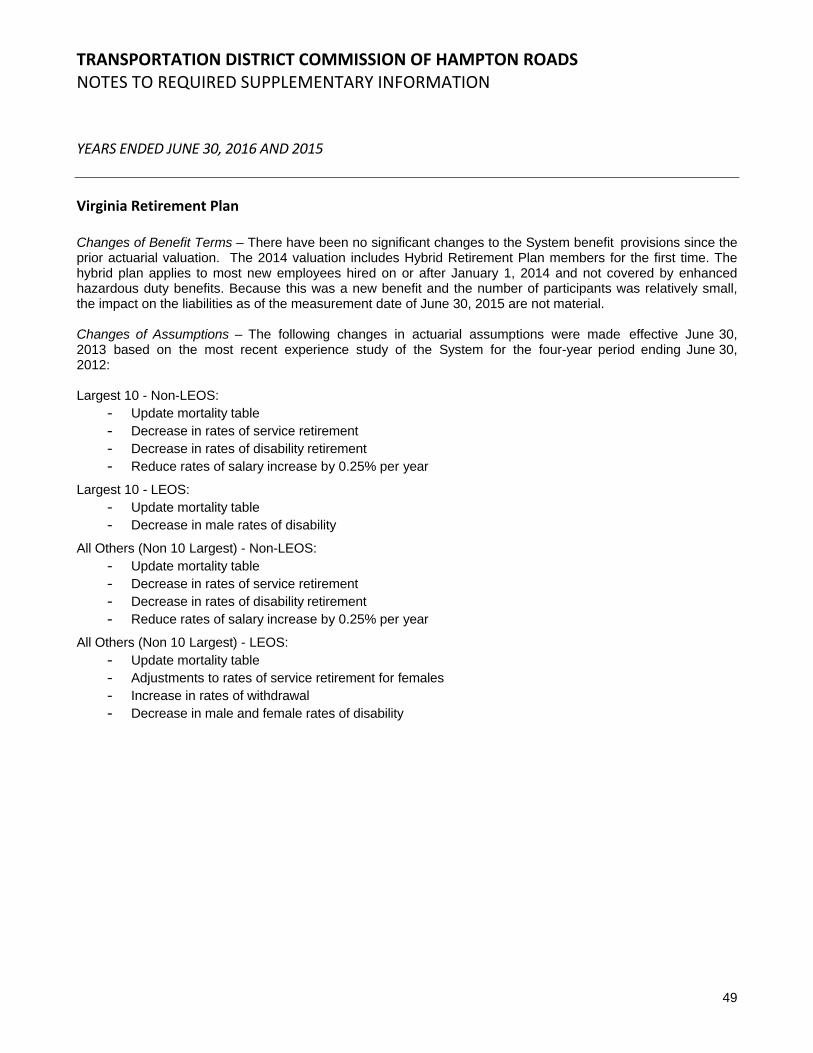
TRANSPORTATION DISTRICT COMMISSION OF HAMPTON ROADS NOTES TO REQUIRED SUPPLEMENTARY INFORMATION YEARS ENDED JUNE 30, 2016 AND 2015
49
Virginia Retirement Plan Changes of Benefit Terms – There have been no significant changes to the System benefit provisions since the prior actuarial valuation. The 2014 valuation includes Hybrid Retirement Plan members for the first time. The hybrid plan applies to most new employees hired on or after January 1, 2014 and not covered by enhanced hazardous duty benefits. Because this was a new benefit and the number of participants was relatively small, the impact on the liabilities as of the measurement date of June 30, 2015 are not material. Changes of Assumptions – The following changes in actuarial assumptions were made effective June 30, 2013 based on the most recent experience study of the System for the four-year period ending June 30, 2012: Largest 10 - Non-LEOS:
- Update mortality table - Decrease in rates of service retirement - Decrease in rates of disability retirement - Reduce rates of salary increase by 0.25% per year
Largest 10 - LEOS: - Update mortality table - Decrease in male rates of disability
All Others (Non 10 Largest) - Non-LEOS: - Update mortality table - Decrease in rates of service retirement - Decrease in rates of disability retirement - Reduce rates of salary increase by 0.25% per year
All Others (Non 10 Largest) - LEOS: - Update mortality table - Adjustments to rates of service retirement for females - Increase in rates of withdrawal - Decrease in male and female rates of disability

TRANSPORTATION DISTRICT COMMISSION OF HAMPTON ROADS NOTES TO REQUIRED SUPPLEMENTARY INFORMATION YEARS ENDED JUNE 30, 2016 AND 2015
50
Retirement Plan of the Transportation District Commission of Hampton Roads Valuation date
Actuarial determined contribution rates are calculated as of the January 1st 18 months prior to the beginning of the employer’s fiscal year in which contributions are reported.
Actuarial cost method Entry age normal
Amortization method Open level dollar for remaining unfunded liability
Amortization period 30 years
Asset valuation method
Market value of assets less unrecognized returns in each of the last four years. Unrecognized return is equal to the difference between the actual and expected return on a market value basis, and is recognized over a four-year period, further adjusted, if necessary, to be within 20% of the market value.
Actuarial Assumptions:
Investment rate of return
7.00% the net investment return assumption is a long-term estimate derived from historical data, current and recent market expectations and professional judgment. As part of the analysis, a building block approach was used that reflects inflation expectations and anticipated risk premiums for each of the portfolio’s asset classes, as well as the Plan’s target asset allocation.
Inflation rate 3.5%
Project salary increases 7.75% for the first five years after date of hire, 3.75% thereafter
Cost of living adjustments N/A
Retirement rates Age
Retirement Probability
50-55 7% 56-59 4 60 10 61 15 62-63 40 64 30 65 & older 100
Mortality rates
RP-2014 Blue Collar Employee Mortality Table with sex-distinct rates, set forward two years and projected generationally with 50% of Scale MP2014 for pre-retirement lives.
RP-2014 Blue Collar Healthy Annuitant Mortality Table with sex-distinct rates, set forward two years and projected generationally with 50% of Scale MP2014 for nondisabled pensioner lives.
RP-2014 Disabled Retiree Mortality Table with sex-distinct rates, set forward two years and projected generationally with 50% of Scale MP2014 for disabled pensioner lives.

SUPPLEMENTARY INFORMATION
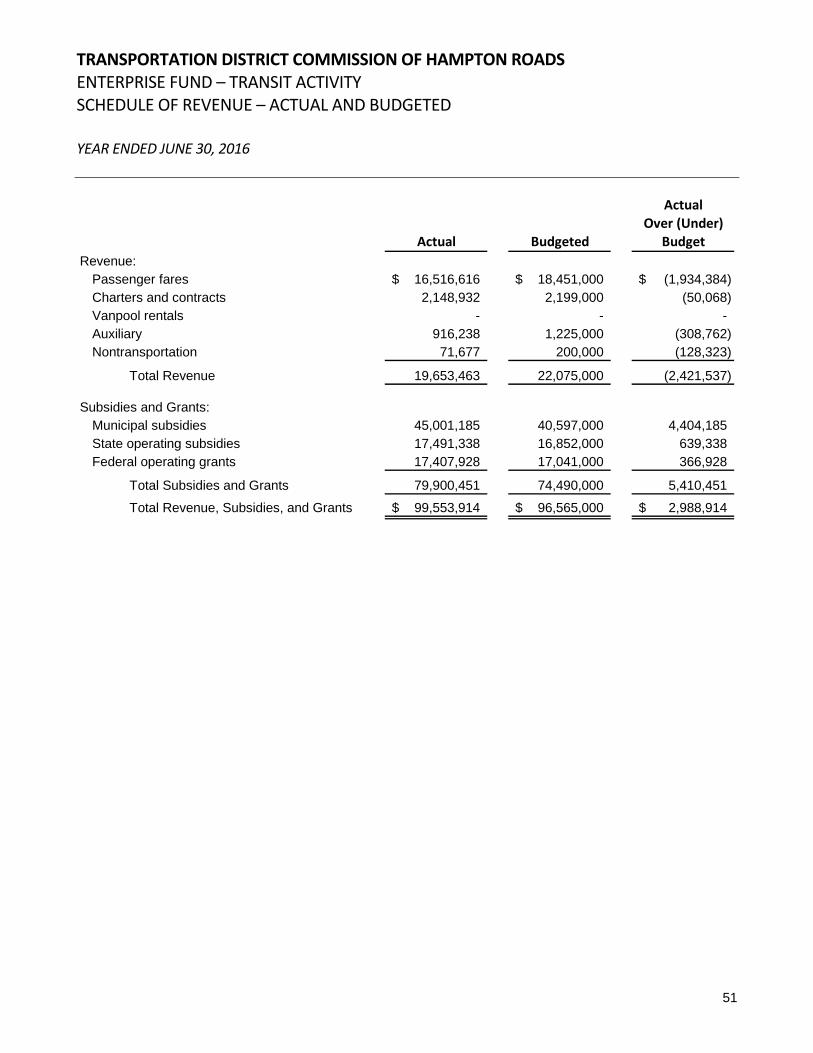
TRANSPORTATION DISTRICT COMMISSION OF HAMPTON ROADS ENTERPRISE FUND – TRANSIT ACTIVITY SCHEDULE OF REVENUE – ACTUAL AND BUDGETED YEAR ENDED JUNE 30, 2016
51
ActualOver (Under)
Actual Budgeted Budget
Revenue:Passenger fares 16,516,616$ 18,451,000$ (1,934,384)$ Charters and contracts 2,148,932 2,199,000 (50,068) Vanpool rentals - - - Auxiliary 916,238 1,225,000 (308,762) Nontransportation 71,677 200,000 (128,323)
Total Revenue 19,653,463 22,075,000 (2,421,537)
Subsidies and Grants:Municipal subsidies 45,001,185 40,597,000 4,404,185 State operating subsidies 17,491,338 16,852,000 639,338 Federal operating grants 17,407,928 17,041,000 366,928
Total Subsidies and Grants 79,900,451 74,490,000 5,410,451
Total Revenue, Subsidies, and Grants 99,553,914$ 96,565,000$ 2,988,914$
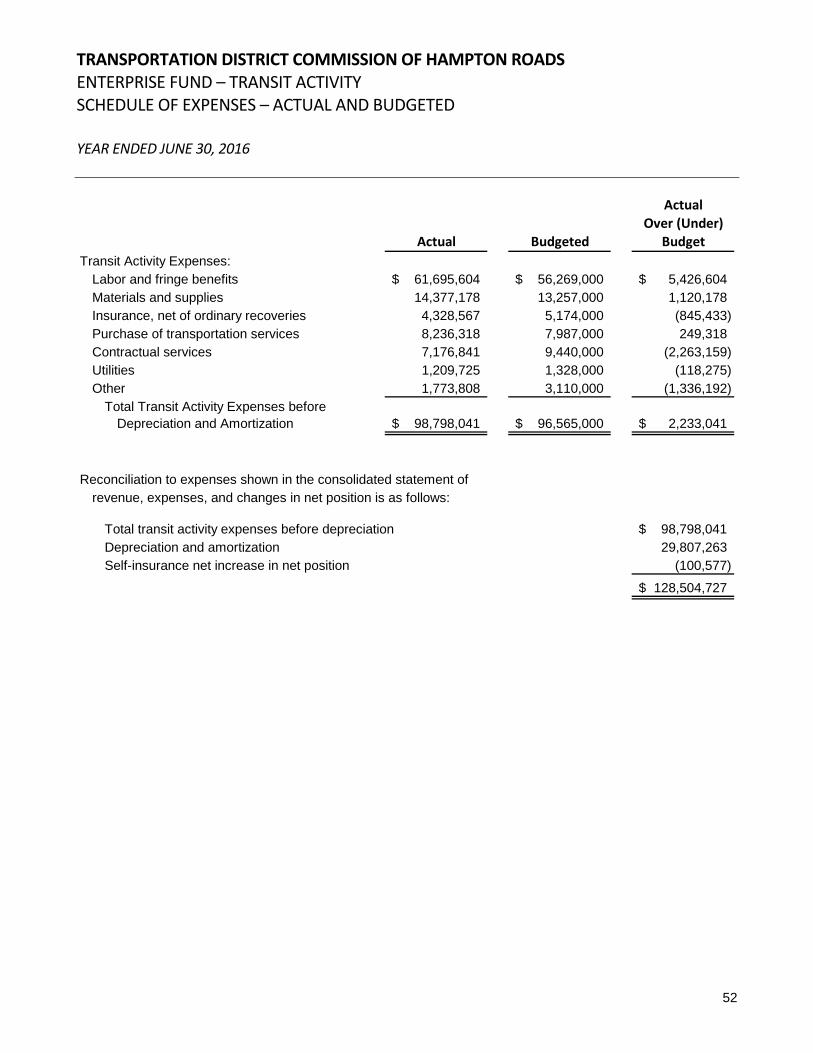
TRANSPORTATION DISTRICT COMMISSION OF HAMPTON ROADS ENTERPRISE FUND – TRANSIT ACTIVITY SCHEDULE OF EXPENSES – ACTUAL AND BUDGETED YEAR ENDED JUNE 30, 2016
52
ActualOver (Under)
Actual Budgeted Budget
Transit Activity Expenses:Labor and fringe benefits 61,695,604$ 56,269,000$ 5,426,604$ Materials and supplies 14,377,178 13,257,000 1,120,178 Insurance, net of ordinary recoveries 4,328,567 5,174,000 (845,433) Purchase of transportation services 8,236,318 7,987,000 249,318 Contractual services 7,176,841 9,440,000 (2,263,159) Utilities 1,209,725 1,328,000 (118,275) Other 1,773,808 3,110,000 (1,336,192)
Total Transit Activity Expenses beforeDepreciation and Amortization 98,798,041$ 96,565,000$ 2,233,041$
Reconciliation to expenses shown in the consolidated statement of revenue, expenses, and changes in net position is as follows:
Total transit activity expenses before depreciation 98,798,041$ Depreciation and amortization 29,807,263 Self-insurance net increase in net position (100,577)
128,504,727$
STATISTICAL SECTION
The following section of Transportation District Commission of Hampton Roads’ Annual Financial Report provides detailed statistical information as a context for understanding what the information in the financial statements, note disclosures, and required supplementary information says about HRT’s overall financial health. Contents Table Financial Trends I
This table contains trend information to help the reader understand how HRT’s financial performance and well-being have changed over time.
Demographic and Operating Information II - III
These tables contain service and infrastructure data to help the reader understand how the information in HRT’s financial report relates to the services it provides and the activities it performs.

TRANSPORTATION DISTRICT COMMISSION OF HAMPTON ROADS Table I NET POSITION AND CHANGES IN NET POSITION LAST TEN FISCAL YEARS
53
As Restated2016 2015 2014 2013 2012 2011 2010 2009 2008 2007
Operating Revenue:
Passenger fares 16,516,616$ 17,058,634$ 16,847,734$ 15,059,102$ 16,563,517$ 15,329,690$ 14,751,980$ 16,953,602$ 15,671,379$ 15,389,194$
Charters and contracts 2,148,932 2,790,843 175,422 18 13,742 19,200 76,800 125,905 48,872 69,046
Vanpool rentals - 99,010 128,864 177,911 170,138 174,831 177,058 168,817 144,734 129,519
Auxiliary 916,238 1,166,888 914,629 1,005,820 731,827 291,817 269,226 276,053 370,495 315,411
Nontransportation 71,677 189,307 197,249 184,424 189,229 338,116 266,398 150,813 128,050 120,963
Total Operating Revenue 19,653,463 21,304,682 18,263,898 16,427,275 17,668,453 16,153,654 15,541,462 17,675,190 16,363,530 16,024,133
Operating Expenses:
Labor 47,684,198 39,565,925 38,365,599 37,029,933 36,459,948 31,358,906 30,574,713 29,165,179 26,477,853 25,589,158
Fringe benefits 14,011,406 18,679,778 17,881,389 15,935,969 15,919,415 14,841,910 14,947,924 13,955,007 13,197,440 12,066,929
Depreciation and amortization 29,807,263 28,913,830 28,280,028 30,582,193 23,535,796 10,561,359 11,956,938 10,607,127 10,153,014 7,253,593
Materials and supplies 14,377,178 15,355,599 14,419,137 14,079,082 14,309,506 12,123,871 11,370,908 14,554,686 11,790,604 11,282,036
Purchase of transportation services 8,236,318 8,364,927 8,664,786 8,320,274 8,084,487 8,229,824 7,317,820 6,700,651 5,981,429 5,673,287
Contractual services 7,176,841 7,212,163 6,328,661 5,765,101 5,665,506 4,997,821 4,485,524 3,806,872 3,377,753 3,716,817
Insurance - net of ordinary recoveries 4,227,990 4,860,863 3,469,574 4,308,865 7,196,743 3,274,247 3,765,591 3,490,501 2,989,774 2,789,248
Utilities 1,209,725 1,242,038 1,402,569 1,361,074 1,312,737 736,784 678,685 790,534 720,958 721,895
Other 1,773,808 2,315,819 1,001,624 1,285,981 1,083,639 960,543 669,995 1,504,933 1,574,515 922,095
Total Operating Expenses 128,504,727 126,510,942 119,813,367 118,668,472 113,567,777 87,085,265 85,768,098 84,575,490 76,263,340 70,015,058
Operating loss before subsidies
and grants (108,851,264) (105,206,260) (101,549,469) (102,241,197) (95,899,324) (70,931,611) (70,226,636) (66,900,300) (59,899,810) (53,990,925)
Subsidies and grants 79,900,451 80,140,500 74,907,981 71,304,102 71,066,933 60,555,809 58,020,430 57,263,369 50,394,765 45,859,566
Operating loss before other income
(expenses) (28,950,813) (25,065,760) (26,641,488) (30,937,095) (24,832,391) (10,375,802) (12,206,206) (9,636,931) (9,505,045) (8,131,359)
Other Income (Expenses):
Interest income 12,536 2,840 2,079 4,760 3,109 11,460 13,535 83,469 406,255 759,618
Interest expense (516,644) (538,750) (539,967) (631,645) (702,559) (725,536) (911,415) (877,316) (846,964) (809,095)
Pension benefit (expense) (96,529) 1,180,335 - - - - - - - -
Gain (loss) on sale of capital assets 1,497,602 (56,954) (8,313) 25,093 84,969 165,079 78,881 (205,541) 83,910 40,367
Noncapitalized grant expenditures (15,976,572) (7,747,825) (10,201,366) (7,802,976) (11,313,086) (11,680,362) (7,210,393) (7,966,713) (9,576,307) (10,732,282)
Total Other Income (Expenses) (15,079,607) (7,160,354) (10,747,567) (8,404,768) (11,927,567) (12,229,359) (8,029,392) (8,966,101) (9,933,106) (10,741,392)
Loss before proceeds from capital grants (44,030,420) (32,226,114) (37,389,055) (39,341,863) (36,759,958) (22,605,161) (20,235,598) (18,603,032) (19,438,151) (18,872,751)
Proceeds from capital grants 45,398,865 19,936,757 17,805,078 15,764,870 44,962,979 111,771,158 115,595,814 122,492,587 55,013,712 15,020,925
Change in net position 1,368,445 (12,289,357) (19,583,977) (23,576,993) 8,203,021 89,165,997 95,360,216 103,889,555 35,575,561 (3,851,826)
Prior period adjustment - - (4,588,220) - - - - - - -
Net position, beginning of year 312,148,353 324,437,710 348,609,907 372,186,900 363,983,879 274,817,882 179,457,666 75,568,111 39,992,550 43,844,376
Net position, end of year 313,516,798$ 312,148,353$ 324,437,710$ 348,609,907$ 372,186,900$ 363,983,879$ 274,817,882$ 179,457,666$ 75,568,111$ 39,992,550$
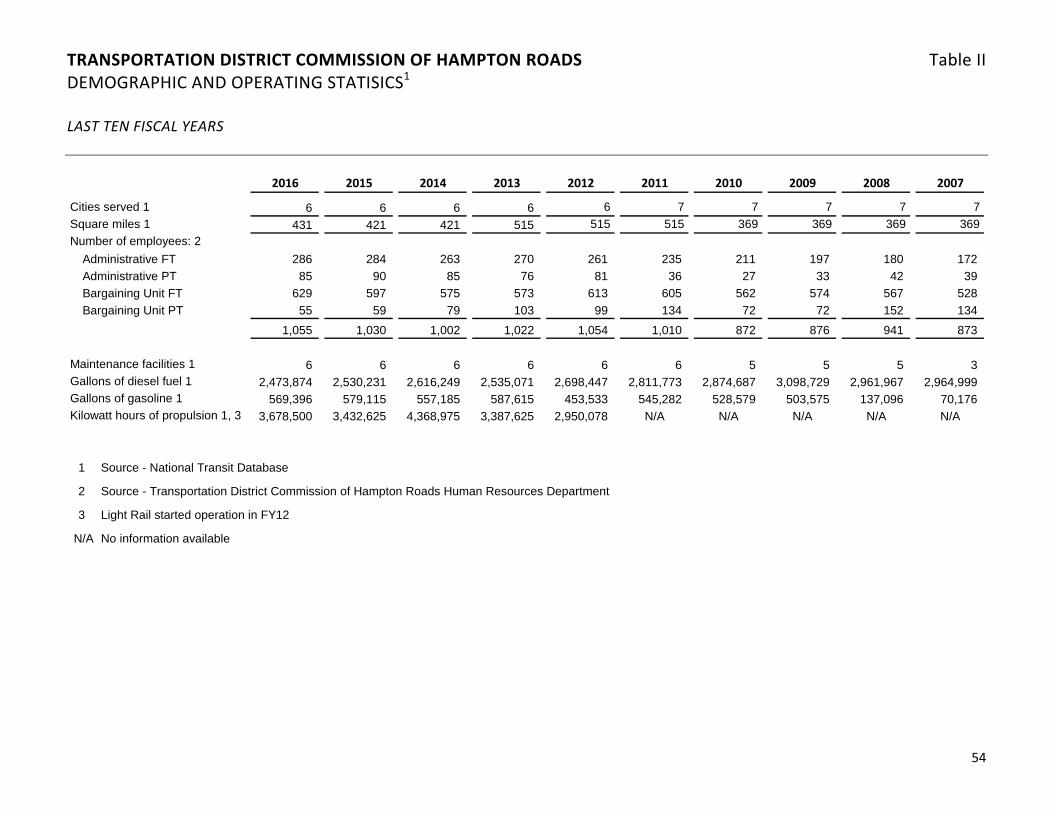
TRANSPORTATION DISTRICT COMMISSION OF HAMPTON ROADS Table II DEMOGRAPHIC AND OPERATING STATISICS1
LAST TEN FISCAL YEARS
54
2016 2015 2014 2013 2012 2011 2010 2009 2008 2007
Cities served 1 6 6 6 6 6 7 7 7 7 7
Square miles 1 431 421 421 515 515 515 369 369 369 369
Number of employees: 2
Administrative FT 286 284 263 270 261 235 211 197 180 172
Administrative PT 85 90 85 76 81 36 27 33 42 39
Bargaining Unit FT 629 597 575 573 613 605 562 574 567 528
Bargaining Unit PT 55 59 79 103 99 134 72 72 152 134
1,055 1,030 1,002 1,022 1,054 1,010 872 876 941 873
Maintenance facilities 1 6 6 6 6 6 6 5 5 5 3 Gallons of diesel fuel 1 2,473,874 2,530,231 2,616,249 2,535,071 2,698,447 2,811,773 2,874,687 3,098,729 2,961,967 2,964,999 Gallons of gasoline 1 569,396 579,115 557,185 587,615 453,533 545,282 528,579 503,575 137,096 70,176 Kilowatt hours of propulsion 1, 3 3,678,500 3,432,625 4,368,975 3,387,625 2,950,078 N/A N/A N/A N/A N/A
1 Source - National Transit Database
2 Source - Transportation District Commission of Hampton Roads Human Resources Department
3 Light Rail started operation in FY12
N/A No information available
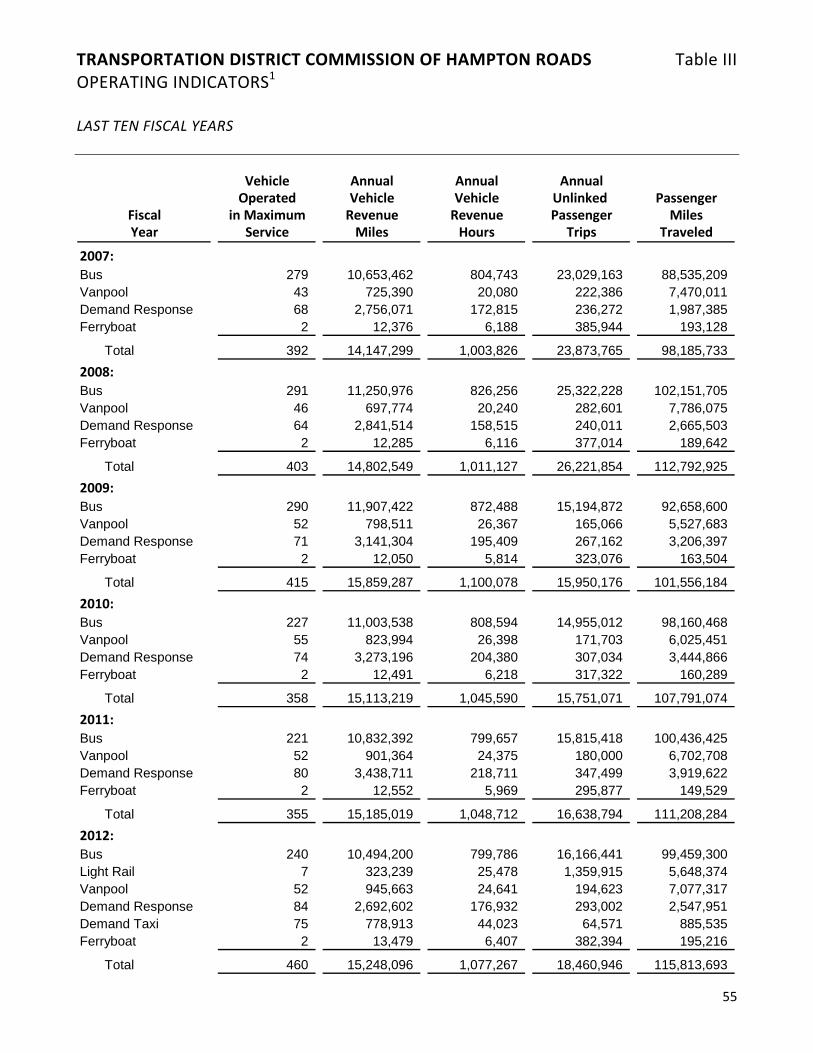
TRANSPORTATION DISTRICT COMMISSION OF HAMPTON ROADS Table III OPERATING INDICATORS1
LAST TEN FISCAL YEARS
55
Vehicle Annual Annual AnnualOperated Vehicle Vehicle Unlinked Passenger
in Maximum Revenue Revenue Passenger MilesService Miles Hours Trips Traveled
2007:
Bus 279 10,653,462 804,743 23,029,163 88,535,209 Vanpool 43 725,390 20,080 222,386 7,470,011 Demand Response 68 2,756,071 172,815 236,272 1,987,385 Ferryboat 2 12,376 6,188 385,944 193,128
Total 392 14,147,299 1,003,826 23,873,765 98,185,733
2008:
Bus 291 11,250,976 826,256 25,322,228 102,151,705 Vanpool 46 697,774 20,240 282,601 7,786,075 Demand Response 64 2,841,514 158,515 240,011 2,665,503 Ferryboat 2 12,285 6,116 377,014 189,642
Total 403 14,802,549 1,011,127 26,221,854 112,792,925
2009:
Bus 290 11,907,422 872,488 15,194,872 92,658,600 Vanpool 52 798,511 26,367 165,066 5,527,683 Demand Response 71 3,141,304 195,409 267,162 3,206,397 Ferryboat 2 12,050 5,814 323,076 163,504
Total 415 15,859,287 1,100,078 15,950,176 101,556,184
2010:
Bus 227 11,003,538 808,594 14,955,012 98,160,468 Vanpool 55 823,994 26,398 171,703 6,025,451 Demand Response 74 3,273,196 204,380 307,034 3,444,866 Ferryboat 2 12,491 6,218 317,322 160,289
Total 358 15,113,219 1,045,590 15,751,071 107,791,074
2011:
Bus 221 10,832,392 799,657 15,815,418 100,436,425 Vanpool 52 901,364 24,375 180,000 6,702,708 Demand Response 80 3,438,711 218,711 347,499 3,919,622 Ferryboat 2 12,552 5,969 295,877 149,529
Total 355 15,185,019 1,048,712 16,638,794 111,208,284
2012:
Bus 240 10,494,200 799,786 16,166,441 99,459,300 Light Rail 7 323,239 25,478 1,359,915 5,648,374 Vanpool 52 945,663 24,641 194,623 7,077,317 Demand Response 84 2,692,602 176,932 293,002 2,547,951 Demand Taxi 75 778,913 44,023 64,571 885,535 Ferryboat 2 13,479 6,407 382,394 195,216
Total 460 15,248,096 1,077,267 18,460,946 115,813,693
FiscalYear
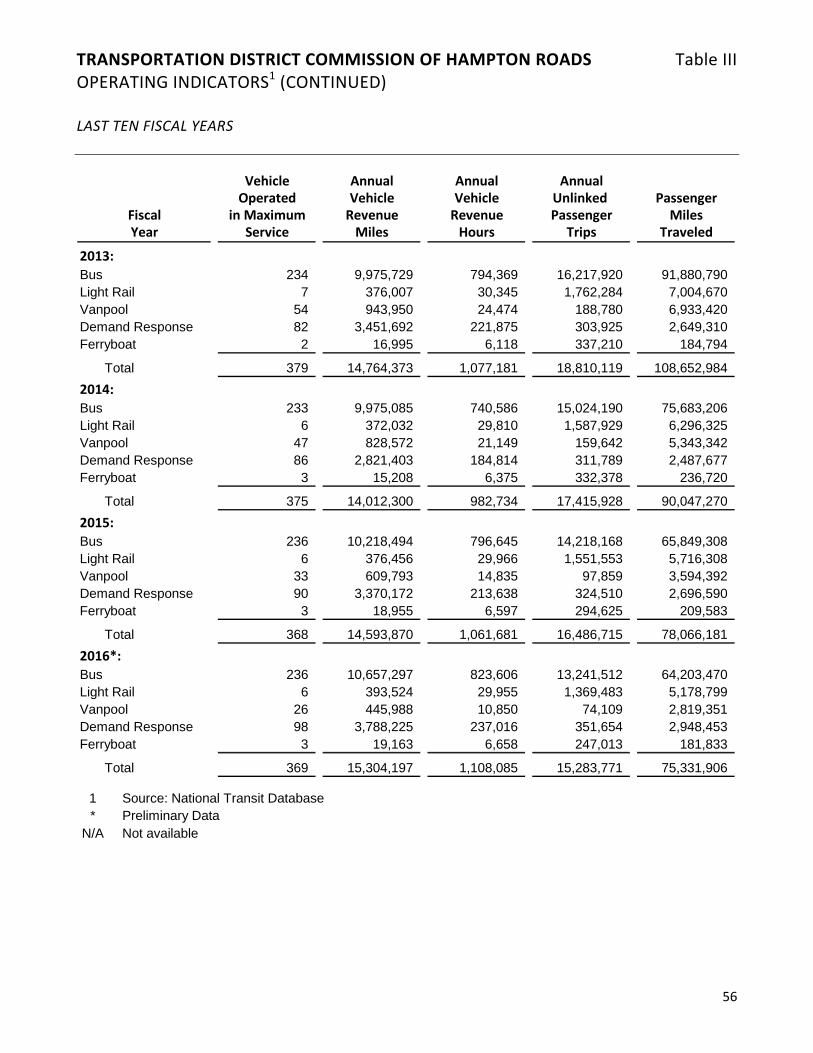
TRANSPORTATION DISTRICT COMMISSION OF HAMPTON ROADS Table III OPERATING INDICATORS1 (CONTINUED) LAST TEN FISCAL YEARS
56
Vehicle Annual Annual AnnualOperated Vehicle Vehicle Unlinked Passenger
in Maximum Revenue Revenue Passenger MilesService Miles Hours Trips Traveled
2013:
Bus 234 9,975,729 794,369 16,217,920 91,880,790 Light Rail 7 376,007 30,345 1,762,284 7,004,670 Vanpool 54 943,950 24,474 188,780 6,933,420 Demand Response 82 3,451,692 221,875 303,925 2,649,310 Ferryboat 2 16,995 6,118 337,210 184,794
Total 379 14,764,373 1,077,181 18,810,119 108,652,984
2014:
Bus 233 9,975,085 740,586 15,024,190 75,683,206 Light Rail 6 372,032 29,810 1,587,929 6,296,325 Vanpool 47 828,572 21,149 159,642 5,343,342 Demand Response 86 2,821,403 184,814 311,789 2,487,677 Ferryboat 3 15,208 6,375 332,378 236,720
Total 375 14,012,300 982,734 17,415,928 90,047,270
2015:
Bus 236 10,218,494 796,645 14,218,168 65,849,308 Light Rail 6 376,456 29,966 1,551,553 5,716,308 Vanpool 33 609,793 14,835 97,859 3,594,392 Demand Response 90 3,370,172 213,638 324,510 2,696,590 Ferryboat 3 18,955 6,597 294,625 209,583
Total 368 14,593,870 1,061,681 16,486,715 78,066,181
2016*:
Bus 236 10,657,297 823,606 13,241,512 64,203,470 Light Rail 6 393,524 29,955 1,369,483 5,178,799 Vanpool 26 445,988 10,850 74,109 2,819,351 Demand Response 98 3,788,225 237,016 351,654 2,948,453 Ferryboat 3 19,163 6,658 247,013 181,833
Total 369 15,304,197 1,108,085 15,283,771 75,331,906
1 Source: National Transit Database* Preliminary Data
N/A Not available
FiscalYear

COMPLIANCE SECTION
57
Report of Independent Auditor on Internal Control over Financial Reporting and on Compliance and Other Matters Based on an Audit of Financial Statements
Performed in Accordance with Government Auditing Standards Commissioners Transportation District Commission of Hampton Roads Hampton Roads We have audited, in accordance with the auditing standards generally accepted in the United States of America and the standards applicable to the financial audits contained in Government Auditing Standards issued by the Comptroller General of the United States and the Specifications for Audits of Authorities, Boards, and Commissions, issued by the Auditor of Public Accounts of the Commonwealth of Virginia, the financial statements of the Transportation District Commission of Hampton Roads (“Commission”) as of and for the year ended June 30, 2016, and the related notes to the financial statements, which collectively comprise the Commission’s basic financial statements and have issued our report thereon dated December 14, 2016. Internal Control over Financial Reporting In planning and performing our audit of the financial statements, we considered the Commission’s internal control over financial reporting (“internal control”) to determine the audit procedures that are appropriate in the circumstances for the purpose of expressing our opinion on the financial statements, but not for the purpose of expressing an opinion on the effectiveness of the Commission’s internal control. Accordingly, we do not express an opinion on the effectiveness of the Commission’s internal control. A deficiency in internal control exists when the design or operation of a control does not allow management or employees, in the normal course of performing their assigned functions, to prevent, or detect and correct, misstatements on a timely basis. A material weakness is a deficiency, or a combination of deficiencies, in internal control such that there is a reasonable possibility that a material misstatement of the entity’s financial statements will not be prevented, or detected and corrected, on a timely basis. A significant deficiency is a deficiency, or a combination of deficiencies, in internal control that is less severe than a material weakness, yet important enough to merit attention by those charged with governance. Our consideration of internal control was for the limited purpose described in the first paragraph of this section and was not designed to identify all deficiencies in internal control that might be significant deficiencies or material weaknesses. Given these limitations, during our audit we did not identify any deficiencies in internal control that we consider to be material weaknesses. However, material weaknesses may exist that have not been identified. Compliance and Other Matters As part of obtaining reasonable assurance about whether the Commission’s financial statements are free of material misstatement, we performed tests of its compliance with certain provisions of laws, regulations, contracts, and grant agreements, noncompliance with which could have a direct and material effect on the determination of financial statement amounts. However, providing an opinion on compliance with those provisions was not an objective of our audit and, accordingly, we do not express such an opinion. The results of our tests disclosed no instances of noncompliance or other matters that are required to be reported under Government Auditing Standards.
58
Purpose of this Report The purpose of this report is solely to describe the scope of our testing of internal control and compliance and the results of that testing, and not to provide an opinion on the effectiveness of the entity’s internal control or on compliance. This report is an integral part of an audit performed in accordance with Government Auditing Standards in considering the entity’s internal control and compliance. Accordingly, this communication is not suitable for any other purpose.
Virginia Beach, Virginia December 14, 2016

59
Report of Independent Auditor on Compliance for Each Major Program and on Internal Control over Compliance Required by
the Uniform Guidance Commissioners Transportation District Commission of Hampton Roads Hampton, Virginia Report on Compliance for Each Major Federal Program We have audited the Transportation District Commission of Hampton Roads’ (“commission”) compliance with the types of compliance requirements described in the OMB Compliance Supplement that could have a direct and material effect on each of the Commission major federal programs for the year ended June 30, 2016. The Commission’s major federal programs are identified in the summary of auditor's results section of the accompanying schedule of findings and questioned costs. Management’s Responsibility Management is responsible for compliance with the requirements of laws, regulations, contracts, and grants applicable to each of its major federal programs. Auditor’s Responsibility Our responsibility is to express an opinion on compliance for each of Commission’s major federal programs based on our audit of the types of compliance requirements referred to above. We conducted our audit of compliance in accordance with auditing standards generally accepted in the United States of America; the standards applicable to financial audits contained in Government Auditing Standards, issued by the Comptroller General of the United States; and the audit requirements of Title 2 U.S. Code of Federal Regulations Part 200, Uniform Administrative Requirements, Cost Principles, and Audit Requirements for Federal Awards (“Uniform Guidance”). Those standards and the Uniform Guidance require that we plan and perform the audit to obtain reasonable assurance about whether noncompliance with the types of compliance requirements referred to above that could have a direct and material effect on a major federal program occurred. An audit includes examining, on a test basis, evidence about the Commission’s compliance with those requirements and performing such other procedures, as we considered necessary in the circumstances. We believe that our audit provides a reasonable basis for our opinion on compliance for each major federal program. However, our audit does not provide a legal determination on the Commission’s compliance. Opinion on Each Major Federal Program In our opinion, the Commission complied, in all material respects, with the types of compliance requirements referred to above that could have a direct and material effect on each of its major federal programs for the year ended June 30, 2016.
60
Report on Internal Control over Compliance Management of the Commission is responsible for establishing and maintaining effective internal control over compliance with the types of compliance requirements referred to above. In planning and performing our audit of compliance, we considered the Commission’s internal control over compliance with the types of requirements that could have a direct and material effect on a major federal program to determine the auditing procedures that are appropriate in the circumstances for the purpose of expressing an opinion on compliance for each major federal program and to test and report on internal control over compliance in accordance with the Uniform Guidance, but not for the purpose of expressing an opinion on the effectiveness of internal control over compliance. Accordingly, we do not express an opinion on the effectiveness of the Commission’s internal control over compliance. A deficiency in internal control over compliance exists when the design or operation of a control over compliance does not allow management or employees, in the normal course of performing their assigned functions, to prevent, or detect and correct, noncompliance with a type of compliance requirement of a federal program on a timely basis. A material weakness in internal control over compliance is a deficiency, or combination of deficiencies, in internal control over compliance, such that there is a reasonable possibility that material noncompliance with a type of compliance requirement of a federal program will not be prevented, or detected and corrected, on a timely basis. A significant deficiency in internal control over compliance is a deficiency, or a combination of deficiencies, in internal control over compliance with a type of compliance requirement of a federal program that is less severe than a material weakness in internal control over compliance, yet important enough to merit attention by those charged with governance. Our consideration of internal control over compliance was for the limited purpose described in the first paragraph of this section and was not designed to identify all deficiencies in internal control over compliance that might be material weaknesses or significant deficiencies. We did not identify any deficiencies in internal control over compliance that we consider to be material weaknesses. However, material weaknesses may exist that have not been identified. The purpose of this report on internal control over compliance is solely to describe the scope of our testing of internal control over compliance and the results of that testing based on the requirements of the Uniform Guidance. Accordingly, this report is not suitable for any other purpose.
Virginia Beach, Virginia December 14, 2016

TRANSPORTATION DISTRICT COMMISSION OF HAMPTON ROADS SCHEDULE OF EXPENDITURES OF FEDERAL AWARDS YEAR ENDED JUNE 30, 2016
61
Federal
Federal Granting Agency/Recipient State Catalog Total
Agency/Grant Number Grant Program Year Number Expenditures
Department of TransportationDirect Payments
Federal Transit Administration Capital Improvements Grants:VA 04-0050 Southside Facility Project - Admin. Bldg. 2011 20.500 103,042$ VA 04-0058 FY12 SGR-Paratransit Vans and TAM 2014 20.500 207,990 VA 04-0060 Passenger Shelters-Livability Grant 2014 20.500 207,712 VA-05-0049 FY12 5309 Fixed Guideway 2015 20.500 91,842 VA 20-X001 VB Transit in Park Grant 2014 20.520 332,023
942,609 Federal Transit Administration Formula Grants:
VA-90-X250 FY15&16 Partial 5307 and CMAQ grant-PM and TRAFFIX 2016 20.507 13,515,204 VA-90-X359 FY 2010 5307 Capital Grant 2016 20.507 13,209 VA-90-X369 5307 Capital Grant 2011 20.507 95,661 VA-90-X381 FY 2012 Partial Apportionment-PM 2012 20.507 67,670 VA-90-X410 FY14 5307 Partial 2014 20.507 742,772 VA-90-X430 FY 2015 5307 Partial 2015 20.507 20,233 VA-95-X014 FY09-10 Flex Funds - Capital/Oper 2013 20.507 6,901 VA-95-X063 Hampton Facility, VBTES, NSNTE 2014 20.507 274,599 VA-95-X081 Chesapeake Shelter Project 2015 20.507 2,506 VA-95-X097 FY 12 RSTP-Transit Stop Resigning Pr 2016 20.507 253,144 VA-95-X119 Bus Purchase and TRAFFIX-RSTP/CMA 2015 20.507 10,811,969 VA-95-X141 VBTES RSTP 2015 20.507 4,898,224 VA-95-X162 LRT Operating Assistance 2016 20.507 156,056 VA-95-X163 VBTE ROW 2016 20.507 4,000,000 VA-96-X003 $0 Amendment-Add Operating 2014 20.507 59,338
34,917,486 Federal Transit Administration State of Good Repair Grants Program
VA-54-X001 FY 2013-2015 Section 5337 PM 2016 20.525 2,542,867 2,542,867
Federal Transit Administration Bus and Bus Facilities Formula Program
VA-34-0004 FY13 and 14 Section 5339 for Vehic 2015 20.526 1,119,504 VA-34-0008 FY15&16 Partial 5307 and CMAQ grant-PM and TRAFFIX 2016 20.526 530,173
1,649,677
Subtotal - Federal Transit Cluster 40,052,639
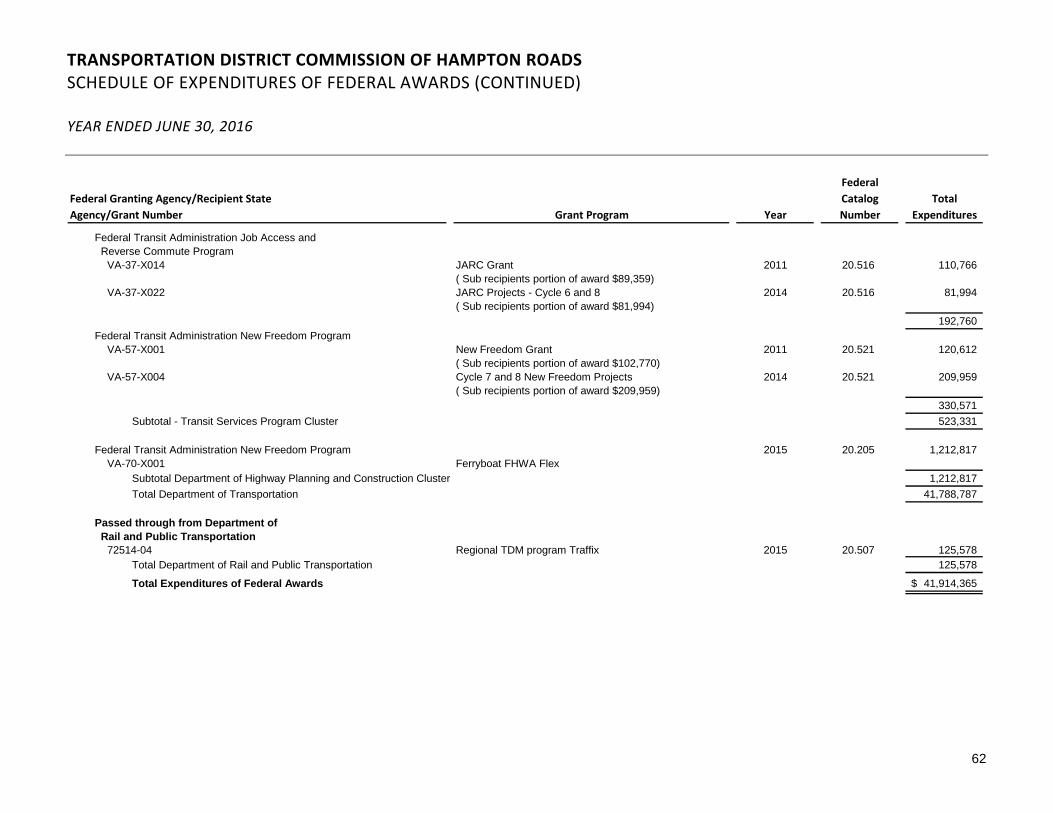
TRANSPORTATION DISTRICT COMMISSION OF HAMPTON ROADS SCHEDULE OF EXPENDITURES OF FEDERAL AWARDS (CONTINUED) YEAR ENDED JUNE 30, 2016
62
Federal
Federal Granting Agency/Recipient State Catalog Total
Agency/Grant Number Grant Program Year Number Expenditures
Federal Transit Administration Job Access and Reverse Commute Program
VA-37-X014 JARC Grant 2011 20.516 110,766 ( Sub recipients portion of award $89,359)
VA-37-X022 JARC Projects - Cycle 6 and 8 2014 20.516 81,994 ( Sub recipients portion of award $81,994)
192,760 Federal Transit Administration New Freedom Program
VA-57-X001 New Freedom Grant 2011 20.521 120,612 ( Sub recipients portion of award $102,770)
VA-57-X004 Cycle 7 and 8 New Freedom Projects 2014 20.521 209,959 ( Sub recipients portion of award $209,959)
330,571
Subtotal - Transit Services Program Cluster 523,331
Federal Transit Administration New Freedom Program 2015 20.205 1,212,817 VA-70-X001 Ferryboat FHWA Flex
Subtotal Department of Highway Planning and Construction Cluster 1,212,817
Total Department of Transportation 41,788,787
Passed through from Department of Rail and Public Transportation
72514-04 Regional TDM program Traffix 2015 20.507 125,578 Total Department of Rail and Public Transportation 125,578
Total Expenditures of Federal Awards 41,914,365$
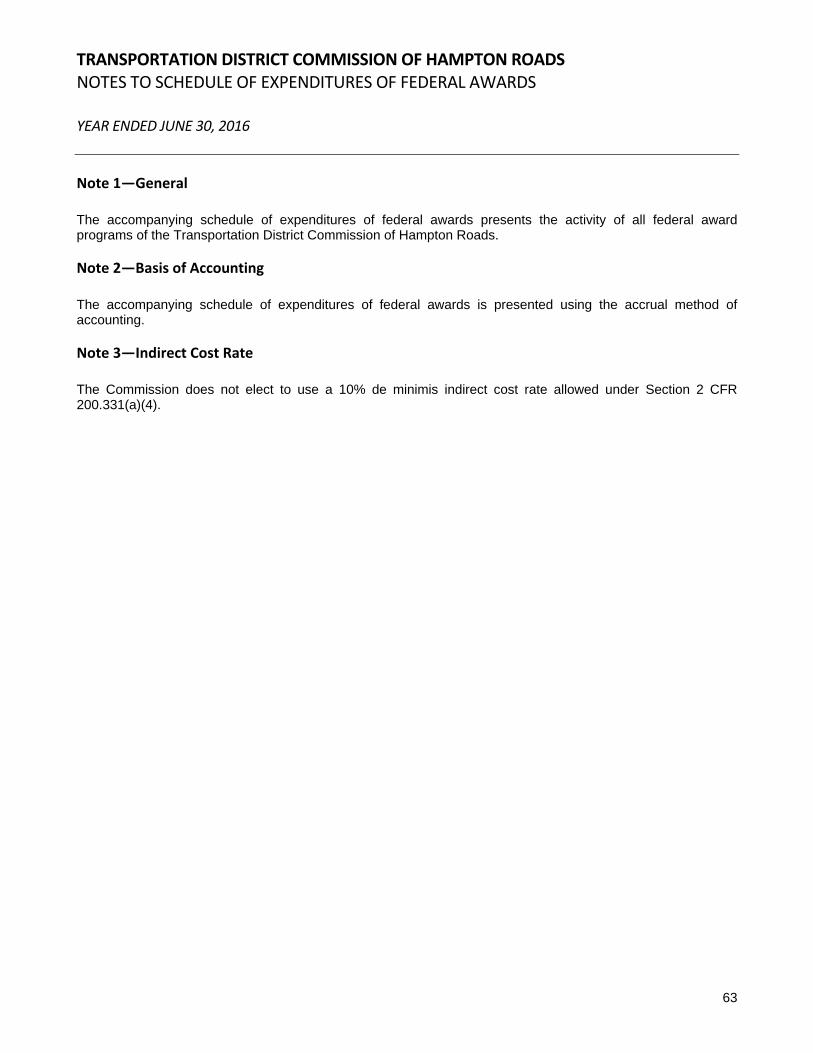
TRANSPORTATION DISTRICT COMMISSION OF HAMPTON ROADS NOTES TO SCHEDULE OF EXPENDITURES OF FEDERAL AWARDS YEAR ENDED JUNE 30, 2016
63
Note 1—General The accompanying schedule of expenditures of federal awards presents the activity of all federal award programs of the Transportation District Commission of Hampton Roads. Note 2—Basis of Accounting The accompanying schedule of expenditures of federal awards is presented using the accrual method of accounting. Note 3—Indirect Cost Rate The Commission does not elect to use a 10% de minimis indirect cost rate allowed under Section 2 CFR 200.331(a)(4).

TRANSPORTATION DISTRICT COMMISSION OF HAMPTON ROADS SCHEDULE OF FINDINGS AND QUESTIONED COSTS YEAR ENDED JUNE 30, 2016
64
A. Summary of Auditor’s Results
1. The type of report issued on the basic financial statements: Unmodified opinion
2. Significant deficiencies in internal control disclosed by the audit of the financial statements: None reported
3. Material weaknesses in internal control disclosed by the audit of financial statements: No
4. Noncompliance, which is material to the financial statements: No
5. Significant deficiencies in internal control over major programs: None reported
6. Material weaknesses in internal control over major programs: No
7. The type of report issued on compliance for major programs: Unmodified opinion
8. Any audit findings which are required to be reported under Uniform Grant Guidance: No
9. The programs tested as major programs were:
CFDA Number Name of Federal Program or Cluster
20.205-CL Highway Planning and Construction Cluster 20.500-CL Federal Transit Cluster
10. Dollar threshold used to distinguish between type A and type B programs: $1,257,430
11. Transportation District Commission of Hampton Roads qualified as a low-risk auditee under Uniform
Grant Guidance: Yes B. Findings Relating to the Financial Statements Reported in Accordance with Government Auditing
Standards: None reported.
C. Findings and Questioned Costs Relating to Federal Awards:
None reported.
D. Findings and Questioned Costs Relating to Compliance with Commonwealth of Virginia Laws, Regulations, Contracts, and Grants:
None reported.
TRANSPORTATION DISTRICT COMMISSION OF HAMPTON ROADS SCHEDULE OF PRIOR YEAR AUDIT FINDINGS AND CORRECTIVE ACTION PLAN YEAR ENDED JUNE 30, 2016
65
In‐Process Amount of Description of
Comment Description Corrected of Valid Questioned Action Taken
and Number Yes/No Correcting Yes/No Cost by Commission
There were no prior year audit findings.
Southside Administration/Maintenance Building509 East 18th Street, Norfolk, VA 23504
Northside Administration/Maintenance Building3400 Victoria Boulevard, Hampton, VA 23661
Norfolk Tide Facility1850 East Brambleton Avenue, Norfolk, VA 23504
Recommended