Bankmed - Market & Economic Research Division
AnAlysis of lebAnon’s Automobile Sector
SPECIAL REPORT
Analysis of lebanon’s Automobile sector - september 2015
Global Automobile Market 3
lebanon’s new Car sales 6
evolution of new Car sales 6
new Car sales by Places of origin 7
new Car sales by brand 9
lebanon’s Car imports 11
evolution of Car imports 11
Car imports by Countries of origin 12
Cars-Related Government Revenues 14
Conclusion 15
2
Table of Contents
Bankmed - Market & Economic Research Division
SPECIAL REPORT
Analysis of lebanon’s Automobile sector - september 2015
3
GlobAl Automobile mArket
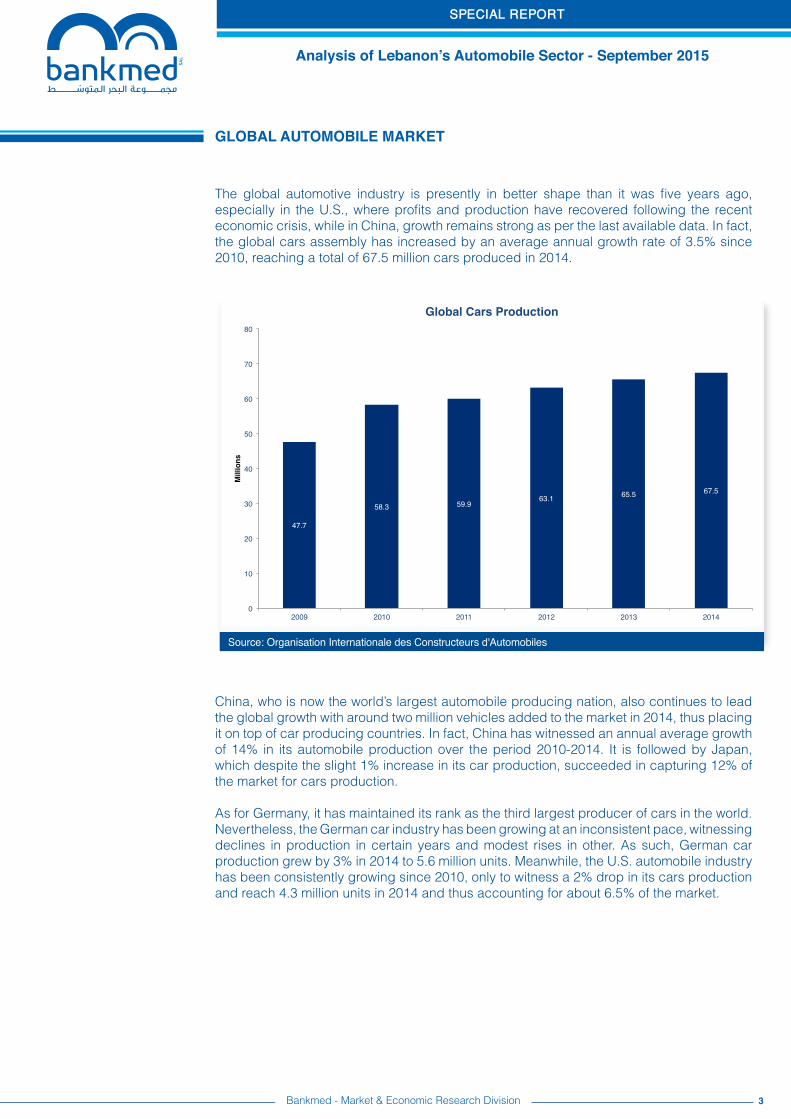
The global automotive industry is presently in better shape than it was five years ago, especially in the U.S., where profits and production have recovered following the recent economic crisis, while in China, growth remains strong as per the last available data. In fact, the global cars assembly has increased by an average annual growth rate of 3.5% since 2010, reaching a total of 67.5 million cars produced in 2014.
China, who is now the world’s largest automobile producing nation, also continues to lead the global growth with around two million vehicles added to the market in 2014, thus placing it on top of car producing countries. In fact, China has witnessed an annual average growth of 14% in its automobile production over the period 2010-2014. It is followed by Japan, which despite the slight 1% increase in its car production, succeeded in capturing 12% of the market for cars production.
As for Germany, it has maintained its rank as the third largest producer of cars in the world. Nevertheless, the German car industry has been growing at an inconsistent pace, witnessing declines in production in certain years and modest rises in other. As such, German car production grew by 3% in 2014 to 5.6 million units. Meanwhile, the U.S. automobile industry has been consistently growing since 2010, only to witness a 2% drop in its cars production and reach 4.3 million units in 2014 and thus accounting for about 6.5% of the market.
Bankmed - Market & Economic Research Division
Source: Organisation Internationale des Constructeurs d'Automobiles
47.7!
58.3! 59.9!63.1! 65.5! 67.5!
0!
10!
20!
30!
40!
50!
60!
70!
80!
2009! 2010! 2011! 2012! 2013! 2014!
Mill
ions!
Global Cars Production!
SPECIAL REPORT
Analysis of lebanon’s Automobile sector - september 2015
4
Source: Organisation Internationale des Constructeurs d'Automobiles
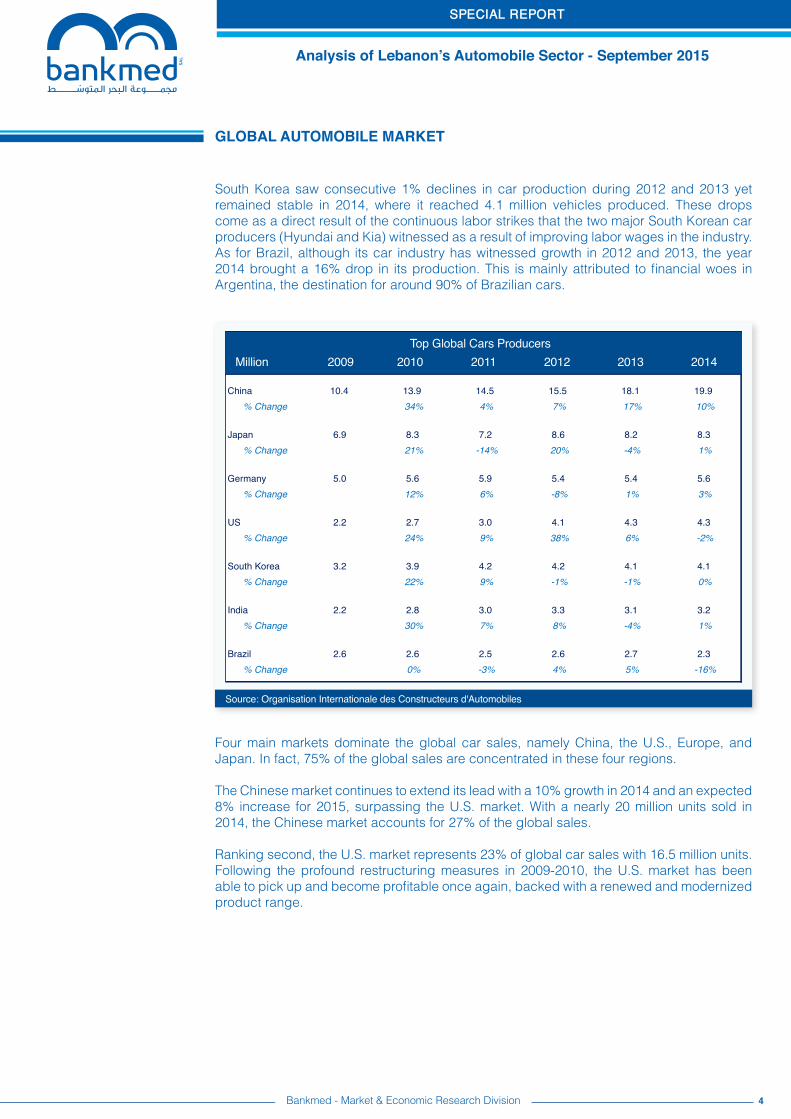
South Korea saw consecutive 1% declines in car production during 2012 and 2013 yet remained stable in 2014, where it reached 4.1 million vehicles produced. These drops come as a direct result of the continuous labor strikes that the two major South Korean car producers (Hyundai and Kia) witnessed as a result of improving labor wages in the industry. As for Brazil, although its car industry has witnessed growth in 2012 and 2013, the year 2014 brought a 16% drop in its production. This is mainly attributed to financial woes in Argentina, the destination for around 90% of Brazilian cars.
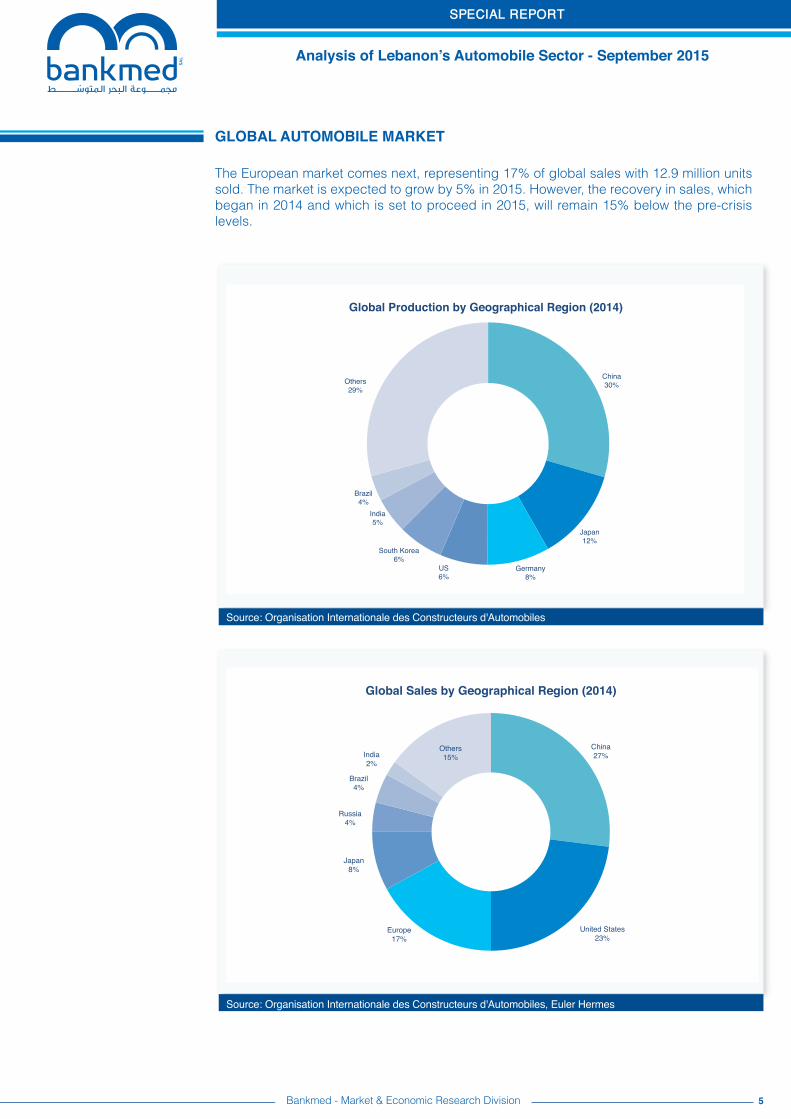
Four main markets dominate the global car sales, namely China, the U.S., Europe, and Japan. In fact, 75% of the global sales are concentrated in these four regions.
The Chinese market continues to extend its lead with a 10% growth in 2014 and an expected 8% increase for 2015, surpassing the U.S. market. With a nearly 20 million units sold in 2014, the Chinese market accounts for 27% of the global sales.
Ranking second, the U.S. market represents 23% of global car sales with 16.5 million units. Following the profound restructuring measures in 2009-2010, the U.S. market has been able to pick up and become profitable once again, backed with a renewed and modernized product range.
GlobAl Automobile mArket
Bankmed - Market & Economic Research Division
Million 2009 2010 2011 2012 2013 2014
China 10.4 13.9 14.5 15.5 18.1 19.9% Change 34% 4% 7% 17% 10%
Japan 6.9 8.3 7.2 8.6 8.2 8.3% Change 21% -14% 20% -4% 1%
Germany 5.0 5.6 5.9 5.4 5.4 5.6% Change 12% 6% -8% 1% 3%
US 2.2 2.7 3.0 4.1 4.3 4.3% Change 24% 9% 38% 6% -2%
South Korea 3.2 3.9 4.2 4.2 4.1 4.1% Change 22% 9% -1% -1% 0%
India 2.2 2.8 3.0 3.3 3.1 3.2% Change 30% 7% 8% -4% 1%
Brazil 2.6 2.6 2.5 2.6 2.7 2.3% Change 0% -3% 4% 5% -16%
Top Global Cars ProducersTop Global Cars ProducersMillion 2009 2010 2011 2012 2013 2014
SPECIAL REPORT
Analysis of lebanon’s Automobile sector - september 2015
5
Source: Organisation Internationale des Constructeurs d'Automobiles, Euler Hermes
Source: Organisation Internationale des Constructeurs d'Automobiles
The European market comes next, representing 17% of global sales with 12.9 million units sold. The market is expected to grow by 5% in 2015. However, the recovery in sales, which began in 2014 and which is set to proceed in 2015, will remain 15% below the pre-crisis levels.
GlobAl Automobile mArket
Bankmed - Market & Economic Research Division
China!30%!
Japan!12%!
Germany!8%!
US!6%!
South Korea!6%!
India!5%!
Brazil!4%!
Others!29%!
Global Production by Geographical Region (2014)!
China !27%!
United States!23%!
Europe!17%!
Japan!8%!
Russia!4%!
Brazil!4%!
India!2%!
Others!15%!
Global Sales by Geographical Region (2014)!!
SPECIAL REPORT
Analysis of lebanon’s Automobile sector - september 2015
6
Source: Automobile Importers Association
Evolution of New Car Sales
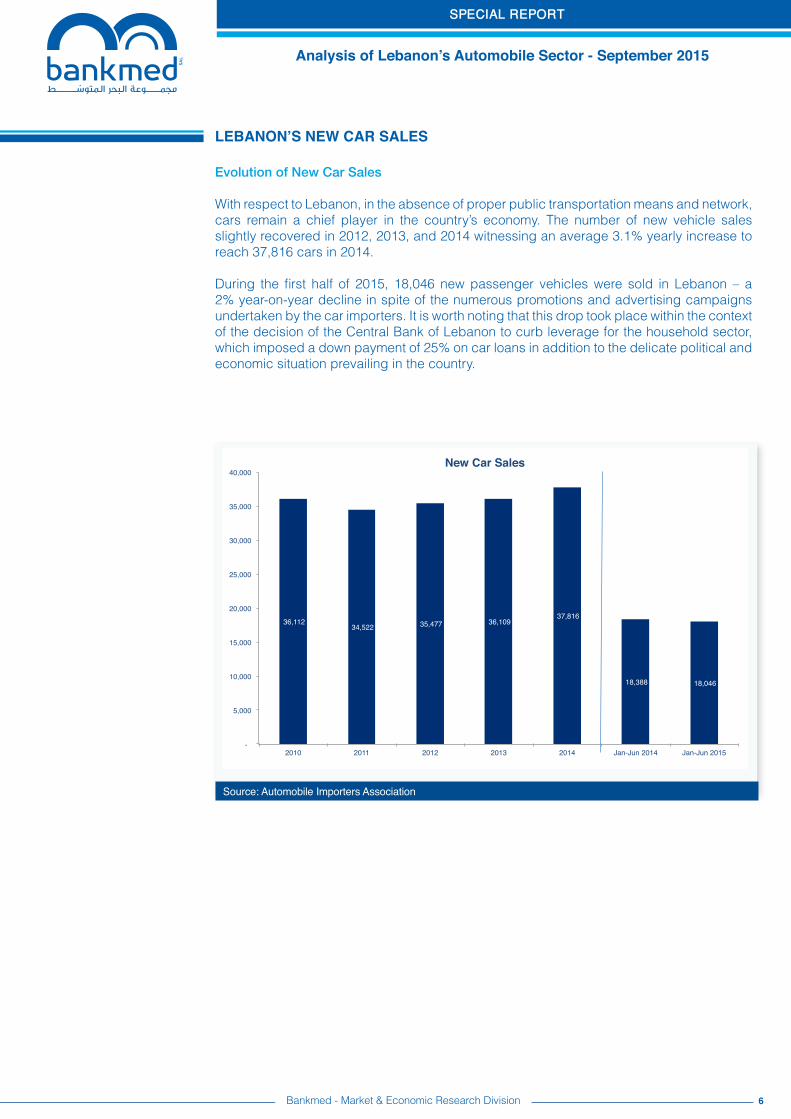
With respect to Lebanon, in the absence of proper public transportation means and network, cars remain a chief player in the country’s economy. The number of new vehicle sales slightly recovered in 2012, 2013, and 2014 witnessing an average 3.1% yearly increase to reach 37,816 cars in 2014.
During the first half of 2015, 18,046 new passenger vehicles were sold in Lebanon – a 2% year-on-year decline in spite of the numerous promotions and advertising campaigns undertaken by the car importers. It is worth noting that this drop took place within the context of the decision of the Central Bank of Lebanon to curb leverage for the household sector, which imposed a down payment of 25% on car loans in addition to the delicate political and economic situation prevailing in the country.
lebAnon’s new CAR sAles
Bankmed - Market & Economic Research Division
36,112 ! 34,522 ! 35,477 ! 36,109 !
37,816 !
18,388 ! 18,046 !
- !
5,000 !
10,000 !
15,000 !
20,000 !
25,000 !
30,000 !
35,000 !
40,000 !
2010! 2011! 2012! 2013! 2014! Jan-Jun 2014! Jan-Jun 2015!
New Car Sales!
SPECIAL REPORT
Analysis of lebanon’s Automobile sector - september 2015
7
Source: Automobile Importers Association
New Car Sales by Places of Origin
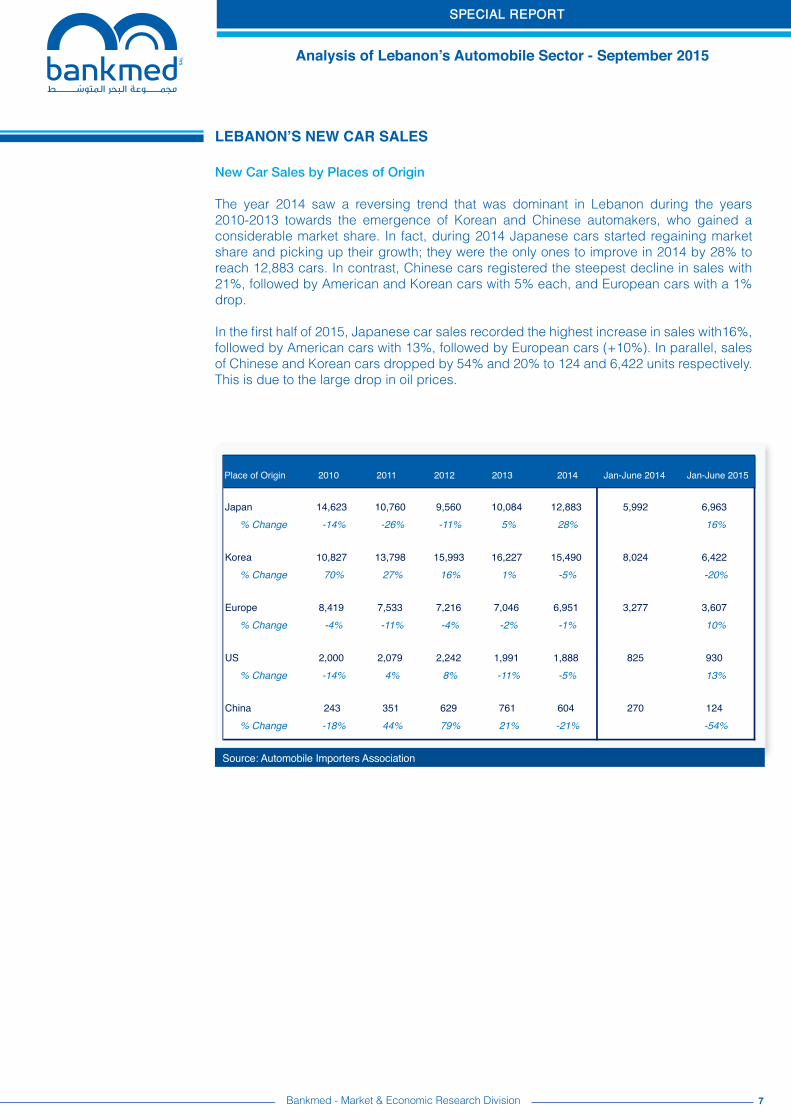
The year 2014 saw a reversing trend that was dominant in Lebanon during the years 2010-2013 towards the emergence of Korean and Chinese automakers, who gained a considerable market share. In fact, during 2014 Japanese cars started regaining market share and picking up their growth; they were the only ones to improve in 2014 by 28% to reach 12,883 cars. In contrast, Chinese cars registered the steepest decline in sales with 21%, followed by American and Korean cars with 5% each, and European cars with a 1% drop.
In the first half of 2015, Japanese car sales recorded the highest increase in sales with16%, followed by American cars with 13%, followed by European cars (+10%). In parallel, sales of Chinese and Korean cars dropped by 54% and 20% to 124 and 6,422 units respectively. This is due to the large drop in oil prices.
lebAnon’s new CAR sAles
Bankmed - Market & Economic Research Division
Place of Origin 2010 2011 2012 2013 2014 Jan-June 2014 Jan-June 2015
Japan 14,623 10,760 9,560 10,084 12,883 5,992 6,963% Change -14% -26% -11% 5% 28% 16%
Korea 10,827 13,798 15,993 16,227 15,490 8,024 6,422% Change 70% 27% 16% 1% -5% -20%
Europe 8,419 7,533 7,216 7,046 6,951 3,277 3,607% Change -4% -11% -4% -2% -1% 10%
US 2,000 2,079 2,242 1,991 1,888 825 930% Change -14% 4% 8% -11% -5% 13%
China 243 351 629 761 604 270 124% Change -18% 44% 79% 21% -21% -54%
Place of Origin 2010 2011 2012 2013 2014 Jan-June 2014 Jan-June 2015
SPECIAL REPORT
Analysis of lebanon’s Automobile sector - september 2015
8
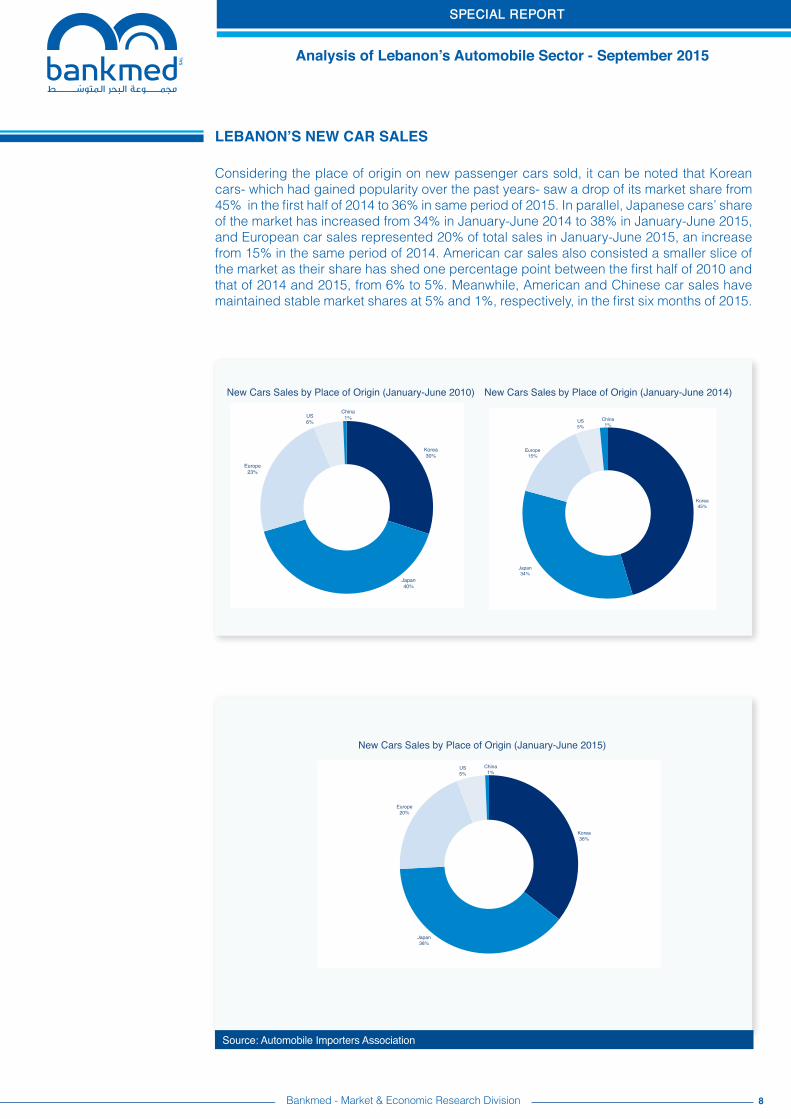
Considering the place of origin on new passenger cars sold, it can be noted that Korean cars- which had gained popularity over the past years- saw a drop of its market share from 45% in the first half of 2014 to 36% in same period of 2015. In parallel, Japanese cars’ share of the market has increased from 34% in January-June 2014 to 38% in January-June 2015, and European car sales represented 20% of total sales in January-June 2015, an increase from 15% in the same period of 2014. American car sales also consisted a smaller slice of the market as their share has shed one percentage point between the first half of 2010 and that of 2014 and 2015, from 6% to 5%. Meanwhile, American and Chinese car sales have maintained stable market shares at 5% and 1%, respectively, in the first six months of 2015.
Source: Automobile Importers Association
lebAnon’s new CAR sAles
Bankmed - Market & Economic Research Division
Korea!30%!
Japan!40%!
Europe!23%!
US!6%!
China!1%!
New Cars Sales by Place of Origin (January -June 2010)!New Cars Sales by Place of Origin (January-June 2010) New Cars Sales by Place of Origin (January-June 2014)
New Cars Sales by Place of Origin (January-June 2015)
Korea!45%!
Japan!34%!
Europe!15%!
US!5%!
China!1%!
Korea!36%!
Japan!38%!
Europe!20%!
US!5%!
China!1%!
SPECIAL REPORT
Analysis of lebanon’s Automobile sector - september 2015
9
lebAnon’s new CAR sAles
New Car Sales by Brand
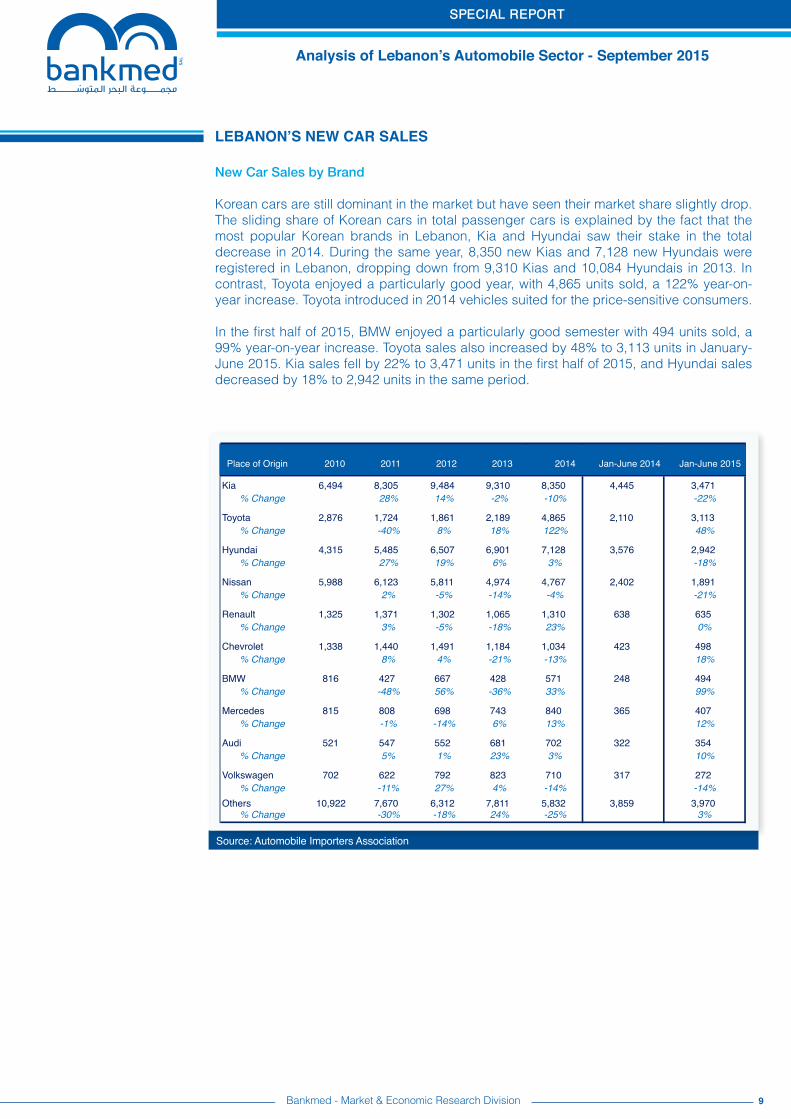
Korean cars are still dominant in the market but have seen their market share slightly drop. The sliding share of Korean cars in total passenger cars is explained by the fact that the most popular Korean brands in Lebanon, Kia and Hyundai saw their stake in the total decrease in 2014. During the same year, 8,350 new Kias and 7,128 new Hyundais were registered in Lebanon, dropping down from 9,310 Kias and 10,084 Hyundais in 2013. In contrast, Toyota enjoyed a particularly good year, with 4,865 units sold, a 122% year-on-year increase. Toyota introduced in 2014 vehicles suited for the price-sensitive consumers.
In the first half of 2015, BMW enjoyed a particularly good semester with 494 units sold, a 99% year-on-year increase. Toyota sales also increased by 48% to 3,113 units in January-June 2015. Kia sales fell by 22% to 3,471 units in the first half of 2015, and Hyundai sales decreased by 18% to 2,942 units in the same period.
Bankmed - Market & Economic Research Division
Source: Automobile Importers Association
Brand 2010 2011 2012 2013 2014 Jan-June 2014 Jan-June 2015
Kia 6,494 8,305 9,484 9,310 8,350 4,445 3,471% Change 28% 14% -2% -10% -22%
Toyota 2,876 1,724 1,861 2,189 4,865 2,110 3,113% Change -40% 8% 18% 122% 48%
Hyundai 4,315 5,485 6,507 6,901 7,128 3,576 2,942% Change 27% 19% 6% 3% -18%
Nissan 5,988 6,123 5,811 4,974 4,767 2,402 1,891% Change 2% -5% -14% -4% -21%
Renault 1,325 1,371 1,302 1,065 1,310 638 635% Change 3% -5% -18% 23% 0%
Chevrolet 1,338 1,440 1,491 1,184 1,034 423 498% Change 8% 4% -21% -13% 18%
BMW 816 427 667 428 571 248 494% Change -48% 56% -36% 33% 99%
Mercedes 815 808 698 743 840 365 407% Change -1% -14% 6% 13% 12%
Audi 521 547 552 681 702 322 354% Change 5% 1% 23% 3% 10%
Volkswagen 702 622 792 823 710 317 272% Change -11% 27% 4% -14% -14%
Others 10,922 7,670 6,312 7,811 5,832 3,859 3,970% Change -30% -18% 24% -25% 3%
Place of Origin 2010 2011 2012 2013 2014 Jan-June 2014 Jan-June 2015
SPECIAL REPORT
Analysis of lebanon’s Automobile sector - september 2015
10
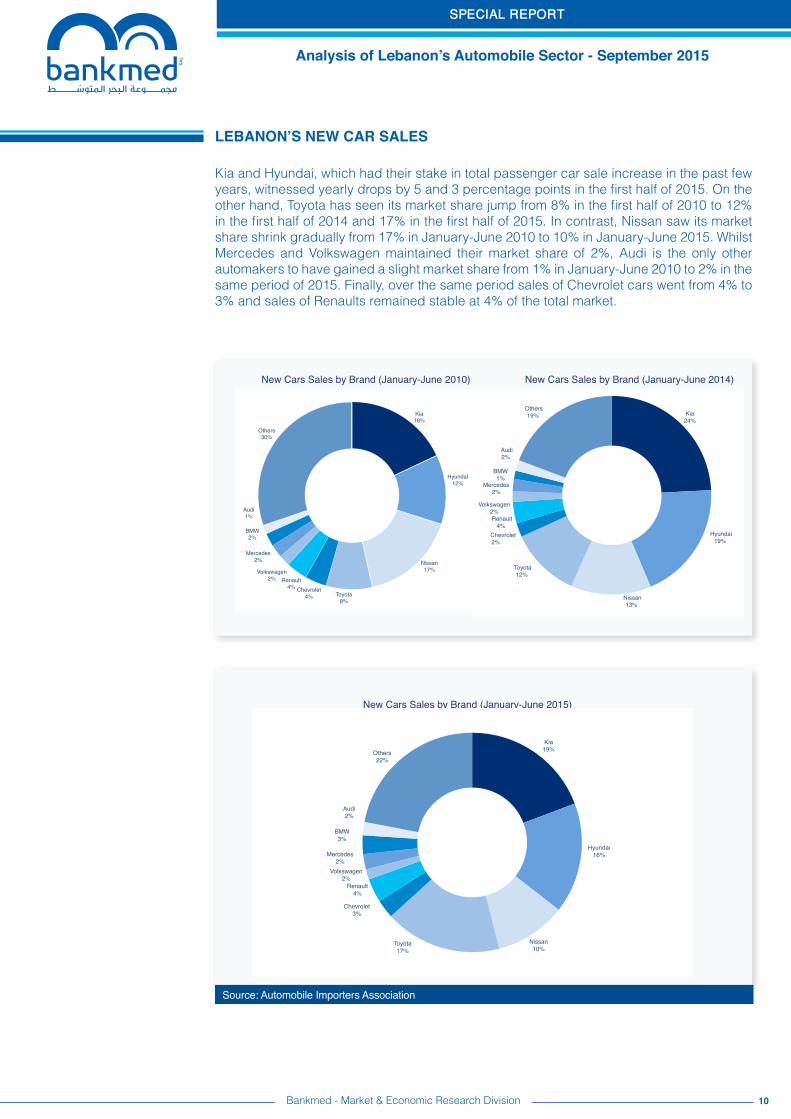
Kia and Hyundai, which had their stake in total passenger car sale increase in the past few years, witnessed yearly drops by 5 and 3 percentage points in the first half of 2015. On the other hand, Toyota has seen its market share jump from 8% in the first half of 2010 to 12% in the first half of 2014 and 17% in the first half of 2015. In contrast, Nissan saw its market share shrink gradually from 17% in January-June 2010 to 10% in January-June 2015. Whilst Mercedes and Volkswagen maintained their market share of 2%, Audi is the only other automakers to have gained a slight market share from 1% in January-June 2010 to 2% in the same period of 2015. Finally, over the same period sales of Chevrolet cars went from 4% to 3% and sales of Renaults remained stable at 4% of the total market.
lebAnon’s new CAR sAles
Bankmed - Market & Economic Research Division
Source: Automobile Importers Association
Kia!18%!
Hyundai!12%!
Nissan!17%!
Toyota!8%!
Chevrolet!4%!
Renault!4%!
Volkswagen!2%!
Mercedes!2%!
BMW!2%!
Audi!1%!
Others!30%!
New Cars Sales by Brand (January- June 2010)!
!Kia!24%!
Hyundai!19%!
Nissan!13%!
Toyota!12%!
!Chevrolet!2%!
Renault!4%!
!Volkswagen!
2%!
Mercedes!2%!
!BMW!1%!
Audi!2%!
Others!19%!
New Cars Sales by Brand (January- June 2014)!New Cars Sales by Brand (January-June 2014)New Cars Sales by Brand (January-June 2010)
New Cars Sales by Brand (January-June 2015)
Kia!19%!
Hyundai!16%!
Nissan!10%!
Toyota!17%!
Chevrolet!3%!
Renault!4%!
Volkswagen!2%!
Mercedes!2%!
BMW!3%!
Audi!2%!
Others!22%!
SPECIAL REPORT
Analysis of lebanon’s Automobile sector - september 2015
11
lebAnon’s CAR iMPoRTs
Evolution of Car Imports
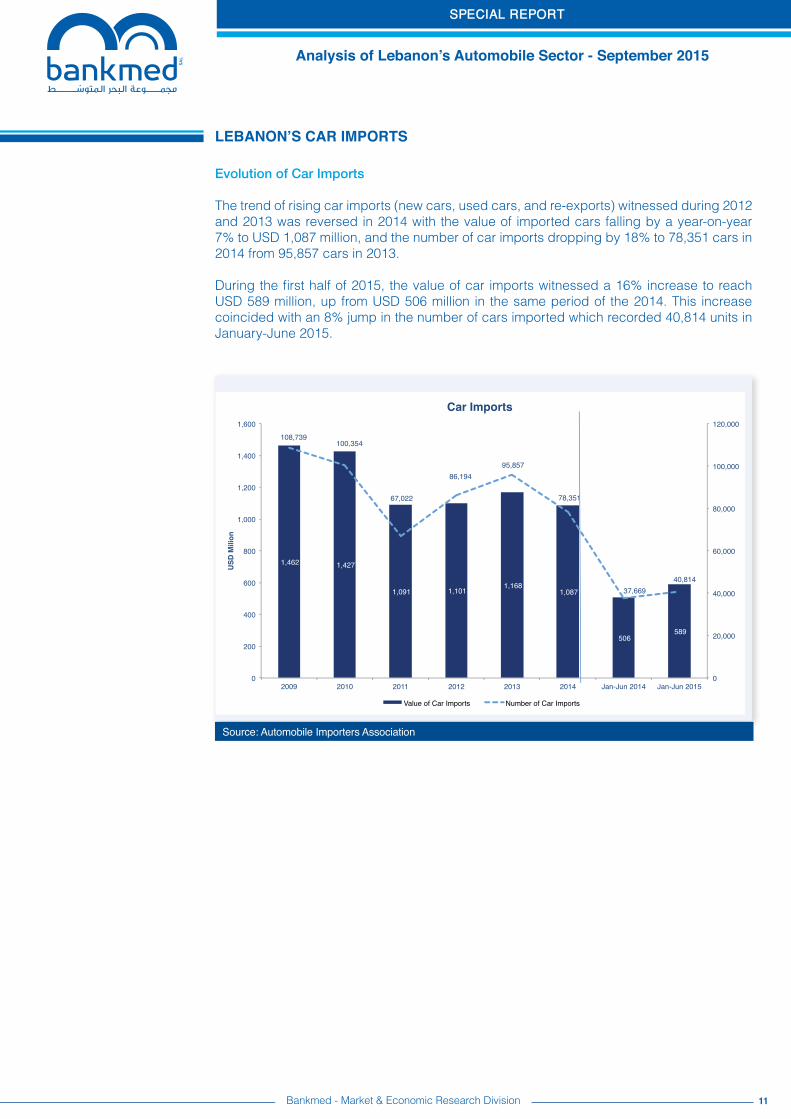
The trend of rising car imports (new cars, used cars, and re-exports) witnessed during 2012 and 2013 was reversed in 2014 with the value of imported cars falling by a year-on-year 7% to USD 1,087 million, and the number of car imports dropping by 18% to 78,351 cars in 2014 from 95,857 cars in 2013.
During the first half of 2015, the value of car imports witnessed a 16% increase to reach USD 589 million, up from USD 506 million in the same period of the 2014. This increase coincided with an 8% jump in the number of cars imported which recorded 40,814 units in January-June 2015.
Source: Automobile Importers Association
Bankmed - Market & Economic Research Division
SPECIAL REPORT
Analysis of lebanon’s Automobile sector - september 2015
12
lebAnon’s CAR iMPoRTs
Bankmed - Market & Economic Research Division
Source: Automobile Importers Association
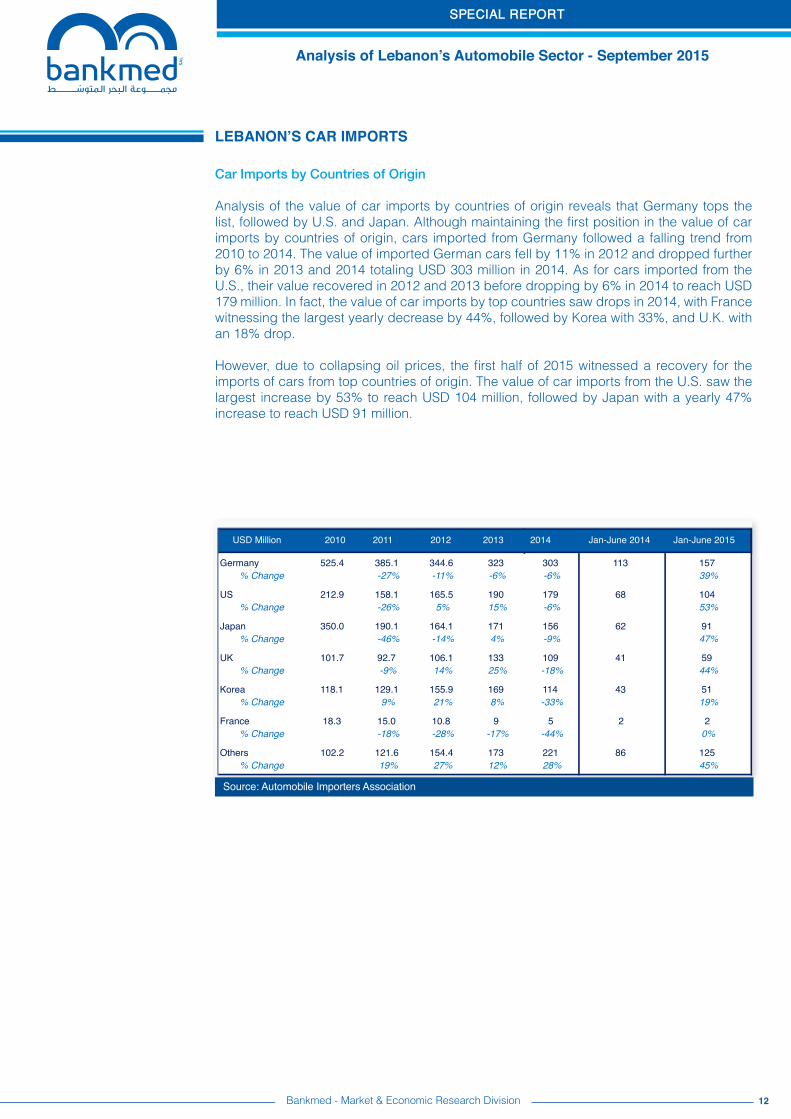
Car Imports by Countries of Origin
Analysis of the value of car imports by countries of origin reveals that Germany tops the list, followed by U.S. and Japan. Although maintaining the first position in the value of car imports by countries of origin, cars imported from Germany followed a falling trend from 2010 to 2014. The value of imported German cars fell by 11% in 2012 and dropped further by 6% in 2013 and 2014 totaling USD 303 million in 2014. As for cars imported from the U.S., their value recovered in 2012 and 2013 before dropping by 6% in 2014 to reach USD 179 million. In fact, the value of car imports by top countries saw drops in 2014, with France witnessing the largest yearly decrease by 44%, followed by Korea with 33%, and U.K. with an 18% drop.
However, due to collapsing oil prices, the first half of 2015 witnessed a recovery for the imports of cars from top countries of origin. The value of car imports from the U.S. saw the largest increase by 53% to reach USD 104 million, followed by Japan with a yearly 47% increase to reach USD 91 million.
USD Million 2010 2011 2012 2013 2014 Jan-June 2014 Jan-June 2015
Germany 525.4 385.1 344.6 323 303 113 157% Change -27% -11% -6% -6% 39%
US 212.9 158.1 165.5 190 179 68 104% Change -26% 5% 15% -6% 53%
Japan 350.0 190.1 164.1 171 156 62 91% Change -46% -14% 4% -9% 47%
UK 101.7 92.7 106.1 133 109 41 59% Change -9% 14% 25% -18% 44%
Korea 118.1 129.1 155.9 169 114 43 51% Change 9% 21% 8% -33% 19%
France 18.3 15.0 10.8 9 5 2 2% Change -18% -28% -17% -44% 0%
Others 102.2 121.6 154.4 173 221 86 125% Change 19% 27% 12% 28% 45%
USD Million 2010 2011 2012 2013 2014 Jan-June 2014 Jan-June 2015
SPECIAL REPORT
Analysis of lebanon’s Automobile sector - september 2015
13
lebAnon’s CAR iMPoRTs
Bankmed - Market & Economic Research Division
Source: Automobile Importers Association
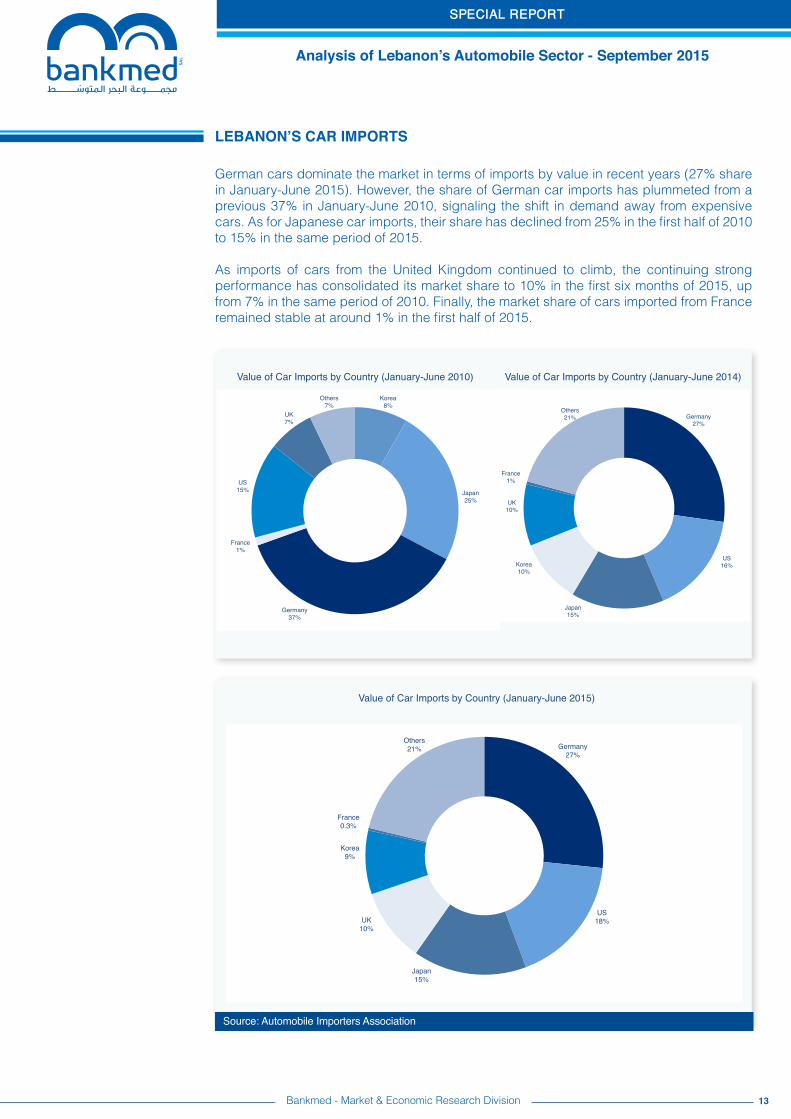
German cars dominate the market in terms of imports by value in recent years (27% share in January-June 2015). However, the share of German car imports has plummeted from a previous 37% in January-June 2010, signaling the shift in demand away from expensive cars. As for Japanese car imports, their share has declined from 25% in the first half of 2010 to 15% in the same period of 2015. As imports of cars from the United Kingdom continued to climb, the continuing strong performance has consolidated its market share to 10% in the first six months of 2015, up from 7% in the same period of 2010. Finally, the market share of cars imported from France remained stable at around 1% in the first half of 2015.
Korea!8%!
Japan!25%!
Germany!37%!
France!1%!
US!15%!
UK!7%!
Others!7%!
Value of Car Imports by Country (January- June 2010)!
Germany!27%!
US!16%!
Japan!15%!
Korea!10%!
UK!10%!
France!1%!
Others!21%!
Value of Car Imports by Country (January-June 2014)!
Germany!27%!
US!18%!
Japan!15%!
UK!10%!
Korea!9%!
France!0.3%!
Others!21%!
Value of Car Imports by Country (January- June 2015)!Value of Car Imports by Country (January-June 2015)
Value of Car Imports by Country (January-June 2010) Value of Car Imports by Country (January-June 2014)
SPECIAL REPORT
Analysis of lebanon’s Automobile sector - september 2015
14Bankmed - Market & Economic Research Division
CAR-RelATed GoveRnMenT Revenues
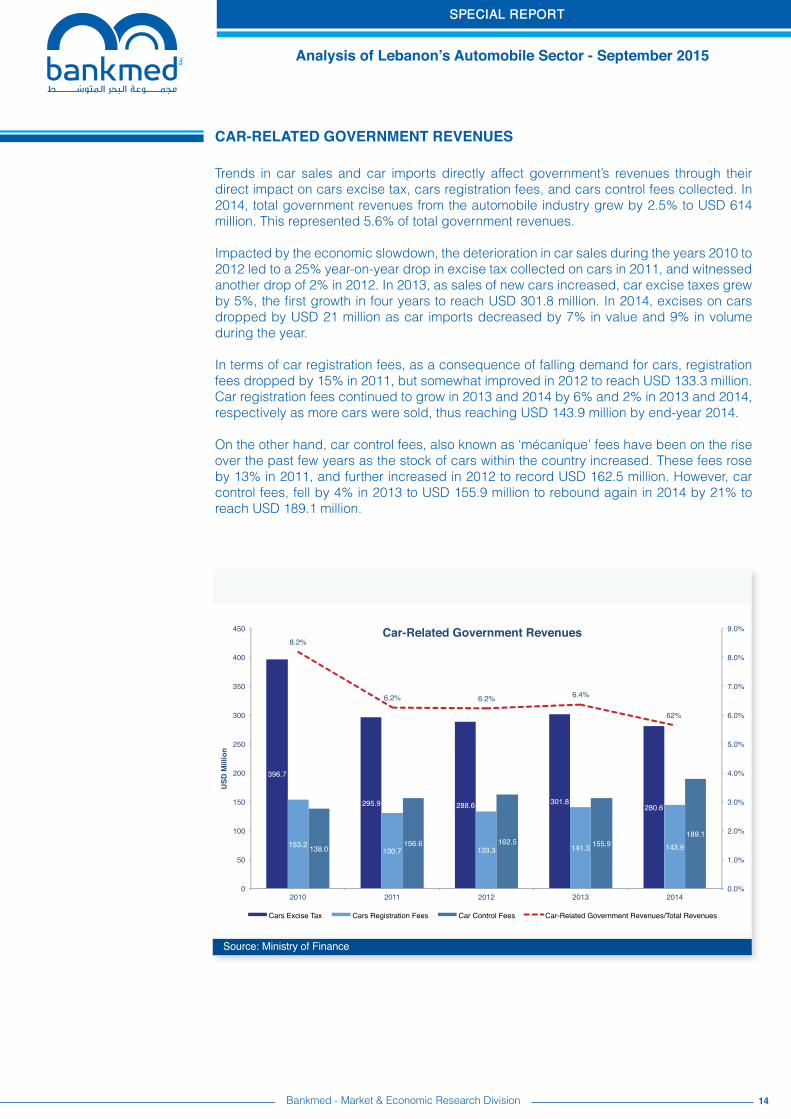
Trends in car sales and car imports directly affect government’s revenues through their direct impact on cars excise tax, cars registration fees, and cars control fees collected. In 2014, total government revenues from the automobile industry grew by 2.5% to USD 614 million. This represented 5.6% of total government revenues.
Impacted by the economic slowdown, the deterioration in car sales during the years 2010 to 2012 led to a 25% year-on-year drop in excise tax collected on cars in 2011, and witnessed another drop of 2% in 2012. In 2013, as sales of new cars increased, car excise taxes grew by 5%, the first growth in four years to reach USD 301.8 million. In 2014, excises on cars dropped by USD 21 million as car imports decreased by 7% in value and 9% in volume during the year.
In terms of car registration fees, as a consequence of falling demand for cars, registration fees dropped by 15% in 2011, but somewhat improved in 2012 to reach USD 133.3 million. Car registration fees continued to grow in 2013 and 2014 by 6% and 2% in 2013 and 2014, respectively as more cars were sold, thus reaching USD 143.9 million by end-year 2014. On the other hand, car control fees, also known as ‘mécanique’ fees have been on the rise over the past few years as the stock of cars within the country increased. These fees rose by 13% in 2011, and further increased in 2012 to record USD 162.5 million. However, car control fees, fell by 4% in 2013 to USD 155.9 million to rebound again in 2014 by 21% to reach USD 189.1 million.
Source: Ministry of Finance
SPECIAL REPORT
Analysis of lebanon’s Automobile sector - september 2015
disclaimer:This material has been prepared by Bankmed sal based on publicly available information and personal analysis. It is provided for information purposes only. It is not intended to be used as a research tool nor as a basis or reference for any decision. The information contained herein including any opinion, news and analysis, is based on various publicly available sources believed to be reliable but its accuracy cannot be guaranteed and may be subject to change without notice. Bankmed, sal does not guarantee the accuracy, timeliness, continued availability or completeness of such information. All data contained herein are indicative. Neither the information provided nor any opinion expressed therein, constitutes a solicitation, offer, personal recommendation or advice. Bankmed, sal does not assume any liability for direct, indirect, incidental or consequential damages resulting from any use of the information contained herein.
Mazen soueid, stephanie Ghanem, Ziad Hariri, Rita nehme
15
concluSion
The decline in oil prices had a major impact on some higher-end brands but not on the entire sector which remains affected by the overall slow economic growth context. Nevertheless, this sector is expected to witness further growth once stability is restored and adequate economic policies are established in Lebanon. Such favorable conditions shall improve consumers’ confidence and enhance their purchasing power.
Recommended