September 2014
BACKGROUND DOCUMENT
AN OVERVIEW OF THE QUÉBECTAXATION SYSTEM

AN OVERVIEW OF THE QUÉBECTAXATION SYSTEM
September 2014
BACKGROUND DOCUMENT

AN OVERVIEW OF THE QUÉBEC TAXATION SYSTEM
Legal deposit – November 2014Bibliothèque et Archives nationales du QuébecISBN 978-2-550-71739-3 (PDF)
© Gouvernement du Québec, 2014

I
In June 2014 the government established the Québec Taxation Review Committee to analyze the Québec taxation system and propose a reform of it.
Under the mandate that the government assigned to it, the committee is conducting a public consultation open to all interested Quebecers, groups and organizations.
To facilitate the preparation of the consultation, the committee has asked the Ministère des Finances du Québec to produce three documents containing information and data on the current taxation system.
This is the first of the three documents. It presents an overview of the Québec taxation system.
The other two documents will be devoted to:
— the personal income tax system; and
— the corporate taxation system.

II
The Order in Council to create the Québec Taxation Review Committee
The Premier announced the establishment of the Québec Taxation Review Committee to analyze the Québec taxation system and propose the reform of it in his inaugural speech at the opening of the 41st Legislature of the National Assembly, subsequently confirmed in the June 4, 2014 2014-2015 Budget.
The Order in Council of June 11, 2014 officially created the Québec Taxation Review Committee and stipulated its mandate.
The mandate is defined as follows:
– examine all tax measures from the standpoint of their relevance and efficacy in order to pinpoint measures to reduce tax expenditures overall to comply with the targets set in the 2014-2015 Budget;
– examine the Québec taxation system to enhance its efficiency, fairness and competitiveness and ensure funding for public services;
– compare international taxation trends, in particular with respect to the practices of proximate neighbours such as the United States and the other Canadian provinces;
– examine the possibility of rethinking balance between different modes of taxation;
– attentively review the business taxation system to propose avenues that will better support economic growth;
– analyze the personal income tax system, in particular to further encourage work and saving and optimize user fees while ensuring fair redistribution of collective wealth through the maintenance of adequate support for the poorest members of society;
– assess the possibility of subjecting to taxation certain user fees in order to take into account the ability to pay of the users of public services, bearing in mind the impacts on the implicit marginal taxation rates.
III
TABLE OF CONTENTS
INTRODUCTION .............................................................................................................. 1
PART 1: Taxation is a Tool to Fund Public Services .................................................... 3
1. The rationale for and origin of the Québec taxation system ................................. 5
2. The fields of taxation of the federal government and the provinces .................... 7
Fields of taxation and sharing of them ............................................................................. 8 2.1
Federal transfers .............................................................................................................. 9 2.2
A comprehensive overview of taxation and funding of public services in Québec ........ 12 2.3
3. The options available to the government to fund public services ...................... 15
The tax system ............................................................................................................... 16 3.1
Revenues of government corporations .......................................................................... 29 3.2
User fees ........................................................................................................................ 30 3.3
4. The approach adopted by Québec to fund public services................................. 31
The general fund, special funds and other budget organization structures ................... 32 4.1
Three examples of funding public services .................................................................... 34 4.2
PART 2: Taxation and the Socioeconomic Role of the State ..................................... 41
1. Taxation as a means of redistributing wealth ...................................................... 43
2. Taxation as a means of supporting economic policy .......................................... 47
Measures intended for businesses ................................................................................ 48 2.1
Measures aimed at individuals ....................................................................................... 49 2.2
3. Taxation to support family, social and environmental policies .......................... 51
PART 3: The Weight and Administration of the Québec taxation system ................. 55
1. The weight of taxation ........................................................................................... 57
2. Tax administration ................................................................................................. 63
Tax collection ................................................................................................................. 63 2.1
Tax evasion and tax avoidance ..................................................................................... 65 2.2
PART 4: The Context of the Impending Tax Reform ................................................... 67
1. Public finances: a persistent budget deficit and heavy indebtedness ............... 69
A persistent budget deficit .............................................................................................. 70 1.1
Heavy indebtedness ....................................................................................................... 72 1.2
The 2014-2015 Budget contains precise targets to be achieved................................... 74 1.3
IV
2. Economic growth: a downturn in activity because of ongoing demographic changes ........................................................................................... 77
Productivity and employment are the key factors in raising Québec’s standard of 2.1living ............................................................................................................................... 78
Challenges posed by the ageing of the population ........................................................ 79 2.2
Conclusion..................................................................................................................... 81

V
Charts
CHART 1 Historic changes in key social transfers ............................................................ 9
CHART 2 Breakdown of the government’s consolidated own-source revenue – 2014-2015 ....................................................................................................... 13
CHART 3 Breakdown of the government’s consolidated revenue and expenditure ....... 14
CHART 4 Breakdown of fiscal levies on individuals – 2014-2015 ................................... 16
CHART 5 Breakdown of fiscal levies on businesses – 2014-2015 ................................. 21
CHART 6 Breakdown of consumption taxes – 2014-2015 .............................................. 25
CHART 7 Breakdown of taxpayers and tax payable by total income group – 2011 ....... 45
CHART 8 The importance of overall tax revenues – 2010 .............................................. 57
CHART 9 The importance of personal income tax – 2010 .............................................. 58
CHART 10 The importance of corporate tax – 2010 ......................................................... 59
CHART 11 The importance of goods and services taxes – 2010 ..................................... 60
CHART 12 The importance of property tax – 2010 ........................................................... 61
CHART 13 Change in the budgetary balance1 from 1984-1985 to 2013-2014 ................. 70
CHART 14 Changes in the expenditures of public administrations1 in the economy
of Québec and Ontario .................................................................................... 71
CHART 15 Gross debt and debt representing accumulated deficits as at March 31, 2013 ................................................................................................................. 72
CHART 16 Debt service as a proportion of consolidated expenditure – 2013-2014......... 73
CHART 17 Budgetary balance – 2008-2009 to 2015-2016 ............................................... 74
CHART 18 Growth in consolidated expenditure excluding debt service – 2010-2011 to 2018-2019 ................................................................................................... 75
CHART 19 Growth in consolidated revenue and expenditure – 2013-2014 to 2018-2019 ................................................................................................................. 76

VII
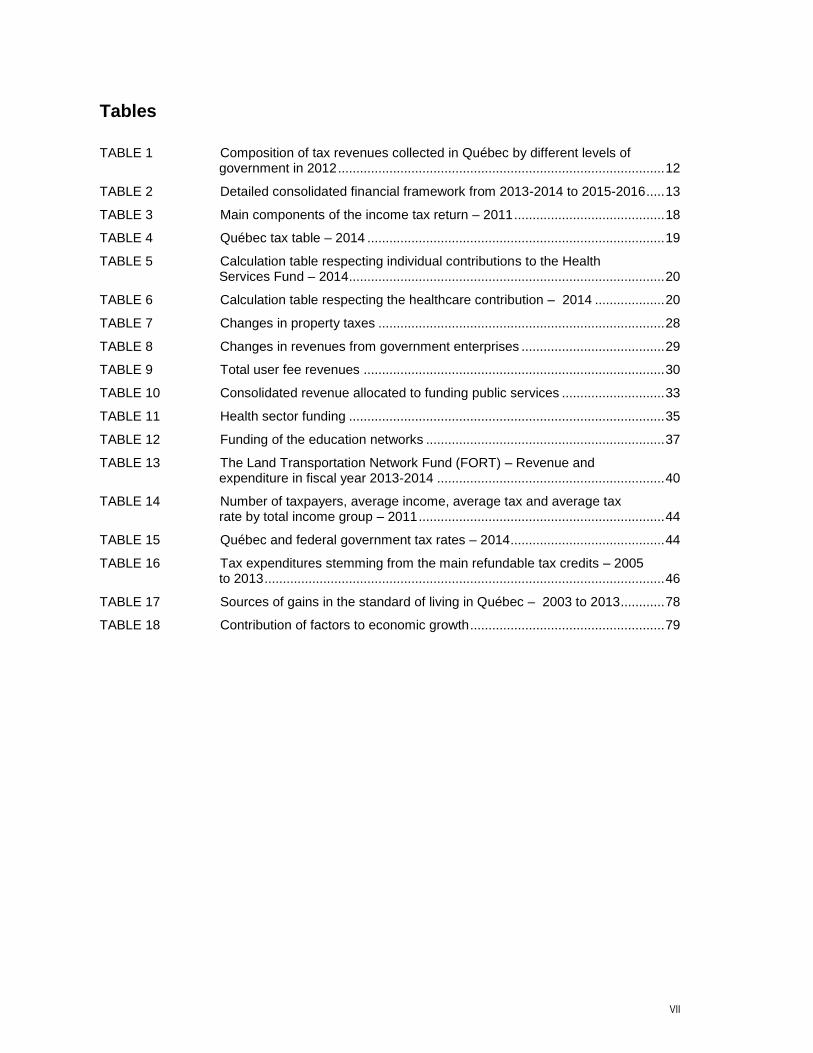
Tables
TABLE 1 Composition of tax revenues collected in Québec by different levels of government in 2012 ......................................................................................... 12
TABLE 2 Detailed consolidated financial framework from 2013-2014 to 2015-2016 ..... 13
TABLE 3 Main components of the income tax return – 2011 ......................................... 18
TABLE 4 Québec tax table – 2014 ................................................................................. 19
TABLE 5 Calculation table respecting individual contributions to the Health Services Fund – 2014 ...................................................................................... 20
TABLE 6 Calculation table respecting the healthcare contribution – 2014 ................... 20
TABLE 7 Changes in property taxes .............................................................................. 28
TABLE 8 Changes in revenues from government enterprises ....................................... 29
TABLE 9 Total user fee revenues .................................................................................. 30
TABLE 10 Consolidated revenue allocated to funding public services ............................ 33
TABLE 11 Health sector funding ...................................................................................... 35
TABLE 12 Funding of the education networks ................................................................. 37
TABLE 13 The Land Transportation Network Fund (FORT) – Revenue and expenditure in fiscal year 2013-2014 .............................................................. 40
TABLE 14 Number of taxpayers, average income, average tax and average tax rate by total income group – 2011 ................................................................... 44
TABLE 15 Québec and federal government tax rates – 2014 .......................................... 44
TABLE 16 Tax expenditures stemming from the main refundable tax credits – 2005 to 2013 ............................................................................................................. 46
TABLE 17 Sources of gains in the standard of living in Québec – 2003 to 2013 ............ 78
TABLE 18 Contribution of factors to economic growth ..................................................... 79


Introduction 1
INTRODUCTION
This document contains an array of information and data that provide an overview of the Québec taxation system to facilitate impending discussions of the reforms to be made to it.
The Québec Taxation Review Committee has assumed responsibility for the government’s reflection, which hinges on two inescapable facts.
— Taxation is, first and foremost, the key means that the State uses to fund public services. We must, therefore, ask ourselves how Québec uses taxation for this purpose.
— Taxation is also a powerful tool that the State uses to support and promote economic growth and to implement public policy, in particular family, social and environmental policies. The reflection undertaken must focus both on funding for public services and reforms to the taxation system to ensure that it effectively plays its role to support public policy.
In light of the foregoing, it is important to bear in mind what characterizes the current Québec taxation system and take into account the budgetary and economic context in which the reform is undertaken.
The document produced at the request of the Québec Taxation Review Committee is intended to make available to all Quebecers the information and data pertaining to the inescapable facts mentioned earlier.
The plan of the document
The document is divided into four parts.
— Part 1 notes that taxation is, primarily, a tool to fund public services. Québec has adopted a number of approaches to this end.
— Part 2 examines other functions of taxation, which has become a tool that the State uses to assume its socioeconomic role.
— Part 3 describes the weight and the administration of the Québec taxation system and its application.
— Part 4 is devoted to the context in which the impending tax reform is being undertaken.

Part 1: Taxation is a Tool to Fund Public Services 3
PART 1: TAXATION IS A TOOL TO FUND PUBLIC SERVICES
Taxation is intended, first and foremost, to fund public services that the State provides. Part 1 of this document examines the matter from four different perspectives.
— From a historical perspective, it is worthwhile to focus on the rationale for and the origin of taxation in Québec and in Canada.
— In Canada, the federal government and the provinces share fields of taxation. It is essential to fully grasp the terms and conditions of such sharing.
— To fund public services, the State has several options, one of which is taxation. The existence of different options is at the very heart of debate surrounding the definition of the taxation system.
— Québec has made choices between the different options. To clarify debate, we must present the approach that Québec has adopted to fund public services.

Part 1: Taxation is a Tool to Fund Public Services 5
1. THE RATIONALE FOR AND ORIGIN OF THE QUÉBEC TAXATION SYSTEM
In all nations, the authority responsible has levied taxes and established a taxation system to fund the services for which the authority assumes responsibility, i.e. the army and justice, for a start.
Dues and customs duties under the French and British regimes
Under the French regime, taxes took the form of annual dues, which the inhabitants or tenants had to pay to the seigneur.
Following the Treaty of Paris of 1763 and the establishment of the British regime, the British colony of Lower Canada collected its main revenues from customs duties and excise taxes levied on manufactured products and on wine, alcohol and tobacco. In Upper Canada, where there was no sea port, the colony’s revenues were derived from property taxes.
The beginnings of the Canadian federation
With the establishment in 1867 of the Canadian federation, the federal government had to assume most public spending, i.e. above all the construction of rail, river and maritime infrastructure.
At that time, the federal government took control of customs duties, the main source of tax revenue.
The provinces obtained the power to levy direct taxes but did not immediately exercise the right and relied instead on funds paid by the federal government.
In 1882, Québec became the first province to exercise its right of direct taxation when it established a tax on capital paid and on places of business. In 1892, Québec implemented estate taxes, which were abolished in 1985.
The establishment at the time of World War I of modern taxation systems
As was the case in most of the other warring countries, World War I (1914-1918) directly spurred the establishment of the first modern taxation systems such as we now know them.
In Canada, the government implemented a tax on corporate profits in 1916 and personal income tax and a sales tax in 1917 in order to finance the war effort. The establishment of personal income tax and the sales tax were announced as temporary measures. The taxation system was maintained because of war debts and has not since been abolished.
The gradual establishment of the Québec taxation system
In Québec, certain components of the taxation system were introduced gradually, with the first sales tax in 1924 (a tax on gasoline), a tax on restaurant meals in 1926, corporate taxation in 1932, followed by the taxation of dividends in 1939 and the introduction of the retail sales tax and the tobacco tax in 1940.
In 1935, Montréal implemented personal income tax through a provincial statute. Québec established personal income tax in 1940 but the tax was only levied for 1939 and 1940.
World War II and the post-war period
The provinces suspended directed taxation with the outbreak of World War II (1939-1945). Under the 1941 fiscal agreements, the provinces agreed to relinquish personal income tax, corporate tax and estate duties to the federal government in exchange for annual compensatory transfers. The agreements were temporary.
An Overview of the 6 Québec Taxation System
At the end of the war, the federal government did not restore to the provinces fields of direct taxation. Instead, it proposed to grant them certain collection rights and tax allocation agreements. Québec and Ontario rejected the proposals and preferred to maintain full latitude to implement their own taxes.
The 1952-1957 fiscal arrangements did not include any substantial changes. However, Ontario decided to participate in the personal and corporate income tax allocation agreements.
Québec refused to participate in the arrangements. In 1954, Québec Premier Maurice Duplessis had adopted the Loi de l’impôt provincial sur le revenu, at which time Quebecers began to fill out two income tax returns, one federal the other provincial.

Part 1: Taxation is a Tool to Fund Public Services 7
2. THE FIELDS OF TAXATION OF THE FEDERAL GOVERNMENT AND THE PROVINCES
In Canada, fields of taxation were gradually divided between the federal government and the provinces.
— Constitutional texts define the fields of taxation and the sharing of them.
— The federal government makes transfers to the provinces, the form of which has changed considerably over the years.
— The sharing of fields of taxation and federal transfers explain the current overall profile of the funding by the Québec government of public services and fiscal levies in Québec.
An Overview of the 8 Québec Taxation System
Fields of taxation and sharing of them 2.1
The Constitution Act, 1867
The Constitution Act, 1867 recognizes the right of the federal and provincial governments to tax Canadian citizens and the goods in their territories. The Constitution stipulates that the federal government has the exclusive power to levy taxes through any mode of taxation (s. 91(3)) while the provincial governments exercise exclusive jurisdiction in the realm of direct taxation within each province for provincial purposes (s. 92(2)).
The federal government thus exercises more extensive power than the provinces. It has jurisdiction over both direct and indirect modes of taxation while the provinces are confined to direct taxation.
Customs duties and excise taxes are recognized as indirect taxes and are thus reserved for the federal government. Consumption taxes and property taxes are deemed to be forms of direct taxation under Canadian constitutional principles.
In addition to the right to direct taxation, the provinces are empowered to demand fees for the issuing of licences and permits (s. 92(9)).
Moreover, the provinces may empower the municipalities or the school boards to levy direct taxes or set fees for services.
The Constitution Act, 1982
The Constitution Act, 1982 granted the provinces indirect taxing power in respect of natural resources and stipulated that they may “directly or indirectly tax non-renewable natural resources and forestry resources in the province and the primary production therefrom, and sites and facilities in the province for the generation of electrical energy and the production therefrom” (s. 92A(4)).
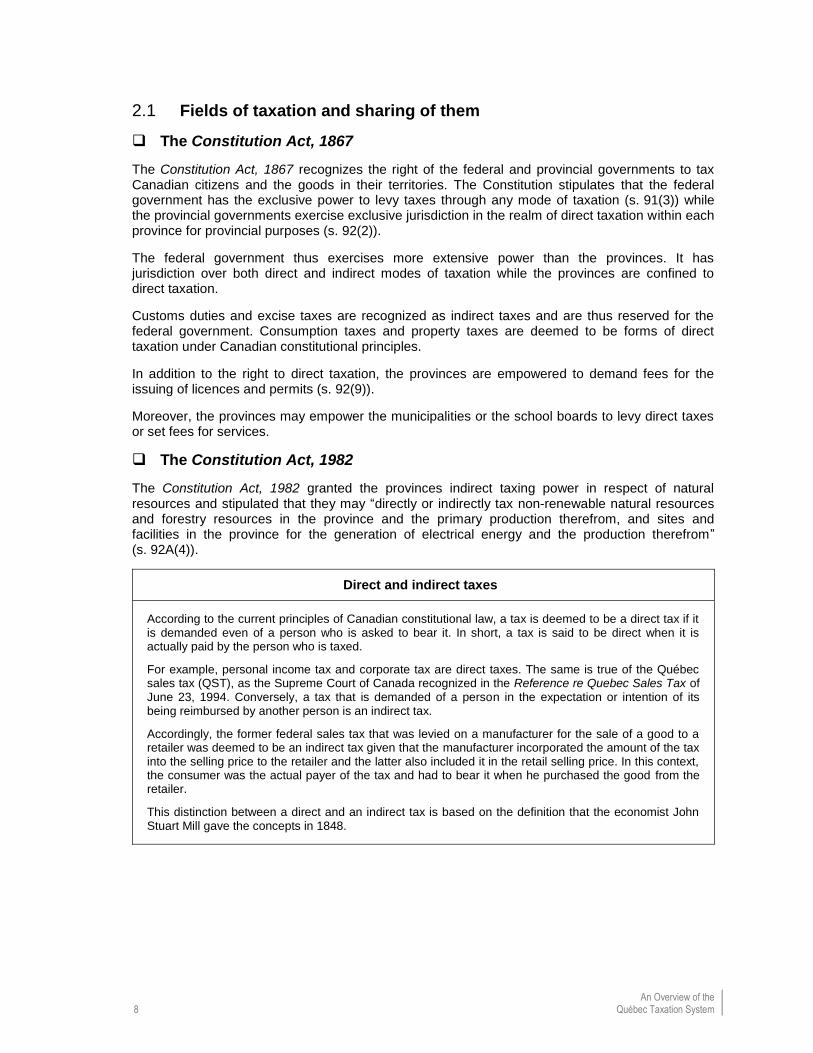
Direct and indirect taxes
According to the current principles of Canadian constitutional law, a tax is deemed to be a direct tax if it is demanded even of a person who is asked to bear it. In short, a tax is said to be direct when it is actually paid by the person who is taxed.
For example, personal income tax and corporate tax are direct taxes. The same is true of the Québec sales tax (QST), as the Supreme Court of Canada recognized in the Reference re Quebec Sales Tax of June 23, 1994. Conversely, a tax that is demanded of a person in the expectation or intention of its being reimbursed by another person is an indirect tax.
Accordingly, the former federal sales tax that was levied on a manufacturer for the sale of a good to a retailer was deemed to be an indirect tax given that the manufacturer incorporated the amount of the tax into the selling price to the retailer and the latter also included it in the retail selling price. In this context, the consumer was the actual payer of the tax and had to bear it when he purchased the good from the retailer.
This distinction between a direct and an indirect tax is based on the definition that the economist John Stuart Mill gave the concepts in 1848.

Part 1: Taxation is a Tool to Fund Public Services 9
Federal transfers 2.2
After World War II, the federal government decided to maintain the fields of taxation occupied to finance the war effort, this time to satisfy the increase in health and education services that the provinces assumed. The federal government established at that time numerous transfers to the provinces in order to equally share the costs of expenditures deemed “eligible” for programs covering health, postsecondary education and social aid.
Federal transfers have undergone numerous changes over the past 50 years.
CHART 1
Historic changes in key social transfers
05-11-2014
Hospitalization insurance (Hospitalization insurance and
Diagnostic Services Act)
Block funding 1996-1997 to 2003-2004
Shared-cost programs (CAP)
And block funding (EPF) 1977-1978 to 1995-1996
Postsecondary education
Health insurance (Medical Care Act)
50/50 shared-cost
programs Until 1976-1977
Canada Assistance
Program (CAP)
Established programs
financing (EPF)
Canada Assistance
Program (CAP)
Canada Health and
Social Transfer
(CHST)
Canada Health
Transfer (CHT)
Canada Social
Transfer (CST)
Starting in 2004-2005 Block funding

An Overview of the 10 Québec Taxation System
The Canada Health Transfer and the Canada Health Transfer
In 1977-1978, the federal government adopted the “block” funding formula in respect of health and postsecondary education transfers with the Established Programs Financing for Health Care and Education in order to limit growth in spending. At that time, the federal government was funding 25% of the provinces’ eligible expenses in health and postsecondary education.
Starting in 1996-1997, the federal government also adopted “block” funding for social aid transfers by grouping them together with health and postsecondary education transfers, which gave rise to the Canada Health and Social Transfer (CHST).
In 2004-2005, the CHST was divided into two separate transfers, the Canada Health Transfer and the Canada Social Transfer, which continue to exist in this form.
Equalization
The federal government established an equalization program in 1957 to reduce the discrepancies in fiscal capacity between the provinces. The objective of the equalization program was specified in s. 36(2) of the Constitution Act, 1982:
“Parliament and the government of Canada are committed to the principle of making equalization payments to ensure that provincial governments have sufficient revenues to provide reasonably comparable levels of public services at reasonably comparable levels of taxation.”
The federal government pays for the equalization program from the tax revenues that it collects from all Canadian taxpayers.
Since 1967, the equalization formula has been based on the “representative tax system.”
The representative tax system makes it possible to estimate the revenues that a province would obtain were it to apply to its own tax bases the average taxation rates in force in the 10 Canadian provinces. Generally speaking, equalization compensates the gap (calculated on a per capita basis) between the fiscal capacity of a province thus calculated and that of a “program standard”, e.g. the average fiscal capacity of the 10 provinces according to standardized tax bases.
Over the years, the method of accurately measuring the representative tax system, the program standard reference (average of the 10 provinces, average of the five so-called representative provinces
1) and other general provisions of the program have changed, but the spirit and general
operation of the program have remained the same.
The ceilings, floors, changes concerning income subject to equalization and other one-off changes to the program have meant that the provinces do not necessarily receive equalization payments calculated in light of the same per capita level.
1 The five provinces were British Columbia, Saskatchewan, Manitoba, Ontario and Québec. The standard based on
five provinces was in force from 1982 to 2004.

Part 1: Taxation is a Tool to Fund Public Services 11
Transfers of federal tax points and the special Québec abatement
Transfer of federal tax points in 1964-1965
In 1964-1965, the federal government offered the provinces the option to opt out of certain joint programs, in particular hospital care and social aid, in exchange for a transfer of tax points. Only Québec accepted the offer, which led to the special Québec abatement.
In 1976, the special Québec abatement corresponded to 24% of the basic federal tax (BFT):
– 16 points for hospitalization insurance;
– 5 points for the Canada Assistance Plan;
– 3 points for youth allowances.
The federal tax payable by Québec taxpayers thus declined by 24% and their provincial tax increased by the same amount.
To ensure that the federal contribution to the programs is equivalent for all of the provinces, federal transfers in cash to Québec for health care and social programs were reduced by an equivalent amount.
Transfer of federal tax points in 1977-1978
In 1977-1978, the federal government transferred to all of the provinces 9.143 points of the BFT in respect of health care. Ottawa relinquished this tax room to allow the provinces to increase their taxation rates.
The transfer of tax points had a significant impact on the special Québec abatement, which, once adjusted, represented and continues to represent 16.5% of the BFT from which:
– 13.5 points are deducted from Québec’s federal transfer revenues for health care, postsecondary education and other social programs, in light of the transfer of tax points in 1964-1965;
– 3 points are reimbursed to the federal government in respect of the fiscal transfer pertaining to the former program of youth allowances since it was abolished in 1974.
It should be noted that the special Québec abatement reduces by 16.5% the federal tax that Québec taxpayers pay and increases by the same amount their provincial tax payable. What is more, the special Québec abatement does not engender any financial gain for the Québec government since the 16.5% reduction in federal tax from which Québec taxpayers benefit is subtracted from Québec’s federal transfers for health care, postsecondary education and other social programs (13.5 points) and the fiscal transfer pertaining to the former youth allowance program is reimbursed (3 points) to the federal government.
An Overview of the 12 Québec Taxation System
A comprehensive overview of taxation and funding of public 2.3services in Québec
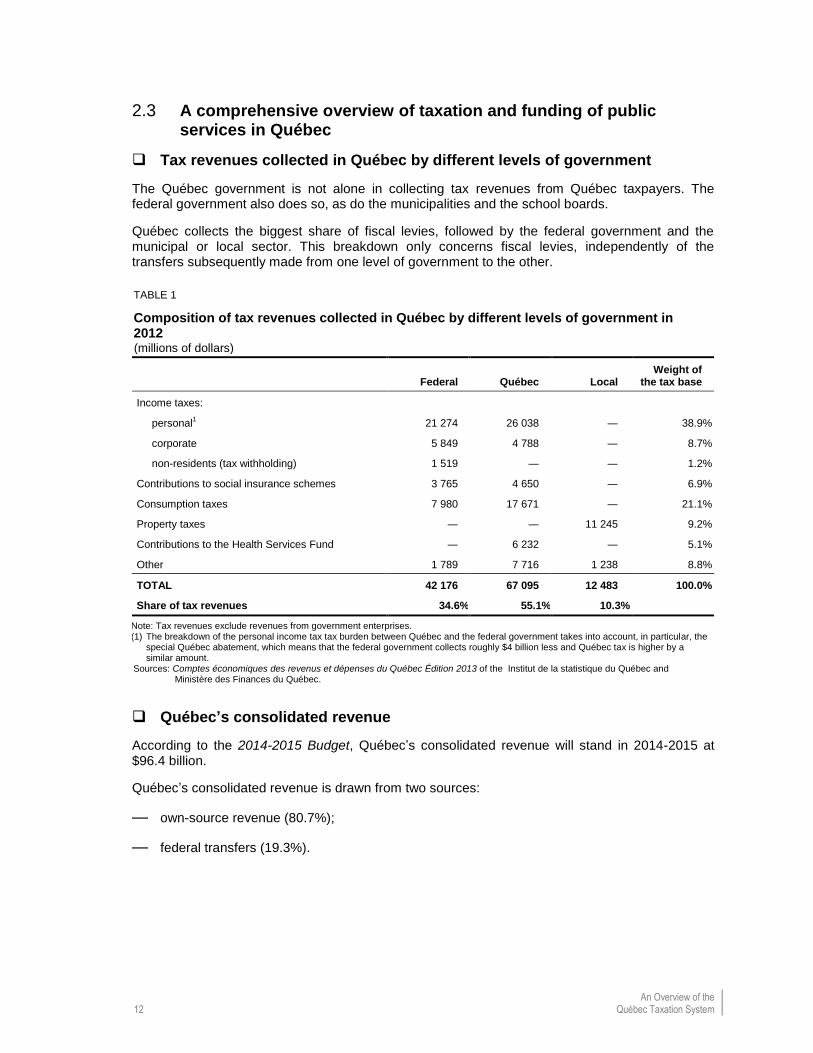
Tax revenues collected in Québec by different levels of government
The Québec government is not alone in collecting tax revenues from Québec taxpayers. The federal government also does so, as do the municipalities and the school boards.
Québec collects the biggest share of fiscal levies, followed by the federal government and the municipal or local sector. This breakdown only concerns fiscal levies, independently of the transfers subsequently made from one level of government to the other.
TABLE 1
Composition of tax revenues collected in Québec by different levels of government in 2012
(millions of dollars)
Federal Québec Local Weight of
the tax base
Income taxes:
personal1 21 274 26 038 ― 38.9%
corporate 5 849 4 788 ― 8.7%
non-residents (tax withholding) 1 519 ― ― 1.2%
Contributions to social insurance schemes 3 765 4 650 ― 6.9%
Consumption taxes 7 980 17 671 ― 21.1%
Property taxes ― ― 11 245 9.2%
Contributions to the Health Services Fund ― 6 232 ― 5.1%
Other 1 789 7 716 1 238 8.8%
TOTAL 42 176 67 095 12 483 100.0%
Share of tax revenues 34.6% 55.1% 10.3%
Note: Tax revenues exclude revenues from government enterprises. (1) The breakdown of the personal income tax tax burden between Québec and the federal government takes into account, in particular, the
special Québec abatement, which means that the federal government collects roughly $4 billion less and Québec tax is higher by a similar amount.
Sources: Comptes économiques des revenus et dépenses du Québec Édition 2013 of the Institut de la statistique du Québec and Ministère des Finances du Québec.
Québec’s consolidated revenue
According to the 2014-2015 Budget, Québec’s consolidated revenue will stand in 2014-2015 at $96.4 billion.
Québec’s consolidated revenue is drawn from two sources:
— own-source revenue (80.7%);
— federal transfers (19.3%).

Part 1: Taxation is a Tool to Fund Public Services 13
TABLE 2
Detailed consolidated financial framework from 2013-2014 to 2015-2016
(millions of dollars)
2013-2014 2014-2015 2015-2016
Consolidated revenue
Personal income tax 25 961 27 349 28 338
Health services contributions 6 305 6 482 6 657
Corporate taxes 5 540 5 819 6 112
School property tax 1 750 1 901 2 054
Consumption taxes 17 156 17 657 18 288
Duties and licences 2 167 2 506 2 649
Miscellaneous revenue 9 403 9 670 10 064
Government enterprises 5 444 5 105 4 795
Revenue from the Generations Fund 1 121 1 301 1 583
Subtotal – Own-source revenue 74 847 77 790 80 540
Federal transfers 18 820 18 607 19 276
Total, consolidated revenue 93 667 96 397 99 816
Own-source revenue
Own-source revenue stands at $77.8 billion in 2014-2015. It stems by and large from personal income tax (35.2%) and consumption taxes (22.7%).
CHART 2
Breakdown of the government’s consolidated own-source revenue – 2014-2015
(as a percentage)
(1) Includes the school property tax, duties and licences and revenue from the Generations Fund.
35.2%
22.7%7.5%
6.6%
8.3%
12.4%7.3%
Personal income tax (32.2%)
Consumption taxes (22.7%)
Corporate taxes (7.5%)
Government enterprises (6.6%)
Health services contributions (8.3%)
Miscellaneous revenue (12.4%)
Other revenue (7.3%)(1)
An Overview of the 14 Québec Taxation System
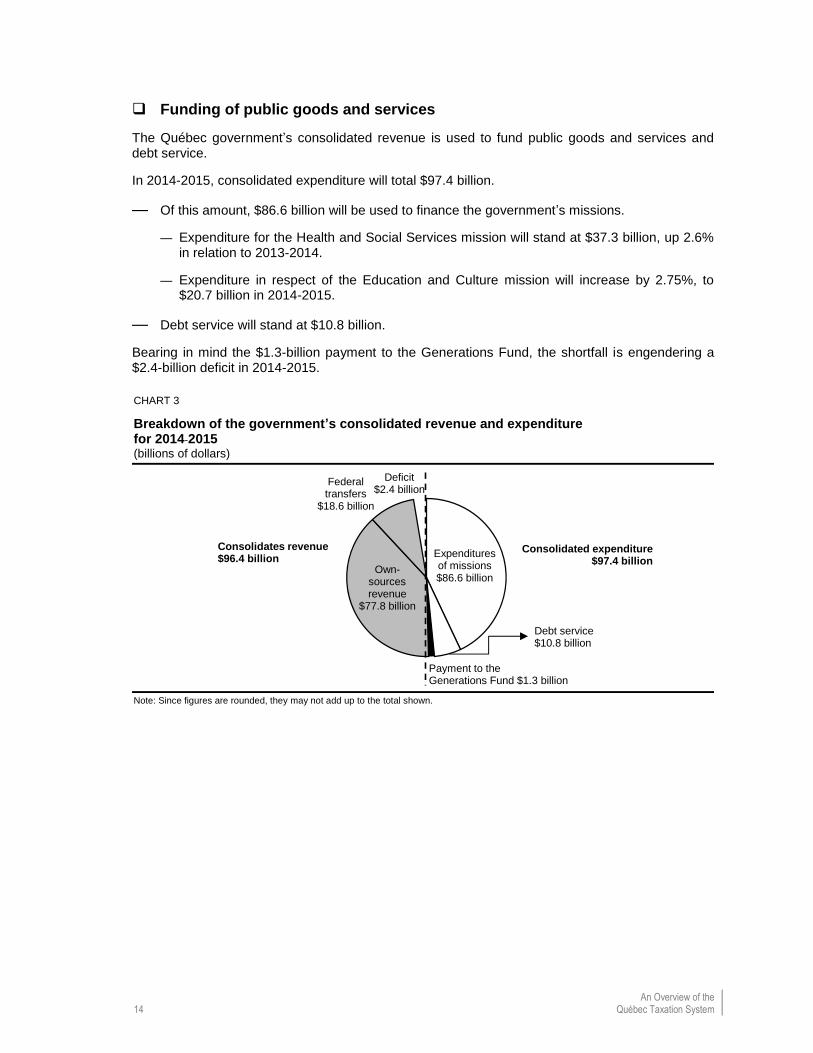
Funding of public goods and services
The Québec government’s consolidated revenue is used to fund public goods and services and debt service.
In 2014-2015, consolidated expenditure will total $97.4 billion.
— Of this amount, $86.6 billion will be used to finance the government’s missions.
— Expenditure for the Health and Social Services mission will stand at $37.3 billion, up 2.6% in relation to 2013-2014.
— Expenditure in respect of the Education and Culture mission will increase by 2.75%, to $20.7 billion in 2014-2015.
— Debt service will stand at $10.8 billion.
Bearing in mind the $1.3-billion payment to the Generations Fund, the shortfall is engendering a $2.4-billion deficit in 2014-2015.
CHART 3
Breakdown of the government’s consolidated revenue and expenditure for 2014-2015
(billions of dollars)
Note: Since figures are rounded, they may not add up to the total shown.
Federal transfers
$18.6 billion
Deficit$2.4 billion
Own-sources revenue
$77.8 billion
Expenditures of missions$86.6 billion
Payment to the Generations Fund $1.3 billion
Debt service $10.8 billion
Consolidated expenditure $97.4 billion
Consolidates revenue$96.4 billion

Part 1: Taxation is a Tool to Fund Public Services 15
3. THE OPTIONS AVAILABLE TO THE GOVERNMENT TO FUND PUBLIC SERVICES
Apart from federal transfers, the government relies essentially on three means to fund public services.
— The main means is taxation, for which it is the rationale.
— The government also uses the revenue that it receives from government corporations to pay for public services.
— The users of public services pay part of the cost of certain services through fees.
An Overview of the 16 Québec Taxation System
The tax system 3.1
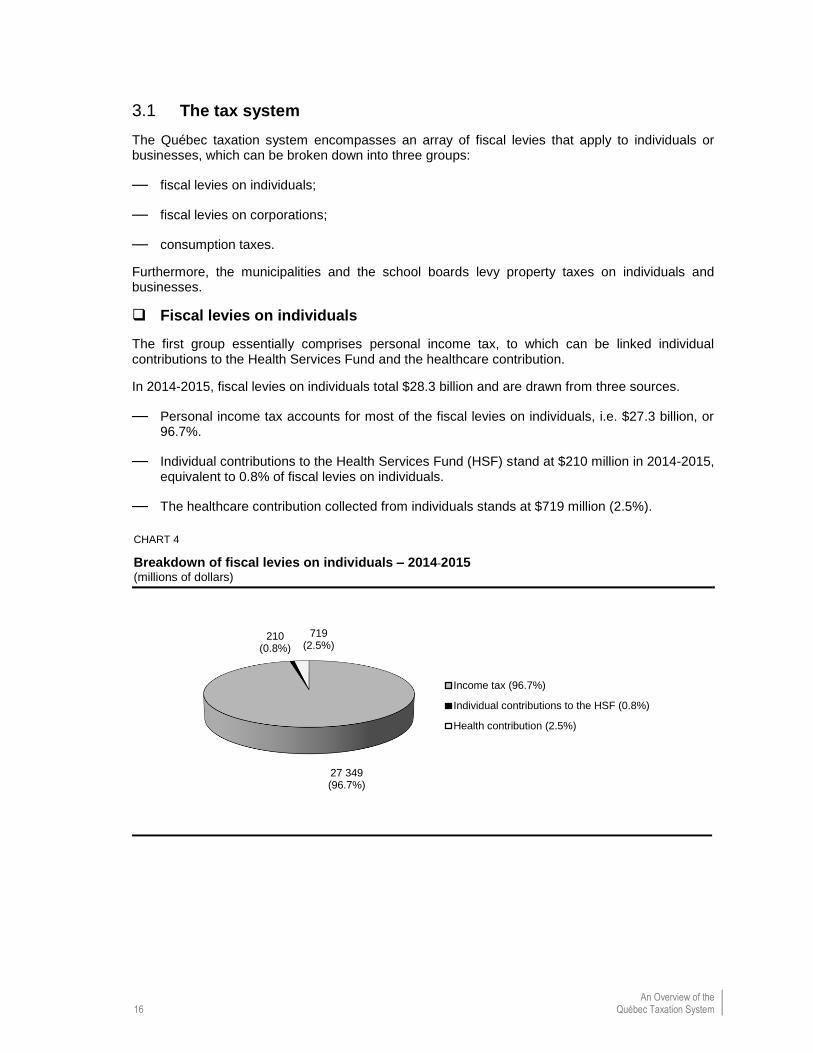
The Québec taxation system encompasses an array of fiscal levies that apply to individuals or businesses, which can be broken down into three groups:
— fiscal levies on individuals;
— fiscal levies on corporations;
— consumption taxes.
Furthermore, the municipalities and the school boards levy property taxes on individuals and businesses.
Fiscal levies on individuals
The first group essentially comprises personal income tax, to which can be linked individual contributions to the Health Services Fund and the healthcare contribution.
In 2014-2015, fiscal levies on individuals total $28.3 billion and are drawn from three sources.
— Personal income tax accounts for most of the fiscal levies on individuals, i.e. $27.3 billion, or 96.7%.
— Individual contributions to the Health Services Fund (HSF) stand at $210 million in 2014-2015, equivalent to 0.8% of fiscal levies on individuals.
— The healthcare contribution collected from individuals stands at $719 million (2.5%).
CHART 4
Breakdown of fiscal levies on individuals – 2014-2015
(millions of dollars)
27 349(96.7%)
210(0.8%)
719(2.5%)
Income tax (96.7%)
Individual contributions to the HSF (0.8%)
Health contribution (2.5%)

Part 1: Taxation is a Tool to Fund Public Services 17
Personal income tax
The taxation system makes provision for refundable tax credits for individuals, including the solidarity tax credit, which reduce tax revenues. The tax credits reduce fiscal levies on individuals by $5.8 billion. Accordingly, in 2014-2015, net fiscal levies of refundable tax credits will total $22.5 billion.
The personal income tax system is centred essentially on the individual. This means, for example, that taxation rates and fiscal parameters apply to the taxpayer’s income, whether or not the taxpayer has a spouse.
However, certain tax measures, mainly those intended for low- or middle-income households, take into account the financial situation of households.
Net income
The determination of net income is the first step in the computation of an individual’s tax payable.
Net income is computed according to different sources of income (employment, business, property and so on) after the deduction of the expenses usually attributable to it.
From the standpoint of fiscal policy, net income is used to determine the “wealth” of households. It is often used as the starting point to calculate tax or social assistance. The inclusion of an amount in the computation of net income does not mean that tax will be payable on it.

An Overview of the 18 Québec Taxation System
Taxable income
The second step consists in determining taxable income.
As its name suggests, taxable income is income on which tax must be calculated. To determine the taxable income, certain amounts must be adjusted and subtracted from net income.
The amounts to be added are those on which tax must be calculated but that must not be taken into account to determine the “wealth” of households in a given year. Such amounts include the Universal Child Care Benefit, benefits from a registered disability savings plan and certain retroactive payments.
The amounts deductible include deferred losses, various tax preferences such as the Cooperative Investment Plan and tax holidays for foreign experts, amounts exempted by legislation from tax, such as income replacement allowances received in the wake of an industrial or automobile accident, or under a tax treaty.
TABLE 3
Main components of the income tax return – 2011
(millions of dollars)
2011
Taxable income
Total income 248 621
Deductions -21 278
Net income 227 343
Other deductions -7 598
Taxable income 219 745
Tax payable
Tax on taxable income 38 905
Non-refundable tax credits1 -15 553
Tax payable 23 352
Refundable tax credits2 -3 953
Tax payable less refundable tax credits 19 399
Average taxation rate (as a percentage)3 9.4%
(1) Only the portion used to reduce the tax payable to zero is considered. Accordingly, the total non-refundable tax credits granted is $15 803 million, while the portion used is $15 553 million.
(2) Refundable tax credits include, in particular, child assistance, the solidarity tax credit, the work premium, the tax credit for childcare expenses and the tax credit for home-support services for seniors.
(3) The average taxation rate corresponds to the ratio between the tax payable and total income. Source: Ministère des Finances du Québec, Statistiques fiscales des particuliers – Année d’imposition 2011, March 2014.
Part 1: Taxation is a Tool to Fund Public Services 19
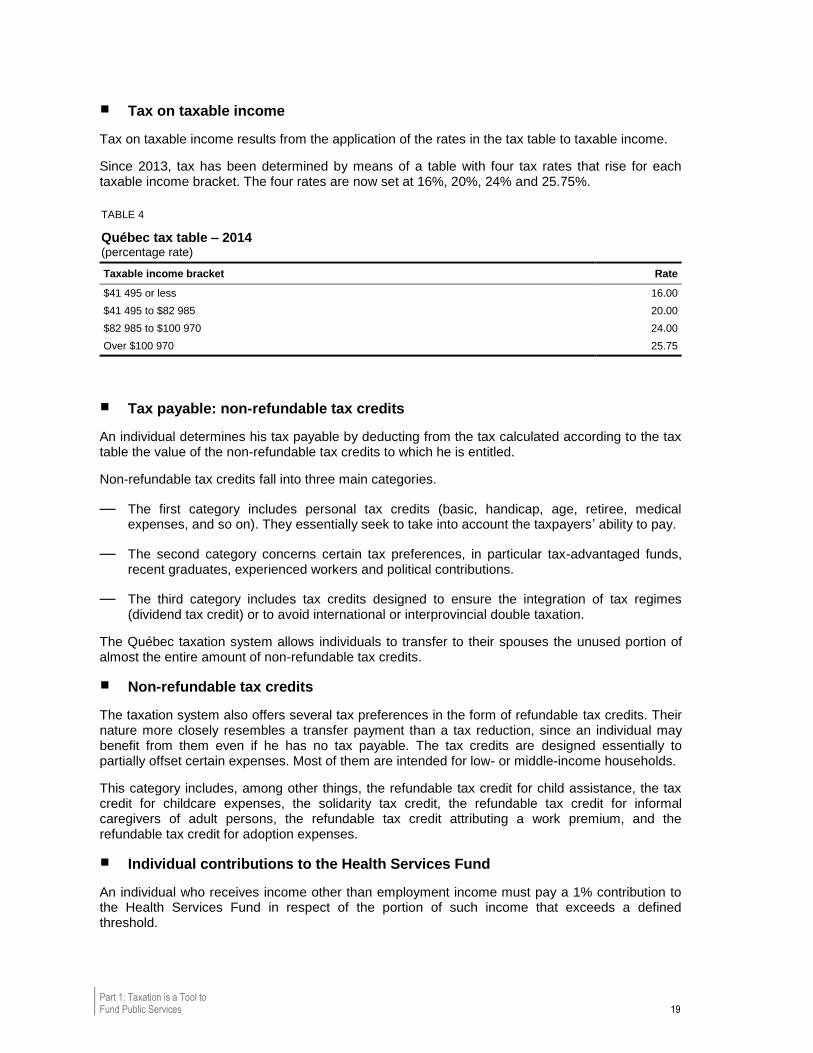
Tax on taxable income
Tax on taxable income results from the application of the rates in the tax table to taxable income.
Since 2013, tax has been determined by means of a table with four tax rates that rise for each taxable income bracket. The four rates are now set at 16%, 20%, 24% and 25.75%.
TABLE 4
Québec tax table – 2014
(percentage rate)
Taxable income bracket Rate
$41 495 or less 16.00
$41 495 to $82 985 20.00
$82 985 to $100 970 24.00
Over $100 970 25.75
Tax payable: non-refundable tax credits
An individual determines his tax payable by deducting from the tax calculated according to the tax table the value of the non-refundable tax credits to which he is entitled.
Non-refundable tax credits fall into three main categories.
— The first category includes personal tax credits (basic, handicap, age, retiree, medical expenses, and so on). They essentially seek to take into account the taxpayers’ ability to pay.
— The second category concerns certain tax preferences, in particular tax-advantaged funds, recent graduates, experienced workers and political contributions.
— The third category includes tax credits designed to ensure the integration of tax regimes (dividend tax credit) or to avoid international or interprovincial double taxation.
The Québec taxation system allows individuals to transfer to their spouses the unused portion of almost the entire amount of non-refundable tax credits.
Non-refundable tax credits
The taxation system also offers several tax preferences in the form of refundable tax credits. Their nature more closely resembles a transfer payment than a tax reduction, since an individual may benefit from them even if he has no tax payable. The tax credits are designed essentially to partially offset certain expenses. Most of them are intended for low- or middle-income households.
This category includes, among other things, the refundable tax credit for child assistance, the tax credit for childcare expenses, the solidarity tax credit, the refundable tax credit for informal caregivers of adult persons, the refundable tax credit attributing a work premium, and the refundable tax credit for adoption expenses.
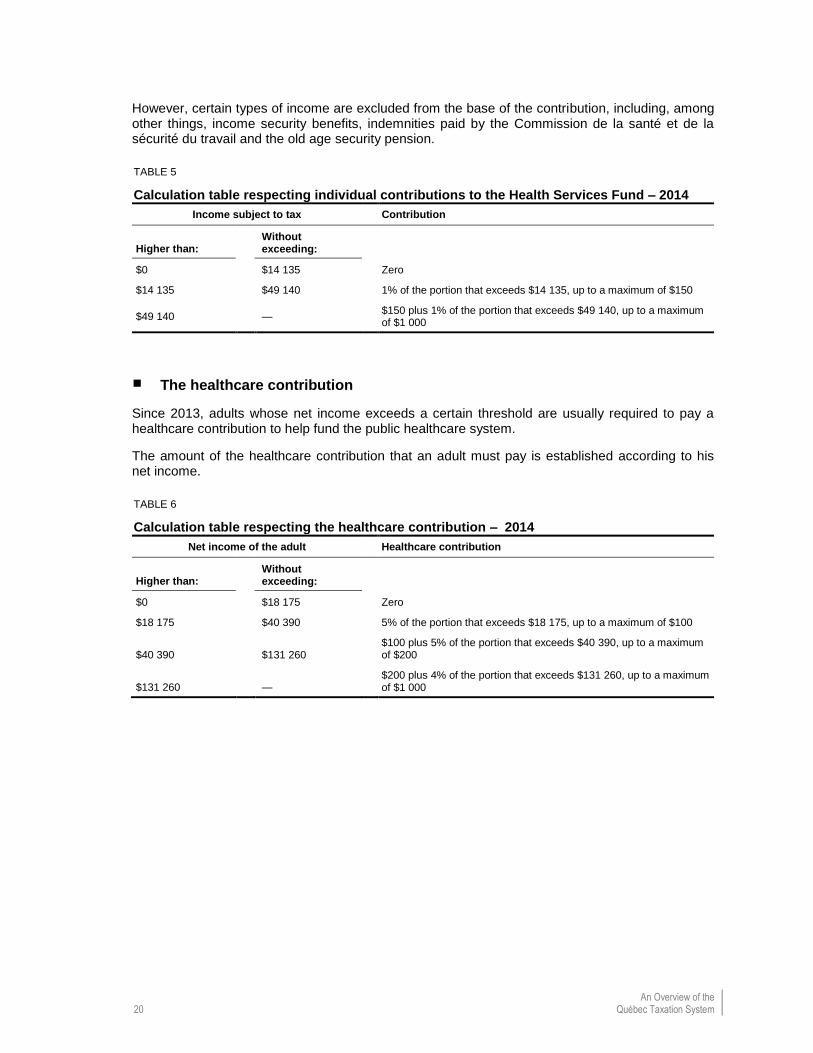
Individual contributions to the Health Services Fund
An individual who receives income other than employment income must pay a 1% contribution to the Health Services Fund in respect of the portion of such income that exceeds a defined threshold.
An Overview of the 20 Québec Taxation System
However, certain types of income are excluded from the base of the contribution, including, among other things, income security benefits, indemnities paid by the Commission de la santé et de la sécurité du travail and the old age security pension.
TABLE 5
Calculation table respecting individual contributions to the Health Services Fund – 2014
Income subject to tax Contribution
Higher than: Without exceeding:
$0 $14 135 Zero
$14 135 $49 140 1% of the portion that exceeds $14 135, up to a maximum of $150
$49 140 — $150 plus 1% of the portion that exceeds $49 140, up to a maximum of $1 000
The healthcare contribution
Since 2013, adults whose net income exceeds a certain threshold are usually required to pay a healthcare contribution to help fund the public healthcare system.
The amount of the healthcare contribution that an adult must pay is established according to his net income.
TABLE 6
Calculation table respecting the healthcare contribution – 2014
Net income of the adult Healthcare contribution
Higher than: Without exceeding:
$0 $18 175 Zero
$18 175 $40 390 5% of the portion that exceeds $18 175, up to a maximum of $100
$40 390 $131 260 $100 plus 5% of the portion that exceeds $40 390, up to a maximum of $200
$131 260 — $200 plus 4% of the portion that exceeds $131 260, up to a maximum of $1 000
Part 1: Taxation is a Tool to Fund Public Services 21
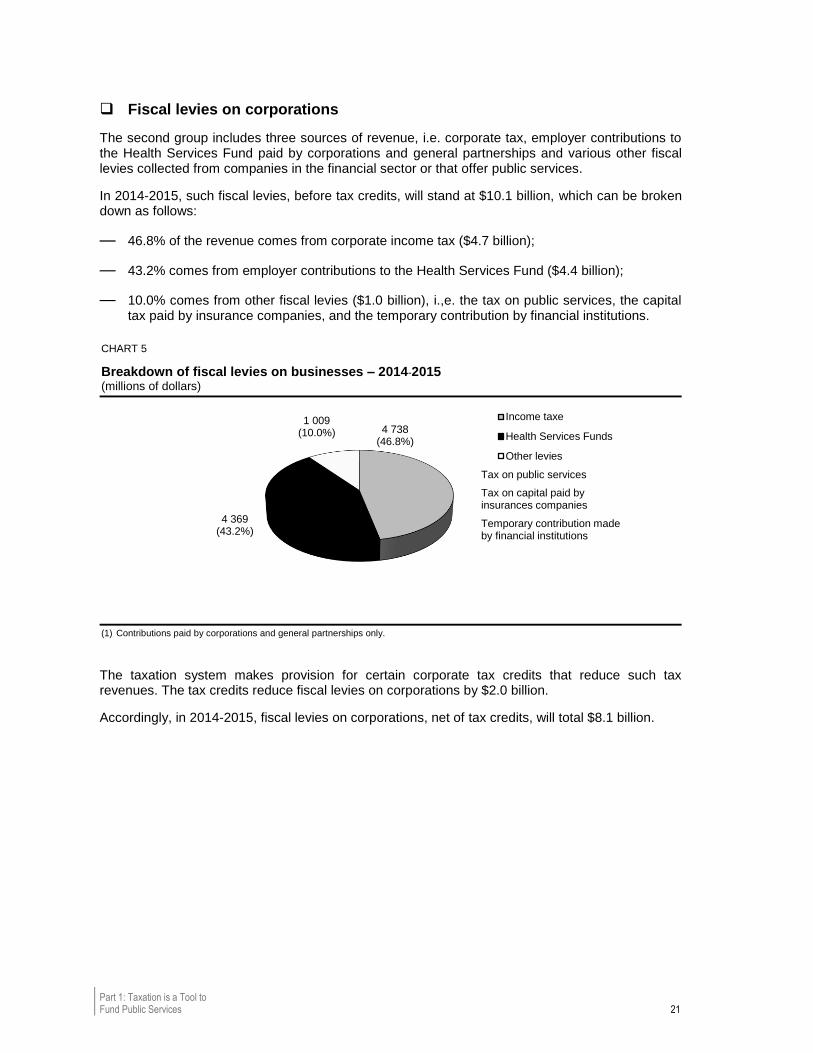
Fiscal levies on corporations
The second group includes three sources of revenue, i.e. corporate tax, employer contributions to the Health Services Fund paid by corporations and general partnerships and various other fiscal levies collected from companies in the financial sector or that offer public services.
In 2014-2015, such fiscal levies, before tax credits, will stand at $10.1 billion, which can be broken down as follows:
— 46.8% of the revenue comes from corporate income tax ($4.7 billion);
— 43.2% comes from employer contributions to the Health Services Fund ($4.4 billion);
— 10.0% comes from other fiscal levies ($1.0 billion), i.,e. the tax on public services, the capital tax paid by insurance companies, and the temporary contribution by financial institutions.
CHART 5
Breakdown of fiscal levies on businesses – 2014-2015
(millions of dollars)
(1) Contributions paid by corporations and general partnerships only.
The taxation system makes provision for certain corporate tax credits that reduce such tax revenues. The tax credits reduce fiscal levies on corporations by $2.0 billion.
Accordingly, in 2014-2015, fiscal levies on corporations, net of tax credits, will total $8.1 billion.
4 738(46.8%)
4 369(43.2%)
1 009(10.0%)
Income taxe
Health Services Funds
Other levies
Tax on public services
Tax on capital paid by insurances companies
Temporary contribution made by financial institutions
An Overview of the 22 Québec Taxation System
Corporate contributions to the Health Services Fund
All employers doing business in Québec must usually pay a contribution to the Health Services Fund based on the total remuneration paid to their employees.
The Health Services Fund was established to help fund Québec’s public healthcare system.
The contribution rate to the Health Services Fund ranges from 2.7% to 4.26% depending on the employer’s worldwide consolidated total payroll.
For a consolidated worldwide total payroll:
— of less than $1 million, the rate is 2.7%;
— of more than $5 million, the rate is 4.26%;
— between $1 million and $5 million, the rate increases linearly from 2.7% to 4.26%.
Part 1: Taxation is a Tool to Fund Public Services 23
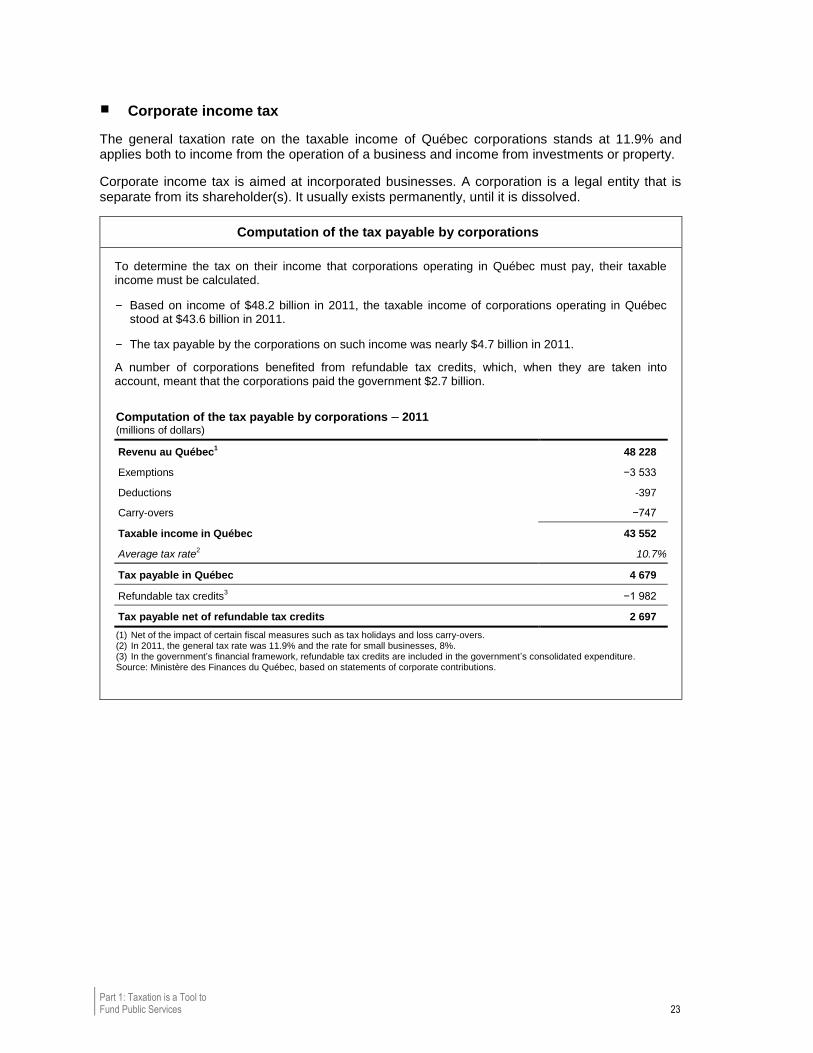
Corporate income tax
The general taxation rate on the taxable income of Québec corporations stands at 11.9% and applies both to income from the operation of a business and income from investments or property.
Corporate income tax is aimed at incorporated businesses. A corporation is a legal entity that is separate from its shareholder(s). It usually exists permanently, until it is dissolved.
Computation of the tax payable by corporations
To determine the tax on their income that corporations operating in Québec must pay, their taxable income must be calculated.
– Based on income of $48.2 billion in 2011, the taxable income of corporations operating in Québec stood at $43.6 billion in 2011.
– The tax payable by the corporations on such income was nearly $4.7 billion in 2011.
A number of corporations benefited from refundable tax credits, which, when they are taken into account, meant that the corporations paid the government $2.7 billion.
Computation of the tax payable by corporations – 2011 (millions of dollars)
Revenu au Québec1
48 228
Exemptions −3 533
Deductions -397
Carry-overs −747
Taxable income in Québec 43 552
Average tax rate2 10.7%
Tax payable in Québec 4 679
Refundable tax credits3
−1 982
Tax payable net of refundable tax credits 2 697
(1) Net of the impact of certain fiscal measures such as tax holidays and loss carry-overs. (2) In 2011, the general tax rate was 11.9% and the rate for small businesses, 8%. (3) In the government’s financial framework, refundable tax credits are included in the government’s consolidated expenditure. Source: Ministère des Finances du Québec, based on statements of corporate contributions.

An Overview of the 24 Québec Taxation System
Taxable income
Taxable income is determined in light of the net income recorded in a company’s financial statements. Net income is subject to a number of adjustments stipulated in tax legislation either with a view to limiting certain deductions or, to the contrary, in order to promote certain activities. Across-the-board measures include:
— accelerated depreciation;
— the deductibility of gifts.
Tax payable and tax credits
The corporation determines its tax payable by applying the tax rate stipulated to its taxable income. It then deducts from its tax payable the value of the tax credits to which it is entitled. If certain tax credits exceed the tax payable, the corporation may receive a refund equivalent to the surplus.
A corporation may benefit from tax credits insofar as it engages in specific activities that the government encourages explicitly.
Such targeted measures are intended to support activities or specific sectors such as research and development, the new economy, investment, the regions and culture.
Other fiscal levies applicable to corporations
Fiscal levies on corporations other than income tax and employer contributions to the HSF include:
— the capital tax paid by insurance companies;
— the capital tax paid by life insurance companies;
— the temporary contribution of financial institutions;
— the tax on public services.
Contributions on the total payroll
Employers are obliged to pay social contributions that are not accounted for as fiscal levies. Certain contributions are also partly paid by workers.
Employers must pay the provincial and federal governments various social contributions on the total payroll of their employees intended for the following schemes and organizations:
– the Québec Pension Plan;
– employment insurance;
– the Commission de la santé et de la sécurité du travail;
– the Québec Parental Insurance Plan;
– the Commission des normes du travail;
– the Fonds de développement et de reconnaissance des compétences de la main-d’œuvre.
Part 1: Taxation is a Tool to Fund Public Services 25
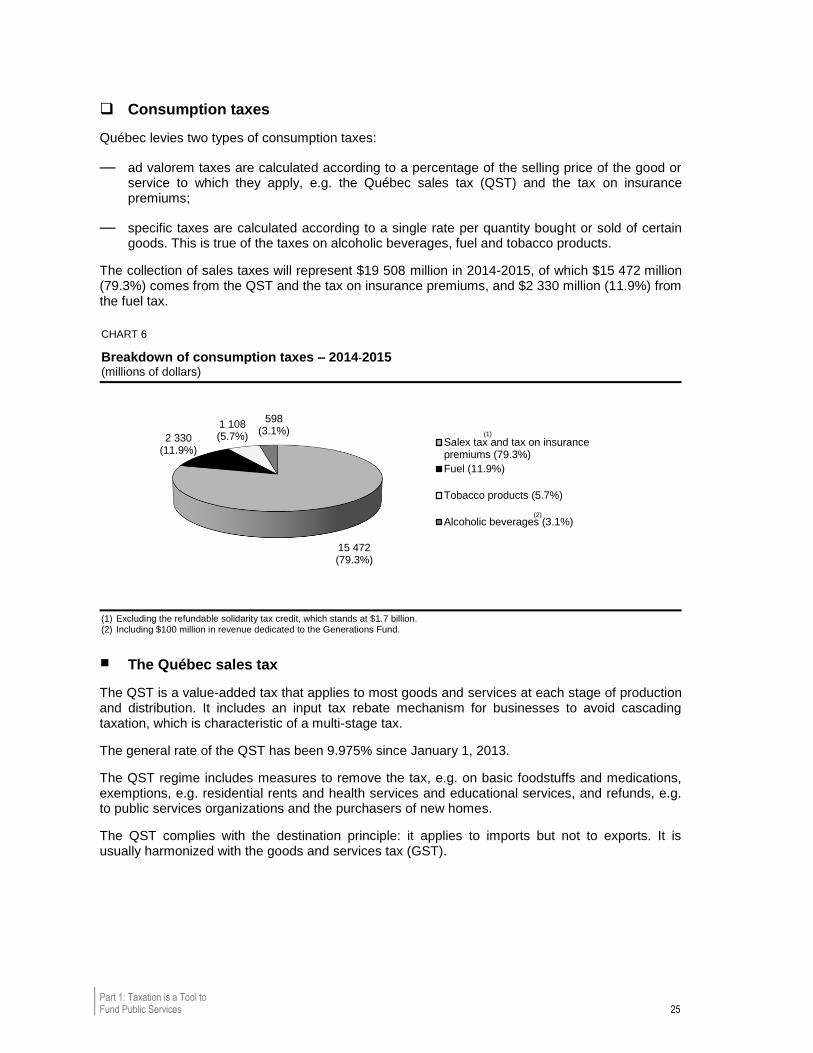
Consumption taxes
Québec levies two types of consumption taxes:
— ad valorem taxes are calculated according to a percentage of the selling price of the good or service to which they apply, e.g. the Québec sales tax (QST) and the tax on insurance premiums;
— specific taxes are calculated according to a single rate per quantity bought or sold of certain goods. This is true of the taxes on alcoholic beverages, fuel and tobacco products.
The collection of sales taxes will represent $19 508 million in 2014-2015, of which $15 472 million (79.3%) comes from the QST and the tax on insurance premiums, and $2 330 million (11.9%) from the fuel tax.
CHART 6
Breakdown of consumption taxes – 2014-2015
(millions of dollars)
(1) Excluding the refundable solidarity tax credit, which stands at $1.7 billion. (2) Including $100 million in revenue dedicated to the Generations Fund.
The Québec sales tax
The QST is a value-added tax that applies to most goods and services at each stage of production and distribution. It includes an input tax rebate mechanism for businesses to avoid cascading taxation, which is characteristic of a multi-stage tax.
The general rate of the QST has been 9.975% since January 1, 2013.
The QST regime includes measures to remove the tax, e.g. on basic foodstuffs and medications, exemptions, e.g. residential rents and health services and educational services, and refunds, e.g. to public services organizations and the purchasers of new homes.
The QST complies with the destination principle: it applies to imports but not to exports. It is usually harmonized with the goods and services tax (GST).
15 472(79.3%)
2 330(11.9%)
1 108(5.7%)
598(3.1%)
Salex tax and tax on insurancepremiums (79.3%)
Fuel (11.9%)
Tobacco products (5.7%)
Alcoholic beverages (3.1%)
(1)
(2)
An Overview of the 26 Québec Taxation System
The QST-GST harmonization agreement
The agreement concluded in March 2012 to more broadly harmonize the QST and the GST further simplified the administration of the taxes.
Under the agreement, Québec agreed to:
– eliminate the application of the QST on the GST;
– exempt financial services, which were exempted (tax-exempt sales do not give rise to ITRs for those who effect them, while tax-free sales do so);
– abolish the restrictions on ITRs of big businesses (gradual abolition between 2018 and 2020);
– maintain the base and the rules governing the harmonized QST with those of the GST/HST subject to 5% leeway (3% already used).
By way of compensation, Québec received $2.2 billion.
The tax on insurance premiums
Insurance premiums are subject to the tax on insurance premiums at the general rate of 9%. The rate is reduced to 5% in the case of automobile insurance premiums. However, the reduction does not apply to amounts payable to the Société de l’assurance automobile du Québec (SAAQ).
The tax does not apply, among other things, to individual life insurance, health or accident insurance premiums, nor to premiums payable under Québec’s prescription drug insurance plan.
The specific tax on alcoholic beverages
The specific tax on alcoholic beverages is calculated at a unitary rate per volume (cent per litre) and is collected by collection agents prior to final sale to consumers.
Since August 1, 2014, the rates applicable have been standardized, regardless of whether the beverages are consumed in the home or in an establishment. The following taxation rates have been in force since that date:
— beer, 63 centres per litre;
— wine and spirits, 140 cents per litre.
The tax on alcoholic beverages includes reductions in the rate in respect of products sold by microbreweries and small-scale producers.
Part 1: Taxation is a Tool to Fund Public Services 27
The specific tax on fuel
The specific tax on fuel is calculated at a unitary rate per volume (cent per litre) and is collected by collection agents prior to final sale to consumers.
The following tax rates have applied since April 1, 2013:
— gasoline, 19.2 centres per litre;
— diesel fuel (uncoloured fuel oil), 20.2 cents per litre;
— gasoline and kerosene for aircraft, 3 cents per litre;
— coloured fuel oil for rail locomotives, 3 cents per litre.
The fuel tax system makes provision for exemptions and refunds and reductions or increases in the rates in certain regions of Québec.
The specific tax on tobacco products
The specific tax on tobacco products is usually calculated at a unitary rate per volume (cent per gram) and is collected by collection agents prior to final sale to consumers.
However, in the case of cigarettes, the tax is calculated according to a unitary rate (cent per cigarette). In the case of cigars, the tax is calculated as a percentage of the taxable price of each cigar (ad-valorem tax).
The following tax rates have applied since June 5, 2014, depending on the products:
— cigarette, 14.9 cents per unit;
— loose tobacco or leaf tobacco, 14.9 cents per gram;
— cigar, 80% of the taxable price per unit;
— other tobacco products, 22.92 cents per gram.

An Overview of the 28 Québec Taxation System
Property taxes
Property taxes are a field of taxation that the municipalities and the school boards share.
Unlike income tax or the sales tax, property tax is levied on an asset (building or lot) rather than a monetary flow.
Municipal property tax
Local municipalities are the only municipal bodies empowered to levy property taxes. The Act respecting municipal taxation provides the main general framework for municipal taxation.
Property taxes are taxes levied on the value of property registered on the real estate assessment roll:
— throughout the territory of the municipality (general taxes);
— on a portion of the territory of a municipality (sector taxes or local improvement taxes).
The municipalities have the possibility of applying a property tax scheme at different rates according to different categories of property stipulated by legislation.
The assessment rolls provide the basis for levying property taxes. Municipal bodies (RCMs or major local municipalities) are responsible for producing the assessment rolls according to the standards and methods established by the Ministère des Affaires municipales et de l’Occupation du territoire »
School property tax
The school boards levy the school property tax on the value of properties registered on the real estate assessment roll of the municipalities included in their territory.
It is the school boards that are empowered to tax. They are authorized to levy and collect in their territory a tax on the value of taxable property.
The school property tax must be devoted to the organization of educational services. Limits are imposed in this respect concerning the revenue that can be generated and the tax rate applied:
— revenue may not exceed a maximum amount that the government determines each year;
— the tax rate set by the school boards may not exceed $0.35 per $100 of standardized property assessment.
The municipal property tax and school property tax schemes make provision for different types of exemptions, reductions and refunds.
TABLE 7
Changes in property taxes
(millions of dollars)
2011 2012 2013
Municipal property tax 8 519 8 987 9 377
School property tax1 1 489 1 555 1 798
(1) Data for the school year (July 1 to June 30). Sources: Ministère des Affaires municipales et de l’Occupation du territoire and Ministère de l’Éducation, du Loisir et du Sport.

Part 1: Taxation is a Tool to Fund Public Services 29
Revenues of government corporations 3.2
Revenues from government corporations are a second means on which the government relies to fund public services.
Such corporations are varied:
— government enterprises, mainly big commercial government corporations such as Hydro-Québec, Loto-Québec and the Société des alcools du Québec;
— other government corporations, including the Société des établissements de plein air du Québec, the Société des traversiers du Québec or the Société québécoise des infrastructures.
Government enterprises had overall sales of $19.9 billion in 2012-2013. The value of their assets stood at $80.1 billion and the value of their holdings at $23.0 billion as at March 31, 2013.
Among the revenues of government corporations, those from government enterprises should total $5.1 billion in 2014-2015.
TABLE 8
Changes in revenues from government enterprises
(millions of dollars)
2013-2014 2014-2015
Hydro-Québec 3 345 3 050
Loto-Québec 1 055 1 065
Société des alcools du Québec 1 003 1 021
Other 41 40
Subtotal 5 444 5 176
Hydro-Québec revenue allocated to the Generations Fund
1 ― -71
TOTAL 5 444 5 105
(1) Corresponds to the amounts related to the indexing of the price of heritage pool electricity.
An Overview of the 30 Québec Taxation System
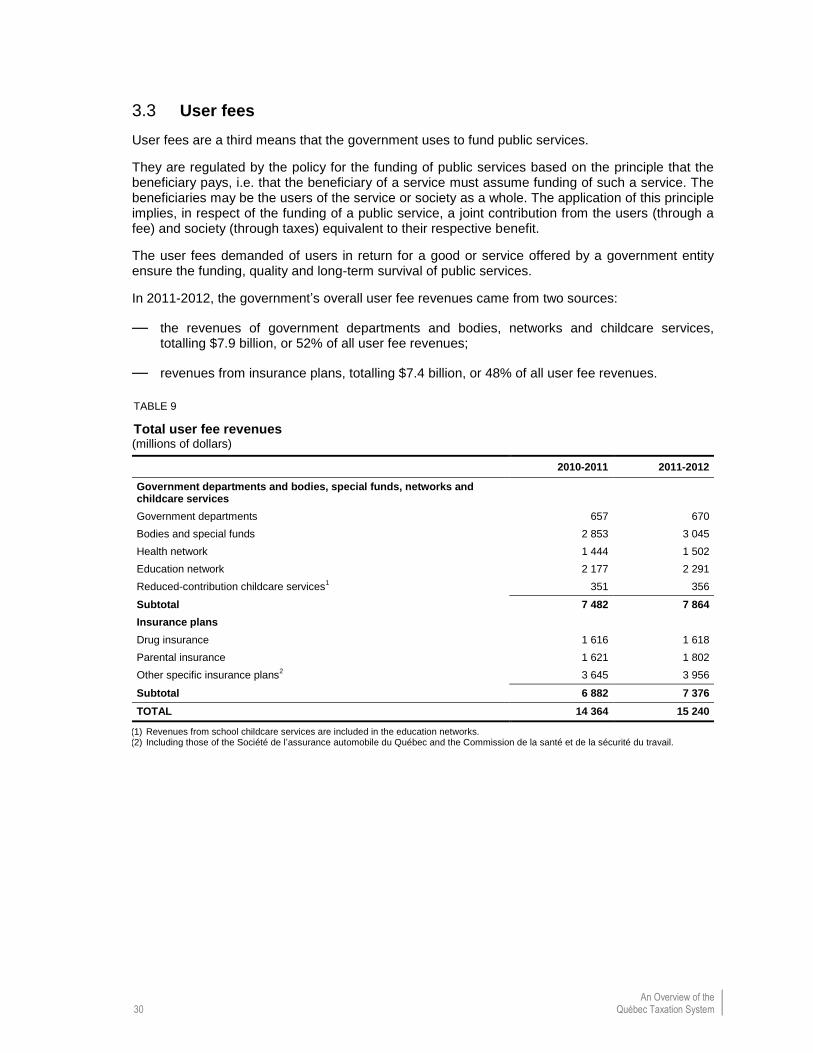
User fees 3.3
User fees are a third means that the government uses to fund public services.
They are regulated by the policy for the funding of public services based on the principle that the beneficiary pays, i.e. that the beneficiary of a service must assume funding of such a service. The beneficiaries may be the users of the service or society as a whole. The application of this principle implies, in respect of the funding of a public service, a joint contribution from the users (through a fee) and society (through taxes) equivalent to their respective benefit.
The user fees demanded of users in return for a good or service offered by a government entity ensure the funding, quality and long-term survival of public services.
In 2011-2012, the government’s overall user fee revenues came from two sources:
— the revenues of government departments and bodies, networks and childcare services, totalling $7.9 billion, or 52% of all user fee revenues;
— revenues from insurance plans, totalling $7.4 billion, or 48% of all user fee revenues.
TABLE 9
Total user fee revenues
(millions of dollars)
2010-2011 2011-2012
Government departments and bodies, special funds, networks and childcare services
Government departments 657 670
Bodies and special funds 2 853 3 045
Health network 1 444 1 502
Education network 2 177 2 291
Reduced-contribution childcare services1 351 356
Subtotal 7 482 7 864
Insurance plans
Drug insurance 1 616 1 618
Parental insurance 1 621 1 802
Other specific insurance plans2 3 645 3 956
Subtotal 6 882 7 376
TOTAL 14 364 15 240
(1) Revenues from school childcare services are included in the education networks. (2) Including those of the Société de l’assurance automobile du Québec and the Commission de la santé et de la sécurité du travail.
Part 1: Taxation is a Tool to Fund Public Services 31
4. THE APPROACH ADOPTED BY QUÉBEC TO FUND PUBLIC SERVICES
Québec thus has available several sources of revenue to fund public services.
— The government relies on budget organization structures including, mainly, the general fund and the special funds to allocate to public services the resources needed to ensure their operation.
— In practical terms, public services are funded simultaneously from several sources of revenue, i.e. the government’s contributions, mainly drawn from taxes, and revenues collected directly from users in the form of user fees.
Below are three examples of the approach that Québec has adopted to fund public services, i.e. the respective weight of the government’s contributions and user fees in the health, education and transportation infrastructure sectors.
An Overview of the 32 Québec Taxation System
The general fund, special funds and other budget organization 4.1structures
From the standpoint of accounting, the government conveys funds earmarked for public services mainly through the general fund or the special funds, both of which make up the Consolidated Revenue Fund. The two budget structures correspond to specific objectives pertaining to the funding of public services. The government also relies on other budget organization structures to allocate resources to fund public services.
The consolidated revenue earmarked for funding public services will stand at $96.4 billion in 2014-2015.
The general fund
The general fund includes money collected or received from various sources, in respect of which Parliament exercises an allocation right, mainly the expenditures of general fund headed by a minister whose budget is funded by appropriations allocated by the National Assembly.
In Québec, public services are funded in a traditional manner by means of the general fund. This approach affords the government and the National Assembly maximum leeway.
The revenues from the general fund allocated to funding public services will represent a total of $71.4 billion in 2014-2015.
The special funds
A special fund is an accounting entity included in the Consolidated Revenue Fund that makes it possible to independently manage funds earmarked for a specific purpose and to separately account for their use. The objective is to establish a direct, explicit link between certain revenues and the service funded.
A special fund allows for the establishment of a separate cost centre to ascertain all of the expenditures inherent in an activity or a program and to link the expenditures to the sources of revenue that are allocated to the activity or program.
A special fund is not a legal entity and does not enjoy the civil rights ascribed to legal persons, i.e. it is not empowered to enter into contracts with third parties and to assume civil liability.
A special fund is established by legislation in the statute of the government department responsible or through a specific statute.
The enabling legislation of a special fund specifies, in particular, the type of revenues that make up the fund and their specific allocation. It may assign certain powers to the minister responsible that take into account the nature of the fund’s activities.
The revenues allocated to funding public services drawn from the special funds will stand at $11.9 billion in 2014-2015.

Part 1: Taxation is a Tool to Fund Public Services 33
Other budget organization structures
Other budget organization structures include, in particular, the health and social services and the education networks, non-budget-funded bodies and specified purpose accounts. These structures collect revenues that are assigned to funding public services.
For 2014-2015, revenues from other budget organization structures will stand at $67.2 billion and mainly include transfers from the general fund.
TABLE 10
Consolidated revenue allocated to funding public services
(billions of dollars)
2013-2014 2014-2015
General fund 69.5 71.4
Special funds1 11.0 11.9
Other budget organization structures 65.8 67.2
Consolidation adjustments2 −52.6 −54.1
TOTAL 93.7 96.4
(1) Including the Generations Fund. (2) Reclassification of abatements and consolidation adjustments stemming primarily from the elimination of intergovernmental unit
transactions between entities in different sectors.
An Overview of the 34 Québec Taxation System
Three examples of funding public services 4.2
In concrete terms, it is important to grasp how the government uses the sources of revenue available to it to fund the public services that it offers.
We have chosen three examples of public services that Québec provides, i.e. healthcare, education and transportation infrastructure, and present in each case:
— the portion of funding of the public service that the government assumes directly;
— the portion covered by user fees.
Healthcare
In 2011-2012, healthcare funding stood at $34.0 billion. Such funding came from:
— taxes ($22.7 billion);
— user fee revenues ($3.2 billion);
— the healthcare contribution ($0.6 billion);
— other sources, in particular contributions from the federal government and certain public bodies ($7.5 billion).
Healthcare expenditures 2011-2012 comprised:
— regional functions (establishments, agencies, and so on) ($20.9 billion);
— the Régie de l’assurance maladie du Québec ($9.0 billion);
— other expenditures totalling $4.2 billion, in particular the expenditures of the Fund to Finance Health and Social Services Institutions (FINESSS) and the cost of drugs and pharmaceutical services assumed by individuals insured by the public prescription drug insurance plan.
User fee revenues accounted for 9.4% of total expenditures in the health sector and come primarily from:
— prescription drug insurance ($1.6 billion);
— the health network ($1.5 billion).
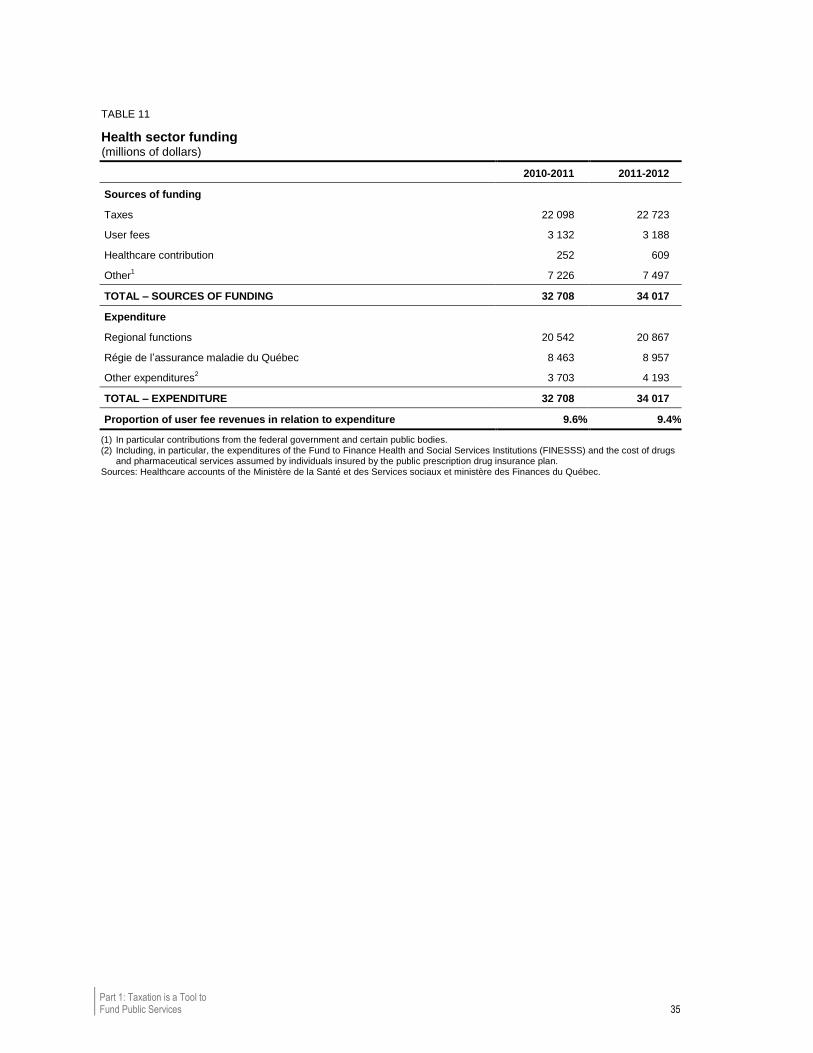
Part 1: Taxation is a Tool to Fund Public Services 35
TABLE 11
Health sector funding
(millions of dollars)
2010-2011 2011-2012
Sources of funding
Taxes 22 098 22 723
User fees 3 132 3 188
Healthcare contribution 252 609
Other1 7 226 7 497
TOTAL – SOURCES OF FUNDING 32 708 34 017
Expenditure
Regional functions 20 542 20 867
Régie de l’assurance maladie du Québec 8 463 8 957
Other expenditures2 3 703 4 193
TOTAL – EXPENDITURE 32 708 34 017
Proportion of user fee revenues in relation to expenditure 9.6% 9.4%
(1) In particular contributions from the federal government and certain public bodies. (2) Including, in particular, the expenditures of the Fund to Finance Health and Social Services Institutions (FINESSS) and the cost of drugs
and pharmaceutical services assumed by individuals insured by the public prescription drug insurance plan. Sources: Healthcare accounts of the Ministère de la Santé et des Services sociaux et ministère des Finances du Québec.

An Overview of the 36 Québec Taxation System
Drug insurance plan
The Québec public prescription drug insurance plan was implemented on January 1, 1997. Registration in the plan is compulsory for individuals who are not covered by a private plan.
User fee revenues
In addition to the premium paid when individuals file their income tax returns, insured parties must pay a percentage of the cost of drugs. A maximum monthly contribution is set and any surplus is billed to the plan.
The cost of the drug insurance plan, which totalled $4.0 billion in 2011-2012, includes both the government’s expenditures and the costs that users assume. Users assumed 40.1% of the cost in 2011-2012.
Funding by type of insured party
Last-resort financial assistance beneficiaries obtain the drugs they need free of charge. Seniors 65 years of age or over assumed 39.0% of the cost of their drugs. The proportion among other insured parties was 73.1%.
Funding of the public prescription drug insurance plan, by type of insured party, in 2011-2012 (millions of dollars)
Last-resort financial
assistance beneficiaries
Individuals 65 years of age or
over
Other insured parties Total
Taxes 693 1 480 248 2 420
User fees
Premiums 0 433 431 864
Contributions (deductible and coinsurance) 0 513 241 754
Subtotal, user fees 0 946 672 1 618
TOTAL FUNDING 693 2 426 920 4 038
Proportion of premiums and contributions in relation to funding 0.0% 39.0% 73.1% 40.1%
Part 1: Taxation is a Tool to Fund Public Services 37
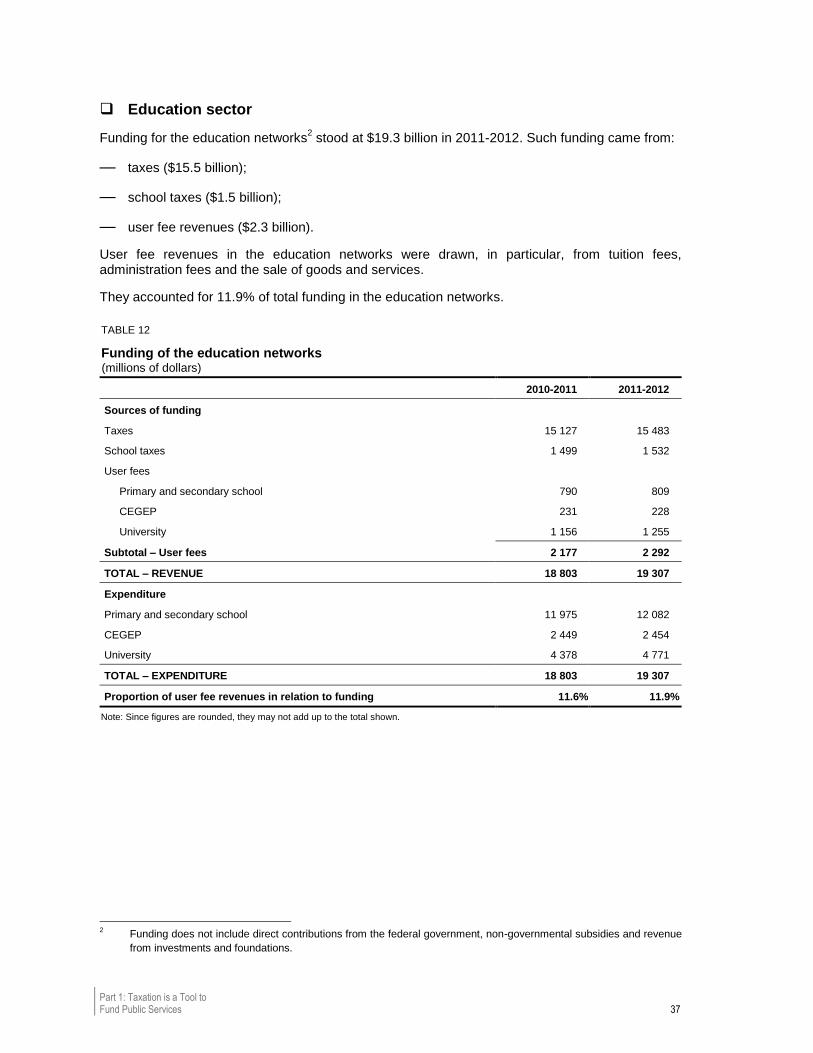
Education sector
Funding for the education networks2 stood at $19.3 billion in 2011-2012. Such funding came from:
— taxes ($15.5 billion);
— school taxes ($1.5 billion);
— user fee revenues ($2.3 billion).
User fee revenues in the education networks were drawn, in particular, from tuition fees, administration fees and the sale of goods and services.
They accounted for 11.9% of total funding in the education networks.
TABLE 12
Funding of the education networks (millions of dollars)
2010-2011 2011-2012
Sources of funding
Taxes 15 127 15 483
School taxes 1 499 1 532
User fees
Primary and secondary school 790 809
CEGEP 231 228
University 1 156 1 255
Subtotal – User fees 2 177 2 292
TOTAL – REVENUE 18 803 19 307
Expenditure
Primary and secondary school 11 975 12 082
CEGEP 2 449 2 454
University 4 378 4 771
TOTAL – EXPENDITURE 18 803 19 307
Proportion of user fee revenues in relation to funding 11.6% 11.9%
Note: Since figures are rounded, they may not add up to the total shown.
2 Funding does not include direct contributions from the federal government, non-governmental subsidies and revenue
from investments and foundations.
An Overview of the 38 Québec Taxation System
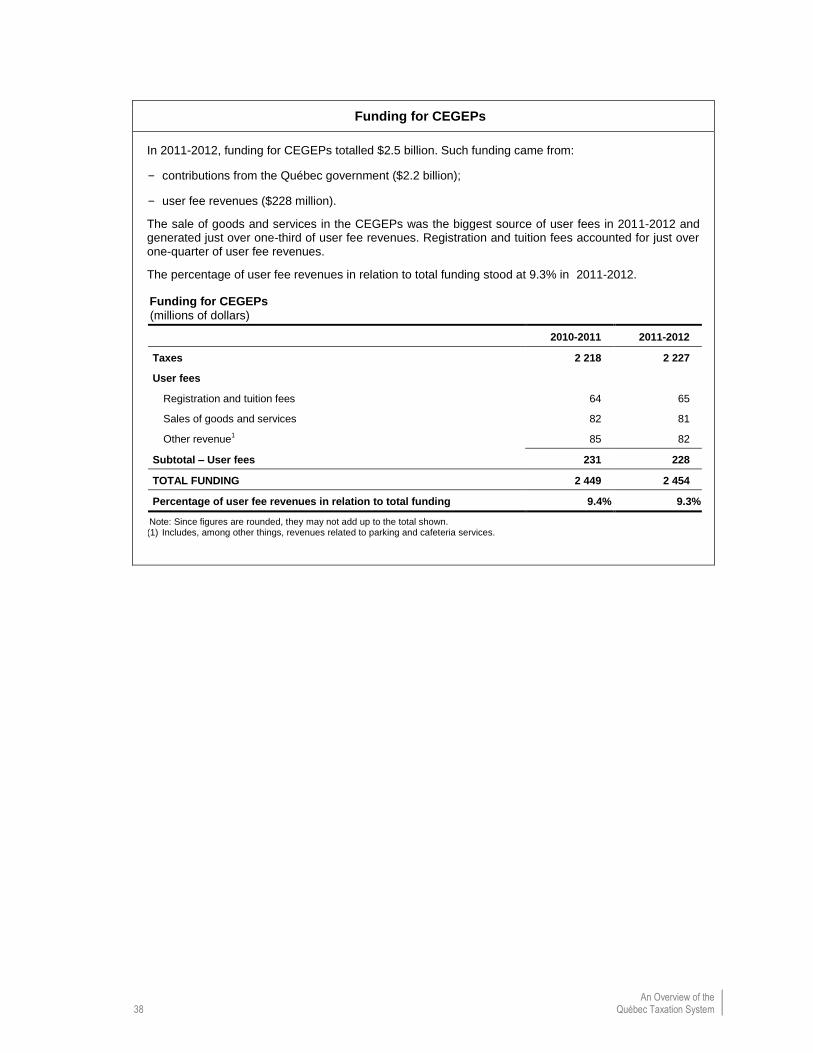
Funding for CEGEPs
In 2011-2012, funding for CEGEPs totalled $2.5 billion. Such funding came from:
– contributions from the Québec government ($2.2 billion);
– user fee revenues ($228 million).
The sale of goods and services in the CEGEPs was the biggest source of user fees in 2011-2012 and generated just over one-third of user fee revenues. Registration and tuition fees accounted for just over one-quarter of user fee revenues.
The percentage of user fee revenues in relation to total funding stood at 9.3% in 2011-2012.
Funding for CEGEPs
(millions of dollars)
2010-2011 2011-2012
Taxes 2 218 2 227
User fees
Registration and tuition fees 64 65
Sales of goods and services 82 81
Other revenue1 85 82
Subtotal – User fees 231 228
TOTAL FUNDING 2 449 2 454
Percentage of user fee revenues in relation to total funding 9.4% 9.3%
Note: Since figures are rounded, they may not add up to the total shown. (1) Includes, among other things, revenues related to parking and cafeteria services.

Part 1: Taxation is a Tool to Fund Public Services 39
Funding for university education
In 2011-2012, funding for university education totalled $4.8 billion. Such funding came from:
– contributions from the Québec government ($3.5 billion);
– user fee revenues ($1.3 billion).
In 2011-2012, tuition fees totalled $495 million and were the main source of user fee revenues.
The percentage of user fee revenues in relation to total funding for university education stood at 26.3% in 2011-2012.
Funding for university education (millions of dollars)
2010-2011 2011-2012
Taxes 3 222 3 516
User fees
Tuition fees 460 495
Admission and registration fees and fines 104 122
Lump sums paid by non-resident Canadian students 43 46
Lump sums paid by foreign students 115 119
Other revenue(1)
434 473
Subtotal – User fees 1 156 1 255
TOTAL FUNDING 4 378 4 771
Proportion of user fee revenues in relation to total funding 26.4% 26.3%
(1) Includes contributions to student services, sales to students and external sales.
1 The contribution from students in relation to the overall revenues of Québec universities, presented in the 2011-2012 Budget Speech, is a different concept from that of user fee revenues in relation to funding presented here. Indeed, contributions from students are confined to tuition fees and other direct fees and overall revenues include, in addition to contributions from the Québec government and user fee revenues, direct contributions from the federal government, donations, non-governmental grants and investment income.
An Overview of the 40 Québec Taxation System
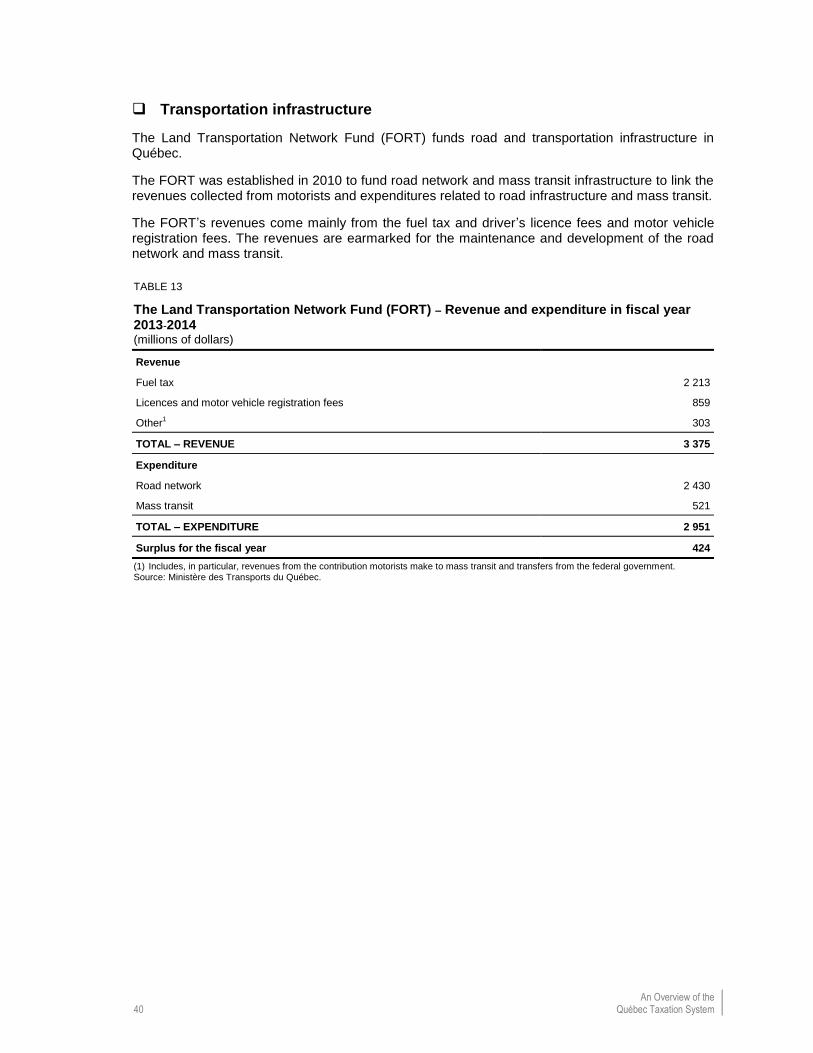
Transportation infrastructure
The Land Transportation Network Fund (FORT) funds road and transportation infrastructure in Québec.
The FORT was established in 2010 to fund road network and mass transit infrastructure to link the revenues collected from motorists and expenditures related to road infrastructure and mass transit.
The FORT’s revenues come mainly from the fuel tax and driver’s licence fees and motor vehicle registration fees. The revenues are earmarked for the maintenance and development of the road network and mass transit.
TABLE 13
The Land Transportation Network Fund (FORT) – Revenue and expenditure in fiscal year 2013-2014
(millions of dollars)
Revenue
Fuel tax 2 213
Licences and motor vehicle registration fees 859
Other1 303
TOTAL – REVENUE 3 375
Expenditure
Road network 2 430
Mass transit 521
TOTAL – EXPENDITURE 2 951
Surplus for the fiscal year 424
(1) Includes, in particular, revenues from the contribution motorists make to mass transit and transfers from the federal government.
Source: Ministère des Transports du Québec.
Part 2: Taxation and the Socioeconomic Role of the State 41
PART 2: TAXATION AND THE SOCIOECONOMIC ROLE OF THE STATE
Taxation is not just a tool to fund public services.
By collecting financial resources to fund public services, the government affects the behaviour of economic agents, both individuals and enterprises and organizations. It is, therefore, logical for the government to use the taxation system to implement certain public policies and assume its socioeconomic responsibilities, independently of the delivery of public services. The Québec government is no exception in this regard since it has established numerous tax expenditures that enable it to fulfill its responsibilities.
Part 2 of this document examines three of these responsibilities:
— the redistribution of wealth;
— support for economic policy; and
— family, social and environmental policies.


Part 2: Taxation and the Socioeconomic Role of the State 43
1. TAXATION AS A MEANS OF REDISTRIBUTING WEALTH
All of the developed countries use the personal income tax system to redistribute wealth in order to reduce income inequality
through:
— the implementation of progressive taxes;
— the payment of transfers by means of taxes, often in the form of specific tax credits.
An Overview of the 44 Québec Taxation System
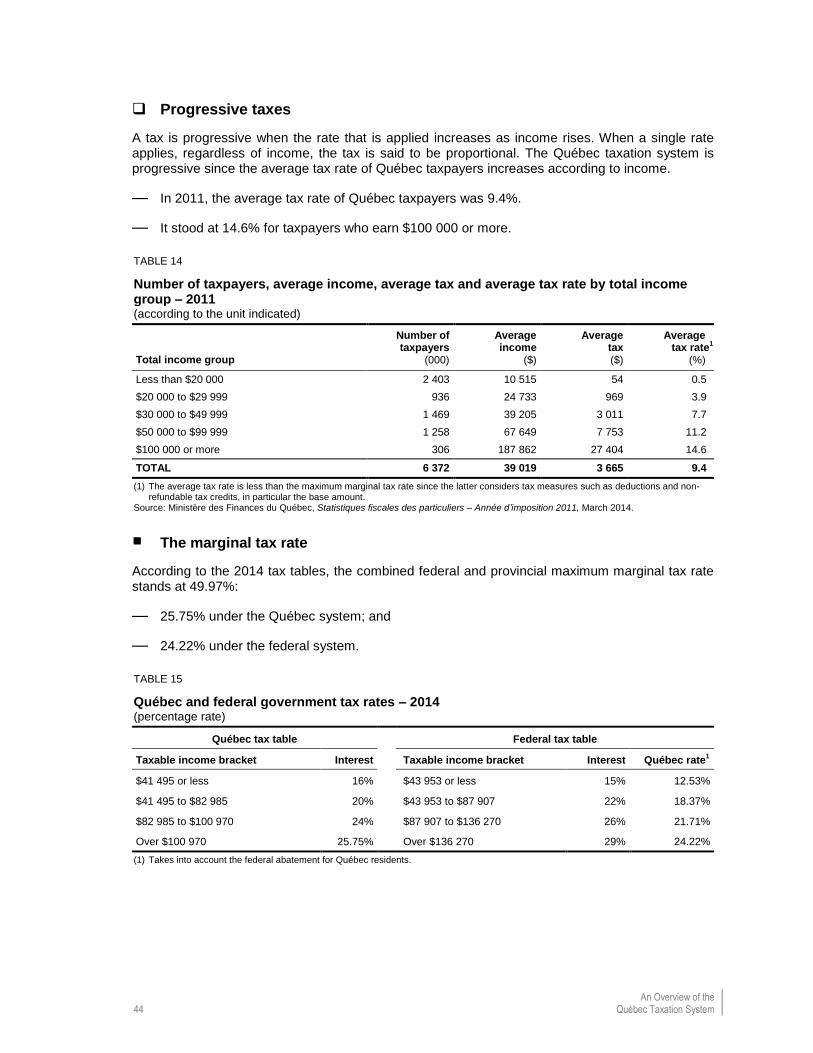
Progressive taxes
A tax is progressive when the rate that is applied increases as income rises. When a single rate applies, regardless of income, the tax is said to be proportional. The Québec taxation system is progressive since the average tax rate of Québec taxpayers increases according to income.
— In 2011, the average tax rate of Québec taxpayers was 9.4%.
— It stood at 14.6% for taxpayers who earn $100 000 or more.
TABLE 14
Number of taxpayers, average income, average tax and average tax rate by total income group – 2011
(according to the unit indicated)
Total income group
Number of taxpayers
(000)
Average income
($)
Average tax ($)
Average tax rate
1
(%)
Less than $20 000 2 403 10 515 54 0.5
$20 000 to $29 999 936 24 733 969 3.9
$30 000 to $49 999 1 469 39 205 3 011 7.7
$50 000 to $99 999 1 258 67 649 7 753 11.2
$100 000 or more 306 187 862 27 404 14.6
TOTAL 6 372 39 019 3 665 9.4
(1) The average tax rate is less than the maximum marginal tax rate since the latter considers tax measures such as deductions and non-refundable tax credits, in particular the base amount.
Source: Ministère des Finances du Québec, Statistiques fiscales des particuliers – Année d’imposition 2011, March 2014.
The marginal tax rate
According to the 2014 tax tables, the combined federal and provincial maximum marginal tax rate stands at 49.97%:
— 25.75% under the Québec system; and
— 24.22% under the federal system.
TABLE 15
Québec and federal government tax rates – 2014 (percentage rate)
Québec tax table Federal tax table
Taxable income bracket Interest Taxable income bracket Interest Québec rate1
$41 495 or less 16% $43 953 or less 15% 12.53%
$41 495 to $82 985 20% $43 953 to $87 907 22% 18.37%
$82 985 to $100 970 24% $87 907 to $136 270 26% 21.71%
Over $100 970 25.75% Over $136 270 29% 24.22%
(1) Takes into account the federal abatement for Québec residents.

Part 2: Taxation and the Socioeconomic Role of the State 45
The impact on taxpayers of tax rates
Roughly 37% of taxpayers in Québec do not pay income tax, mainly because of their low income.
Taxpayers with income under $50 000 pay 23% of the tax payable but account for 75% of taxpayers.
On the other hand, taxpayers with incomes of $50 000 or more pay 77% of the tax payable but account for only 25 % of taxpayers. More specifically, taxpayers with incomes over $100 000 assume 36% of the tax payable but account for only 5% of taxpayers.
CHART 7
Breakdown of taxpayers and tax payable by total income group – 2011
(as a percentage)
Source: Ministère des Finances du Québec, Statistiques fiscales des particuliers – Année d’imposition 2011, March 2014.
Share of taxpayers Share of tax payable
Do not pay income tax
Pay tax on income of less than $50 000$
Pay tax on income of between $50 000 and $100 000
Pay tax on income of over $100 000
36.6% of taxpayers
38.8% of taxpayers
19.8% of taxpayers
4.8% of taxpayers
0% of tax payable
23.4% of tax payable
40.7% of tax payable
35.9% of tax payable

An Overview of the 46 Québec Taxation System
Funding of transfers
Aside from seeking to establish a progressive taxation system, the distribution of wealth is also achieved through transfers funded by the taxes collected.
Under the taxation system, social transfers are mainly granted in the form of refundable tax credits that entitle taxpayers to a tax refund when the value of the assistance exceeds the tax payable.
The main refundable tax credits are child assistance, the work premium, the solidarity tax credit, the tax credit for childcare expenses and the tax credit for home-support services for seniors.
The refundable tax credits mainly benefit low- or middle-income households because they are deductible according to family income.
Between 2005 and 2013, the cost of the main refundable tax credits rose from $3.3 billion to $5.2 billion, an average annual increase of 5.7%.
TABLE 16
Tax expenditures stemming from the main refundable tax credits – 2005 to 2013
(millions of dollars)
2005 2006 2007 2008 2009 2010 2011 2012 2013
Tax credit for home-support services for seniors 91 107 158 205 225 246 267 283 312
Solidarity tax credit ― ― ― ― ― ― 696 1 664 1 721
Tax credit for the Québec sales tax 466 480 499 519 519 540 ― ― ―
Property tax refunds 244 250 270 280 294 316 342 ― ―
Child assistance 1 974 2 037 2 055 2 042 2 063 2 050 2 065 2 093 2 140
Supplement for children with disabilities 42 62 66 68 73 74 78 80 82
Tax credit for childcare expenses 166 167 172 200 282 341 413 482 557
Medical expense tax credit 23 31 35 39 44 47 48 48 50
Work premium 336 358 357 352 360 357 351 327 331
TOTAL 3 342 3 492 3 612 3 705 3 860 3 971 4 260 4 977 5 193
Part 2: Taxation and the Socioeconomic Role of the State 47
2. TAXATION AS A MEANS OF SUPPORTING ECONOMIC POLICY
The government relies on taxation to support its economic policy, i.e. to support economic stability and promote economic growth.
Support economic stability and promote economic growth
The government resorts to taxation to:
— spur economic growth during economic downturns;
— support certain regions with less extensive economic diversity;
— support certain specific industries that are more sensitive to economic cycles.
Many arguments have been put forward to foster a taxation system that promotes economic stability and economic growth for businesses and households. Taxation reduces the vulnerability of certain enterprises and uncertainty that economic swings may engender. Such an environment encourages:
— job creation and businesses;
— savings and investment;
— the expansion of Québec corporations;
— economic growth.
Taxation is a tool that is widely used to spur the determinants of growth in productivity:
— human capital;
— technological progress;
— physical capital.
A stable taxation system that is competitive at the international level can increase foreign investment against a backdrop of heightened competition between jurisdictions.
In recent years, the government has elaborated a series of fiscal measures to support its economic policy. The measures fall into two groups:
— measures intended for businesses; and
— measures aimed at individuals.

An Overview of the 48 Québec Taxation System
Measures intended for businesses 2.1
Measures intended for Québec businesses to promote economic stability and economic growth can be divided into two main categories:
— general measures; and
— specific measures.
General measures
General measures are offered to all businesses.
They include:
— accelerated depreciation; and
— the reduced tax rate for SMEs.
Specific measures
Specific measures apply solely to certain activities, industries or regions.
Measures that offer specific tax assistance to certain strategic economic sectors
Such measures include, in particular:
— the research and development tax credit;
— the tax credit for the development of e-business;
— the tax credit for the production of multimedia titles;
— the tax credit relating to resources.
Measures that offer tax assistance to certain regions
Such measures include, in particular:
— the tax credit for the Gaspé Peninsula and certain maritime regions of Québec;
— the additional deduction for the transportation costs of remote manufacturing SMEs;
— increased rates on the investment tax credit for enterprises in resource regions.

Part 2: Taxation and the Socioeconomic Role of the State 49
Measures aimed at individuals 2.2
Numerous tax measures designed to enhance Québec’s economic outlook have been adopted to influence the behaviour of individuals.
The tax measures fall into two separate groups, depending on whether they are intended to provide:
— support for labour; and
— support for saving.
Support for labour
Measures aimed at supporting labour have several specific objectives, which include encouraging people to work, acknowledging expenses incurred to this end, and fostering the recruitment of workers.
This is especially true of:
— the work premium;
— the deduction for workers;
— the tax credit for new graduates working in remote resource regions.
Support for saving
Support for saving is intended to encourage saving by Québec households, i.e. general saving, retirement savings or saving for other targeted objectives.
The government has implemented fiscal measures, in particular to harmonize them with measures that the federal government has adopted and aimed at various clienteles.
Such measures include:
— the tax-free savings account (TFSA);
— the registered retirement savings plan (RRSP);
— the registered pension plan (RPP);
— the registered education savings plan (RESP);
— the voluntary retirement savings plan (VRSP).

Part 2: Taxation and the Socioeconomic Role of the State 51
3. TAXATION TO SUPPORT FAMILY, SOCIAL AND ENVIRONMENTAL POLICIES
Apart from funding public services, the redistribution of wealth and support for economic policy, governments rely on taxation to implement family, social and environmental policies.
The Québec government is no exception in this respect and uses taxation in addition to its budgetary programs to attain its objectives in the family, social and environmental spheres.
Family policy
Québec’s current family policy has been implemented gradually since the late 1990s. It covers three sections that family policies in the developed countries encompass, i.e. family allowances, childcare services and work-family balance, and hinges extensively on fiscal measures.
In 2013, Québec’s family policy engendered an overall expenditure for the government of $7.8 billion.
Several measures under the policy are of a budgetary nature but others are of a fiscal nature.
Family allowances offer families financial support
Financial support for families is provided primarily through a fiscal measure, the refundable tax credit for child assistance, which provided $2.2 billion in assistance in 2013.
Financial support for families also includes non-refundable tax credits for dependent children engaged in occupational training or postsecondary studies.
Government assistance for childcare expenses
The refundable tax credit for childcare expenses is a form of tax assistance on the order of $560 million, in addition to government expenditures of $2.3 billion under the reduced-contribution childcare services program.

An Overview of the 52 Québec Taxation System
Social policy: the refundable solidarity tax credit
The objectives of social policy are implemented by means of budget measures and fiscal measures.
From the standpoint of taxation, the solidarity tax credit is granted to low- or middle-income households to mitigate the cost of the Québec sales tax (QST) and housing and recognizes that the cost of living is higher in Northern villages than elsewhere in Québec.
The tax credit comprises three sections:
— a component to compensate for the QST;
— a component aimed at households that assume eligible housing expenses;
— a component for individuals living in Northern villages.
The amount of the tax credit determined is paid monthly to eligible households.

Part 2: Taxation and the Socioeconomic Role of the State 53
Environmental policy
The developed countries have resorted fairly recently and increasingly to taxation to support environmental policy.
Green taxation
So-called “green taxation”3 can be defined as a fiscal strategy aimed at protecting the environment,
fostering sustainable development and promoting the green economy. It consists primarily in better aligning the government’s economic and environmental objectives.
It can, in particular, be reflected by fiscal measures designed to alter the market price of certain goods and services that have an adverse or beneficial impact on the environment.
— The price signal that such measures send to economic agents makes it possible to influence their behaviour to make them more environmentally responsible.
— Ideal green taxation sends a simple, clear, stable price signal that individuals and businesses can anticipate so as to encourage behaviour that is favourable to the environment. This assumes the appropriate choice of tax bases, tax rates that rectify externalities and clear provisions to ensure proper understanding by the economic agents concerned.
Measures stemming from green taxation can take different forms, such as a tax, a tax refund, a charge, a fee, a tax credit, a deduction or a tax exemption.
Fiscal measures can act as incentives, penalties or be of a compensatory nature.
— The measures act as incentives when they encourage economic actors to engage in environmentally responsible behaviour. This is true of a tax credit that subsidizes desirable ecological behaviour.
— The measures act as penalties when they discourage economic agents from engaging in polluting activities. A tax may apply to greenhouse gas emissions that businesses emit to encourage them to review their production methods in order to possibly reduce airborne pollutants (ecotax).
— Measures are of a compensatory nature in the case of essentially penalizing measures such as an ecotax, the proceeds from which are used to remedy certain market inefficiencies, such as the reduction of taxes that has a negative impact on economic growth. Such initiatives are said to yield a double dividend by protecting the environment and fostering economic growth.
3 Also called ecological taxation, environmental taxation or eco-taxation.

An Overview of the 54 Québec Taxation System
The fiscal measures implemented in Québec to support environmental policy
Québec already possesses a form of green taxation through measures that affect the personal income tax system, the business taxation system, the consumption tax system, and the system of duties, permits and licences.
Among the eco-taxation measures that the Québec government has adopted, mention should be made of:
— the refundable ÉcoRénov tax credit under the personal income tax system;
— the additional deduction of 100% in the calculation of the employer’s income in respect of mass transit fares paid to employees under the business taxation system;
— the fuel tax under the consumption tax system;
— the annual payment to the Green Fund under the systems or duties, permits and licences;
— the charge on the elimination of residual materials;
— the additional fee on big-engined vehicles;
— specific duties on new tires;
— the eco-fees applicable to purchases of electronic devices.
A carbon market that complements green taxation
To complement its eco-taxation measures, Québec, in collaboration with California, established a GHG emission cap-and-trade system on January 1, 2013.
The system has targeted major industrial emitters and electricity producers since January 1, 2013 and will target as of January 1, 2015 distributors of fuel and fossil hydrocarbons.
Revenues are paid into the Green Fund to finance measures under the 2013-2020 Climate Change Action Plan, which targets, in particular, enhanced energy efficiency, greenhouse gas reduction and adaptation to climate change.
Part 3: The Weight and Administration of the Québec taxation system 55
PART 3: THE WEIGHT AND ADMINISTRATION OF THE QUÉBEC TAXATION SYSTEM
As indicated in the previous section, the Québec government relies on taxation to assume its socioeconomic role. However, the government’s fiscal choices significantly affect all Quebecers and Québec corporations.
Such taxation constitutes the Québec taxation system, whose impact is presented here from the standpoint of:
— the weight of taxation;
— tax administration.

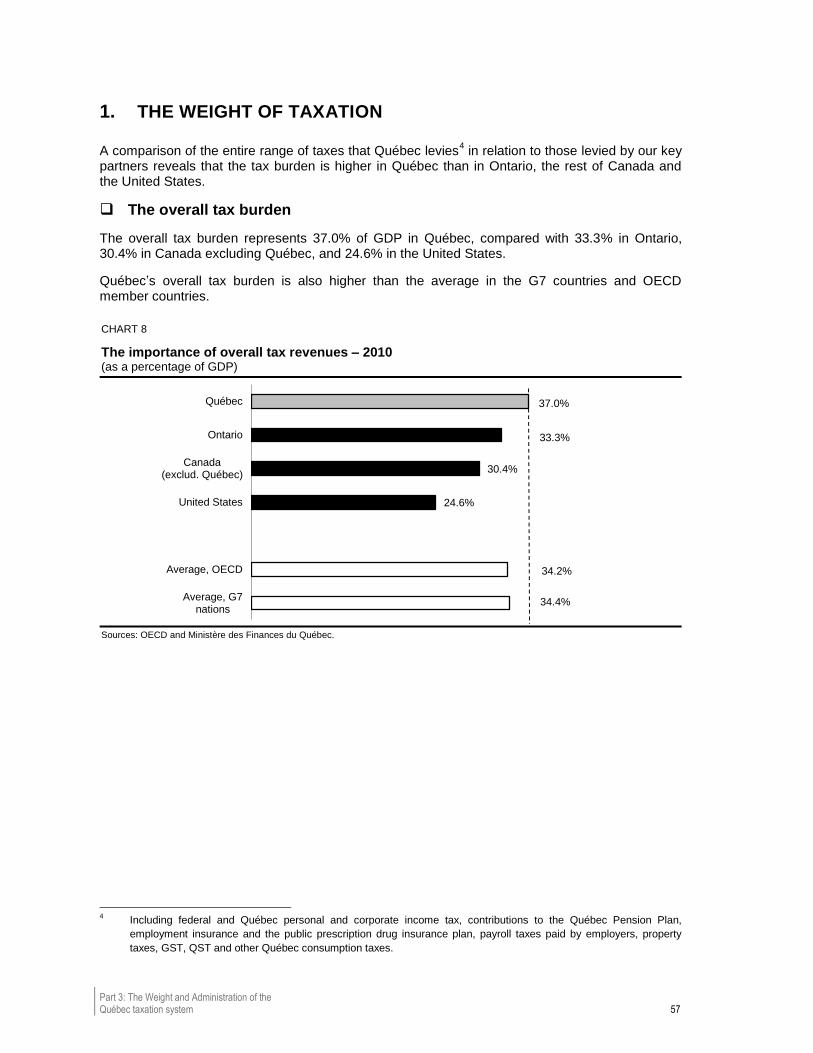
Part 3: The Weight and Administration of the Québec taxation system 57
1. THE WEIGHT OF TAXATION
A comparison of the entire range of taxes that Québec levies4 in relation to those levied by our key
partners reveals that the tax burden is higher in Québec than in Ontario, the rest of Canada and the United States.
The overall tax burden
The overall tax burden represents 37.0% of GDP in Québec, compared with 33.3% in Ontario, 30.4% in Canada excluding Québec, and 24.6% in the United States.
Québec’s overall tax burden is also higher than the average in the G7 countries and OECD member countries.
CHART 8
The importance of overall tax revenues – 2010
(as a percentage of GDP)
Sources: OECD and Ministère des Finances du Québec.
4 Including federal and Québec personal and corporate income tax, contributions to the Québec Pension Plan,
employment insurance and the public prescription drug insurance plan, payroll taxes paid by employers, property
taxes, GST, QST and other Québec consumption taxes.
34.4%
34.2%
24.6%
30.4%
33.3%
37.0%
Average, G7nations
Average, OECD
United States
Canada(exclud. Québec)
Ontario
Québec
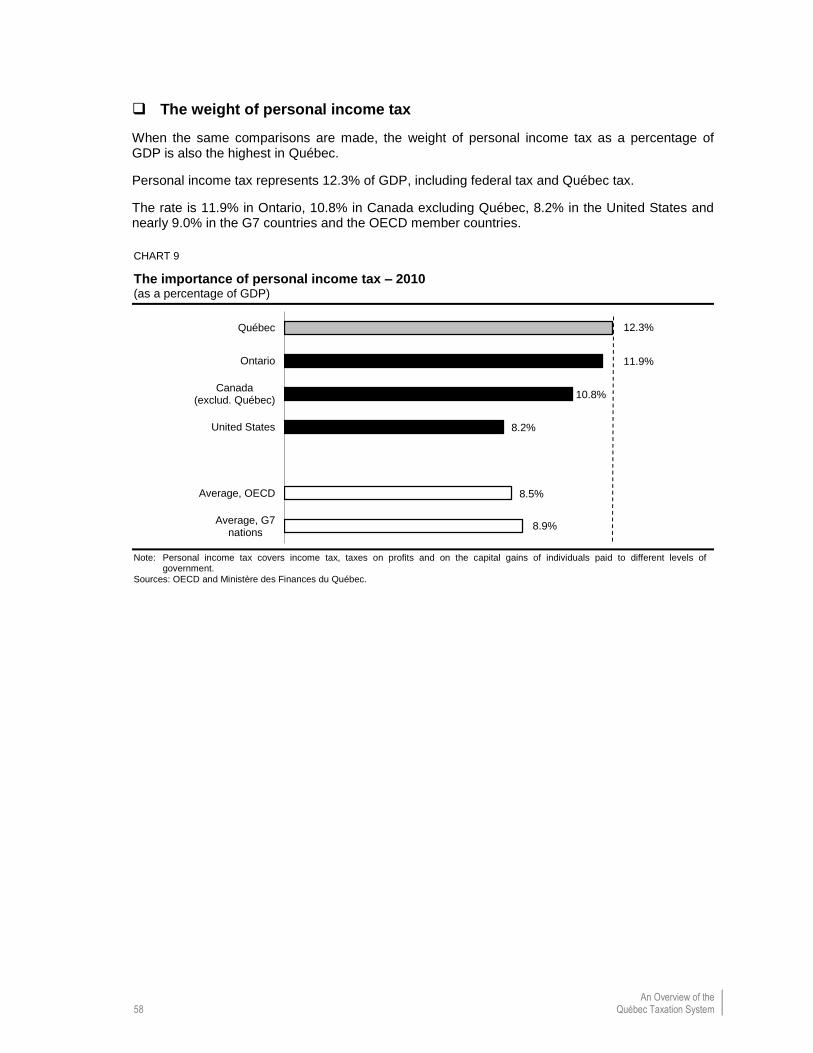
An Overview of the 58 Québec Taxation System
The weight of personal income tax
When the same comparisons are made, the weight of personal income tax as a percentage of GDP is also the highest in Québec.
Personal income tax represents 12.3% of GDP, including federal tax and Québec tax.
The rate is 11.9% in Ontario, 10.8% in Canada excluding Québec, 8.2% in the United States and nearly 9.0% in the G7 countries and the OECD member countries.
CHART 9
The importance of personal income tax – 2010
(as a percentage of GDP)
Note: Personal income tax covers income tax, taxes on profits and on the capital gains of individuals paid to different levels of government.
Sources: OECD and Ministère des Finances du Québec.
8.9%
8.5%
8.2%
10.8%
11.9%
12.3%
Average, G7nations
Average, OECD
United States
Canada(exclud. Québec)
Ontario
Québec
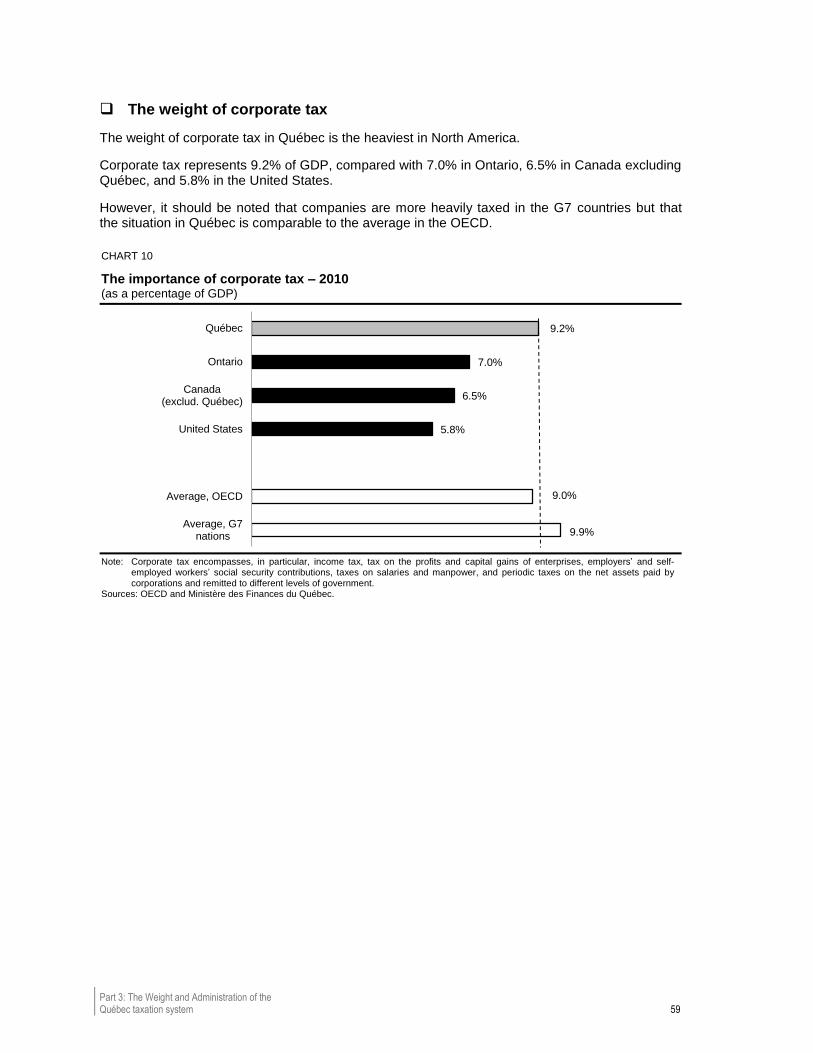
Part 3: The Weight and Administration of the Québec taxation system 59
The weight of corporate tax
The weight of corporate tax in Québec is the heaviest in North America.
Corporate tax represents 9.2% of GDP, compared with 7.0% in Ontario, 6.5% in Canada excluding Québec, and 5.8% in the United States.
However, it should be noted that companies are more heavily taxed in the G7 countries but that the situation in Québec is comparable to the average in the OECD.
CHART 10
The importance of corporate tax – 2010
(as a percentage of GDP)
Note: Corporate tax encompasses, in particular, income tax, tax on the profits and capital gains of enterprises, employers’ and self-employed workers’ social security contributions, taxes on salaries and manpower, and periodic taxes on the net assets paid by corporations and remitted to different levels of government.
Sources: OECD and Ministère des Finances du Québec.
9.9%
9.0%
5.8%
6.5%
7.0%
9.2%
Average, G7nations
Average, OECD
United States
Canada(exclud. Québec)
Ontario
Québec
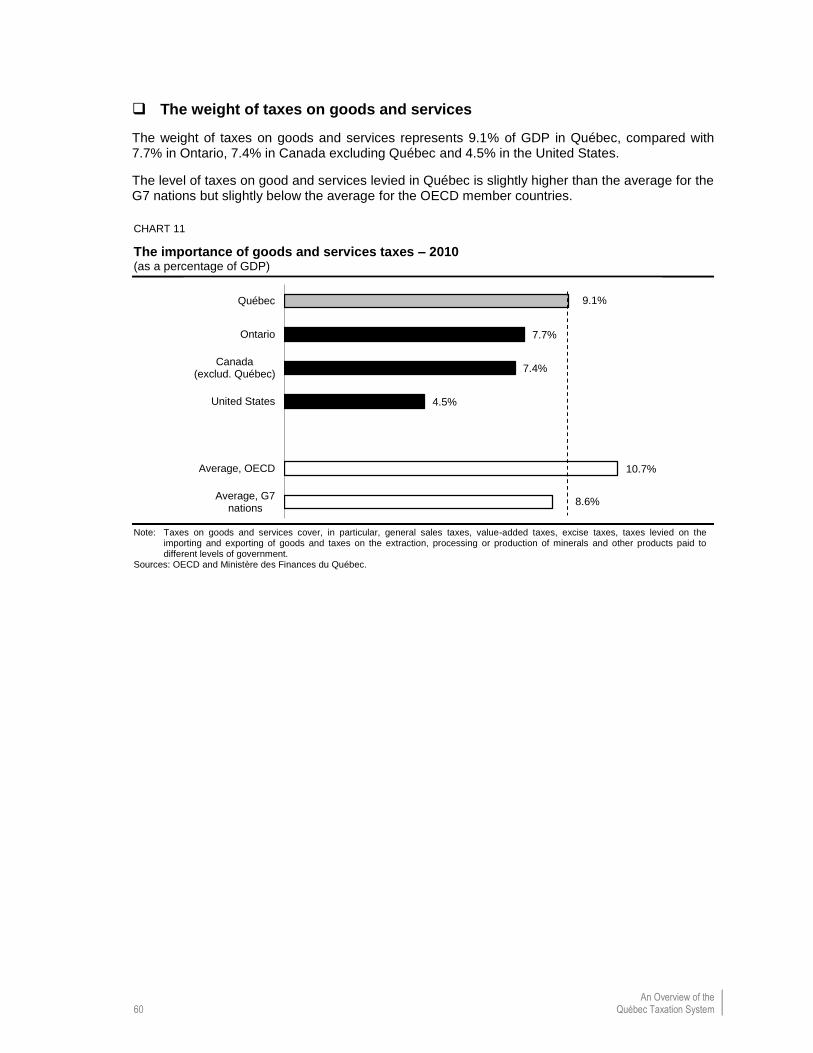
An Overview of the 60 Québec Taxation System
The weight of taxes on goods and services
The weight of taxes on goods and services represents 9.1% of GDP in Québec, compared with 7.7% in Ontario, 7.4% in Canada excluding Québec and 4.5% in the United States.
The level of taxes on good and services levied in Québec is slightly higher than the average for the G7 nations but slightly below the average for the OECD member countries.
CHART 11
The importance of goods and services taxes – 2010
(as a percentage of GDP)
Note: Taxes on goods and services cover, in particular, general sales taxes, value-added taxes, excise taxes, taxes levied on the importing and exporting of goods and taxes on the extraction, processing or production of minerals and other products paid to different levels of government.
Sources: OECD and Ministère des Finances du Québec.
8.6%
10.7%
4.5%
7.4%
7.7%
9.1%
Average, G7nations
Average, OECD
United States
Canada(exclud. Québec)
Ontario
Québec

Part 3: The Weight and Administration of the Québec taxation system 61
The weight of property tax
The weight of property taxes in Québec is fairly comparable with the rest of North America. Property tax represents 3.7% of Québec’s GDP, compared with 4.3% in Ontario, 3.6% in Canada excluding Québec, and 3.2% in the United States.
On the other hand, the weight of property tax in Québec exceeds the average for the G7 countries and the OECD member countries.
CHART 12
The importance of property tax – 2010
(as a percentage of GDP)
Note: Property tax covers, in particular, periodic taxes on real estate property, taxes on transfers by death, estates and gifts, and taxes on securities and real estate transactions.
Sources: OECD and Ministère des Finances du Québec.
2.9%
1.8%
3.2%
3.6%
4.3%
3.7%
Average, G7nations
Avergae, OECD
United States
Canada(exclud. Québec)
Ontario
Québec

Part 3: The Weight and Administration of the Québec taxation system 63
2. TAX ADMINISTRATION
The Agence du revenu du Québec (Revenu Québec) is primarily responsible for tax administration, i.e. the application of the taxation system.
— It is instrumental in ensuring tax compliance and assumes responsibility for ensuring such compliance.
— The latter point leads to the question of tax evasion and tax avoidance.
Tax collection 2.1
The Québec taxation system hinges on the principle of self-assessment. It is incumbent upon taxpayers and mandataries to determine, declare and submit to Revenu Québec their contributions and the amounts collected within the prescribed time limits.
Deductions at source
Deductions at source are one of the systems used to collect personal income tax. The system relies on a third party, the payer, who must withhold from certain types of income that he pays an outstanding amount to be paid by the beneficiary. The amount thus withheld must be remitted periodically to the government.
Tax instalments
However, some income is not subject to tax deductions at source.
A tax instalment system is used to collect the tax attributable to such income.
Individuals
Under the tax instalment system, an individual is required to periodically pay an amount to the government as an advance on his tax payable when, generally speaking, his net tax payable for the year and for either of the two preceding years exceeds $1 800.
The coexistence of the two systems makes it possible to standardize to some extent the method of payment of income tax for all individuals, thereby ensuring the taxation system’s fairness.
The balance of the tax payable by an individual for a given year is usually due on April 30 of the following year.
Corporations
A corporation must pay for a given taxation year tax instalments and taxes payable under the taxation system if the total amount of taxes other than the compensatory tax on financial institutions that it must pay for the year and that it had to pay for the previous taxation year exceeds for each of the years $3 000.
Tax instalments must be paid monthly no later than the last day of the month. Subject to compliance with certain conditions, Canadian-controlled private corporations may pay their instalments on a quarterly basis on the last day of each quarter.
The balance of tax payable under the taxation system must be paid no later than two months after the end of the corporation’s fiscal year.
An Overview of the 64 Québec Taxation System
Tax compliance and tax audits
Revenu Québec is responsible, in particular, for ensuring that each taxpayer pays his fair share of funding for public services and for collecting the revenues due to the government.
To this end, Revenu Québec must:
— promote voluntary compliance with fiscal obligations by offering taxpayers quality services and simplifying processes pertaining to income tax returns;
— elaborate innovative approaches and have recourse to new technologies to encourage taxpayers who do not abide by tax rules to comply with them.
To attain these objectives, Revenu Québec must exercise sustained fiscal control, which compels it to constantly renew its methods.
The role of other government organizations
From the government’s perspective, fiscal measures are usually easy to administer since they are across-the-board, may target numerous businesses and, in most cases, do not require the implementation of specific processes.
In the specific case of tax credits that require a certificate or eligibility attestation, corporations must submit to twofold control, i.e. an ex ante control conducted when the certificate or attestation is delivered, and an ex post control conducted after the self-assessment stage to ascertain the application’s compliance with tax rules.
Eligibility control
Eligibility control has been assigned to government departments or bodies that are responsible for issuing the relevant documents. Revenu Québec is responsible for compliance assessment.
Eligibility control ensures that corporate applicants engage in eligible activities and that eligible employees carry out such activities.
Fees may apply to eligibility control. The issuer of the eligibility document bills businesses for part or all of the cost of issuing the certificate or the eligibility attestation, as the case may be.
Among the government departments or bodies that issue certificates or eligibility attestations, mention should be made of:
– Investissement Québec.
– the Société de développement des entreprises culturelles;
– the Ministère des Finances;
– the Ministère de l’Économie, de l’Innovation et des Exportations.
Part 3: The Weight and Administration of the Québec taxation system 65
Tax evasion and tax avoidance 2.2
Tax evasion and tax avoidance both reduce government revenues. However, the two types of planning must not be confused.
Tax evasion
Tax evasion is a form of planning that occurs, in particular, when an individual deliberately makes false or misleading declarations, fails to comply with a taxing statute or attempts to evade tax or to obtain a refund to which he is not entitled.
Unreported work and under-reporting of income are examples of tax evasion. Individuals who are guilty of moonlighting and intentionally under-reporting income must pay the tax, interest and fines applicable and risk a prison sentence.
Tax avoidance
Tax avoidance is a form of planning that does not contravene any specific rule in the statute but does not comply with the intent and spirit of the law.
One example of tax avoidance is an individual who avoids any Québec tax when he sells a property through a series of operations involving legal structures located outside Québec. In this instance, the application of the rules designed to maintain the integrity of the tax system would result in the individual’s having to pay the tax and interest that he owes Québec in respect of the sale.


Part 4: The Context of the Impending Tax Reform 67
PART 4: THE CONTEXT OF THE IMPENDING TAX REFORM
Through the establishment of the Québec Taxation Review Committee, the government has undertaken thorough reflection on the current taxation system in order to carry out the necessary reforms.
Such reflection is part of a context that should be reviewed here:
— from the standpoint of public finances, Québec has a persistent deficit and is heavily indebted;
— from the standpoint of economic growth, Québec is facing a downturn, mainly as a result of ongoing demographic changes.

Part 4: The Context of the Impending Tax Reform 69
1. PUBLIC FINANCES: A PERSISTENT BUDGET DEFICIT AND HEAVY INDEBTEDNESS
An analysis of Québec’s public finances elicits two essential observations:
— Since the 2009 recession, the Québec government has posted a deficit and the deficit is persistent.
— The deficit is only increasing its heavy indebtedness.
The 2014-2015 Budget makes provision for precise budgetary targets to be reached.
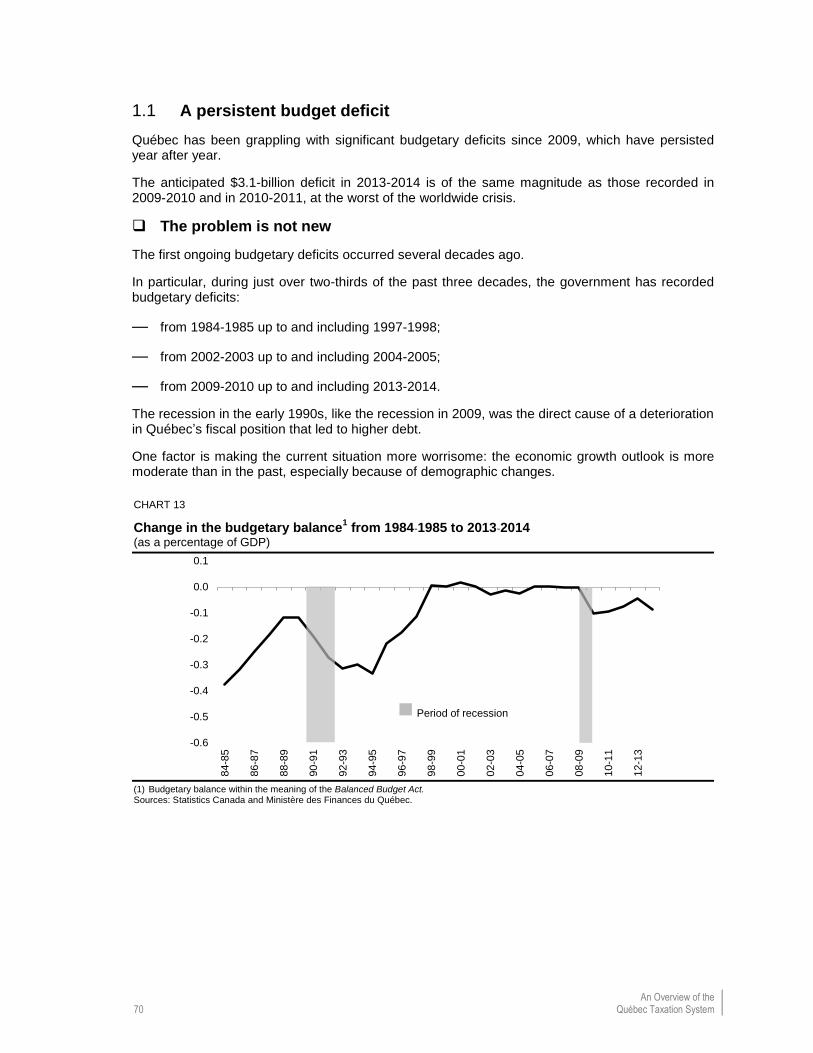
An Overview of the 70 Québec Taxation System
A persistent budget deficit 1.1
Québec has been grappling with significant budgetary deficits since 2009, which have persisted year after year.
The anticipated $3.1-billion deficit in 2013-2014 is of the same magnitude as those recorded in 2009-2010 and in 2010-2011, at the worst of the worldwide crisis.
The problem is not new
The first ongoing budgetary deficits occurred several decades ago.
In particular, during just over two-thirds of the past three decades, the government has recorded budgetary deficits:
— from 1984-1985 up to and including 1997-1998;
— from 2002-2003 up to and including 2004-2005;
— from 2009-2010 up to and including 2013-2014.
The recession in the early 1990s, like the recession in 2009, was the direct cause of a deterioration in Québec’s fiscal position that led to higher debt.
One factor is making the current situation more worrisome: the economic growth outlook is more moderate than in the past, especially because of demographic changes.
CHART 13
Change in the budgetary balance1 from 1984-1985 to 2013-2014
(as a percentage of GDP)
(1) Budgetary balance within the meaning of the Balanced Budget Act. Sources: Statistics Canada and Ministère des Finances du Québec.
-0.6
-0.5
-0.4
-0.3
-0.2
-0.1
0.0
0.1
84-8
5
86-8
7
88-8
9
90-9
1
92-9
3
94-9
5
96-9
7
98-9
9
00-0
1
02-0
3
04-0
5
06-0
7
08-0
9
10-1
1
12-1
3
Period of recession

Part 4: The Context of the Impending Tax Reform 71
Heavy public expenditures
The value of public expenditures in the economy represents just over one-quarter of the Québec economy and illustrates the extent of the basket of public services.
Consolidated expenditure as a percentage of GDP increased during the recession in 2009-2010 then diminished until 2012-2013, although it remained higher than it was prior to the recession.
In 2013-2014, the figure increased to 28.7%, equivalent to the figure in 2009-2010, compared with 22.2% in Ontario in 2013-2014, a difference of 6.5 percentage points.
CHART 14
Changes in the expenditures of public administrations1 in the economy of Québec and
Ontario
(as a percentage of GDP)
(1) The consolidated expenditures of provincial and local public administrations, excluding debt service. The data are drawn from Statistics Canada’s Financial Management System (FMS), which presents the provinces’ expenditures on a comparable basis by including, in particular, the expenditures of local administrations. The Ministère des Finances du Québec makes certain adjustments to data for Québec to enhance their comparability with the data of the other provinces. Since the FMS’s data are only available up to 2008-2009, the department has made projections for expenditures in the years 2009-2010 to 2013-2014.
Sources: Statistics Canada, Department of Finance Canada and Ministère des Finances du Québec.
24.5 26.2
28.827.8
28.7
1.,5 20.9
23.7
22.0 22.2
16
18
20
22
24
26
28
30
2004-2005 2007-2008 2010-2011 2013-2014
Québec Ontario

An Overview of the 72 Québec Taxation System
Heavy indebtedness 1.2
The deficit is increasing the debt.
Compared with the other Canadian provinces and as a percentage of GDP, Québec is more heavily indebted, whether from the standpoint of gross debt or debt representing accumulated deficits.
— As at March 31, 2013, Québec’s gross-debt-to-GDP ratio stood at 53.6%.
— The figures was 44.0% in Ontario, the second most indebted province, and 38.7% in Nova Scotia, which ranks third.
CHART 15
Gross debt and debt representing accumulated deficits as at March 31, 2013
(as a percentage of GDP)
Note: A negative entry means that the government has an accumulated surplus. Sources: Governments’ public accounts, Statistics Canada and Ministère des Finances du Québec.
33.0 33.124.8 22.1
10.2 8.9 13.1 18.2
–0.6 –3.1
53.649.0
44.038.7 36.8
32.9 31.8 29.8 25.9
15.1
6.0
QC Fed. ON NS MB NNB NL. PE BC SK
Debt representing accumulated deficits Gross debt
–17.3
AB
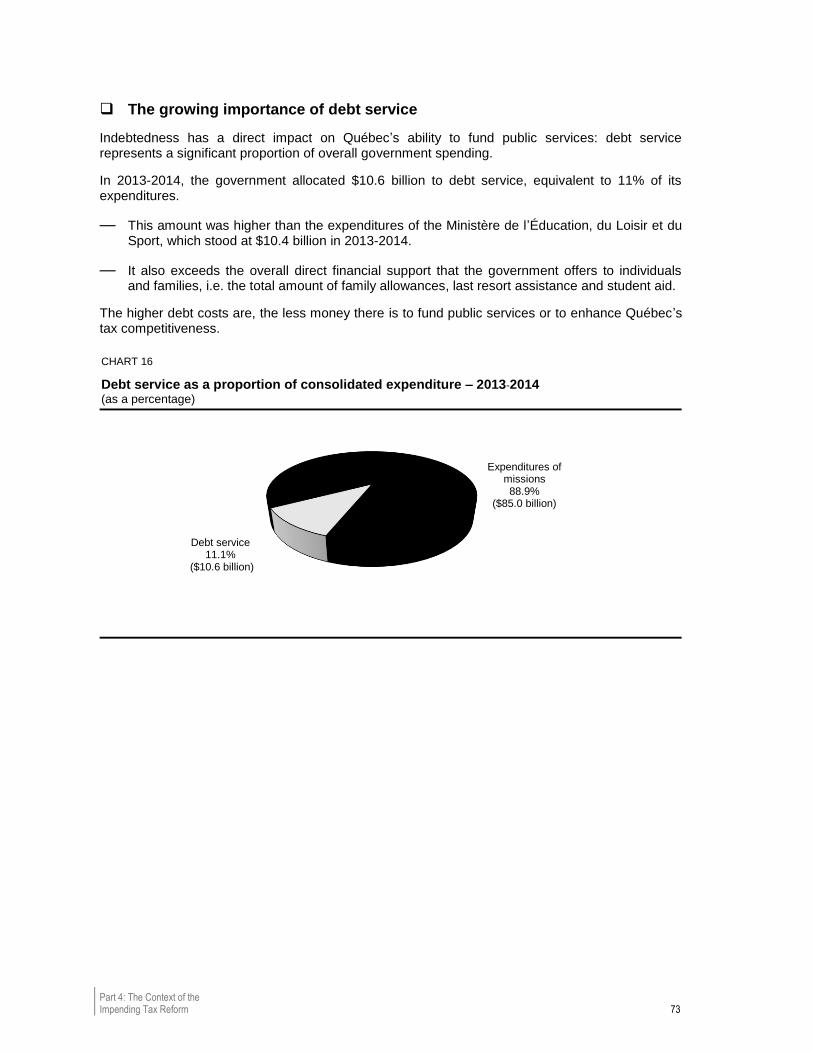
Part 4: The Context of the Impending Tax Reform 73
The growing importance of debt service
Indebtedness has a direct impact on Québec’s ability to fund public services: debt service represents a significant proportion of overall government spending.
In 2013-2014, the government allocated $10.6 billion to debt service, equivalent to 11% of its expenditures.
— This amount was higher than the expenditures of the Ministère de l’Éducation, du Loisir et du Sport, which stood at $10.4 billion in 2013-2014.
— It also exceeds the overall direct financial support that the government offers to individuals and families, i.e. the total amount of family allowances, last resort assistance and student aid.
The higher debt costs are, the less money there is to fund public services or to enhance Québec’s tax competitiveness.
CHART 16
Debt service as a proportion of consolidated expenditure – 2013-2014
(as a percentage)
Debt service 11.1%
($10.6 billion)
Expenditures of missions 88.9%
($85.0 billion)

An Overview of the 74 Québec Taxation System
The 2014-2015 Budget contains precise targets to be achieved 1.3
The government has made specific commitments in the 2014-2015 Budget.
— The deficit, which reached $3.1 billion in 2013-2014, must be reduced to $2 350 million in 2014-2015.
— It is imperative that budgetary balance be restored in 2015-2016.
CHART 17
Budgetary balance1 – 2008-2009 to 2015-2016
(millions of dollars)
(1) Budgetary balance within the meaning of the Balanced Budget Act. (2) Excludes Hydro-Québec’s nonrecurring loss of $1 876 million stemming from the closure of the Gentilly-2 nuclear power plant.
0
–3 174 –3 150
–2 628
–1 600(2)
–3 100
–2 350
0
2008-2009
2009-2010
2010-2011
2011-2012
2012-2013
2013-2014
2014-2015
2015-2016

Part 4: The Context of the Impending Tax Reform 75
Responsible expenditure management
To attain the targets, the government has set precise objectives as regards spending.
Growth in consolidated expenditure5 excluding debt service stood at 5.4% in 2013-2014.
The government has set the following growth objectives in consolidated expenditure excluding debt service:
— 1.9% in 2014-2015;
— 1.3% in 2015-2016;
— 1.7% in 2016-2017.
CHART 18 Growth in consolidated expenditure excluding debt service – 2010-2011 to 2018-2019 (as a percentage)
5 In addition to the program spending of government departments, consolidated expenditure includes that of the
special funds, non-budget-funded bodies, establishments in the health and social services and the education
networks, and debt service.
3.63.2
2.5
5.4
1.9
1.3
1.72.0 2.2
2010-2011
2011-2012
2012-2013
2013-2014
2014-2015
2015-2016
2016-2017
2017-2018
2018-2019
1.6

An Overview of the 76 Québec Taxation System
When debt service is included in the short term, growth in spending will stand, on average, at 1.8% per year between 2014-2015 and 2016-2017. Growth in revenue will be higher, i.e. 3.2% on average per year.
In the longer term, budgetary balance will be restored, thereby bringing the pace of growth in government spending more in line with growth in revenue.
CHART 19
Growth in consolidated revenue and expenditure – 2013-2014 to 2018-2019
(as a percentage)
4.2
2.9
3.5
3.13.3
2.8
5.7
1.9
1.5
2.1 2.22.4
2013-2014 2014-2015 2015-2016 2016-2017 2017-2018 2018-2019
Revenue growth
Expenditure growth

Part 4: The Context of the Impending Tax Reform 77
2. ECONOMIC GROWTH: A DOWNTURN IN ACTIVITY BECAUSE OF ONGOING DEMOGRAPHIC CHANGES
Québec is facing lagging economic growth that stems essentially from demographic changes.
— Historically, increased productivity and employment ensured Québec’s economic growth.
— The ageing population poses a daunting challenge because of its direct impact on growth in economic activity.
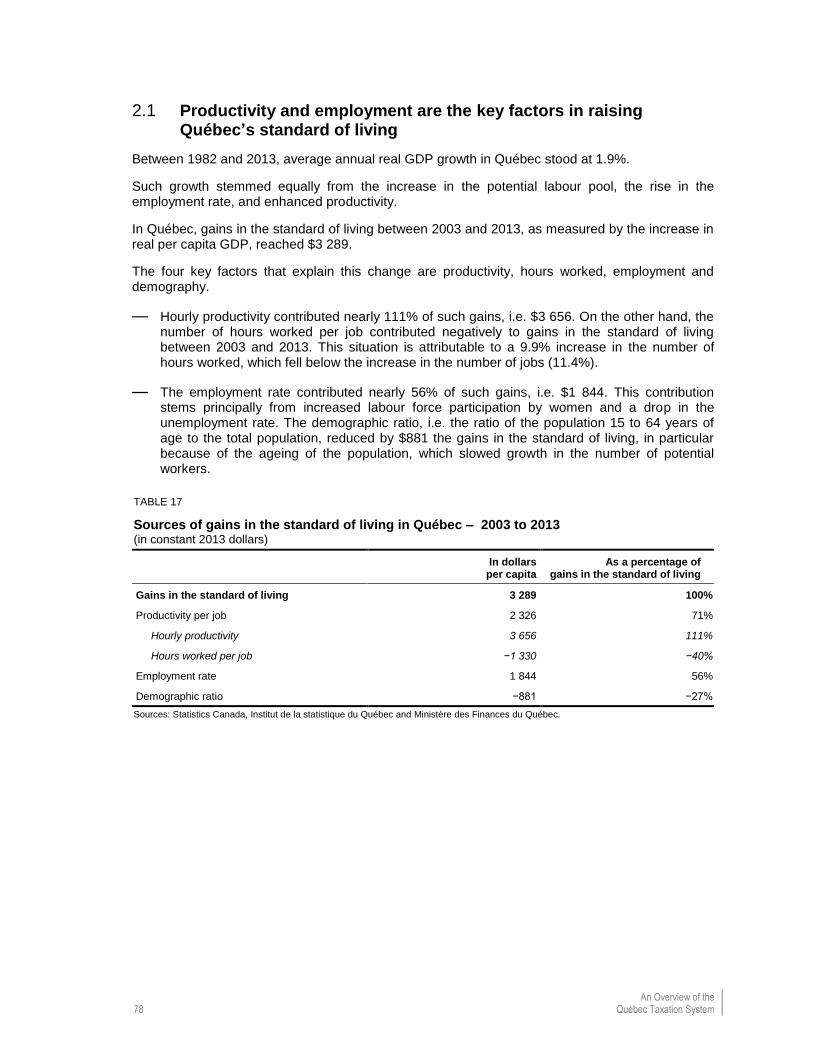
An Overview of the 78 Québec Taxation System
Productivity and employment are the key factors in raising 2.1Québec’s standard of living
Between 1982 and 2013, average annual real GDP growth in Québec stood at 1.9%.
Such growth stemmed equally from the increase in the potential labour pool, the rise in the employment rate, and enhanced productivity.
In Québec, gains in the standard of living between 2003 and 2013, as measured by the increase in real per capita GDP, reached $3 289.
The four key factors that explain this change are productivity, hours worked, employment and demography.
— Hourly productivity contributed nearly 111% of such gains, i.e. $3 656. On the other hand, the number of hours worked per job contributed negatively to gains in the standard of living between 2003 and 2013. This situation is attributable to a 9.9% increase in the number of hours worked, which fell below the increase in the number of jobs (11.4%).
— The employment rate contributed nearly 56% of such gains, i.e. $1 844. This contribution stems principally from increased labour force participation by women and a drop in the unemployment rate. The demographic ratio, i.e. the ratio of the population 15 to 64 years of age to the total population, reduced by $881 the gains in the standard of living, in particular because of the ageing of the population, which slowed growth in the number of potential workers.
TABLE 17
Sources of gains in the standard of living in Québec – 2003 to 2013
(in constant 2013 dollars)
In dollars
per capita As a percentage of
gains in the standard of living
Gains in the standard of living 3 289 100%
Productivity per job 2 326 71%
Hourly productivity 3 656 111%
Hours worked per job −1 330 −40%
Employment rate 1 844 56%
Demographic ratio −881 −27%
Sources: Statistics Canada, Institut de la statistique du Québec and Ministère des Finances du Québec.
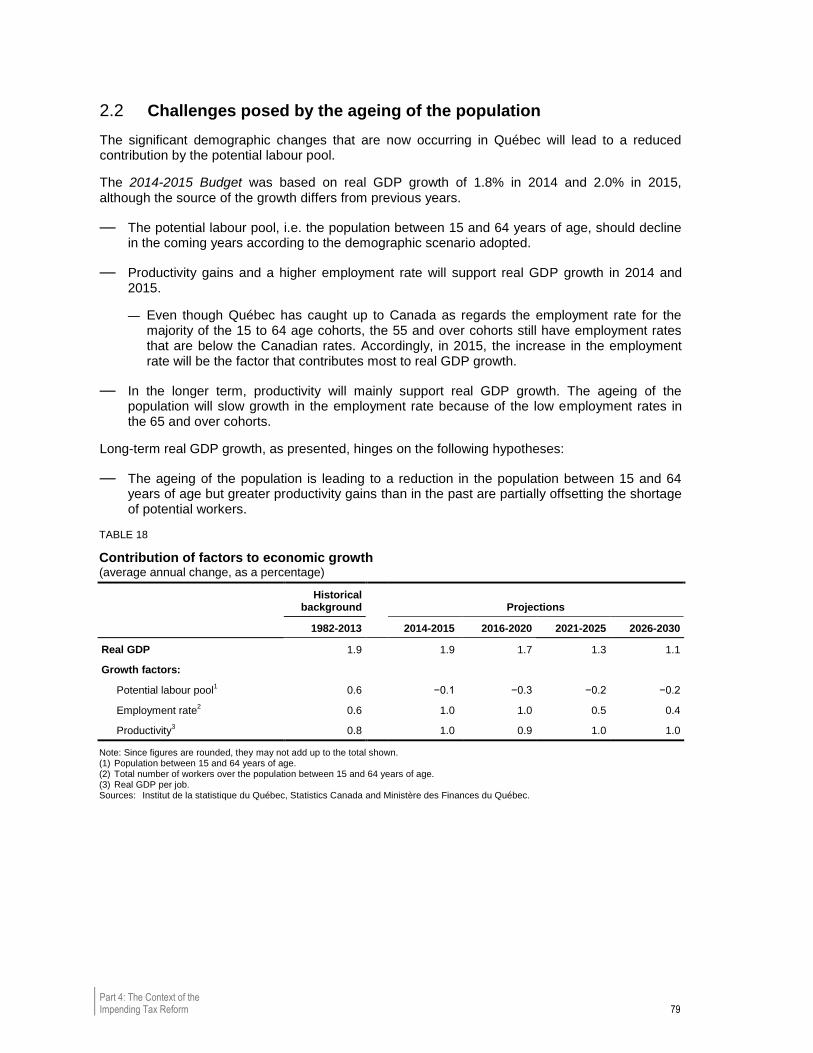
Part 4: The Context of the Impending Tax Reform 79
Challenges posed by the ageing of the population 2.2
The significant demographic changes that are now occurring in Québec will lead to a reduced contribution by the potential labour pool.
The 2014-2015 Budget was based on real GDP growth of 1.8% in 2014 and 2.0% in 2015, although the source of the growth differs from previous years.
— The potential labour pool, i.e. the population between 15 and 64 years of age, should decline in the coming years according to the demographic scenario adopted.
— Productivity gains and a higher employment rate will support real GDP growth in 2014 and 2015.
— Even though Québec has caught up to Canada as regards the employment rate for the majority of the 15 to 64 age cohorts, the 55 and over cohorts still have employment rates that are below the Canadian rates. Accordingly, in 2015, the increase in the employment rate will be the factor that contributes most to real GDP growth.
— In the longer term, productivity will mainly support real GDP growth. The ageing of the population will slow growth in the employment rate because of the low employment rates in the 65 and over cohorts.
Long-term real GDP growth, as presented, hinges on the following hypotheses:
— The ageing of the population is leading to a reduction in the population between 15 and 64 years of age but greater productivity gains than in the past are partially offsetting the shortage of potential workers.
TABLE 18
Contribution of factors to economic growth
(average annual change, as a percentage)
Historical
background Projections
1982-2013 2014-2015 2016-2020 2021-2025 2026-2030
Real GDP 1.9 1.9 1.7 1.3 1.1
Growth factors:
Potential labour pool1 0.6 −0.1 −0.3 −0.2 −0.2
Employment rate2 0.6 1.0 1.0 0.5 0.4
Productivity3 0.8 1.0 0.9 1.0 1.0
Note: Since figures are rounded, they may not add up to the total shown. (1) Population between 15 and 64 years of age. (2) Total number of workers over the population between 15 and 64 years of age. (3) Real GDP per job. Sources: Institut de la statistique du Québec, Statistics Canada and Ministère des Finances du Québec.

Conclusion 81
CONCLUSION
The information and data assembled in this document are intended to facilitate participation by all Quebecers interested in the impending discussions on tax reform.
The first two sections review the two inescapable facts that will structure forthcoming reflection.
— Taxation is intended, first of all, to fund public services et we must question the current taxation system’s ability to fully achieve this outcome.
— At the same time, taxation is a powerful tool in the hands of the State to spur economic growth but also to implement its public policies.
Against a backdrop of a difficult fiscal position and sluggish economic growth stemming from the demographic changes under way, we must ask ourselves about the reforms to be made to the existing taxation system to better fund public services and better foster the determinants of economic growth, without calling into question the various objectives of the public policies that the government has adopted.
The questions
The mandate that the government has assigned to the Québec Taxation Review Committee pinpoints the key questions that the impending reform raises.
— How can we enhance the taxation system’s efficiency, fairness and competitiveness and ensure funding for public services?
— Can we define a new balance between different modes of taxation?
— How can we revise the business taxation system to better support economic growth?
— What analysis can we conduct of the personal income tax system in order to further encourage work and saving and optimize user fees while ensuring fair redistribution of collective wealth, in particular through the maintenance of adequate support for the poorest members of society?
— Can we subject to taxation certain user fees in order to take into account the ability to pay of the users of public services, bearing in mind the impacts on the marginal taxation rates?
In the mandate that it defined, the government also asked the commission to identify reductions to be made in tax expenditures in order to attain the targets set in the 2014-2015 Budget, based on an examination of their relevance and efficacy.
All of these questions are now on the table. Quebecers are invited to submit to the commission their analyses, express their opinions and present their recommendations within the framework of the public consultation organized in the fall.

Background document produced at the request of the
Québec Taxation Review Committeewww.examenfiscalite.gouv.qc.ca
Recommended
![Le régime d'impôt minier du Québec - Document de consultation · Canadian Mining Taxation, Digging Deeper, [en ligne]. 2011; — RESSOURCES NATURELLES CANADA. Bulletin d’information,](https://img.dokumen.tips/doc/110x75/5f5a8fc2269a4c100c1f4a10/le-rgime-dimpt-minier-du-qubec-document-de-canadian-mining-taxation-digging.jpg)