Humane Society Institute for Science and PolicyAnimal Studies Repository
Societal Attitudes Toward Animals Articles, Chapters, and White Papers
1984
American Attitudes Toward and Knowledge ofAnimals: An UpdateStephen R. Kellert
Follow this and additional works at: http://animalstudiesrepository.org/acwp_sata
Part of the Animals Commons, Community-based Research Commons, Demography,Population, and Ecology Commons, and the Nature and Society Relations Commons
This Book Chapter is brought to you for free and open access by the Articles, Chapters, and White Papers at Animal Studies Repository. It has beenaccepted for inclusion in Societal Attitudes Toward Animals by an authorized administrator of Animal Studies Repository. For more information,please contact [email protected].
Recommended CitationKellert, S.R. (1984). American attitudes toward and knowledge of animals: An update. In M.W. Fox & L.D. Mickley (Eds.), Advancesin animal welfare science 1984/85 (pp. 177-213). Washington, DC: The Humane Society of the United States.
AMERICAN ATTITUDES TOWARD AND KNOWLEDGE OF ANIMALS: AN UPDATE*t
Stephen R. Kellert
ABSTRACT
The distribution of a typology of basic attitudes toward animals in the American population is explored through personal interviews with 3,107 randomly selected persons in the 48 contiguous states and Alaska. Data is presented on the prevalence of these attitudes in the overall American population and among major social demographic and animal activity groups. In addition, results are presented on Americans' knowledge of animals as well as their species preferences. Finally, information is presented on perceptions of critical wildlife issues including endangered species, predator control, hunting, trapping, marine mammals and wildlife habitat protection.
INTRODUCTION
During the period 1973-1976, a typology of basic attitudes toward animals was developed and a limited study conducted to examine the distribution of these viewpoints throughout the American public (Kellert 1978). In 1977, the U.S. Fish and Wildlife Service of the Department of the Interior granted funds to explore more carefully the presence and strength of these perceptions among diverse social demographic and animal activity groups in the 48 contiguous states and Alaska. In addition, five other focus areas were identified for this study: 1) public attitudes toward critical wildlife and natural habitat issues (e.g., endangered species, predator control, hunting, trapping
*Supported by grant #1416000977056 from the United States Fish and Wildlife Service, Department of the Interior.
tReprinted from International Journal for the Study of Animal Problems 1(2)1980.
177
178 S. Kellert
and habitat preservation); 2) the size and social characteristics of various wildlife and domestic animal activity groups (e.g., hunters, birdwatchers, pet owners, and humane and wildlife protection organization members); 3) public knowledge of animals and species preferences; 4) historical trends in uses and perception of animals during the twentieth century; and 5) children's knowledge of, and attitudes and behavior toward animals.
This report will review some of the results of this investigation. Space limitations, however, restrict the amount of information that can be covered and, thus, some data will be omitted and others only cursorily examined. No data will be provided on the historical orchildren's studies as these investigations are still in progress.
The results presented in this paper are largely based on a national survey of 3,107 randomly selected Americans in the 48 contiguous states and Alaska. A special oversampling was drawn in the Rocky Mountain States and Alaska in order to ensure sufficient numbers in these important regions. In all analyses referring to the entire American population, however, this oversampling was accounted for, resulting in a total national sample size of 2,455. Respondents were chosen according to a probability random selection method roughly ensuring that every individual in the American population had an equal chance of being selected. In addition, a minimum of one initial contact and three call-backs were included before the designated respondent could be dropped. These methods considerably enhanced the representativeness of the sample. Each respondent was personally interviewed for approximately sixty minutes. Twenty-two percent of those contacted refused an interview, thirteen percent could not be located after the fourth interview attempt, and approximately four percent terminated the interview before its completion. In spite of these limitations, a comparison with the national census suggested that the sample was a relatively good cross section of the American population with a slightly higher socioeconomic profile (age, sex and race differences were nonsignificant). In addition to the national sample, special mail surveys, using the same questionnaire, were conducted with members of the National Cattlemen's, American Sheep Producer's and National Trappers' Associations, as well as with subscribers to the magazine, Vegetarian Times.
Five pretests were conducted to develop reliable and valid attitude questions. Attitude scales were developed based on a typology of nine basic attitudes toward animals. Cluster and other multivariate analyses were employed in the scale construction process. No useful scale was devised to measure the aesthetic attitude. Additionally, a neutralistic attitude scale could not be usefully distinguished from a negativistic scale and, thus, only one scale was developed including elements
Appendix 179
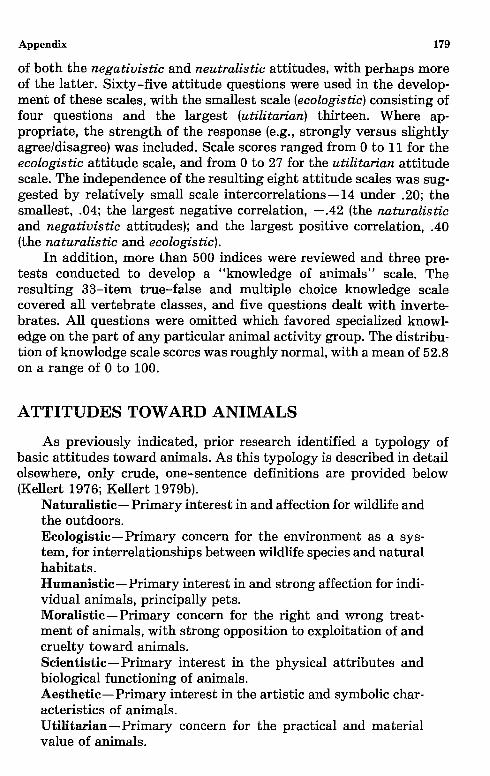
of both the negativistic and neutralistic attitudes, with perhaps more of the latter. Sixty-five attitude questions were used in the development of these scales, with the smallest scale (ecologistic) consisting of four questions and the largest (utilitarian) thirteen. Where appropriate, the strength of the response (e.g., strongly versus slightly agree/disagree) was included. Scale scores ranged from 0 to 11 for the ecologistic attitude scale, and from 0 to 27 for the utilitarian attitude scale. The independence of the resulting eight attitude scales was suggested by relatively small scale intercorrelations-14 under .20; the smallest, .04; the largest negative correlation, -.42 (the naturalistic and negativistic attitudes); and the largest positive correlation, .40 (the naturalistic and ecologistic).
In addition, more than 500 indices were reviewed and three pretests conducted to develop a "knowledge of animals" scale. The resulting 33-item true-false and multiple choice knowledge scale covered all vertebrate classes, and five questions dealt with invertebrates. All questions were omitted which favored specialized knowledge on the part of any particular animal activity group. The distribution of knowledge scale scores was roughly normal, with a mean of 52.8 on a range of 0 to 100.
ATTITUDES TOWARD ANIMALS
As previously indicated, prior research identified a typology of basic attitudes toward animals. As this typology is described in detail elsewhere, only crude, one-sentence definitions are provided below (Kellert 1976; Kellert 1979b).
Naturalistic- Primary interest in and affection for wildlife and the outdoors. Ecologistic-Primary concern for the environment as a system, for interrelationships between wildlife species and natural habitats. Humanistic-Primary interest in and strong affection for individual animals, principally pets. Moralistic-Primary concern for the right and wrong treatment of animals, with strong opposition to exploitation of and cruelty toward animals. Scientistic-Primary interest in the physical attributes and biological functioning of animals. Aesthetic-Primary interest in the artistic and symbolic characteristics of animals. Utilitarian-Primary concern for the practical and material value of animals.
180 S. Kellert
Dominionistic-Primary satisfactions derived from mastery and control over animals, typically in sporting situations. Negativistic-Primary orientation an active avoidance of animals due to dislike or fear. Neutralistic-Primary orientation a passive avoidance of animals due to indifference and lack of interest. The scales used in the national survey are crude approximations of
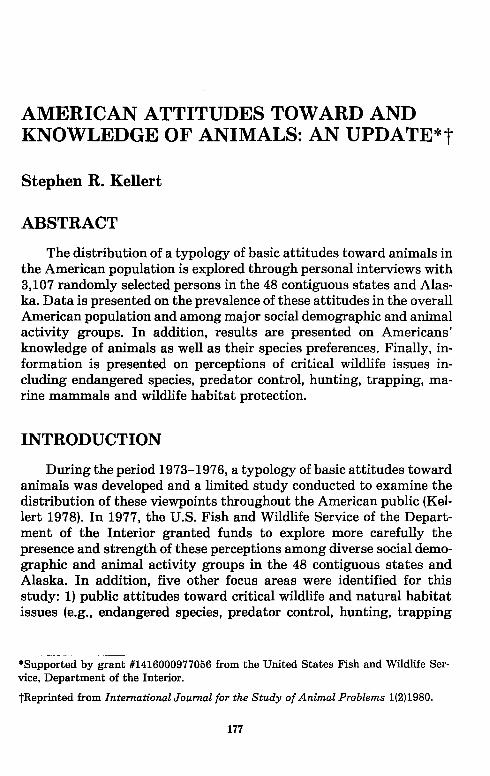
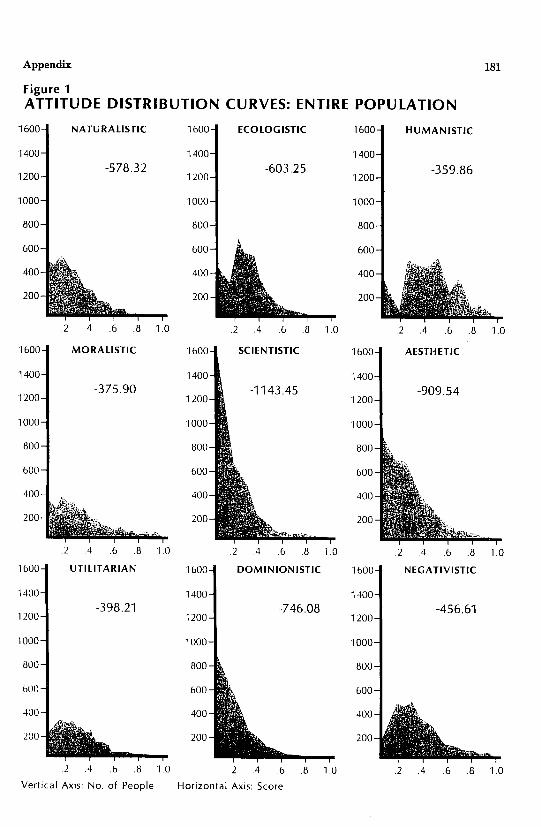
the attitude types and only in the broadest sense measure their true prevalence and distribution in the American population. Nevertheless, the relative frequency of the attitudes in the national sample was assessed by standardizing the various scale scores on a 0 to 1 range, plotting a regression line through the scale score distribution frequencies for each attitude, and using these frequency curves and regression figures to estimate the comparative "popularity" of the attitudes. As particular scores on one attitude scale cannot be equated with similar scores on other scales, this procedure only roughly indicates the relative frequency of the eight attitudes in the American population. The results of this analysis are presented in Figure 1.
These results suggest that the most common attitudes toward animals in contemporary American society, by a large margin, are the humanistic, moralistic, utilitarian, and negativistic attitudes. In many respects, these attitudes can be subsumed under two broad and conflicting dimensional perceptions of animals. The moralistic and utilitarian attitudes clash around the theme of human exploitation of animals. The former opposes many exploitative uses of animals involving death and presumed suffering (e.g., hunting, trapping, whaling and laboratory experimentation), while the latter endorses such utilization, or other human activities which might adversely affect animals, if significant human material benefits result. In a somewhat analogous fashion, the negativistic and humanistic attitudes tend to clash, although in a more latent fashion, around the theme of affection for animals. The former is characterized by indifference and incredulity toward the notion of "loving" animals, while the latter involves intense emotional attachments to animals. The relative popularity of these four attitudes in contemporary American society may suggest a dynamic basis for the conflict and misunderstanding often existing today over issues involving people and animals.
The scientistic and dominionistic attitudes, according to the results of Figure 1, are the least common perceptions of animals among the American public. The shape of the naturalistic frequency curve suggests that this attitude is strongly present among a minority of Americans, but relatively weakly evident among the majority. The ecologistic scale score distribution indicates a substantial number of respondents expressing modest support for this viewpoint, but very
Appendix 181
Figure 1 ATTITUDE DISTRIBUTION CURVES: ENTIRE POPULATION
NATURALISTIC 1600 ECOLOGISTIC 1600 HUMANISTIC
-578.32 -359.86 1200
1000
BOO
600
400
200
.2 .4 .6 .B 1.0 .2 .4 .b .B 1.0 .2 .4 .6 .B 1.0
MORALISTIC 1600 SCIENTISTIC AESTHETIC
1400 1400 1400 -375.90 -1143.45 -909.54
1200 1200 1200
1000 1000 1000
800 BOO BOO
600 600 600
400 400 400
200 200 200
.2 .4 .6 .B 1.0 .2 .4 .6 .B 1.0 .2 .4 .6 .B 1.0
UTILITARIAN DOMINIONISTIC NEGATIVISTIC
1400 1400 -398.21 -7 46.08 -456.61
1200 1200
1000 1000
BOO 800
bOO 600
400 400
200 200
.2 .4 .b .8 1.0 .2 .4 .6 .B 1.0 .2 .4 .6 .B 1.0
Vertical Axis: No. of People Horizontal Axis: Score
182 S. Kellert
Figure 2
EDUCATION GROUPS BY SELECTED KNOWLEDGE AND ATTITUDE SCALES
<6th GRADE
VERY HIGH HIGH
MED. HIGH MEAN
MED.LOW LOW
VERY LOW
6-8th GRADE
VERY HIGH HIGH
MED. HIGH MEAN
MED. LOW LOW
VERY LOW
HIGH SCHOOL COMPLETE
VERY HIGH HIGH
MED. HIGH MEAN
MED. LOW LOW
VERY LOW
COLLEGE COMPLETE
VERY HIGH HIGH
MED. HIGH MEAN
MED. LOW LOW
VERY LOW
SOME GRADUATE ED.
VERY HIGH HIGH
MED. HIGH MEAN
MED. LOW LOW
VERY LOW
NAT ECO
... ,.
HUM MOR SCI UTI DOM NEG KNOW
.. .. 1\
•
Appendix 183
Figure 3
REGIONS BY SELECTED KNOWLEDGE AND ATTITUDE SCALES
NAT ECO HUM MOR SCI UTI DOM NEG KNOW
NORTHEAST
VERY HIGH HIGH
MED. HIGH
~ MEAN ~ MED.LOW .... LOW
VERY LOW
NORTH CENTRAL
VERY HIGH
I HIGH
MED. HIGH MEAN .... ..& ... ... ~ ... .....
MED. LOW LOW
VERY LOW
SOUTH
VERY HIGH HIGH
MED. HIGH MEAN
MED. LOW .... ... ... LOW
VERY LOW
ROCKY MOUNTAIN
VERY HIGH HIGH
MED. HIGH MEAN
MED. LOW LOW
VERY LOW
PACIFIC
VERY HIGH • HIGH ..,____... MED. HIGH .... • ...
MEAN MED. LOW
LOW VERY LOW
ALASKA
VERY HIGH HIGH
MED. HIGH MEAN
MED. LOW LOW
VERY LOW
184 S. Kellert
Figure 4
AGE GROUPS BY SELECTED KNOWLEDGE AND ATTITUDE SCALES 18-25 YEARS OLD
VERY HIGH HIGH
MOD. HIGH MEAN
MOD. LOW LOW
VERY LOW
26-35 YEARS OLD
VERY HIGH HIGH
MOD. HIGH MEAN
MOD. LOW LOW
VERY LOW
36-45 YEARS OLD
VERY HIGH HIGH
MOD. HIGH MEAN
MOD. LOW LOW
VERY LOW
46-55 YEARS OLD
VERY HIGH HIGH
MOD. HIGH MEAN
MOD. LOW LOW
VERY LOW
56-65 YEARS OLD
VERY HIGH HIGH
MOD. HIGH MEAN
MOD. LOW LOW
VERY LOW
66-75 YEARS OLD
VERY HIGH HIGH
MOD. HIGH MEAN
MOD. LOW LOW
VERY LOW
76+ YEARS OLD
VERY HIGH HIGH
MOD. HIGH MEAN
I
I
I
NAT ECO HUM MOR SCI UTI DOM NEG KNOW
• ,...
~ ... '
~ .____. ~ .. ~
Appendix 185
Figure 5
RACE GROUPS BY SELECTED KNOWLEDGE AND ATTITUDE SCALES WHITE
VERY HIGH HIGH
MOD. HIGH MEAN
MOD.LOW LOW
VERY LOW
BLACK
VERY HIGH HIGH
MOD. HIGH MEAN
MOD. LOW LOW
VERY LOW
NAT ECO HUM MOR SCI UTI DOM NEG KNOW
few strongly oriented in this fashion. Impressions on the percentage distribution of the attitudes in the American public, their most common behavioral expressions, and benefits or values generally associated with each attitude type are summarized in Table 1.
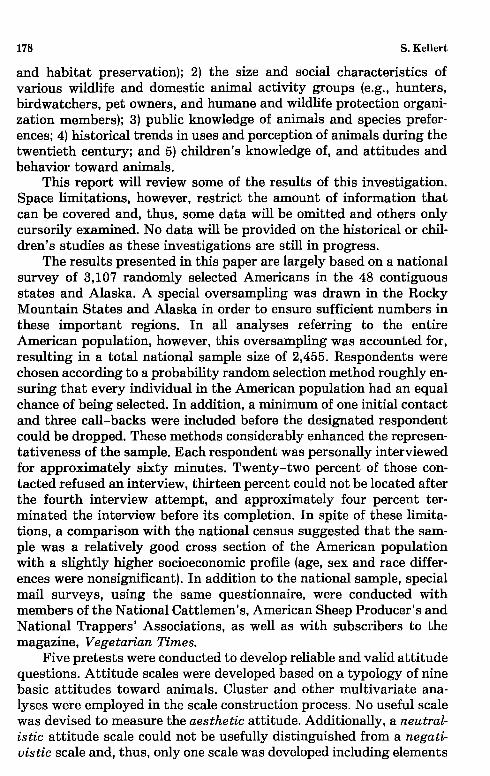
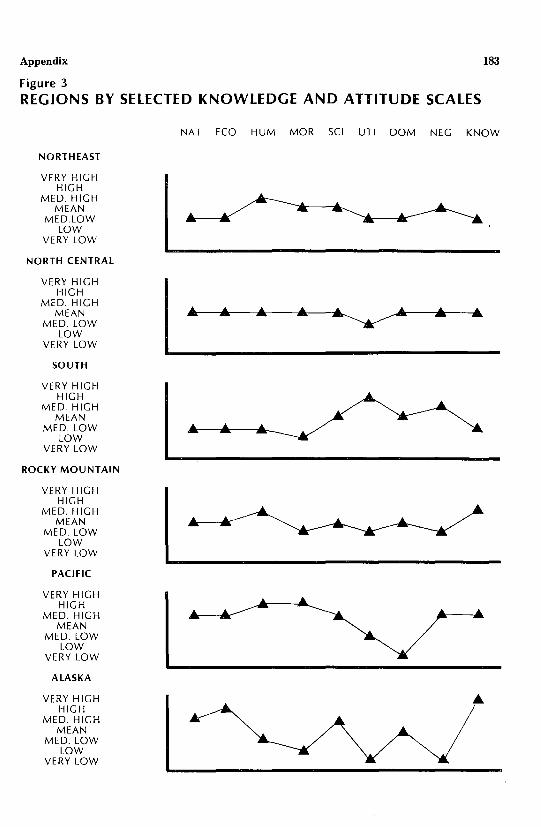
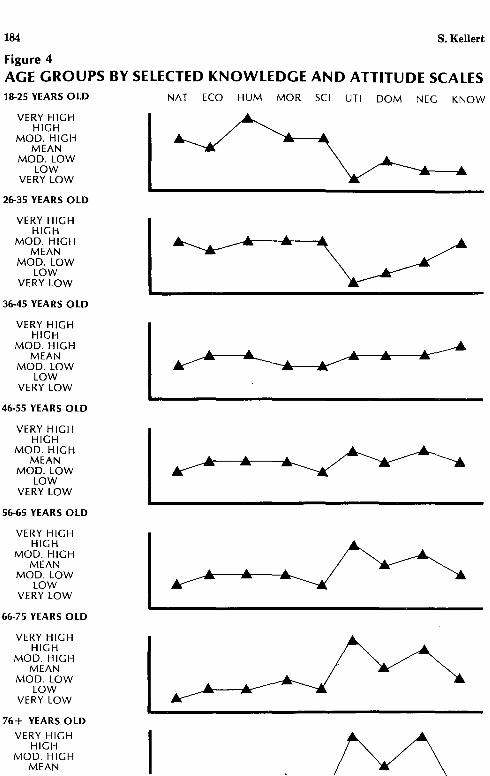
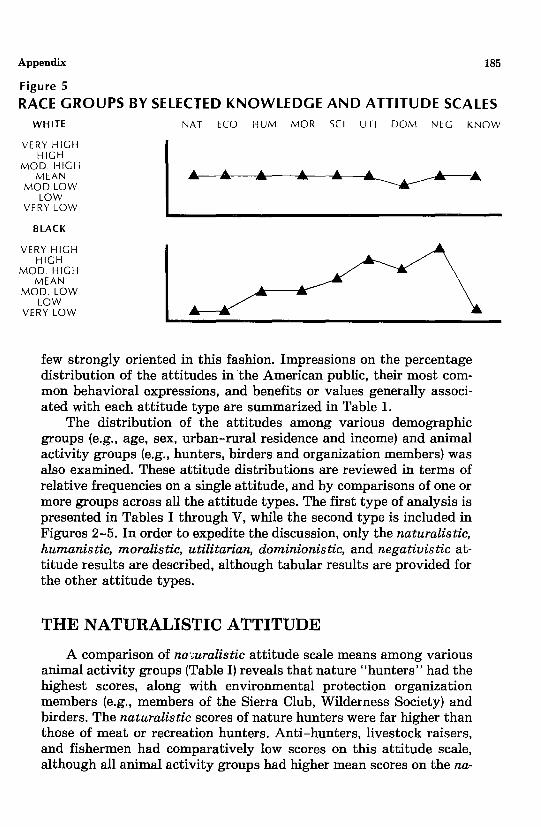
The distribution of the attitudes among various demographic groups (e.g., age, sex, urban-rural residence and income) and animal activity groups (e.g., hunters, birders and organization members) was also examined. These attitude distributions are reviewed in terms of relative frequencies on a single attitude, and by comparisons of one or more groups across all the attitude types. The first type of analysis is presented in Tables I through V, while the second type is included in Figures 2-5. In order to expedite the discussion, only the naturalistic, humanistic, moralistic, utilitarian, dominionistic, and negativistic attitude results are described, although tabular results are provided for the other attitude types.
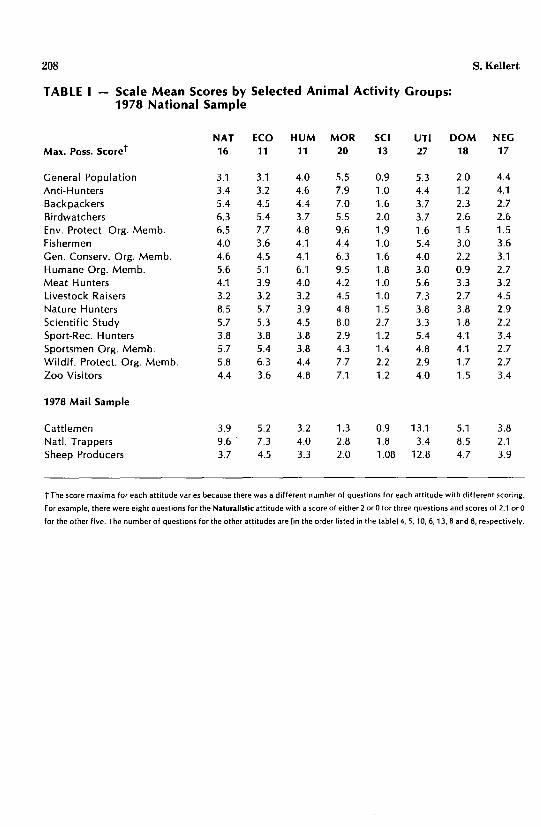
THE NATURALISTIC ATTITUDE
A comparison of na·;uralistic attitude scale means among various animal activity groups (Table I) reveals that nature "hunters" had the highest scores, along with environmental protection organization members (e.g., members of the Sierra Club, Wilderness Society) and birders. The naturalistic scores of nature hunters were far higher than those of meat or recreation hunters. Anti-hunters, livestock raisers, and fishermen had comparatively low scores on this attitude scale, although all animal activity groups had higher mean scores on the na-
186 S. Kellert
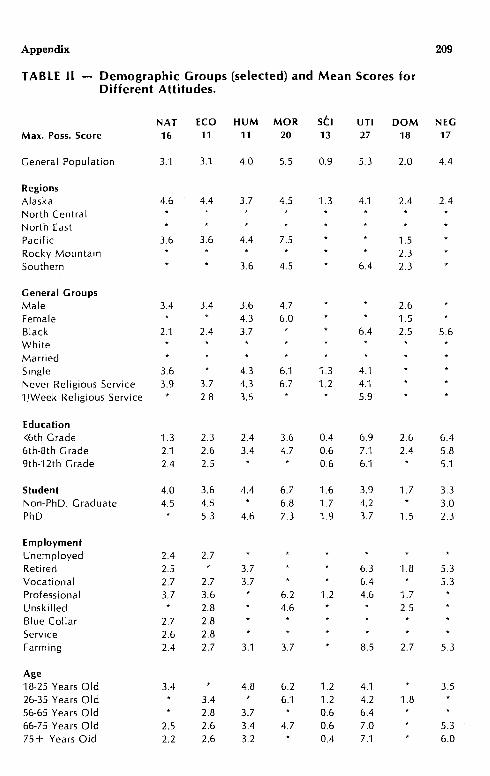
turalistic scale than did the general population. Among social demographic groups (Table II) Alaskans had the
highest naturalistic scores. Other social groups with high naturalistic scale scores included the college-educated, the affluent, professionals, persons under 35, respondents from moderate-sized population areas, Pacific Coast residents, and those who rarely or never attended religious services. In contrast, the poorly educated, nonwhites, the elderly, low income respondents, and persons of farm background scored substantially below the general population average on this dimension.
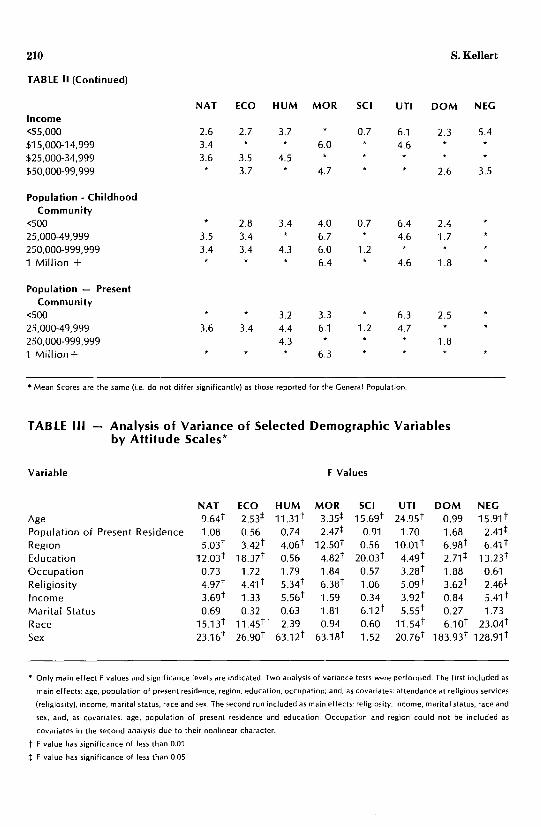
The possibility that variable differences were a function of interrelationships among certain demographic factors prompted the use of a statistical procedure, analysis of variance. Basically, this test examined the combined effect of a number of demographic groups on the attitude scales. When the following factors were subjected to analysis of variance-age, sex, race, marital status, occupation, education, income, region, population of present residence, and attendance at religious services-marital status, occupation and population of residence were not found to be significantly related to the naturalistic scale.
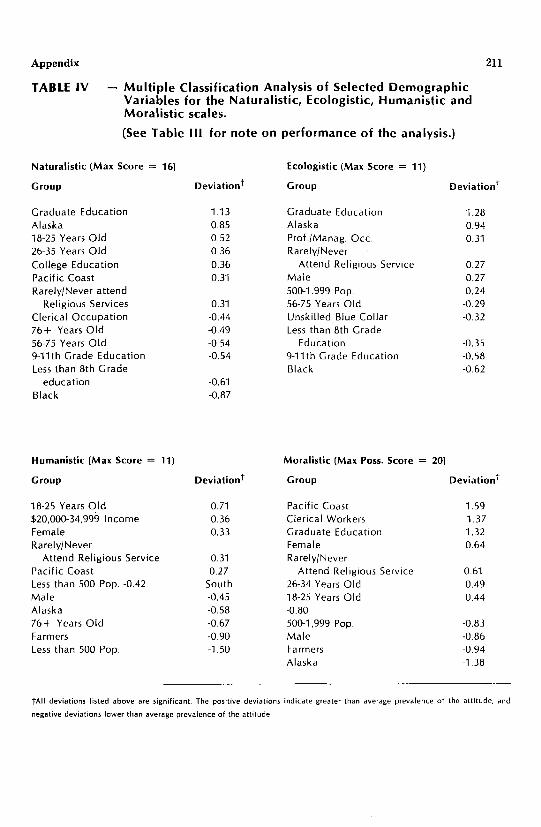
Multiple classification analysis is a statistical technique based on analysis of variance which allows one to determine which categories of a variable contribute most to the overall significance of the variable-e.g., which specific regional or educational groups are most related to the naturalistic scale after all other demographic variables have been taken into account. According to the results of this analysis, (Tables III and IV), the most naturalistic groups were graduate school and college education, Alaskan and Pacific Coast residents, respondents under 35 years of age, and persons who rarely or never attended religious service. In contrast, the least naturalistic were blacks, respondents with less than a high school education, and persons over 56 years of age.
THE HUMANISTIC ATTITUDE
Among animal activity groups, humane and environmental protection organization members, zoo visitors, anti-hunters, and scientific study hobbyists scored very high on the humanistic scale (Table I). In contrast, livestock producers, nature hunters, and surprisingly, birdwatchers had much lower scores. Apparently these latter groups, in light of their high scores on the naturalistic scale (with the exception of livestock producers), were far more oriented toward wildlife and outdoor recreation values than toward the benefits derived from love of animals, particularly pets.
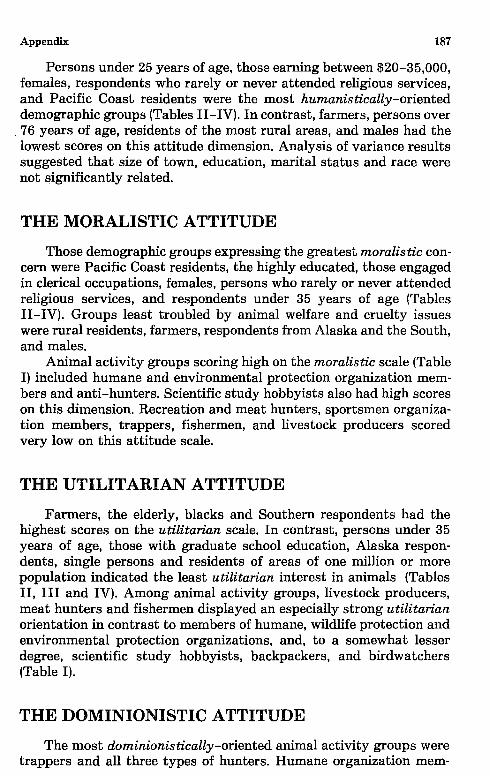
Appendix 187
Persons under 25 years of age, those earning between $20-35,000, females, respondents who rarely or never attended religious services, and Pacific Coast residents were the most humanistically-oriented demographic groups (Tables II-IV). In contrast, farmers, persons over
. 76 years of age, residents of the most rural areas, and males had the lowest scores on this attitude dimension. Analysis of variance results suggested that size of town, education, marital status and race were not significantly related.
THE MORALISTIC ATTITUDE
Those demographic groups expressing the greatest moralistic concern were Pacific Coast residents, the highly educated, those engaged in clerical occupations, females, persons who rarely or never attended religious services, and respondents under 35 years of age (Tables 11-IV). Groups least troubled by animal welfare and cruelty issues were rural residents, farmers, respondents from Alaska and the South, and males.
Animal activity groups scoring high on the moralistic scale (Table I) included humane and environmental protection organization members and anti-hunters. Scientific study hobbyists also had high scores on this dimension. Recreation and meat hunters, sportsmen organization members, trappers, fishermen, and livestock producers scored very low on this attitude scale.
THE UTILITARIAN ATTITUDE
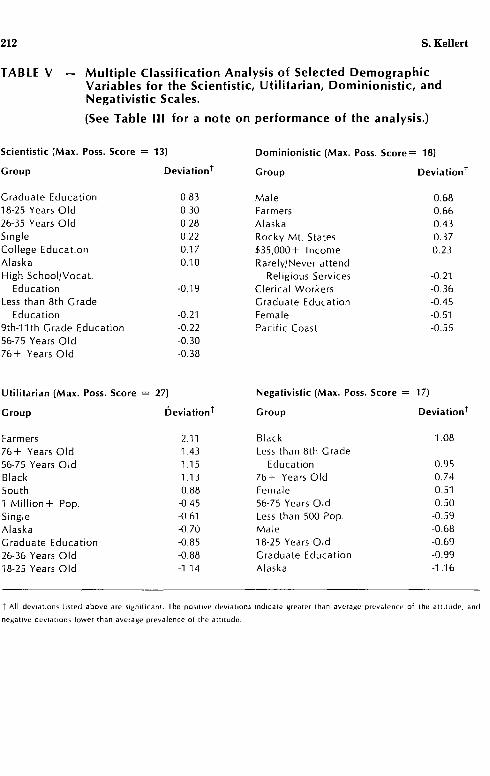
Farmers, the elderly, blacks and Southern respondents had the highest scores on the utilitarian scale. In contrast, persons under 35 years of age, those with graduate school education, Alaska respondents, single persons and residents of areas of one million or more population indicated the least utilitarian interest in animals (Tables II, III and IV). Among animal activity groups, livestock producers, meat hunters and fishermen displayed an especially strong utilitarian orientation in contrast to members of humane, wildlife protection and environmental protection organizations, and, to a somewhat lesser degree, scientific study hobbyists, backpackers, and birdwatchers (Table I).
THE DOMINIONISTIC ATTITUDE
The most dominionistically-oriented animal activity groups were trappers and all three types of hunters. Humane organization mem-
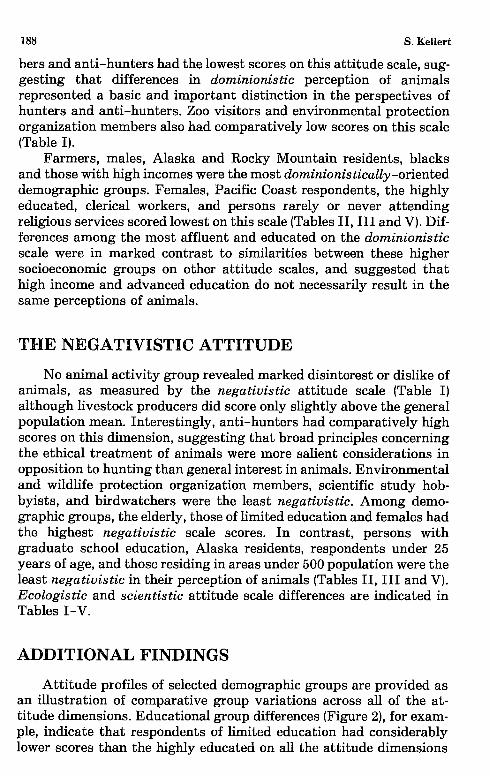
188 S. Kellert
hers and anti-hunters had the lowest scores on this attitude scale, suggesting that differences in dominionistic perception of animals represented a basic and important distinction in the perspectives of hunters and anti-hunters. Zoo visitors and environmental protection organization members also had comparatively low scores on this scale (Table I).
Farmers, males, Alaska and Rocky Mountain residents, blacks and those with high incomes were the most dominionistically-oriented demographic groups. Females, Pacific Coast respondents, the highly educated, clerical workers, and persons rarely or never attending religious services scored lowest on this scale (Tables II, III and V). Differences among the most affluent and educated on the dominionistic scale were in marked contrast to similarities between these higher socioeconomic groups on other attitude scales, and suggested that high income and advanced education do not necessarily result in the same perceptions of animals.
THE NEGATIVISTIC ATTITUDE
No animal activity group revealed marked disinterest or dislike of animals, as measured by the negativistic attitude scale (Table I) although livestock producers did score only slightly above the general population mean. Interestingly, anti-hunters had comparatively high scores on this dimension, suggesting that broad principles concerning the ethical treatment of animals were more salient considerations in opposition to hunting than general interest in animals. Environmental and wildlife protection organization members, scientific study hobbyists, and birdwatchers were the least negativistic. Among demographic groups, the elderly, those of limited education and females had the highest negativistic scale scores. In contrast, persons with graduate school education, Alaska residents, respondents under 25 years of age, and those residing in areas under 500 population were the least negativistic in their perception of animals (Tables II, III and V). Ecologistic and scientistic attitude scale differences are indicated in Tables I-V.
ADDITIONAL FINDINGS
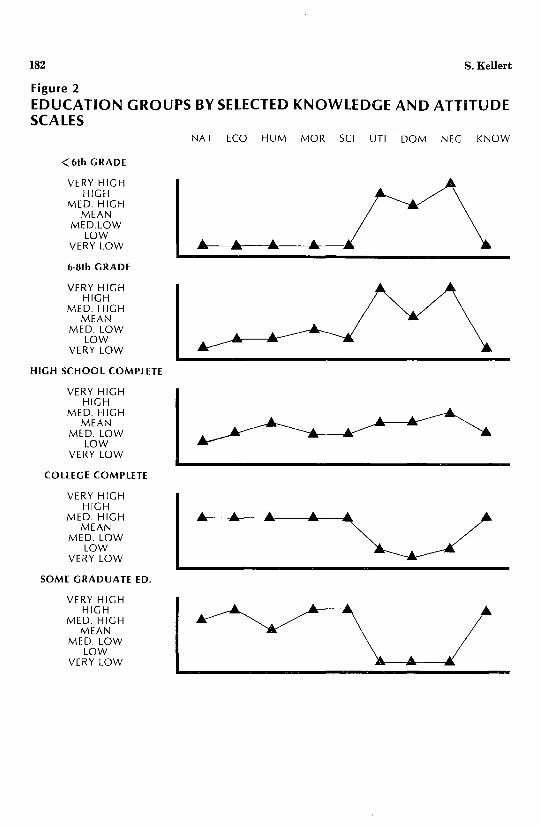
Attitude profiles of selected demographic groups are provided as an illustration of comparative group variations across all of the attitude dimensions. Educational group differences (Figure 2), for example, indicate that respondents of limited education had considerably lower scores than the highly educated on all the attitude dimensions
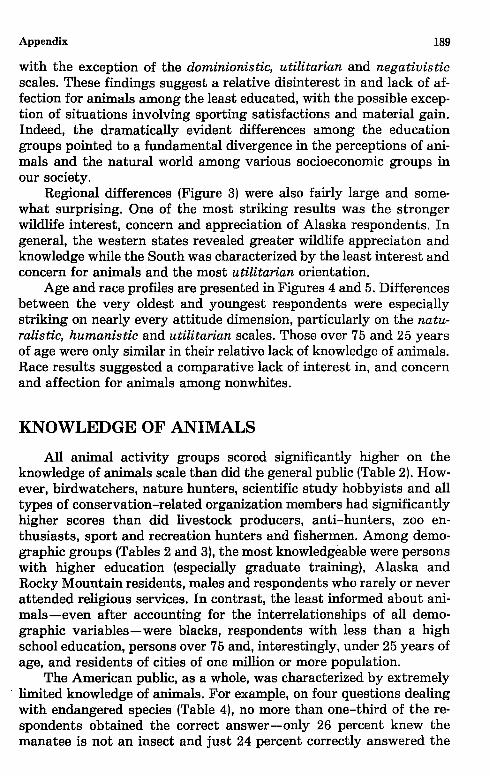
Appendix 189
with the exception of the dominionistic, utilitarian and negativistic scales. These findings suggest a relative disinterest in and lack of affection for animals among the least educated, with the possible exception of situations involving sporting satisfactions and material gain. Indeed, the dramatically evident differences among the education groups pointed to a fundamental divergence in the perceptions of animals and the natural world among various socioeconomic groups in our society.
Regional differences (Figure 3) were also fairly large and somewhat surprising. One of the most striking results was the stronger wildlife interest, concern and appreciation of Alaska respondents. In general, the western states revealed greater wildlife appreciaton and knowledge while the South was characterized by the least interest and concern for animals and the most utilitarian orientation.
Age and race profiles are presented in Figures 4 and 5. Differences between the very oldest and youngest respondents were especially striking on nearly every attitude dimension, particularly on the naturalistic, humanistic and utilitarian scales. Those over 75 and 25 years of age were only similar in their relative lack of knowledge of animals. Race results suggested a comparative lack of interest in, and concern and affection for animals among nonwhites.
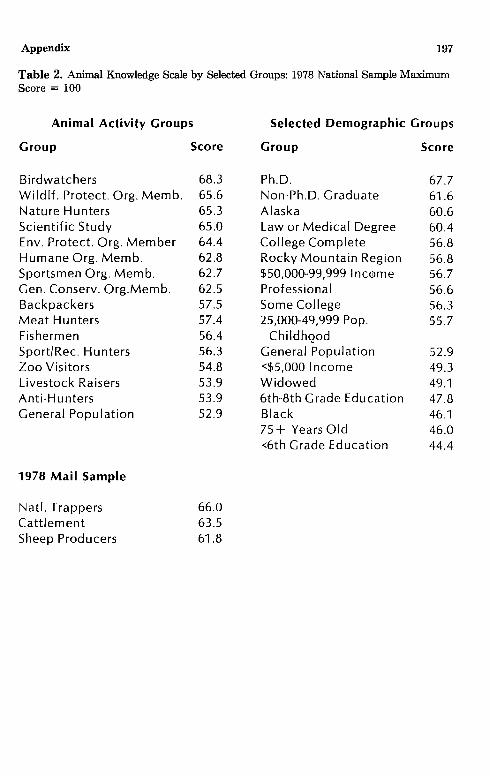
KNOWLEDGE OF ANIMALS
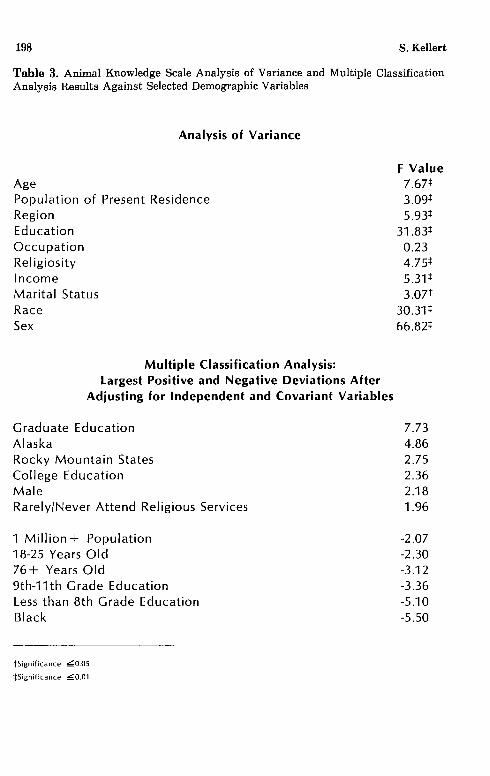
All animal activity groups scored significantly higher on the knowledge of animals scale than did the general public (Table 2). However, birdwatchers, nature hunters, scientific study hobbyists and all types of conservation-related organization members had significantly higher scores than did livestock producers, anti-hunters, zoo enthusiasts, sport and recreation hunters and fishermen. Among demographic groups (Tables 2 and 3), the most knowledgeable were persons with higher education (especially graduate training), Alaska and Rocky Mountain residents, males and respondents who rarely or never attended religious services. In contrast, the least informed about animals-even after accounting for the interrelationships of all demographic variables-were blacks, respondents with less than a high school education, persons over 75 and, interestingly, under 25 years of age, and residents of cities of one million or more population.
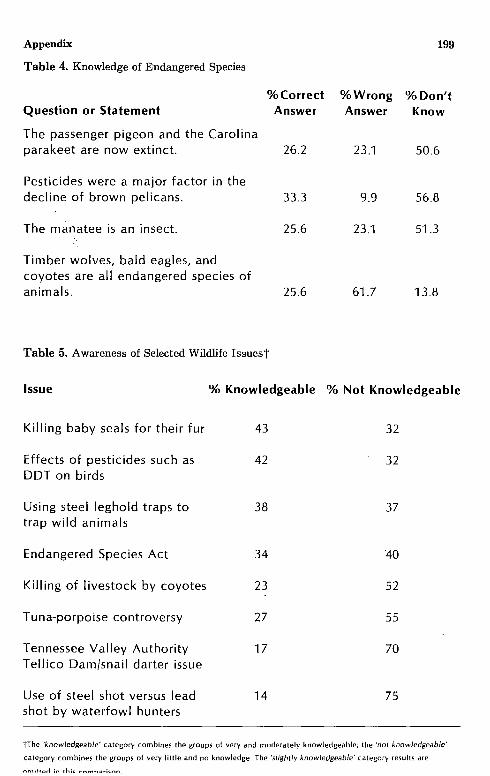
The American public, as a whole, was characterized by extremely · limited knowledge of animals. For example, on four questions dealing
with endangered species (Table 4), no more than one-third of therespondents obtained the correct answer-only 26 percent knew the manatee is not an insect and just 24 percent correctly answered the
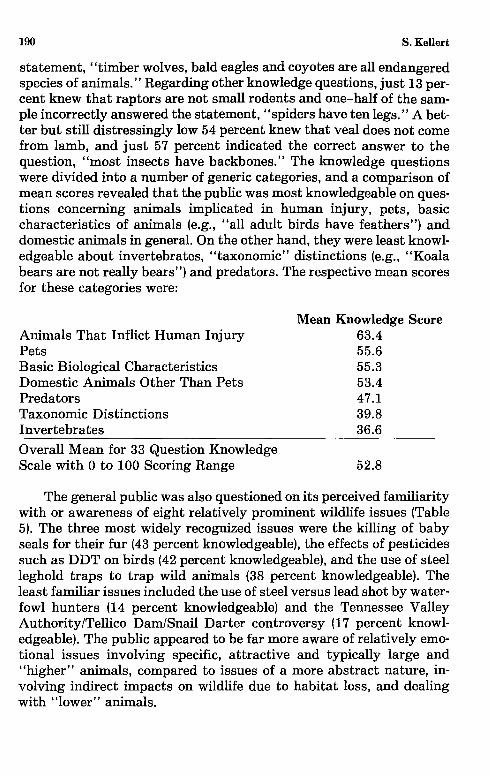
190 S. Kellert
statement, "timber wolves, bald eagles and coyotes are all endangered species of animals." Regarding other knowledge questions, just 13 percent knew that raptors are not small rodents and one-half of the sample incorrectly answered the statement, "spiders have ten legs." A better but still distressingly low 54 percent knew that veal does not come from lamb, and just 57 percent indicated the correct answer to the question, ''most insects have backbones.'' The knowledge questions were divided into a number of generic categories, and a comparison of mean scores revealed that the public was most knowledgeable on questions concerning animals implicated in human injury, pets, basic characteristics of animals (e.g., "all adult birds have feathers") and domestic animals in general. On the other hand, they were least knowledgeable about invertebrates, "taxonomic" distinctions (e.g., "Koala bears are not really bears") and predators. The respective mean scores for these categories were:
Animals That Inflict Human Injury Pets Basic Biological Characteristics Domestic Animals Other Than Pets Predators Taxonomic Distinctions Invertebrates
Overall Mean for 33 Question Knowledge Scale with 0 to 100 Scoring Range
Mean Knowledge Score 63.4 55.6 55.3 53.4 47.1 39.8 36.6
52.8
The general public was also questioned on its perceived familiarity with or awareness of eight relatively prominent wildlife issues (Table 5). The three most widely recognized issues were the killing of baby seals for their fur (43 percent knowledgeable), the effects of pesticides such as DDT on birds (42 percent knowledgeable), and the use of steel leghold traps to trap wild animals (38 percent knowledgeable). The least familiar issues included the use of steel versus lead shot by waterfowl hunters (14 percent knowledgeable) and the Tennessee Valley Authority/Tellico Dam/Snail Darter controversy (17 percent knowledgeable). The public appeared to be far more aware of relatively emotional issues involving specific, attractive and typically large and "higher" animals, compared to issues of a more abstract nature, involving indirect impacts on wildlife due to habitat loss, and dealing with "lower" animals.
Appendix 191
SPECIES PREFERENCE
The national sample was queried on its feelings about 33 species ranked on a seven point like/dislike scale (the most and least liked are indicated in Table 6). The most preferred were two common domestic animals-the dog and the horse-followed by two familiar and highly aesthetic bird species and one insect order-the robin, swan and butterfly. The trout-a popular and highly attractive game species-was the best-liked fish, and the most preferred wild predator was the eagle. The most favored wild mammalian species was the elephant.
On the other hand, three of the four least-liked animals were biting, stinging invertebrates-the cockroach, mosquito and wasp. The third, fifth and sixth least preferred animals-the rat, rattlesnake and bat-have all been implicated in physical injury or disease inflicted on human beings. Relatively negative views of the coyote and wolf were interesting to note given the prevailing controversy over predator control programs in the United States and the considerable amount of favorable publicity received by the wolf in recent years. High standard deviation scores for the wolf, coyote, lizard, skunk, vulture, bat, shark, and cat suggested considerable variation in public opinion regarding the positive and negative qualities of these animals.
A qualitative assessment of the most and least preferred animals, as well as a categorical mean grouping of the 33 animals according to particular qualities (e.g., attractive, unattractive, predator, etc.-see Table 6), suggested a number of particularly important factors in public preference for different species. These factors included:
1. Size (usually, the larger the animal, the more preferred) 2. Aesthetics 3. Intelligence (not only capacity for reason but also for feeling
and emotion) 4. Dangerous to Humans 5. Likelihood of Inflicting Property Damage 6. Predatory Tendencies 7. Phylogenetic Relatedness to Humans 8. Cultural and Historical Relationship 9. Relationship to Human Society: pet, domestic farm, game,
pest, native wildlife, exotic wildlife 10. Texture (generally, the more unfamiliar to humans, the less
preferred) · 11. Mode of Locomotion (generally, the more unfamiliar to hu
mans, the less preferred) 12. Economic Value of the Species
192 S. Kellert
CRITICAL WILDLIFE ISSUES
Public attitudes toward over thirty critical wildlife and natural habitat issues were explored. Insufficient space precludes a review of all these findings, and a detailed description can be found elsewhere (Kellert 1979a). Only a brief summary of results pertaining to the following issues will be provided here: endangered species, predator control, hunting, trapping, harvesting of selected marine mammals and wildlife habitat protection.
Endangered Species Protection of endangered species was generally explored in the
context of various socioeconomic impacts including energy development, water use, forest utilization, and industrial development. The results graphically depicted in Table 7 concern the situation of costly modification of an energy development project in order to protect varying kinds of endangered species. While the public overwhelmingly accepted this sacrifice to protect species of eagle, mountain lion, trout, crocodile and butterfly, less than a majority were willing to tolerate this socioeconomic impact for the sake of plant, snake or spider species.
The results of Table 8 deal with a Tellico Dam-type question involving the protection of a threatened, unknown fish species at the cost of forfeiting various needs derived from these water uses- hydroelectric energy, increased drinking supplies and agricultural irrigation-the public strongly disapproved of curtailing the water projects to protect the unknown fish species. On the other hand, in situations entailing relatively "nonessential" benefits-water for cooling industrial machinery and to make a lake for recreational purposes-less than a majority approved of the projects.
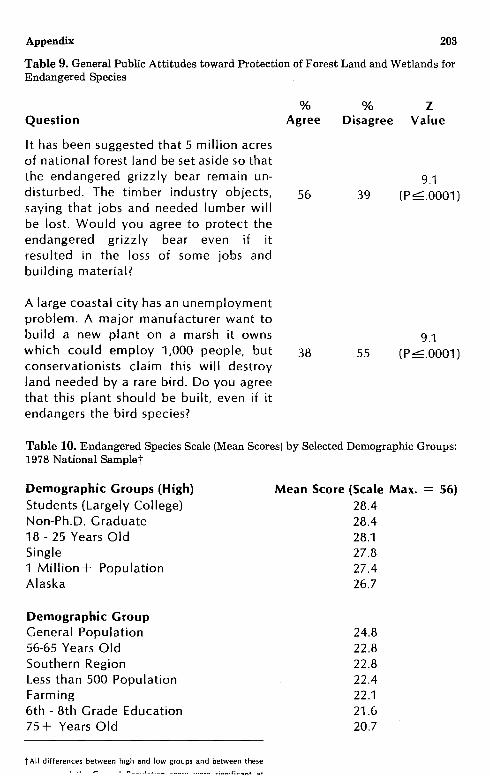
The results in Table 9 cover two additional endangered species questions. The first concerns the preservation of large amounts of wilderness habitat to protect the grizzly bear at the expense of forest products and jobs. The results suggest a moderate, but significant public willingness to accept this economic sacrifice to protect the species. The second question concerns the filling of wetlands to build an industrial plant in an area of high unemployment. The endangered species is an unspecified bird species and, in line with the grizzly bear result, the public indicated a significant but moderate support for protection despite the socioeconomic impact.
These results and related literature suggest eight factors critically related to the public's willingness to protect endangered wildlife (Ehrenfeld 1970; Guggisberg 1970; Ziswiler 1967). The first is aesthetics, which was probably relevant in results involving the but-
Appendix 193
terfly, snake and spider. The second is phylogenetic relatedness to humans. Generally speaking, the closer the biological relation of the endangered animal to human beings, the greater the likelihood of public support for the species. The third factor is the reason for endangerment, with typically greater public sympathy in cases involving direct causes of endangerment (e.g., overexploitation or persecution) than in situations involving indirect impacts (e.g., habitat loss due to expanding human populations). The fourth factor is the economic value of the species being exploited. The fifth concerns the numbers and types of people affected by efforts to protect the endangered animal. The cultural and historical significance of the endangered species is the sixth factor, and may have been involved in public sympathy for the bald eagle and trout. The seventh variable is the public's knowledge and familiarity with the endangered animal. Public support for the American crocodile may reflect this factor. Finally, the perceived humaneness of the activity threatening the species may be important. For example, the relatively slight opposition to water uses endangering an unknown fish species may have stemmed partially from assumptions regarding the capacities of fish to suffer or experience pain.
The willingness to protect endangered wildlife varied considerably among diverse demographic groups. These variations are summarized in the results of an endangered species protection scale developed on the basis of the four previously described endangered species questions. As Table 10 indicates, significantly higher scores (i.e., a greater willingness to protect endangered species) were found among the highly educated, younger and single respondents, persons residing in areas of more than one million population, and residents of Alaska. In contrast, older respondents, persons with less than an eighth grade education, farmers, residents of highly rural areas and residents of the South had significantly lower endangered species protection scores.
One of the most controversial issues facing the wildlife field today is predator control. Table 11 deals with the issue of controlling coyotes that prey on domestic livestock. Five control options were considered and the views of an informed and uninformed general public, as well as members of the American Sheep Producers and National Cattlemen's Associations were contrasted.* Options considered included the two most controversial control strategies: indiscriminate population reductions by shooting or trapping as many coyotes as possible, and poison-
*Results of the fifth option-compensating ranchers for livestock losses out of general tax revenues-is not presented. Both the general public and livestock producers were opposed to this alternative.
194 S. Kellert
ing. The public was moderately opposed to indiscriminate population reductions (with the informed public significantly more opposed) and overwhelmingly against the use of poisons (even though this alternative was described as the least expensive). In dramatic contrast, livestock producers were strongly in favor of both control strategies (indeed, these differences were, statistically, the largest found in the study).
As indicated in Table 11, nearly 79 percent of the public supported the notion of hunting only individual coyotes known to have killed livestock. Additionally, more than two-thirds approved of capturing and relocating coyotes in areas away from livestock despite this being described as a very expensive solution. While livestock producers were strongly opposed to coyote relocation efforts, they were somewhat divided on the notion of hunting only individual coyotes responsible for livestock loss.
In general, the predator control results indicated a strong public concern for the humaneness and specificity of the control method as indicated by strong opposition to the use of poisons and support for controlling only individual offender coyotes.
An equally controversial issue is the public's attitude toward hunting. Attitudes toward six different kinds of hunting were explored. Table 12 indicates the public overwhelmingly approved of the two most pragmatically justified types of hunting-subsistence hunting as practiced by traditional native Americans and hunting exclusively for meat regardless of the identity of the hunter. On the other hand, approximately 60 percent opposed hunting solely for recreational or sporting purposes, whether for waterfowl or big game. Moreover, over 80 percent objected to the notion of hunting for a trophy. Perhaps most interestingly, 64 percent approved of hunting for recreational purposes if this also included using the meat. The implication is that hunting is viewed as too serious an activity to be engaged in solely for its sporting or recreational value, but is acceptable if the animal's meat is to be consumed.
Over 70 percent of the public objected to the use of the steel leghold trap. No difference was found between knowledgeable and uninformed people. On the other hand, nearly all trappers saw nothing wrong with the use of these traps (Table 13).
Somewhat unexpectedly, 77 percent of the general public approved of killing whales for a useful product so long as the species was not endangered. A very different perception of the dolphin was indicated with nearly 70 percent willing to pay a higher price for tuna if this resulted in fishermen killing fewer porpoises in their nets. The disparity between these two marine mammal findings may have been related to the colorful and romantic history of whaling in America, as opposed
Appendix 195
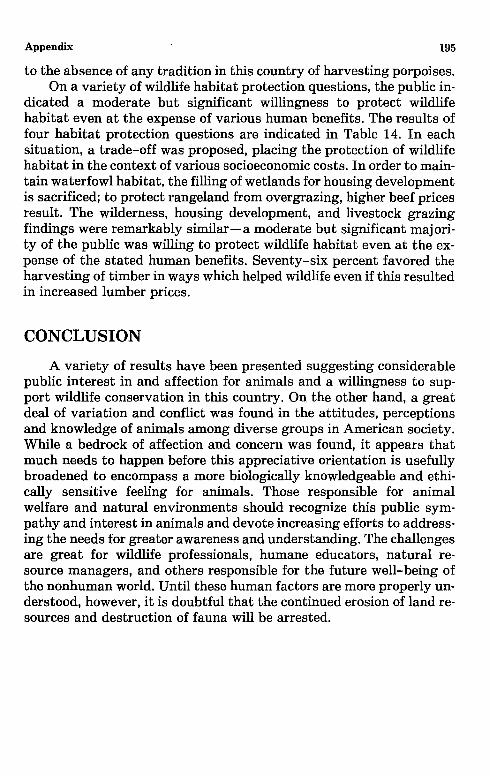
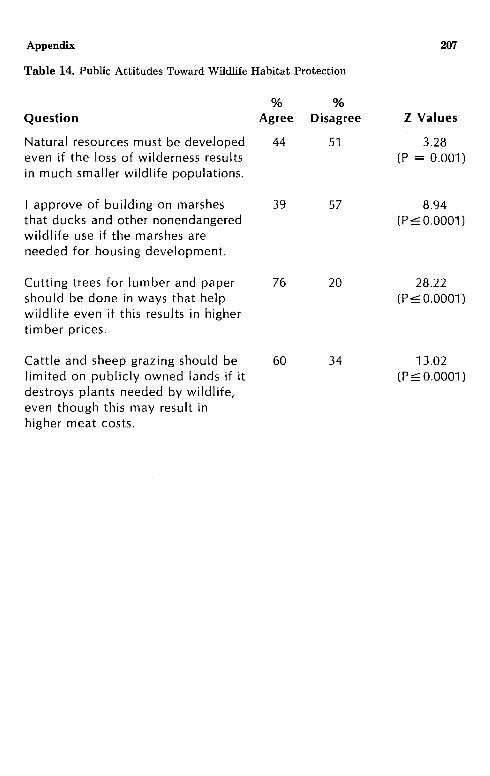
to the absence of any tradition in this country of harvesting porpoises. On a variety of wildlife habitat protection questions, the public in
dicated a moderate but significant willingness to protect wildlife habitat even at the expense of various human benefits. The results of four habitat protection questions are indicated in Table 14. In each situation, a trade-off was proposed, placing the protection of wildlife habitat in the context of various socioeconomic costs. In order to maintain waterfowl habitat, the filling of wetlands for housing development is sacrificed; to protect rangeland from overgrazing, higher beef prices result. The wilderness, housing development, and livestock grazing findings were remarkably similar-a moderate but significant majority of the public was willing to protect wildlife habitat even at the expense of the stated human benefits. Seventy-six percent favored the harvesting of timber in ways which helped wildlife even if this resulted in increased lumber prices.
CONCLUSION
A variety of results have been presented suggesting considerable public interest in and affection for animals and a willingness to support wildlife conservation in this country. On the other hand, a great deal of variation and conflict was found in the attitudes, perceptions and knowledge of animals among diverse groups in American society. While a bedrock of affection and concern was found, it appears that much needs to happen before this appreciative orientation is usefully broadened to encompass a more biologically knowledgeable and ethically sensitive feeling for animals. Those responsible for animal welfare and natural environments should recognize this public sympathy and interest in animals and devote increasing efforts to addressing the needs for greater awareness and understanding. The challenges are great for wildlife professionals, humane educators, natural resource managers, and others responsible for the future well-being of the nonhuman world. Until these human factors are more properly understood, however, it is doubtful that the continued erosion of land resources and destruction of fauna will be arrested.
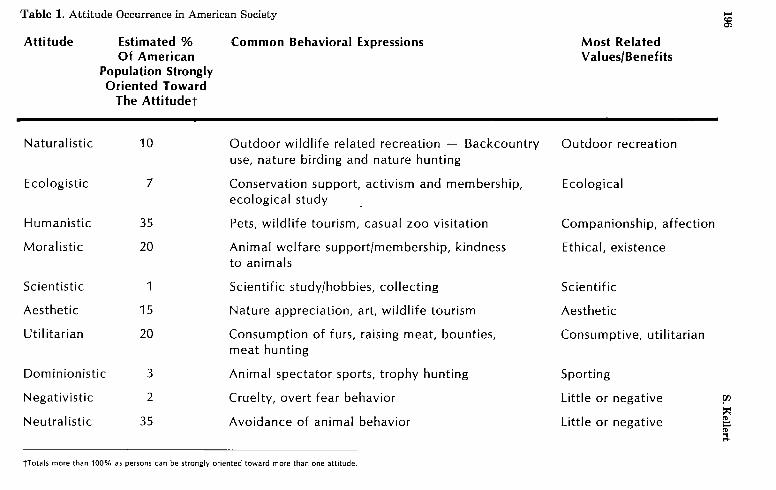
Table 1. Attitude Occurrence in American Society
Attitude Estimated % Common Behavioral Expressions Of American
Population Strongly Oriented Toward
The Attitudet
Naturalistic 10 Outdoor wildlife related recreation - Backcountry use, nature birding and nature hunting
Ecologistic 7 Conservation support, activism and membership, ecological study
Humanistic 35 Pets, wildlife tourism, casual zoo visitation
Moralistic 20 Animal welfare support/membership, kindness to animals
Scientistic 1 Scientific study/hobbies, collecting
Aesthetic 15 Nature appreciation, art, wildlife tourism
Uti I itarian 20 Consumption of furs, raising meat, bounties, meat hunting
Dominionistic 3 Animal spectator sports, trophy hunting
Negativistic 2 Cruelty, overt fear behavior
Neutralistic 35 Avoidance of animal behavior
tTotals more than 100% as persons can be strongly oriented toward more than one attitude.
Most Related Values/Benefits
Outdoor recreation
Ecological
Companionship, affection
Ethical, existence
Scientific
Aesthetic
Consumptive, utilitarian
Sporting
Little or negative
Little or negative
..... i§l
fiJ ~ "' r;: ... ....
Appendix 197
Table 2. Animal Knowledge Scale by Selected Groups: 1978 National Sample Maximum Score= 100
Animal Activity Groups Selected Demographic Groups
Group Score Group Score
Birdwatchers 68.3 Ph.D. 67.7 Wildlf. Protect. Org. Memb. 65.6 Non-Ph.D. Graduate 61.6 Nature Hunters 65.3 Alaska 60.6 Scientific Study 65.0 Law or Medical Degree 60.4 Env. Protect. Org. Member 64.4 College Complete 56.8 Humane Org. Memb. 62.8 Rocky Mountain Region 56.8 Sportsmen Org. Memb. 62.7 $50,000-99,999 I neG> me 56.7 Gen. Conserv. Org.Memb. 62.5 Professional 56.6 Backpackers 57.5 Some College 56.3 Meat Hunters 57.4 25,000-49,999 Pop. 55.7 Fishermen 56.4 Childhqod Sport/Rec. Hunters 56.3 General Population 52.9 Zoo Visitors 54.8 <$5,000 Income 49.3 Livestock Raisers 53.9 Widowed 49.1 Anti-Hunters 53.9 6th-8th Grade Education 47.8 General Population 52.9 Black 46.1
75 + Years Old 46.0 <6th Grade Education 44.4
1978 Mail Sample
Natl. Trappers 66.0 Cattlement 63.5 Sheep Producers 61.8
198 S. Kellert
Table 3. Animal Knowledge Scale Analysis of Variance and Multiple Classification Analysis Results Against Selected Demographic Variables
Analysis of Variance
Age Population of Present Residence Region Education Occupation Religiosity Income Marital Status Race Sex
Multiple Classification Analysis: Largest Positive and Negative Deviations After
Adjusting for Independent and Covariant Variables
Graduate Education Alaska Rocky Mountain States College Education Male Rarely/Never Attend Religious Services
1 Million+ Population 18-25 Years Old 76 + Years Old 9th-11th Grade Education Less than 8th Grade Education Black
tSignificance ~0.05
:f:Significance ~0.01
F Value 7.67+ 3.09+ 5.93+
31.83+ 0.23 4.75+ 5.31+ 3.07t
30.31+ 66.82+
7.73 4.86 2.75 2.36 2.18 1.96
-2.07 -2.30 -3.12 -3.36 -5.10 -5.50
Appendix
Table 4. Knowledge of Endangered Species
%Correct Question or Statement Answer
The passenger pigeon and the Carolina parakeet are now extinct. 26.2
Pesticides were a major factor in the decline of brown pelicans. 33.3
The manatee is an insect. 25.6
Timber wolves, bald eagles, and coyotes are all endangered species of animals. 25.6
Table 5. Awareness of Selected Wildlife Issuest
Issue % Knowledgeable
Killing baby seals for their fur
Effects of pesticides such as DDT on birds
Using steel leghold traps to trap wild animals
Endangered Species Act
Killing of livestock by coyotes
Tuna-porpoise controversy
Tennessee Valley Authority Tellico Dam/snail darter issue
Use of steel shot versus lead shot by waterfowl hunters
43
42
38
34
23
27
17
14
199
%Wrong %Don't Answer Know
23.1 50.6
9.9 56.8
23.1 51.3
61.7 13.8
% Not Knowledgeable
32
32
37
40
52
55
70
75
tThe 'knowledgeable' category combines the groups of very and moderately knowledgeable; the 'not knowledgeable'
category combines the groups of very little and no knowledge. The 'slightly knowledgeable' category results are
nrnitta.-1 in thi" r-nrnn!lric;nn
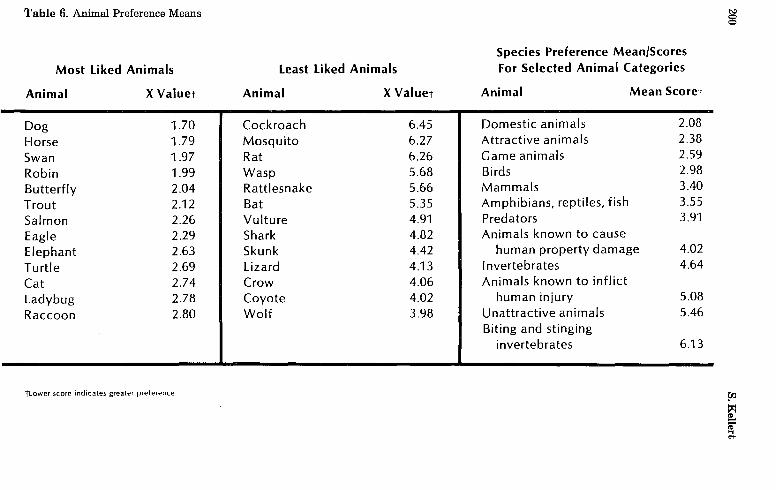
Table 6. Animal Preference Means
Most Liked Animals Least Liked Animals
Animal X Valuet Animal X Valuet
Dog 1.70 Cockroach 6.45 Horse 1.79 Mosquito 6.27 Swan 1.97 Rat 6.26 Robin 1.99 Wasp 5.68 Butterfly 2.04 Rattlesnake 5.66 Trout 2.12 Bat 5.35 Salmon 2.26 Vulture 4.91 Eagle 2.29 Shark 4.82 Elephant 2.63 Skunk 4.42 Turtle 2.69 Lizard 4.13 Cat 2.74 Crow 4.06 Ladybug 2.78 Coyote 4.02
Raccoon 2.80 Wolf 3.98
tLower score indicates greater preference
Species Preference Mean/Scores For Selected Animal Categories
Animal Mean Scoret
Domestic animals 2.08 Attractive animals 2.38 Game animals 2.59 Birds 2.98 Mammals 3.40 Amphibians, reptiles, fish 3.55 Predators 3.91 Animals known to cause
human property damage 4.02 Invertebrates 4.64 Animals known to inflict
human injury 5.08 Unattractive animals 5.46 Biting and stinging
invertebrates 6.13
N
8
!7J ~ ~ "' ..., ....
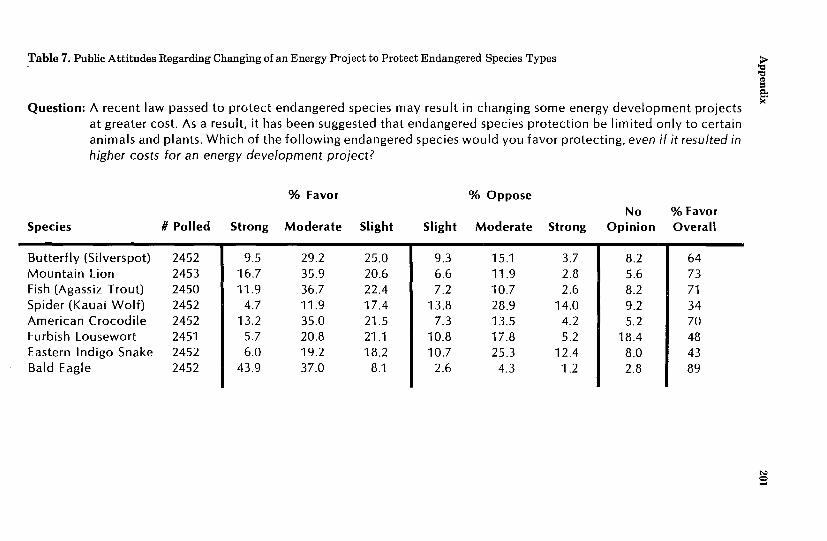
Table 7. Public Attitudes Regarding Changing of an Energy Project to Protect Endangered Species Types
Question: A recent law passed to protect endangered species may result in changing some energy development projects at greater cost. As a result, it has been suggested that endangered species protection be limited only to certain animals and plants. Which of the following endangered species would you favor protecting, even if it resulted in higher costs for an energy development project?
% Favor %Oppose No %Favor
Species # Polled Strong Moderate Slight Slight Moderate Strong Opinion Overall
Butterfly (Silverspot) 2452 9.5 29.2 25.0 9.3 15.1 3.7 8.2 64 Mountain Lion 2453 16.7 35.9 20.6 6.6 11.9 2.8 5.6 73 Fish (Agassiz Trout) 2450 11.9 36.7 22.4 7.2 10.7 2.6 8.2 71 Spider (Kauai Wolf) 2452 4.7 11.9 17.4 13.8 28.9 14.0 9.2 34 American Crocodile 2452 13.2 35.0 21.5 7.3 13.5 4.2 5.2 70 Furbish Lousewort 2451 5.7 20.8 21.1 10.8 17.8 5.2 18.4 48 Eastern Indigo Snake 2452 6.0 19.2 18.2 10.7 25.3 12.4 8.0 43 Bald Eagle 2452 43.9 37.0 8.1 2.6 4.3 1.2 2.8 89
~ 't:l
"' = ~
~ .....
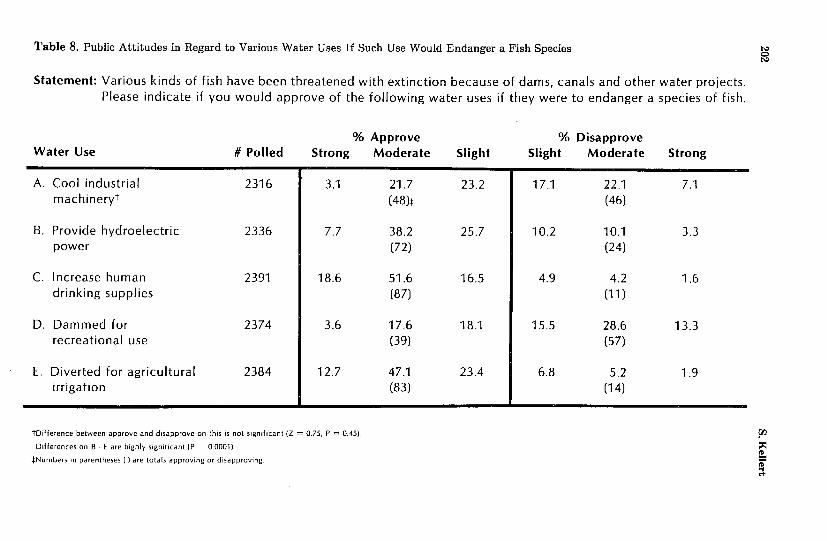
Table 8. Public Attitudes in Regard to Various Water Uses If Such Use Would Endanger a Fish Species N
~
Statement: Various kinds of fish have been threatened with extinction because of dams, canals and other water projects. Please indicate if you would approve of the following water uses if they were to endanger a species of fish.
%Approve % Disapprove Water Use # Polled Strong Moderate Slight Slight Moderate Strong
A. Cool industrial 2316 3.1 21.7 23.2 17.1 22.1 7.1 machineryt (48)+ (46)
B. Provide hydroelectric 2336 7.7 38.2 25.7 10.2 10.1 3.3 power (72) (24)
C. Increase human 2391 18.6 51.6 16.5 4.9 4.2 1.6 drinking supplies (87) (11)
D. Dammed for 2374 3.6 17.6 18.1 15.5 28.6 13.3 recreational use (39) (57)
E. Diverted for agricultural 2384 12.7 47.1 23.4 6.8 5.2 1.9 irrigation (83) (14)
tDifference between approve and disapprove on this is not significant {Z = 0.75. P = 0.45) rn Differences on B- E are highly s1gnif1cant (P 0.0001) ~
"' +Numbers m parentheses () are totals approvmg or d1sapprovmg ;= ... ....
Appendix 203
Table 9. General Public Attitudes toward Protection of Forest Land and Wetlands for Endangered Species
Question
It has been suggested that 5 million acres of national forest land be set aside so that the endangered grizzly bear remain undisturbed. The timber industry objects, saying that jobs and needed lumber will be lost. Would you agree to protect the endangered grizzly bear even if it resulted in the loss of some jobs and building material?
A large coastal city has an unemployment problem. A major manufacturer want to build a new plant on a marsh it owns which could employ 1,000 people, but conservationists claim this will destroy land needed by a rare bird. Do you agree that this plant should be built, even if it endangers the bird species?
% Agree
56
38
% z Disagree Value
39
55
9.1 (P<:::::.0001)
9.1 (PL:.0001)
Table 10. Endangered Species Scale (Mean Scores) by Selected Demographic Groups: 1978 National Samplet
Demographic Groups (High) Students (Largely College) Non-Ph.D. Graduate 18- 25 Years Old Single 1 Million+ Population Alaska
Demographic Group General Population 56-65 Years Old Southern Region Less than 500 Population Farming 6th - 8th Grade Education 75 + Years Old
tAll differences between high and low groups and between these
Mean Score (Scale Max. = 56) 28.4 28.4 28.1 27.8 27.4 26.7
24.8 22.8 22.8 22.4 22.1 21.6 20.7
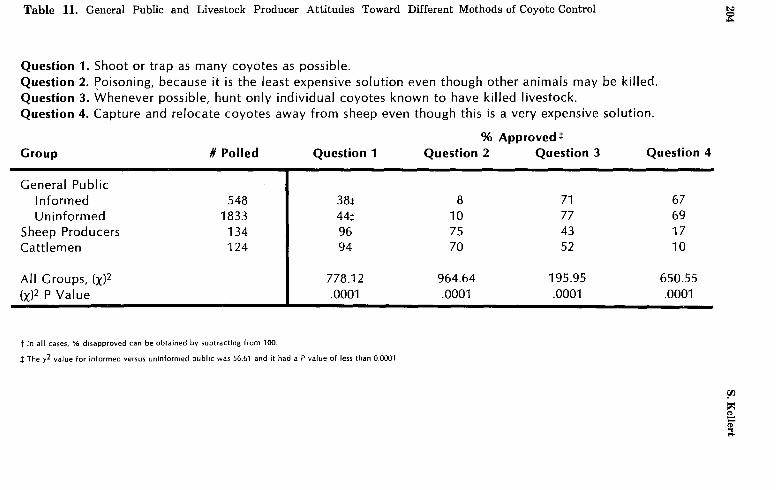
Table 11. General Public and Livestock Producer Attitudes Toward Different Methods of Coyote Control
Question 1. Shoot or trap as many coyotes as possible. Question 2. ~oisoning, because it is the least expensive solution even though other animals may be killed. Question 3. Whenever possible, hunt only individual coyotes known to have killed livestock. Question 4. Capture and relocate coyotes away from sheep even though this is a very expensive solution.
%Approved+ Group II Polled Question 1 Question 2 Question 3 Question 4
General Public Informed 548 38:t: 8 71 67 Uninformed 1833 44:t: 10 77 69
Sheep Producers 134 96 75 43 17 Cattlemen 124 94 70 52 10
All Groups, (x)2 778.12 964.64 195.95 650.55 (x)2 P Value .0001 .0001 .0001 .0001
tIn all cases, % disapproved can be obtained by subtracting from 100.
+The x2 value for informed versus uninformed public was 56.61 and it had a P value of less than 0.0001
~
!ll ~
'" i .....
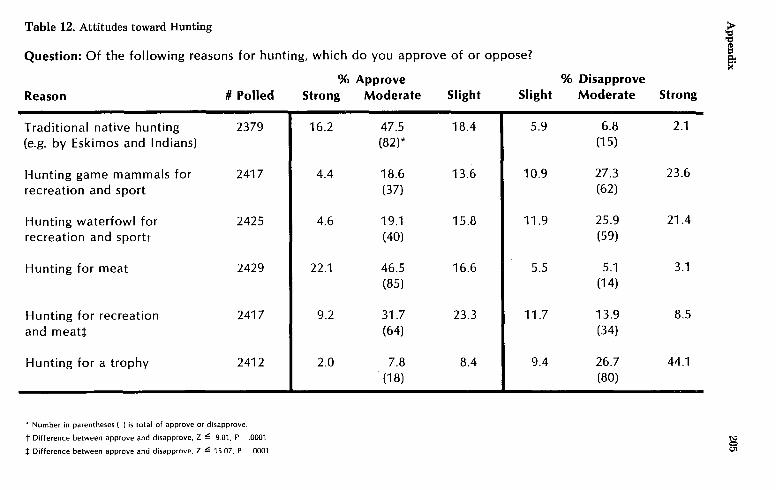
Table 12. Attitudes toward Hunting ~ 'tl
"' Question: Of the following reasons for hunting, which do you approve of or oppose? t:l
~ %Approve % Disapprove
Reason II Polled Strong Moderate Slight Slight Moderate Strong
Traditional native hunting 2379 16.2 47.5 18.4 5.9 6.8 2.1 (e.g. by Eskimos and Indians) (82)* (15)
Hunting game mammals for 2417 4.4 18.6 13.6 10.9 27.3 23.6 recreation and sport (37) (62)
Hunting waterfowl for 2425 4.6 19.1 15.8 11.9 25.9 21.4 recreation and sportt (40) (59)
Hunting for meat 2429 22.1 46.5 16.6 5.5 5.1 3.1 (85) (14)
Hunting for recreation 2417 9.2 31.7 23.3 11.7 13.9 8.5 and meat!: (64) (34)
Hunting for a trophy 2412 2.0 7.8 8.4 9.4 26.7 44.1 (18) (80)
• Number in parentheses ( ) is total of approve or disapprove.
t Difference between approve and disapprove, Z ~ 9.81, P .0001 N 0
:t: Difference between approve and disapprove, Z ~ 15.07, P .0001 C1
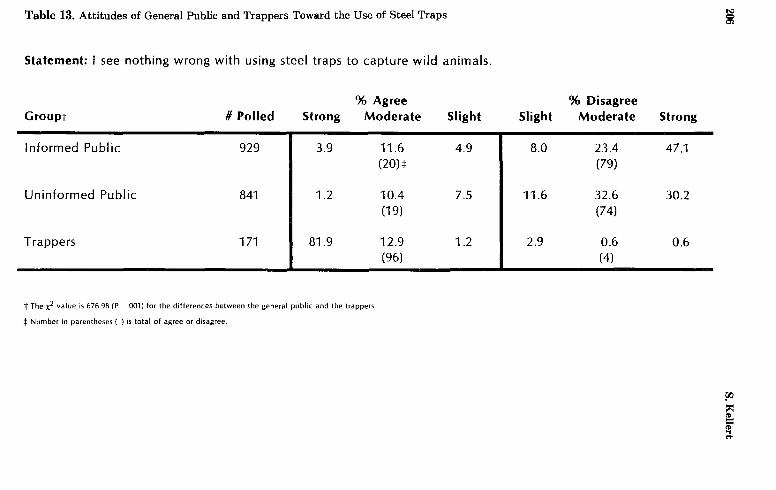
Table 13. Attitudes of General Public and Trappers Toward the Use of Steel Traps
Statement: I see nothing wrong with using steel traps to capture wild animals.
%Agree Groupt # Polled Strong Moderate Slight
Informed Public 929 3.9 11.6 4.9 (20)t
Uninformed Public 841 I 1.2 10.4 7.5 (19)
Trappers 171 I 81.9 12.9 1.2 (96)
t The x2 value is 676.98 (P .001) for the differences between the general public and the trappers.
+ Number in parentheses { ) is total of agree or disagree.
% Disagree Slight Moderate
8.0 23.4 (79)
11.6 32.6 (74)
2.9 0.6 (4)
Strong
47.1
30.2
0.6
i
rn 1:1':1
"' t:: Sl .....
Appendix 207
Table 14. Public Attitudes Toward Wildlife Habitat Protection
% % Question Agree Disagree Z Values
Natural resources must be developed 44 51 3.28 even if the loss of wilderness results (P = 0.001) in much smaller wildlife populations.
I approve of building on marshes 39 57 8.94 that ducks and other nonendangered (P::::: 0.0001) wildlife use if the marshes are needed for housing development.
Cutting trees for lumber and paper 76 20 28.22 should be done in ways that help (P::::0.0001) wildlife even if this results in higher timber prices.
Cattle and sheep grazing should be 60 34 13.02 limited on publicly owned lands if it (P:=0.0001) destroys plants needed by wildlife, even though this may result in higher meat costs.
208 S.Kellert
TABLE I Scale Mean Scores by Selected Animal Activity Groups: 1978 National Sample
NAT ECO HUM MOR SCI UTI DOM NEG Max. Poss. Score t 16 11 11 20 13 27 18 17
General Population 3.1 3.1 4.0 5.5 0.9 5.3 2.0 4.4 Anti-Hunters 3.4 3.2 4.6 7.9 1.0 4.4 1.2 4.1 Backpackers 5.4 4.5 4.4 7.0 1.6 3.7 2.3 2.7 Birdwatchers 6.3 5.4 3.7 5.5 2.0 3.7 2.6 2.6 Env. Protect. Org. Memb. 6.5 7.7 4.8 9.6 1.9 1.6 1.5 1.5 Fishermen 4.0 3.6 4.1 4.4 1.0 5.4 3.0 3.6 Gen. Conserv. Org. Memb. 4.6 4.5 4.1 6.3 1.6 4.0 2.2 3.1 Humane Org. Memb. 5.6 5.1 6.1 9.5 1.8 3.0 0.9 2.7 Meat Hunters 4.1 3.9 4.0 4.2 1.0 5.6 3.3 3.2 Livestock Raisers 3.2 3.2 3.2 4.5 1.0 7.3 2.7 4.5 Nature Hunters 8.5 5.7 3.9 4.8 1.5 3.8 3.8 2.9 Scientific Study 5.7 5.3 4.5 8.0 2.7 3.3 1.8 2.2 Sport-Rec. Hunters 3.8 3.8 3.8 2.9 1.2 5.4 4.1 3.4 Sportsmen Org. Memb. 5.7 5.4 3.8 4.3 1.4 4.8 4.1 2.7 Wildlf. Protect. Org. Memb. 5.8 6.3 4.4 7.7 2.2 2.9 1.7 2.7 Zoo Visitors 4.4 3.6 4.8 7.1 1.2 4.0 1.5 3.4
1978 Mail Sample
Cattlemen 3.9 5.2 3.2 1.3 0.9 13.1 5.1 3.8 Natl. Trappers 9.6 7.3 4.0 2.8 1.8 3.4 8.5 2.1 Sheep Producers 3.7 4.5 3.3 2.0 1.08 12.8 4.7 3.9
t The score maxima for each attitude varies because there was a different number of questions for each attitude with different scoring.
For example, there were eight questions for the Naturalistic attitude with a score of either 2 or 0 for three questions and scores of 2,1 or 0
for the other five. The number of questions for the other attitudes are (in the order listed in the table) 4, 5, 10, 6, 13, 8 and 8, respectively.
Appendix 209
TABLE II Demographic Groups (selected) and Mean Scores for Different Attitudes.
NAT ECO HUM MOR SCI UTI DOM NEG Max. Pass. Score 16 11 11 20 13 27 18 17
General Population 3.1 3.1 4.0 5.5 0.9 5.3 2.0 4.4
Regions Alaska 4.6 4.4 3.7 4.5 1.3 4.1 2.4 2.4 North Central North East Pacific 3.6 3.6 4.4 7.5 1.5 Rocky Mountain 2.3 Southern 3.6 4.5 6.4 2.3
General Groups Male 3.4 3.4 3.6 4.7 2.6 Female 4.3 6.0 1.5 Black 2.1 2.4 3.7 6.4 2.5 5.6 White Married Single 3.6 4.3 6.1 1.3 4.1 Never Religious Service 3.9 3.7 4.3 6.7 1.2 4.1 1/Week Religious Service 2.8 3.5 5.9
Education <6th Grade 1.3 2.3 2.4 3.6 0.4 6.9 2.6 6.4 6th-8th Grade 2.1 2.6 3.4 4.7 0.6 7.1 2.4 5.8 9th-12th Grade 2.4 2.5 0.6 6.1 5.1
Student 4.0 3.6 4.4 6.7 1.6 3.9 1.7 3.3 Non-PhD. Graduate 4.5 4.5 6.8 1.7 4.2 3.0 PhD. 5.3 4.6 7.3 1.9 3.7 1.5 2.3
Employment Unemployed 2.4 2.7 Retired 2.5 3.7 6.3 1.8 5.3 Vocational 2.7 2.7 3.7 6.4 5.3 Professional 3.7 3.6 6.2 1.2 4.6 1.7 Unskilled 2.8 4.6 2.5 Blue Collar 2.7 2.8 Service 2.6 2.8 Farming 2.4 2.7 3.1 3.7 8.5 2.7 5.3
Age 18-25 Years Old 3.4 4.8 6.2 1.2 4.1 3.5 26-35 Years Old 3.4 6.1 1.2 4.2 1.8 56-65 Years Old 2.8 3.7 0.6 6.4 66-75 Years Old 2.5 2.6 3.4 4.7 0.6 7.0 5.3 75 + Years Old 2.2 2.6 3.2 0.4 7.1 6.0
210 S. Kellert
TABLE II (Continued)
NAT ECO HUM MOR SCI UTI DOM NEG Income <$5,000 2.6 2.7 3.7 0.7 6.1 2.3 5.4 $15,000-14,999 3.4 6.0 4.6 $25,000-34,999 3.6 3.5 4.5 $50,000-99,999 3.7 4.7 2.6 3.5
Population - Childhood Community
<500 2.8 3.4 4.0 0.7 6.4 2.4 25,000-49,999 3.5 3.4 6.7 4.6 1.7 250,000-999,999 3.4 3.4 4.3 6.0 1.2 1 Million+ 6.4 4.6 1.8
Population - Present Community
<500 3.2 3.3 6.3 2.5 25,000-49,999 3.6 3.4 4.4 6.1 1.2 4.7 250,000-999,999 4.3 1.8 1 Million+ 6.3
• Mean Scores are the same (i.e. do not differ significantly} as those reported for the General Population.
TABLE Ill - Analysis of Variance of Selected Demographic Variables by Attitude Scales*
Variable F Values
NAT ECO HUM MOR SCI UTI DOM NEG Age 9.64t 2.53t 11.31 t 3.35t 15.69t 24.95t 0.99 15.91 t Population of Present Residence 1.08 0.56 0.74 2.47t 0.91 1.70 1.68 2.41t Region 5.03t 3.42t 4.o6t 12.5ot 0.56 10.01 t 6.98t 6.41t Education 12.03t 18.37t 0.56 4.82t 20.03t 4.49t 2.71t 13.23t Occupation 0.73 1.72 1.79 1.84 0.57 3.28t 1.88 0.61 Religiosity 4.97t 4.41 t 5.34t 6.38t 1.06 5.o9t 3.62t 2.46t Income 3.69t 1.33 5.56t 1.59 0.34 3.92t 0.84 5.41 t Marital Status 0.69 0.32 0.63 1.81 6.12t 5.55t 0.27 1.73 Race 15.13t 11.45t 2.39 0.94 0.60 11.54t 6.1ot 23.04t Sex 23.16t 26.90t 63.12t 63.18t 1.52 20.76t 183.93t 128.91t
• Only main effect F values and significance levels are indicated. Two analysis of variance tests were performed. The first included as
main effects: age, population of present residence, region, education, occupation; and, as covariates: attendance at religious services
(religiosity), income, marital status, race and sex. The second run included as main effects: religiosity, income, marital status, race and
sex; and, as covariates: age, population of present residence and education. Occupation and region could not be included as
covariates in the second analysis due to their nonlinear character.
t F value has significance of less than 0.01
:t: F value has significance of less than 0.05
Appendix
TABLE IV Multiple Classification Analysis of Selected Demographic Variables for the Naturalistic, Ecologistic, Humanistic and Moralistic scales.
(See Table Ill for note on performance of the analysis.)
Naturalistic (Max Score = 16) Ecologistic (Max Score = 11)
211
Group Deviationt Group Deviationt
Graduate Education 1.13 Graduate Education 1.28 Alaska 0.85 Alaska 0.94 18-25 Years Old 0.52 Prof./Manag. Occ. 0.31 26-35 Years Old 0.36 Rarely/Never College Education 0.36 Attend Religious Service 0.27 Pacific Coast 0.31 Male 0.27 Rarely/Never attend 500-1.999 Pop. 0.24
Religious Services 0.31 56-75 Years Old -0.29 Clerical Occupation -0.44 Unskilled Blue Collar -0.32 76 + Years Old -0.49 Less than 8th Grade 56-75 Years Old -0.54 Education -0.35 9-11 th Grade Education -0.54 9-11th Grade Education -0.58 Less than 8th Grade Black -0.62
education -0.61 Black -0.87
Humanistic (Max Score = 11) Moralistic (Max Poss. Score = 20)
Group Deviationt Group Deviationt
18-25 Years Old 0.71 Pacific Coast 1.59 $20,000-34,999 Income 0.36 Clerical Workers 1.37 Female 0.33 Graduate Education 1.32 Rarely/Never Female 0.64
Attend Religious Service 0.31 Rarely/Never Pacific Coast 0.27 Attend Religious Service 0.61 Less than 500 Pop. -0.42 South 26-34 Years Old 0.49 Male -0.45 18-25 Years Old 0.44 Alaska -0.58 -0.80 76+ Years Old -0.67 500-1,999 Pop. -0.83 Farmers -0.90 Male -0.86 Less than 500 Pop. -1.50 Farmers -0.94
Alaska -1.38
tAll deviations listed above are significant. The positive deviations indicate greater than average prevalence of the attitude, and
negative deviations lower than average prevalence of the attitude.
212 S. Kellert
TABLE V Multiple Classification Analysis of Selected Demographic Variables for the Scientistic, Utilitarian, Dominionistic, and Negativistic Scales.
(See Table Ill for a note on performance of the analysis.)
Scientistic (Max. Poss. Score = 13) Dominionistic (Max. Poss. Score= 18)
Group Deviationt Group Deviation t
Graduate Education 0.83 Male 0.68 18-25 Years Old 0.30 Farmers 0.66 26-35 Years Old 0.28 Alaska 0.43 Single 0.22 Rocky Mt. States 0.37 College Education 0.17 $35,000+ Income 0.23 Alaska 0.10 Rarely/Never attend High School/Vocat. Rei igious Services -0.21
Education -0.19 Clerical Workers -0.36 Less than 8th Grade Graduate Education -0.45
Education -0.21 Female -0.51 9th-11th Grade Education -0.22 Pacific Coast -0.55 56-75 Years Old -0.30 76 + Years Old -0.38
Utilitarian (Max. Poss. Score = 27) Negativistic (Max. Poss. Score = 17)
Group Deviationt Group Deviationt
Farmers 2.11 Black 1.08
76 + Years Old 1.43 Less than 8th Grade 56-75 Years Old 1.15 Education 0.95 Black 1.13 76 + Years Old 0.74 South 0.88 Female 0.51 1 Million+ Pop. -0.45 56·75 Years Old 0.50 Single -0.61 Less than 500 Pop. -0.59 Alaska -0.70 Male -0.68
Graduate Education -0.85 18-25 Years Old -0.69
26-36 Years Old -0.88 Graduate Education -0.99
18-25 Years Old -1.14 Alaska -1.16
t All deviations listed above are Slgnlilcant. The pos1l1ve dev1at1ons md1cate greater than average prevalence of the ilttltude, and
negative dev1at1ons lower than average prevalence of the attitude
Appendix 213
REFERENCES
Ehrenfeld, D.W. 1970. Biological conservation, New York, N.Y.: Holt, Rinehart, and Winston.
Guggisberg, C.A.W. 1970. Man and wildlife, New York, N.Y.: Arco Publishing Company.
Kellert, S.R. 1976. Perceptions of animals in American society. Transactions of the 41st North American Wildlife and Natural Resources Conference, Wildlife Management Office, Washington, D.C., pp. 533-46.
Kellert, S.R. 1978. Policy implications of a national study of American attitudes and behavioral relations to animals. U.S. Fish and Wildlife Service, U.S. Department of the Interior, Stock Number 024-101-00482-7, U.S. Government Printing Office, Washington, D.C.
Kellert, S.R. 1979a. Public attitudes toward critical wildlife and natural habitat issues: Phase I, U.S. Fish and Wildlife Service, U.S. Department of the Interior, Washington, D.C.
Kellert, S.R. 1979b. Contemporary values of wildlife in American society. Methods of assessing and categorizing values of wildlife. Rocky Mountain Forest and Range Experiment Station, (In press).
Ziswiler, V. 1967. Extinct and vanishing animals. London, U.K.: The English Universities Press.
Recommended