1
TSX-V: ALR
Extracting Value Early Via Staged Project
Development
October 2014
2
This document contains forward-looking statements under Canadian securities legislation. Forward-looking statements include, but are not limited
to, statements with respect to the development potential and timetable of the Rosita project; the timing and amount of estimated future
development and exploration; costs of future activities; capital and operating expenditures; success of exploration activities; government regulation
of mining operations; and environmental risks. Generally, forward-looking statements can be identified by the use of forward-looking terminology
such as “plans”, “expects” or “does not expect”, “is expected”, “budget”, “scheduled”, “estimates”, “forecasts”, “intends”, “anticipates” or “does not
anticipate”, or “believes”, or variations of such words and phrases or statements that certain actions, events or results “may”, “could”, “would”,
“might” or “will be taken”, “occur” or “be achieved”. Forward-looking statements are based on the opinions and estimates of management as of the
date such statements are made. Forward-looking statements are subject to known and unknown risks, uncertainties and other factors that may
cause the actual results, level of activity, performance or achievements of the Company to be materially different from those expressed or implied
by such forward-looking statements, including but not limited to risks related to: timing and availability of external financing on acceptable terms;
unexpected events and delays during construction, expansion and start-up; variations in ore grade and recovery rates; receipt and revocation of
government approvals; actual results of exploration and mining activities; changes in project parameters as plans continue to be refined; future
prices of metals; failure of plant, equipment or processes to operate as anticipated; accidents, labour disputes and other risks of the mining
industry. Although management of the Company has attempted to identify important factors that could cause actual results to differ materially from
those contained in forward-looking statements, there may be other factors that cause results not to be as anticipated, estimated or intended. There
can be no assurance that such statements will prove to be accurate, as actual results and future events could differ materially from those
anticipated in such statements. Accordingly, readers should not place undue reliance on forward-looking statements. The Company does not
undertake to update any forward-looking statements except in accordance with applicable securities laws.
The technical and scientific information included herein has been reviewed and approved by Don Dudek, P.Geo , President and CEO of the
Company, and a qualified person under National Instrument 43-101 of the Canadian Securities Administrators.
2
Forward Looking Statements
3 3
Staged Development
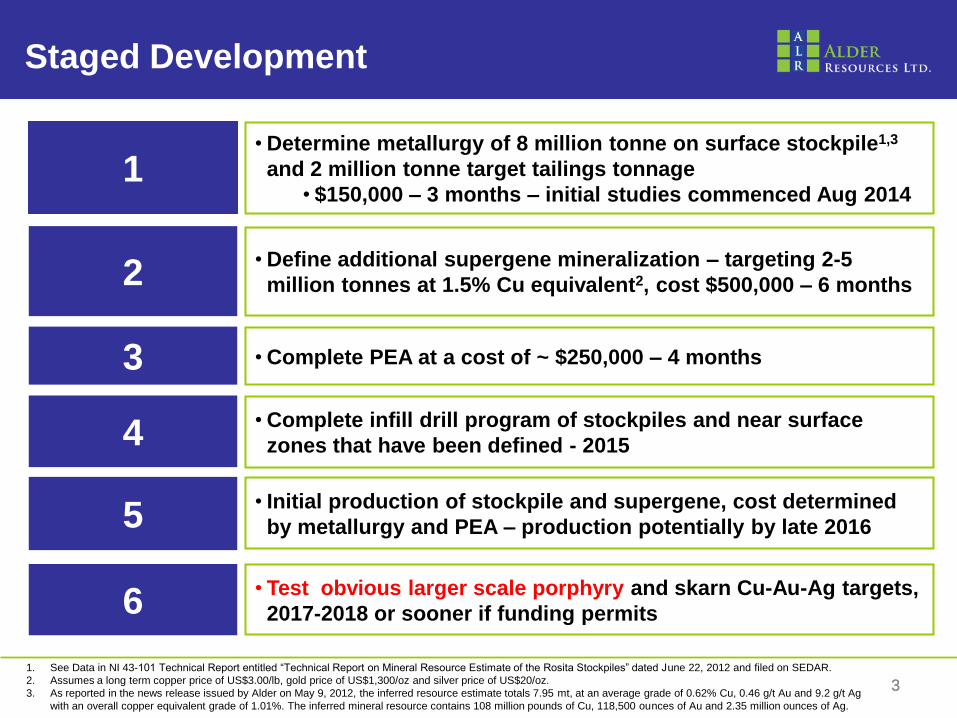
• Determine metallurgy of 8 million tonne on surface stockpile1,3
and 2 million tonne target tailings tonnage
• $150,000 – 3 months – initial studies commenced Aug 2014
• Define additional supergene mineralization – targeting 2-5
million tonnes at 1.5% Cu equivalent2, cost $500,000 – 6 months
• Initial production of stockpile and supergene, cost determined
by metallurgy and PEA – production potentially by late 2016
• Test obvious larger scale porphyry and skarn Cu-Au-Ag targets,
2017-2018 or sooner if funding permits
1
2
5
6
1. See Data in NI 43-101 Technical Report entitled “Technical Report on Mineral Resource Estimate of the Rosita Stockpiles” dated June 22, 2012 and filed on SEDAR.
2. Assumes a long term copper price of US$3.00/lb, gold price of US$1,300/oz and silver price of US$20/oz.
3. As reported in the news release issued by Alder on May 9, 2012, the inferred resource estimate totals 7.95 mt, at an average grade of 0.62% Cu, 0.46 g/t Au and 9.2 g/t Ag
with an overall copper equivalent grade of 1.01%. The inferred mineral resource contains 108 million pounds of Cu, 118,500 ounces of Au and 2.35 million ounces of Ag.
3 • Complete PEA at a cost of ~ $250,000 – 4 months
• Complete infill drill program of stockpiles and near surface
zones that have been defined - 2015 4
4 4
Investment Highlights
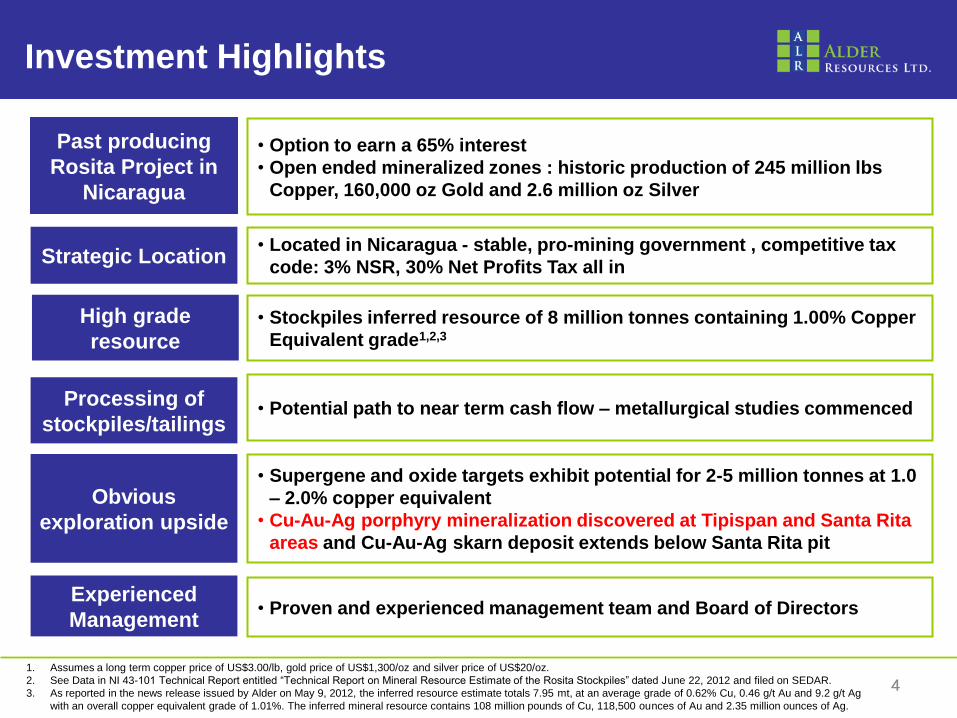
• Option to earn a 65% interest
• Open ended mineralized zones : historic production of 245 million lbs
Copper, 160,000 oz Gold and 2.6 million oz Silver
• Located in Nicaragua - stable, pro-mining government , competitive tax
code: 3% NSR, 30% Net Profits Tax all in
• Proven and experienced management team and Board of Directors
• Stockpiles inferred resource of 8 million tonnes containing 1.00% Copper
Equivalent grade1,2,3
• Supergene and oxide targets exhibit potential for 2-5 million tonnes at 1.0
– 2.0% copper equivalent
• Cu-Au-Ag porphyry mineralization discovered at Tipispan and Santa Rita
areas and Cu-Au-Ag skarn deposit extends below Santa Rita pit
Past producing
Rosita Project in
Nicaragua
Strategic Location
High grade
resource
Obvious
exploration upside
Experienced
Management
1. Assumes a long term copper price of US$3.00/lb, gold price of US$1,300/oz and silver price of US$20/oz.
2. See Data in NI 43-101 Technical Report entitled “Technical Report on Mineral Resource Estimate of the Rosita Stockpiles” dated June 22, 2012 and filed on SEDAR.
3. As reported in the news release issued by Alder on May 9, 2012, the inferred resource estimate totals 7.95 mt, at an average grade of 0.62% Cu, 0.46 g/t Au and 9.2 g/t Ag
with an overall copper equivalent grade of 1.01%. The inferred mineral resource contains 108 million pounds of Cu, 118,500 ounces of Au and 2.35 million ounces of Ag.
Processing of
stockpiles/tailings • Potential path to near term cash flow – metallurgical studies commenced
5
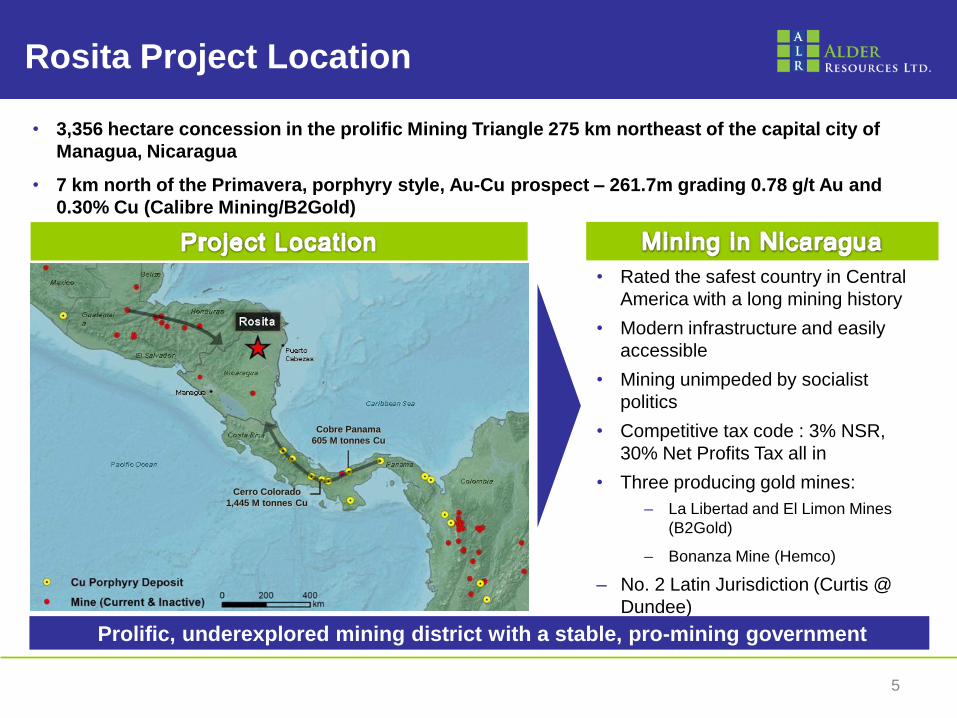
• 3,356 hectare concession in the prolific Mining Triangle 275 km northeast of the capital city of
Managua, Nicaragua
• 7 km north of the Primavera, porphyry style, Au-Cu prospect – 261.7m grading 0.78 g/t Au and
0.30% Cu (Calibre Mining/B2Gold)
Rosita Project Location
Cobre Panama
605 M tonnes Cu
Cerro Colorado
1,445 M tonnes Cu
• Rated the safest country in Central
America with a long mining history
• Modern infrastructure and easily
accessible
• Mining unimpeded by socialist
politics
• Competitive tax code : 3% NSR,
30% Net Profits Tax all in
• Three producing gold mines:
– La Libertad and El Limon Mines
(B2Gold)
– Bonanza Mine (Hemco)
– No. 2 Latin Jurisdiction (Curtis @
Dundee)
Prolific, underexplored mining district with a stable, pro-mining government
6
*See data in NI43-101 Technical Report entitled “Technical Report on the Copper-
Gold-Silver Porphyry/Skarn Project at the Rosita D Concession dated January 5,
2012 which is filed on SEDAR.
6
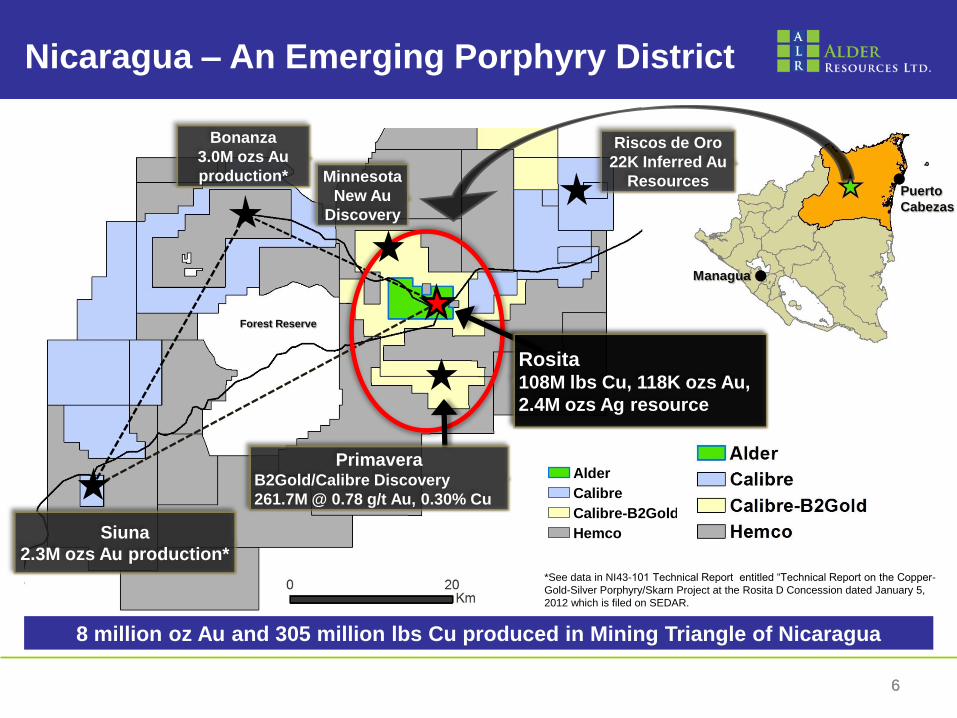
Managua
Puerto
Cabezas
Siuna
2.3M ozs Au production*
Rosita 108M lbs Cu, 118K ozs Au,
2.4M ozs Ag resource
Primavera B2Gold/Calibre Discovery
261.7M @ 0.78 g/t Au, 0.30% Cu
Forest Reserve
Bonanza
3.0M ozs Au
production*
Alder
Calibre
Calibre-B2Gold
Hemco
Nicaragua – An Emerging Porphyry District
8 million oz Au and 305 million lbs Cu produced in Mining Triangle of Nicaragua
Minnesota
New Au
Discovery
Riscos de Oro
22K Inferred Au
Resources
7
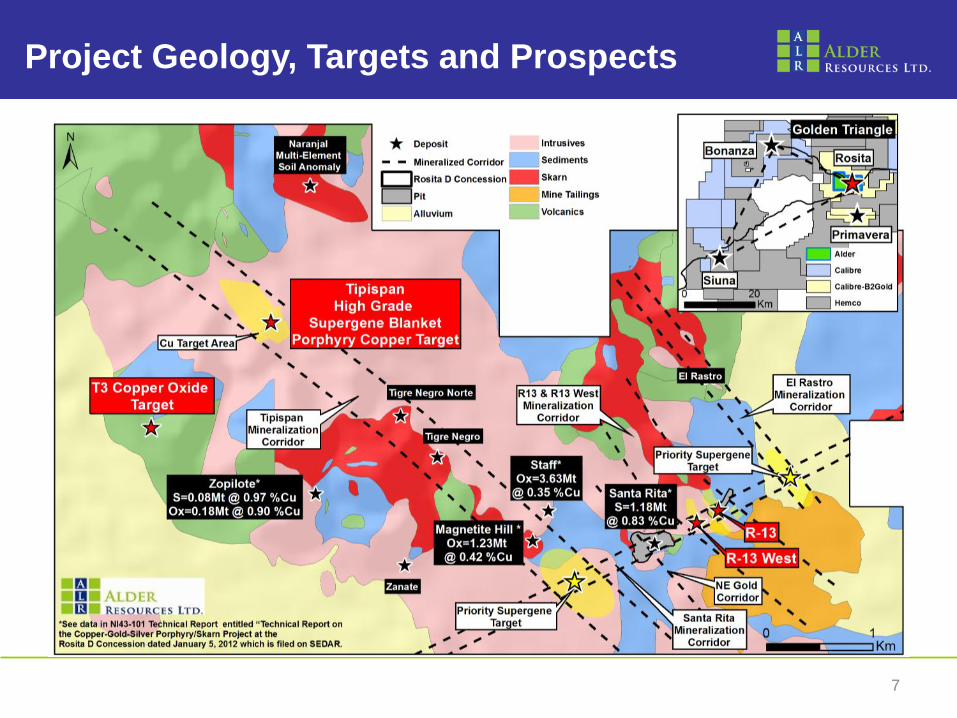
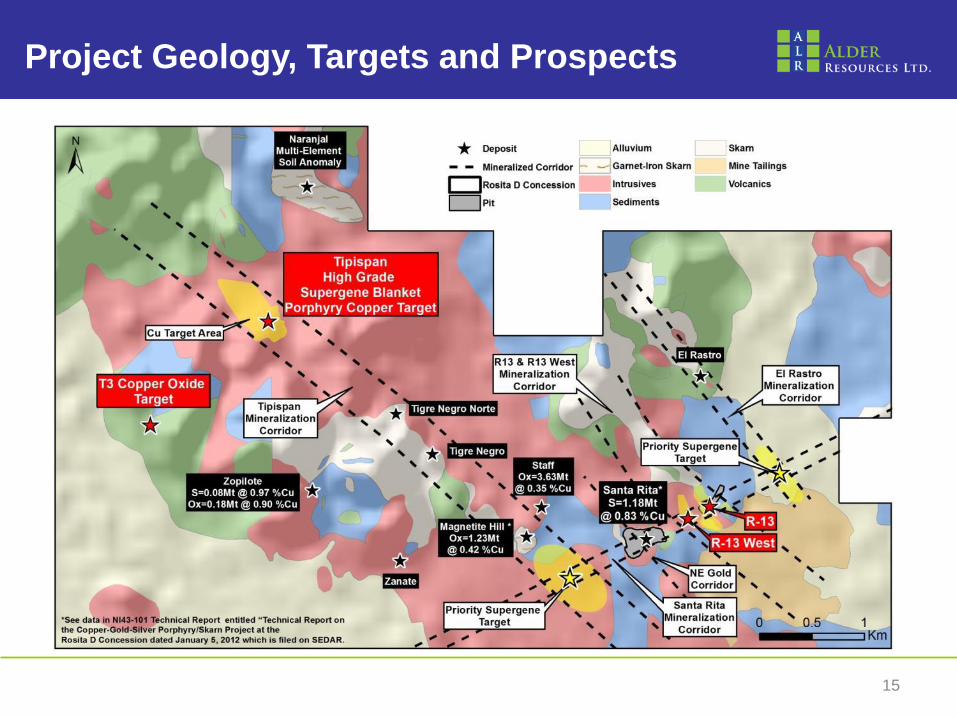
Project Geology, Targets and Prospects
8
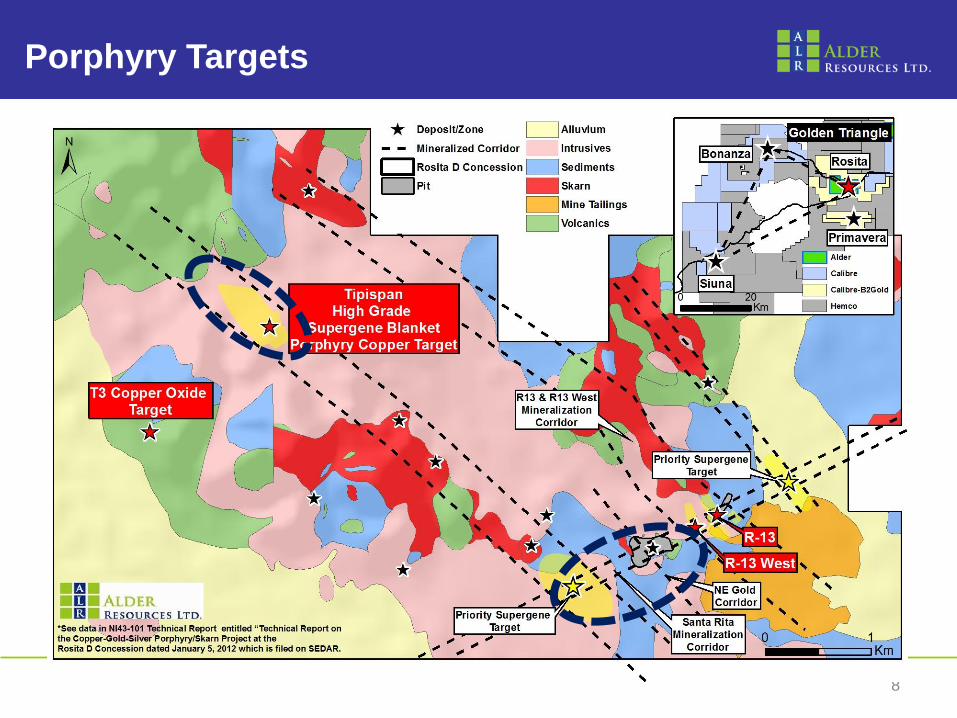
Porphyry Targets
9
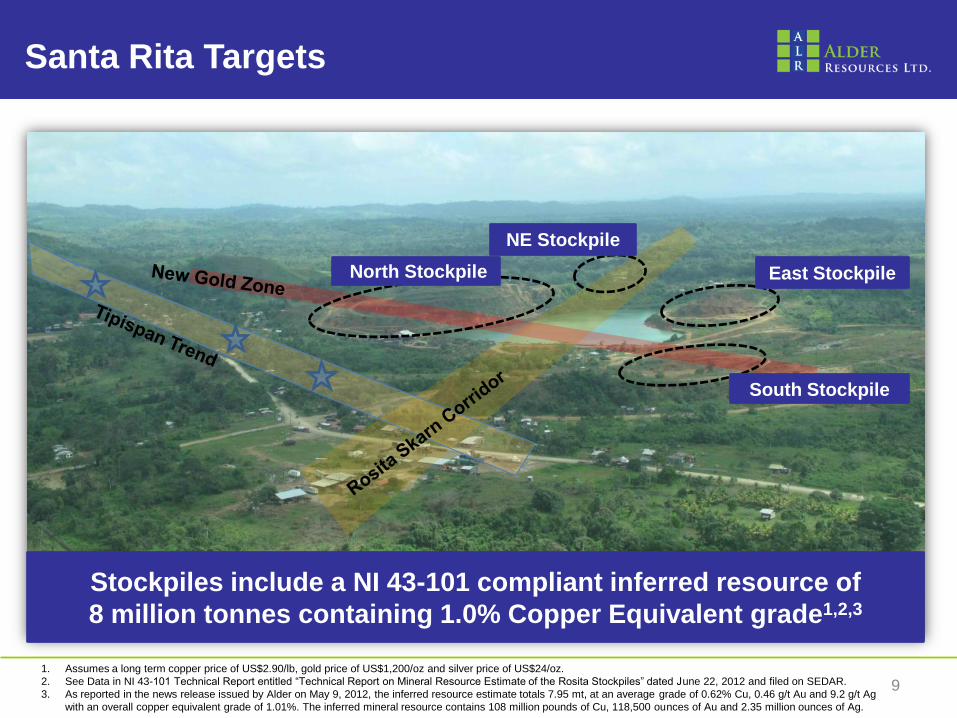
Santa Rita Targets
Stockpiles include a NI 43-101 compliant inferred resource of
8 million tonnes containing 1.0% Copper Equivalent grade1,2,3
North Stockpile East Stockpile
South Stockpile
1. Assumes a long term copper price of US$2.90/lb, gold price of US$1,200/oz and silver price of US$24/oz.
2. See Data in NI 43-101 Technical Report entitled “Technical Report on Mineral Resource Estimate of the Rosita Stockpiles” dated June 22, 2012 and filed on SEDAR.
3. As reported in the news release issued by Alder on May 9, 2012, the inferred resource estimate totals 7.95 mt, at an average grade of 0.62% Cu, 0.46 g/t Au and 9.2 g/t Ag
with an overall copper equivalent grade of 1.01%. The inferred mineral resource contains 108 million pounds of Cu, 118,500 ounces of Au and 2.35 million ounces of Ag.
NE Stockpile
10 10
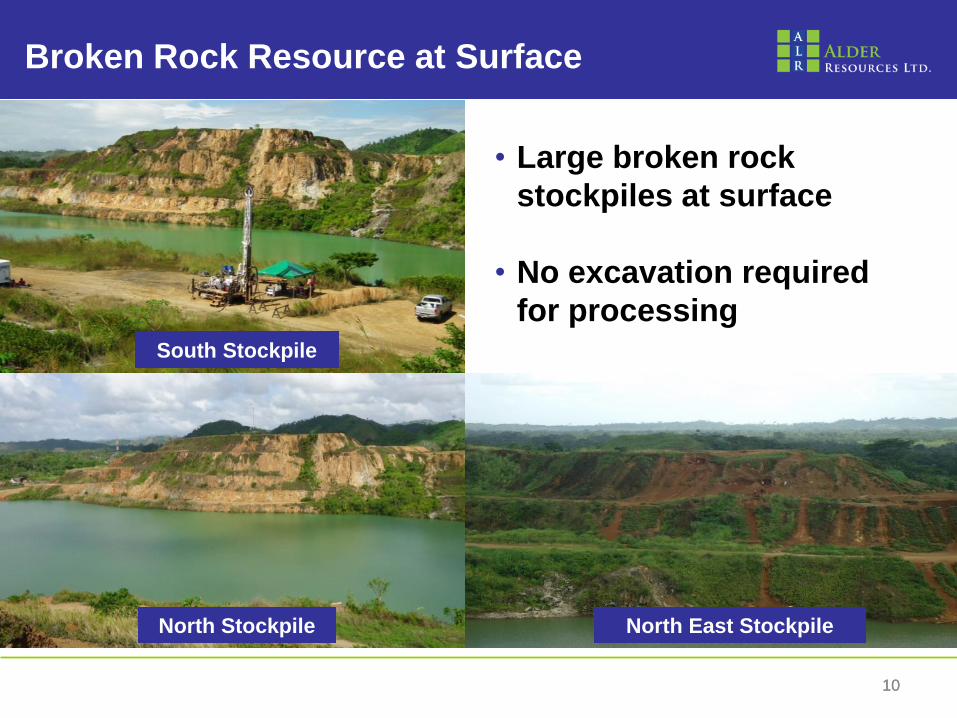
Broken Rock Resource at Surface
South Stockpile
North Stockpile
• Large broken rock
stockpiles at surface
• No excavation required
for processing
North East Stockpile
11 11
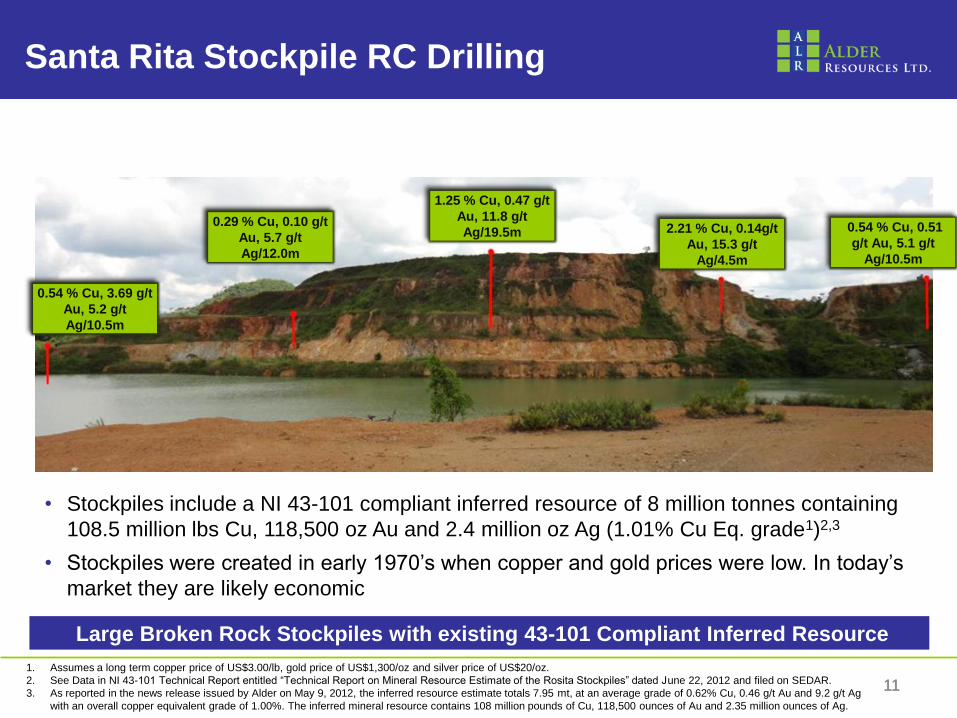
Santa Rita Stockpile RC Drilling
Large Broken Rock Stockpiles with existing 43-101 Compliant Inferred Resource
0.54 % Cu, 3.69 g/t
Au, 5.2 g/t
Ag/10.5m
0.29 % Cu, 0.10 g/t
Au, 5.7 g/t
Ag/12.0m
1.25 % Cu, 0.47 g/t
Au, 11.8 g/t
Ag/19.5m 2.21 % Cu, 0.14g/t
Au, 15.3 g/t
Ag/4.5m
0.54 % Cu, 0.51
g/t Au, 5.1 g/t
Ag/10.5m
• Stockpiles include a NI 43-101 compliant inferred resource of 8 million tonnes containing
108.5 million lbs Cu, 118,500 oz Au and 2.4 million oz Ag (1.01% Cu Eq. grade1)2,3
• Stockpiles were created in early 1970’s when copper and gold prices were low. In today’s
market they are likely economic
1. Assumes a long term copper price of US$3.00/lb, gold price of US$1,300/oz and silver price of US$20/oz.
2. See Data in NI 43-101 Technical Report entitled “Technical Report on Mineral Resource Estimate of the Rosita Stockpiles” dated June 22, 2012 and filed on SEDAR.
3. As reported in the news release issued by Alder on May 9, 2012, the inferred resource estimate totals 7.95 mt, at an average grade of 0.62% Cu, 0.46 g/t Au and 9.2 g/t Ag
with an overall copper equivalent grade of 1.00%. The inferred mineral resource contains 108 million pounds of Cu, 118,500 ounces of Au and 2.35 million ounces of Ag.
12 12
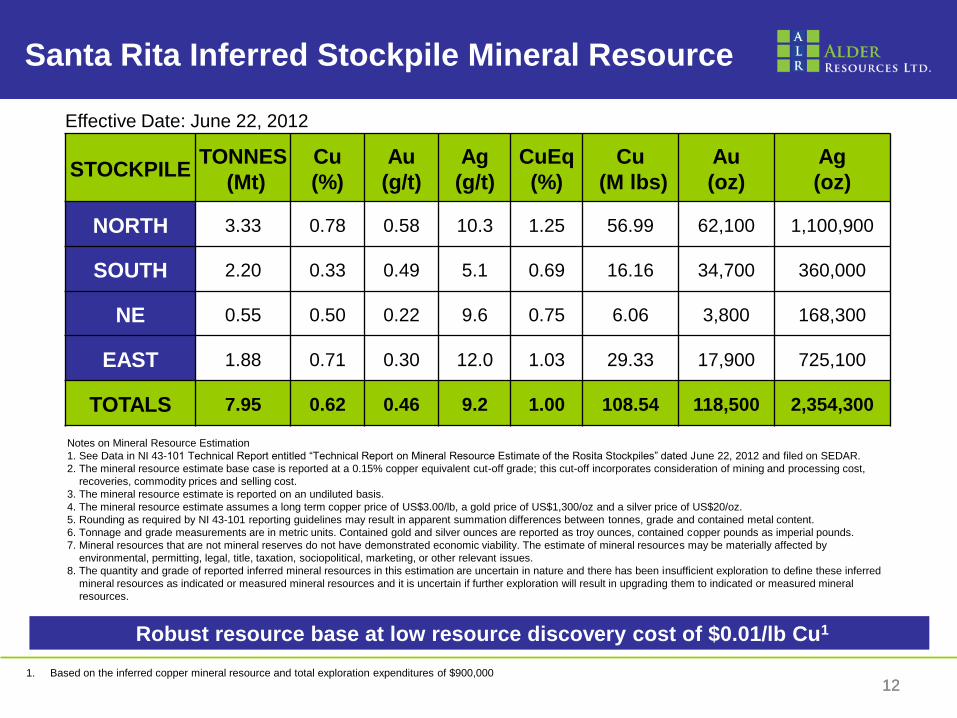
STOCKPILE TONNES
(Mt)
Cu
(%)
Au
(g/t)
Ag
(g/t)
CuEq
(%)
Cu
(M lbs)
Au
(oz)
Ag
(oz)
NORTH 3.33 0.78 0.58 10.3 1.25 56.99 62,100 1,100,900
SOUTH 2.20 0.33 0.49 5.1 0.69 16.16 34,700 360,000
NE 0.55 0.50 0.22 9.6 0.75 6.06 3,800 168,300
EAST 1.88 0.71 0.30 12.0 1.03 29.33 17,900 725,100
TOTALS 7.95 0.62 0.46 9.2 1.00 108.54 118,500 2,354,300
Notes on Mineral Resource Estimation
1. See Data in NI 43-101 Technical Report entitled “Technical Report on Mineral Resource Estimate of the Rosita Stockpiles” dated June 22, 2012 and filed on SEDAR.
2. The mineral resource estimate base case is reported at a 0.15% copper equivalent cut-off grade; this cut-off incorporates consideration of mining and processing cost,
recoveries, commodity prices and selling cost.
3. The mineral resource estimate is reported on an undiluted basis.
4. The mineral resource estimate assumes a long term copper price of US$3.00/lb, a gold price of US$1,300/oz and a silver price of US$20/oz.
5. Rounding as required by NI 43-101 reporting guidelines may result in apparent summation differences between tonnes, grade and contained metal content.
6. Tonnage and grade measurements are in metric units. Contained gold and silver ounces are reported as troy ounces, contained copper pounds as imperial pounds.
7. Mineral resources that are not mineral reserves do not have demonstrated economic viability. The estimate of mineral resources may be materially affected by
environmental, permitting, legal, title, taxation, sociopolitical, marketing, or other relevant issues.
8. The quantity and grade of reported inferred mineral resources in this estimation are uncertain in nature and there has been insufficient exploration to define these inferred
mineral resources as indicated or measured mineral resources and it is uncertain if further exploration will result in upgrading them to indicated or measured mineral
resources.
Santa Rita Inferred Stockpile Mineral Resource
Robust resource base at low resource discovery cost of $0.01/lb Cu1
1. Based on the inferred copper mineral resource and total exploration expenditures of $900,000
Effective Date: June 22, 2012
13
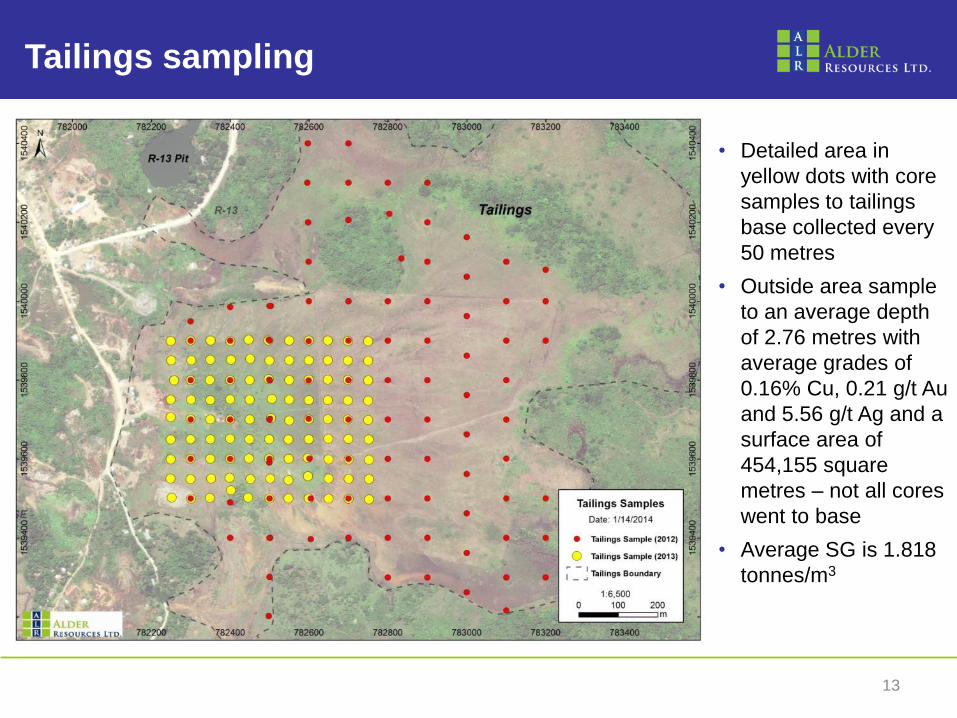
Tailings sampling
• Detailed area in
yellow dots with core
samples to tailings
base collected every
50 metres
• Outside area sample
to an average depth
of 2.76 metres with
average grades of
0.16% Cu, 0.21 g/t Au
and 5.56 g/t Ag and a
surface area of
454,155 square
metres – not all cores
went to base
• Average SG is 1.818
tonnes/m3
14 14
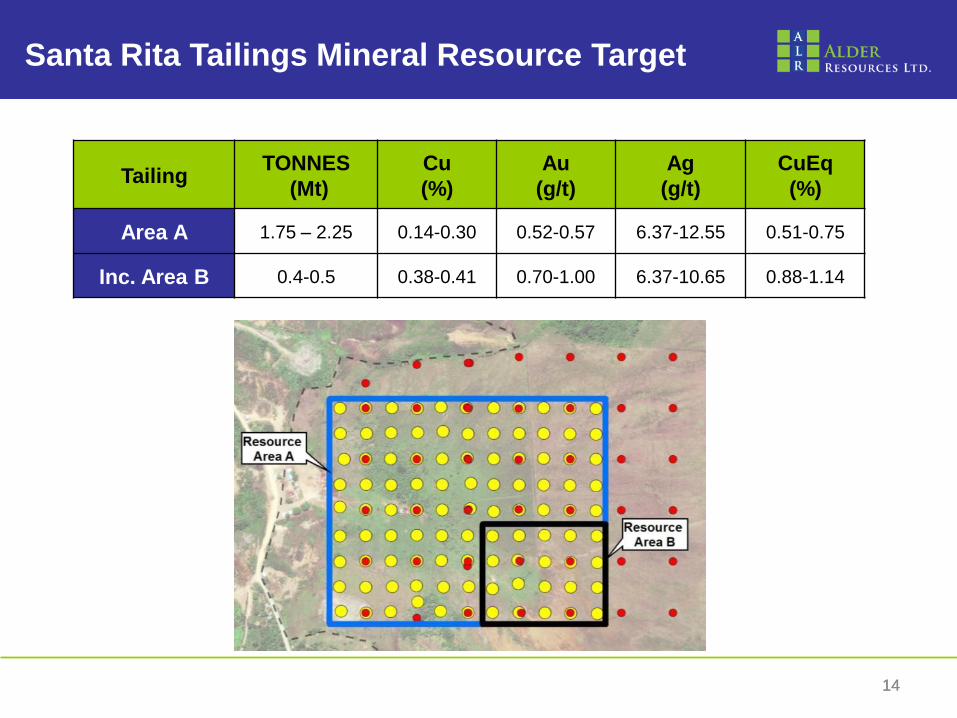
Tailing TONNES
(Mt)
Cu
(%)
Au
(g/t)
Ag
(g/t)
CuEq
(%)
Area A 1.75 – 2.25 0.14-0.30 0.52-0.57 6.37-12.55 0.51-0.75
Inc. Area B 0.4-0.5 0.38-0.41 0.70-1.00 6.37-10.65 0.88-1.14
Santa Rita Tailings Mineral Resource Target
15
Project Geology, Targets and Prospects
16
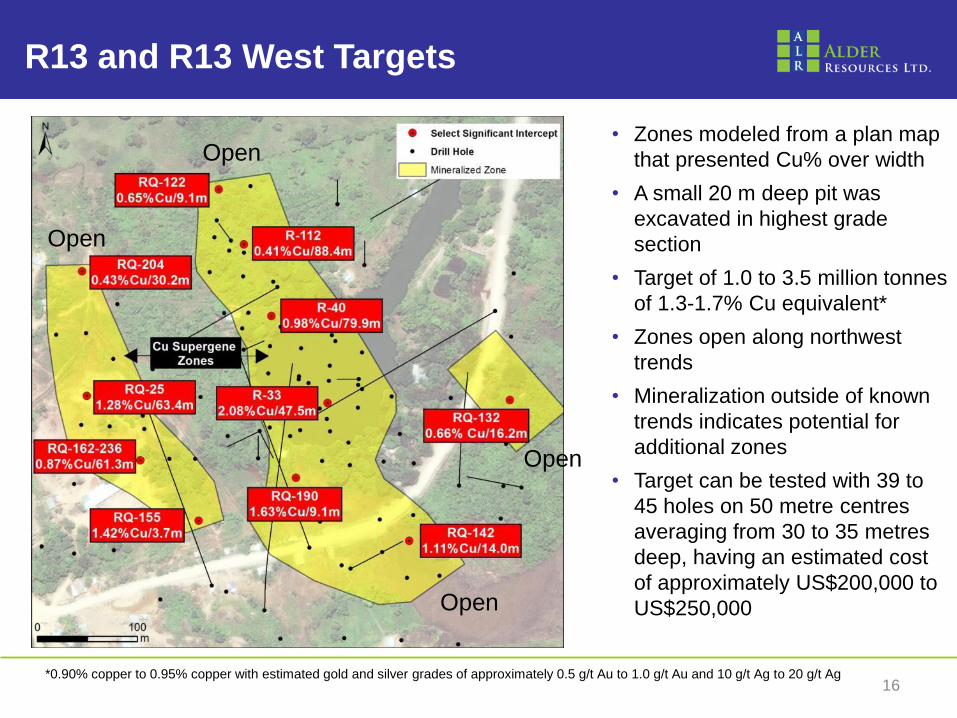
R13 and R13 West Targets
Open
Open
Open
Open
• Zones modeled from a plan map
that presented Cu% over width
• A small 20 m deep pit was
excavated in highest grade
section
• Target of 1.0 to 3.5 million tonnes
of 1.3-1.7% Cu equivalent*
• Zones open along northwest
trends
• Mineralization outside of known
trends indicates potential for
additional zones
• Target can be tested with 39 to
45 holes on 50 metre centres
averaging from 30 to 35 metres
deep, having an estimated cost
of approximately US$200,000 to
US$250,000
*0.90% copper to 0.95% copper with estimated gold and silver grades of approximately 0.5 g/t Au to 1.0 g/t Au and 10 g/t Ag to 20 g/t Ag
17
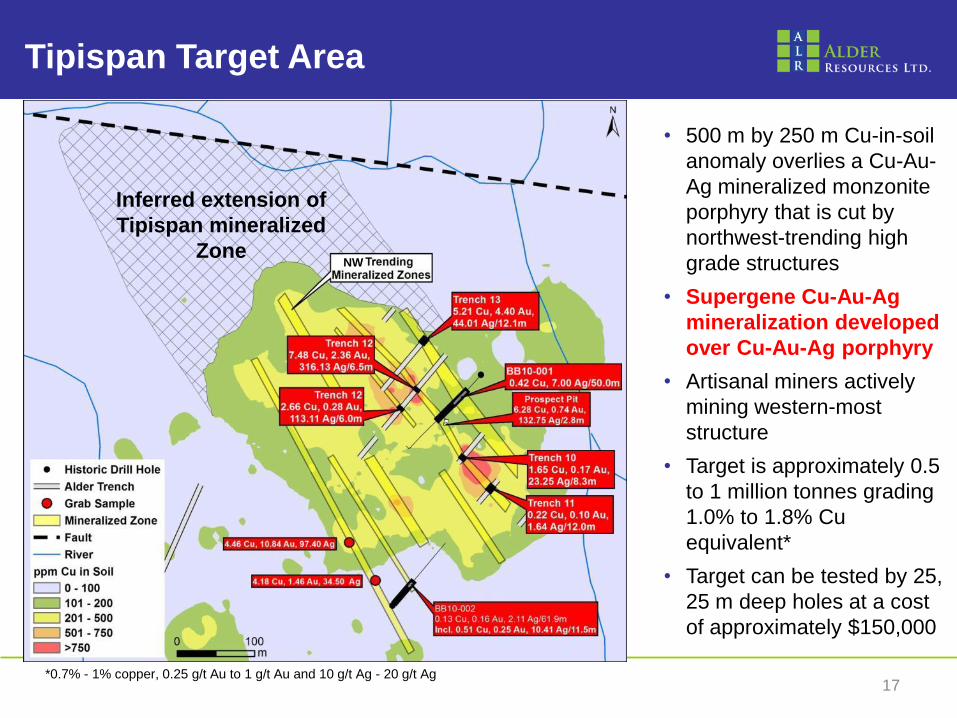
Tipispan Target Area
Inferred extension of
Tipispan mineralized
Zone
• 500 m by 250 m Cu-in-soil
anomaly overlies a Cu-Au-
Ag mineralized monzonite
porphyry that is cut by
northwest-trending high
grade structures
• Supergene Cu-Au-Ag
mineralization developed
over Cu-Au-Ag porphyry
• Artisanal miners actively
mining western-most
structure
• Target is approximately 0.5
to 1 million tonnes grading
1.0% to 1.8% Cu
equivalent*
• Target can be tested by 25,
25 m deep holes at a cost
of approximately $150,000
NW
*0.7% - 1% copper, 0.25 g/t Au to 1 g/t Au and 10 g/t Ag - 20 g/t Ag
18
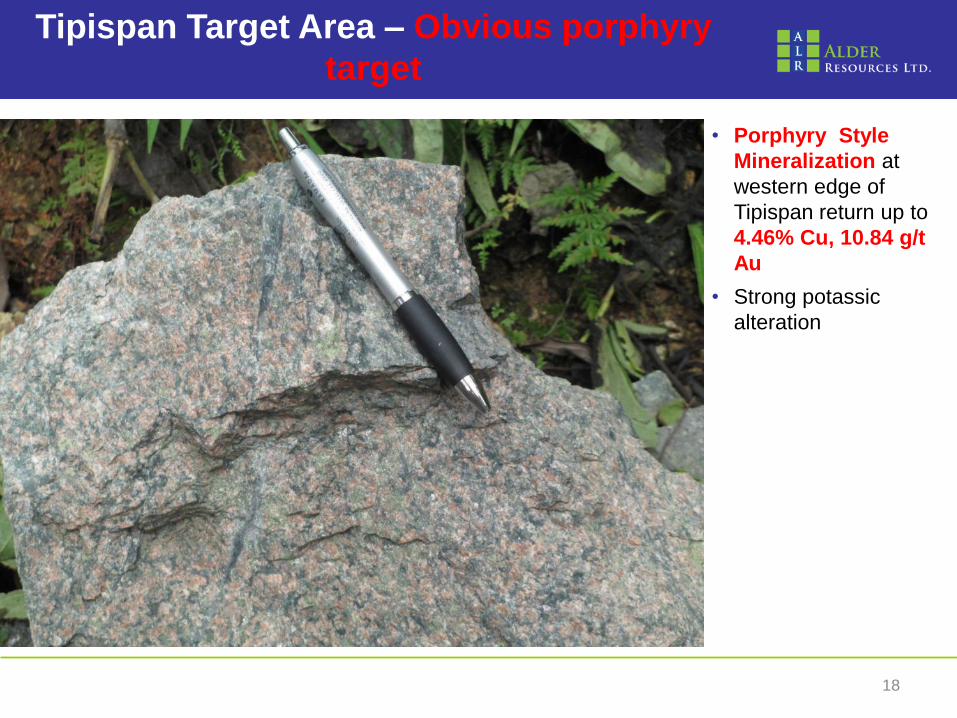
Tipispan Target Area – Obvious porphyry
target
• Porphyry Style
Mineralization at
western edge of
Tipispan return up to
4.46% Cu, 10.84 g/t
Au
• Strong potassic
alteration
19
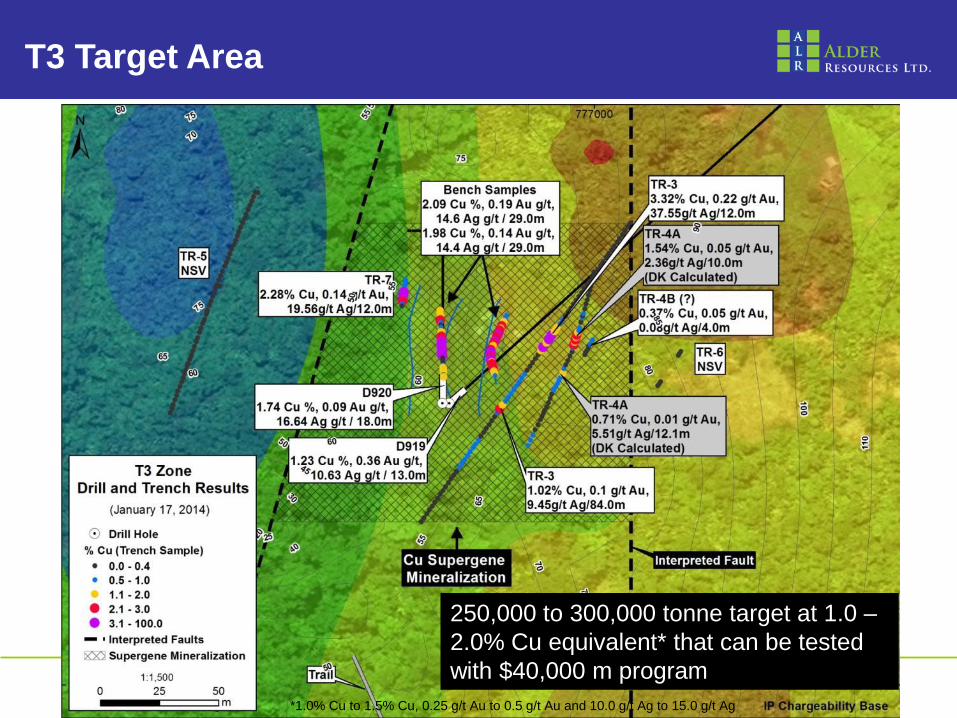
T3 Target Area
250,000 to 300,000 tonne target at 1.0 –
2.0% Cu equivalent* that can be tested
with $40,000 m program
*1.0% Cu to 1.5% Cu, 0.25 g/t Au to 0.5 g/t Au and 10.0 g/t Ag to 15.0 g/t Ag
20 20
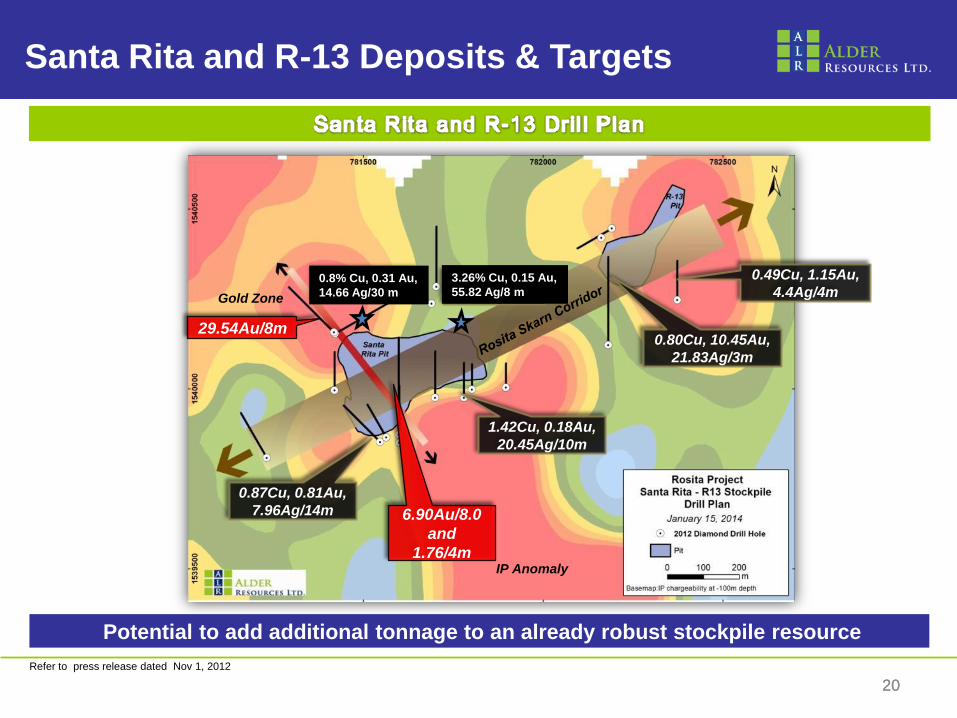
Santa Rita and R-13 Deposits & Targets
Potential to add additional tonnage to an already robust stockpile resource
29.54Au/8m
0.87Cu, 0.81Au,
7.96Ag/14m
Refer to press release dated Nov 1, 2012
6.90Au/8.0
and
1.76/4m
1.42Cu, 0.18Au,
20.45Ag/10m
0.80Cu, 10.45Au,
21.83Ag/3m
0.49Cu, 1.15Au,
4.4Ag/4m 3.26Cu, 0.15Au,
55.82Ag/8m
0.96Cu, 1.06Au,
9.33Ag/12m
IP Anomaly
Gold Zone
0.8% Cu, 0.31 Au,
14.66 Ag/30 m
3.26% Cu, 0.15 Au,
55.82 Ag/8 m
21 21
Management and Board of Directors
Don Dudek | President and CEO
• Held various roles with junior and senior exploration
and mining companies over the past 28 years
• Recently served as Senior VP Technical Services for
Endeavour Mining Corp., prior to that he served as
SVP Exploration for Avion Gold Corp. and Exploration
Manager for Aur Resources Inc.
Ryan Ptolemy | CFO
• Certified General Accountant and CFA charter holder
• Currently CFO of Rodinia Lithium Inc. and Belo Sun
Mining Corp.
Josh van Deurzen | Corporate Secretary
• Corporate and securities lawyer, working as a legal
consultant to various public and private companies in
the resource-based sector
Don Dudek | Chairman
Rene Bharti | Director
• Has held roles in several public and private companies,
including experience in the mining sector
Alan Polk| Director
• Mining engineer with over 22 years of experience in mine
operations, consulting, feasibility studies, and construction
projects for both underground and open pit mines
Hon. Pierre Pettigrew | Director
• Former Minister of Foreign Affairs and currently Executive
Advisor, Deloitte Touche LLP
• Current board member of several public companies
Will Randall | Director
• Professional Geologist with extensive experience in
mineral exploration and production in South America. He is
currently President and CEO of Rodinia Lithium Inc.
Keith Stein| Director
• Currently counsel to Dentons. Previous to that he was
counsel for Heenan Blaikie and a senior executive with
Magna International Inc. reporting to the Chairman
22 22
Share Capital and Share Performance
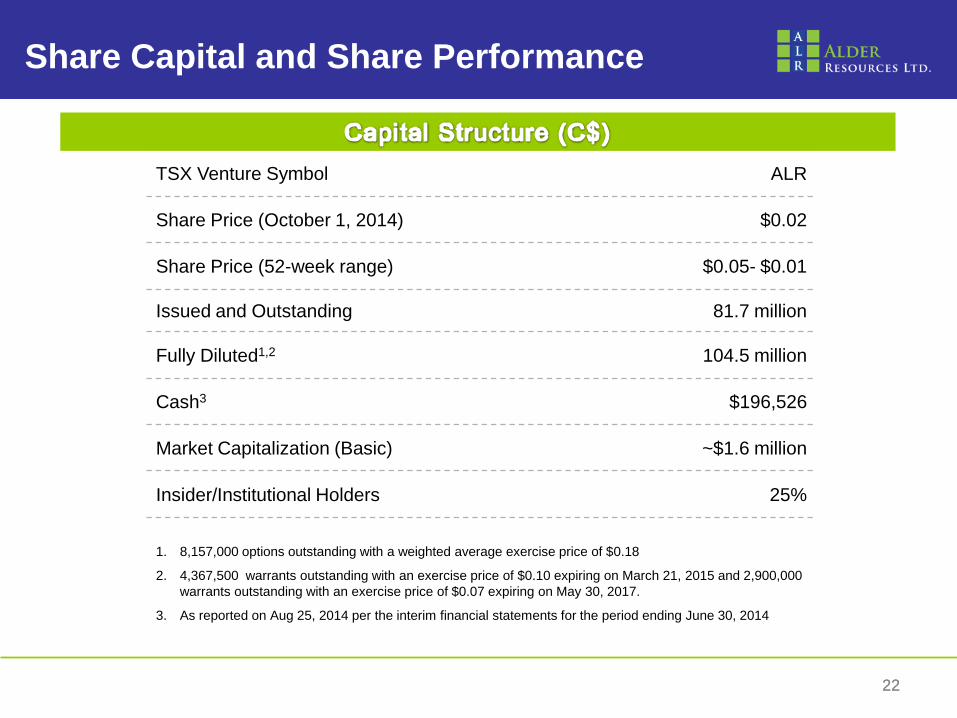
TSX Venture Symbol ALR
Share Price (October 1, 2014) $0.02
Share Price (52-week range) $0.05- $0.01
Issued and Outstanding 81.7 million
Fully Diluted1,2 104.5 million
Cash3 $196,526
Market Capitalization (Basic) ~$1.6 million
Insider/Institutional Holders 25%
1. 8,157,000 options outstanding with a weighted average exercise price of $0.18
2. 4,367,500 warrants outstanding with an exercise price of $0.10 expiring on March 21, 2015 and 2,900,000
warrants outstanding with an exercise price of $0.07 expiring on May 30, 2017.
3. As reported on Aug 25, 2014 per the interim financial statements for the period ending June 30, 2014
23
TSX-V: ALR
65 Queen Street West, Suite 800
Toronto, ON, M5H 2M5
Follow us:
Don Dudek
President & CEO
(416) 861-2261
Michael McAllister
Manager, Investor Relations
(416) 309-2134
24 24
Appendix
25 25
Project History & Overview
• Option agreement with Calibre Mining to earn a 65% interest in the Rosita D concession by
making the following payments:
– Project expenditures of C$4.0 million (~C$3.5 million already spent)
– Issuance of 1,000,000 shares over a four year period (400,000 shares have been issued)
• Completed an initial 5,900 m drill program centered on the past producing Santa Rita and
R-13 deposits
• Mineralization below the Santa Rita pit is open along strike to the east, west and down dip
with porphyry Au-Cu zone to west
• Exploration upside from the Tipispan prospect located 4 km northwest of Santa Rita
– Supergene zone overyling porphyry Cu-Au-Ag zone
• Concession hosts the historic open-pit Santa Rita copper-gold-silver deposit
– Historic production of 245 million lbs Cu, 160,000 oz Au and 2.61 million oz Ag or a billion
dollars worth of metal at current metal prices
– Reported mill recoveries of 60 – 80%
• First gold recovery during the last five years of production
• Mine closed in 1975 due to low copper prices
• Management believes that a substantial amount of Cu-Au-Ag mineralization lies both below
and adjacent to the Santa Rita pit and in other nearby targets
26 26
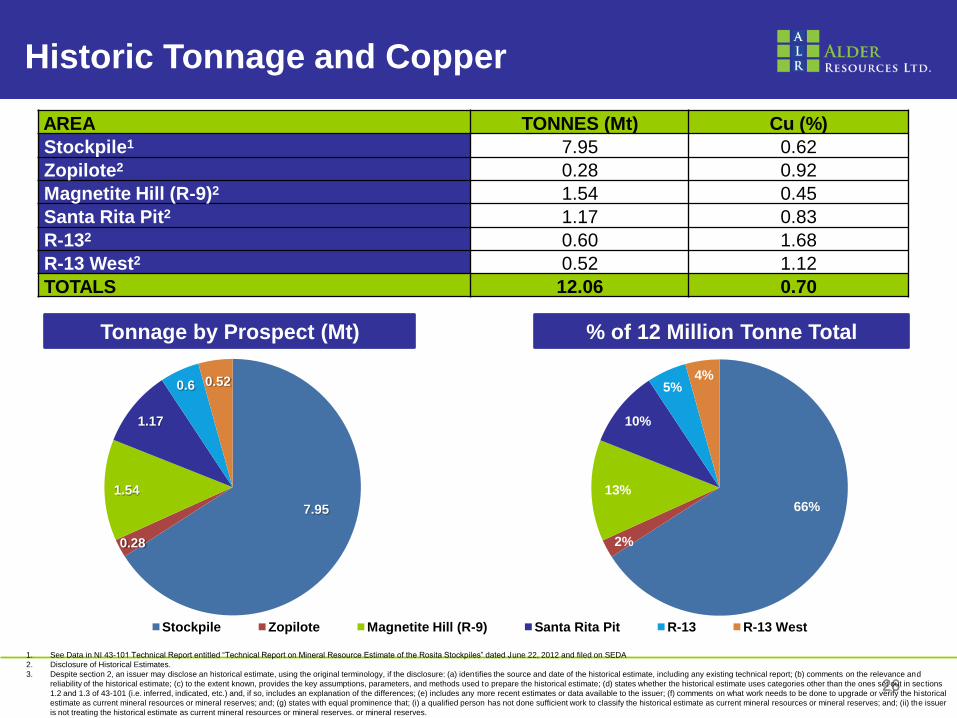
Historic Tonnage and Copper
1. See Data in NI 43-101 Technical Report entitled “Technical Report on Mineral Resource Estimate of the Rosita Stockpiles” dated June 22, 2012 and filed on SEDA
2. Disclosure of Historical Estimates.
3. Despite section 2, an issuer may disclose an historical estimate, using the original terminology, if the disclosure: (a) identifies the source and date of the historical estimate, including any existing technical report; (b) comments on the relevance and
reliability of the historical estimate; (c) to the extent known, provides the key assumptions, parameters, and methods used to prepare the historical estimate; (d) states whether the historical estimate uses categories other than the ones set out in sections
1.2 and 1.3 of 43-101 (i.e. inferred, indicated, etc.) and, if so, includes an explanation of the differences; (e) includes any more recent estimates or data available to the issuer; (f) comments on what work needs to be done to upgrade or verify the historical
estimate as current mineral resources or mineral reserves; and; (g) states with equal prominence that; (i) a qualified person has not done sufficient work to classify the historical estimate as current mineral resources or mineral reserves; and; (ii) the issuer
is not treating the historical estimate as current mineral resources or mineral reserves. or mineral reserves.
AREA TONNES (Mt) Cu (%)
Stockpile1 7.95 0.62
Zopilote2 0.28 0.92
Magnetite Hill (R-9)2 1.54 0.45
Santa Rita Pit2 1.17 0.83
R-132 0.60 1.68
R-13 West2 0.52 1.12
TOTALS 12.06 0.70
7.95
0.28
1.54
1.17
0.6 0.52
Stockpile Zopilote Magnetite Hill (R-9) Santa Rita Pit R-13 R-13 West
66%
2%
13%
10%
5% 4%
Tonnage by Prospect (Mt) % of 12 Million Tonne Total
Recommended