Nat. Hazards Earth Syst. Sci., 16, 643–661, 2016
www.nat-hazards-earth-syst-sci.net/16/643/2016/
doi:10.5194/nhess-16-643-2016
© Author(s) 2016. CC Attribution 3.0 License.
AEGIS: a wildfire prevention and management information system
Kostas Kalabokidis1, Alan Ager2, Mark Finney2, Nikos Athanasis1, Palaiologos Palaiologou1, and Christos Vasilakos1
1University of the Aegean, Department of Geography, University Hill, 81100 Mytilene, Lesvos, Greece2USDA Forest Service, Rocky Mountain Research Station, Missoula Fire Sciences Laboratory, 5775 Hwy 10 West, Missoula,
Montana 59808, USA
Correspondence to: Kostas Kalabokidis ([email protected])
Received: 9 September 2015 – Published in Nat. Hazards Earth Syst. Sci. Discuss.: 12 October 2015
Revised: 12 February 2016 – Accepted: 22 February 2016 – Published: 4 March 2016
Abstract. We describe a Web-GIS wildfire prevention and
management platform (AEGIS) developed as an integrated
and easy-to-use decision support tool to manage wildland
fire hazards in Greece (http://aegis.aegean.gr). The AEGIS
platform assists with early fire warning, fire planning, fire
control and coordination of firefighting forces by provid-
ing online access to information that is essential for wild-
fire management. The system uses a number of spatial and
non-spatial data sources to support key system functionali-
ties. Land use/land cover maps were produced by combining
field inventory data with high-resolution multispectral satel-
lite images (RapidEye). These data support wildfire simula-
tion tools that allow the users to examine potential fire be-
havior and hazard with the Minimum Travel Time fire spread
algorithm. End-users provide a minimum number of inputs
such as fire duration, ignition point and weather informa-
tion to conduct a fire simulation. AEGIS offers three types
of simulations, i.e., single-fire propagation, point-scale cal-
culation of potential fire behavior, and burn probability anal-
ysis, similar to the FlamMap fire behavior modeling soft-
ware. Artificial neural networks (ANNs) were utilized for
wildfire ignition risk assessment based on various parame-
ters, training methods, activation functions, pre-processing
methods and network structures. The combination of ANNs
and expected burned area maps are used to generate inte-
grated output map of fire hazard prediction. The system also
incorporates weather information obtained from remote au-
tomatic weather stations and weather forecast maps. The sys-
tem and associated computation algorithms leverage paral-
lel processing techniques (i.e., High Performance Comput-
ing and Cloud Computing) that ensure computational power
required for real-time application. All AEGIS functionalities
are accessible to authorized end-users through a web-based
graphical user interface. An innovative smartphone applica-
tion, AEGIS App, also provides mobile access to the web-
based version of the system.
1 Introduction
Weather, topography and fuel patterns along with socioe-
conomic conditions are all factors that contribute to the
complexity and uncertainty of wildfire risk management.
Expected impacts of climate change, including global in-
creases in wildfire severity and frequency, further complicate
the wildfire management problem (Abatzoglou and Kolden,
2013; Kalabokidis et al., 2015). Decision support systems
are increasingly being developed and applied in a number
of different capacities to improve firefighter protection, de-
velop tactical firefighting strategies, analyze landscape fu-
els reduction programs, and provide for environmental pro-
tection (Ager et al., 2011; Kalabokidis, 2004; Miller and
Ager, 2013; Noonan-Wright et al., 2011). Acquired knowl-
edge from these information systems gives fire protection
agencies the ability to spatially define and identify high-risk
areas, in the short- and long-term, and plan the necessary pre-
ventive and control actions as part of a wildfire risk gover-
nance system (Miller and Ager, 2013; Taylor et al., 1997).
There are many challenges associated with building and
deploying wildfire decision support tools. Ideally, an inte-
grated wildfire prevention and management system should
provide instant access to functionalities such as fire danger
forecasts, fire behavior prediction, active fire detection, ac-
cess to historical fire data and fire damage assessment. In
terms of usability, such a system should be fairly intuitive, so
that end-users can utilize it without specialized knowledge
Published by Copernicus Publications on behalf of the European Geosciences Union.
644 K. Kalabokidis et al.: AEGIS: a wildfire prevention and management information system
on performing fire science related modeling. From an imple-
mentation standpoint, the system must have the capacity and
reliability to meet the real-time demands users pose during
the peak wildfire season without excessive requirements for
maintenance.
Tailor-made wildfire decision support systems have been
developed and used in a number of different wildfire regions,
including Spain (Alonso-Betanzos et al., 2003), France
(Figueras Jové et al., 2014), Italy (Losso et al., 2012), Turkey
(Gumusay and Sahin, 2009), the US (Noonan-Wright et al.,
2011), and in the alpine areas of Europe (Corgnati et al.,
2008). Despite the large number of systems, few of them can
be considered fully integrated solutions to the wildfire man-
agement problem, and generally each of the aforementioned
systems has emphasized a specific functionality.
A good example where integration of fire management
systems has not been emphasized is in Greece, where the fire-
fighting strategy has relied on a string of independent soft-
ware and systems that are used separately to accomplish sim-
ple operational needs. These systems include Google Earth
for mapping and data handling, the European Forest Fire In-
formation System (EFFIS, San-Miguel-Ayanz et al., 2002)
for current situation assessment (especially for post-wildfire
burned area estimation), Google Maps on custom web appli-
cations for wildfire events registration, and Geographic In-
formation System (GIS) tools to map daily fire risk from the
General Secretariat for Civil Protection (GSCP)1. This wild-
fire management scheme in Greece evolved from many pre-
vious efforts that included both conceptual papers and ap-
plied studies. For instance, Iliadis (2005) and Kaloudis et
al. (2008) introduced theoretical approaches regarding wild-
fire prevention and management systems in Greece, but the
ideas were never implemented. On the practical side, appli-
cations developed by Caballero (1998), Vakalis et al. (2004)
and Kalabokidis et al. (2012) resulted in stand-alone systems
that were difficult to use due to requirements for local instal-
lations of specific software components. The first attempt to
develop a fully integrated and distributed system for Greece
was Virtual Fire (Kalabokidis et al., 2013a), a web-based GIS
platform designed to deliver a wide range of forest fire re-
lated information. It provided spatial fire ignition probabil-
ity estimation (Vasilakos et al., 2007, 2009), visualization of
weather forecast maps, real-time weather data from Remote
Automatic Weather Stations (RAWS) and fire management
tools (e.g., fleet tracking, routing, closest facilities and RSS
feeds). While overcoming many integration and implementa-
tion shortcomings of previous systems, key functionality of
fire behavior simulations could be conducted only with the
assistance of a system administrator. The application con-
sisted of two high-performance computing (HPC) nodes for
the spatial calculations, while dependent on commercial Ar-
cGIS2 software for spatial data visualization and support of
1http://civilprotection.gr/en2www.esri.com
geo-processing tasks. The financial cost to maintain/operate
the system on-premises was significant, even though the sys-
tem had been applied for a relatively small area of about
1600 km2 (i.e., Lesvos, Greece). This platform evolved into
the VENUS-C system (Kalabokidis et al., 2014b) consist-
ing of a wildfire risk and wildfire spread simulation service,
delivered within a web-based interactive platform to the fire
management agencies as Software as a Service (SaaS) in the
Cloud Computing platform of Microsoft Azure. The wildfire
risk service generated hourly maps of the forecasted fire risk
for the next 112 h in high spatiotemporal resolution based on
forecasted meteorological data. In addition, actual fire risk
was calculated hourly, based on meteorological conditions
provided by RAWS. Regarding the wildfire behavior simu-
lation service, end-users were able to simulate fire spread
by simply providing an ignition point and the duration of
the simulation, based on the HFire algorithm (Peterson et
al., 2009). The instant and prompt availability of processing
power, along with the cost effectiveness, reliability and scal-
ability of the Azure Cloud were the main advantages of the
VENUS-C system.
Outside of Greece, parallel efforts to develop universal
fire management decision support tools resulted in a number
of other decision support systems. In the European Union,
the EFFIS system was developed to support forest protec-
tion against wildfires for over 30 countries in the European
and Mediterranean regions (San-Miguel-Ayanz et al., 2002).
EFFIS is considered a comprehensive system covering the
full cycle of forest fire management, from forest fire preven-
tion and preparedness to post-fire damage analysis. The ser-
vices include Fire Weather Index (FWI) forecasts, active fire
detection through MODIS satellites, rapid damage assess-
ment and post-fire modules dealing with the analysis of land
cover damages, post-fire soil erosion, emissions estimates
and dispersion of the smoke plume, and finally the monitor-
ing of vegetation recovery in large burned areas. EFFIS esti-
mates fire danger based on the Canadian FWI (Van Wagner,
1987), while weather forecast data are provided by Meteo
France3 and DWD (Deutcher Wetterdienst)4.
Comprehensive wildfire management systems were also
built in the US and Canada. A strategic and tactical sup-
pression system was built in the US (Wildland Fire Deci-
sion Support System, WFDSS) (Noonan-Wright et al., 2011)
that is widely used for incident support. WFDSS assists fire
managers and analysts in making strategic and tactical deci-
sions for fire incidents with a system that is easy to use, intu-
itive, linear, scalable and progressively responsive to chang-
ing fire complexity. WFDSS uses the National Fire Dan-
ger Rating System (NFDRS) (Burgan, 1988) for fire dan-
ger estimation, while data from RAWS (Zachariassen et al.,
2003) are utilized for weather analysis. Potential wildfire
spread from existing ignitions is forecasted for a maximum
3www.meteofrance.com4www.dwd.de
Nat. Hazards Earth Syst. Sci., 16, 643–661, 2016 www.nat-hazards-earth-syst-sci.net/16/643/2016/
K. Kalabokidis et al.: AEGIS: a wildfire prevention and management information system 645
of 10 days using the Minimum Travel Time (MTT) algo-
rithm (Finney, 2002) embedded within the FSPro simulation
software (Finney et al., 2011a; McDaniel, 2016). WFDSS
also provides damage assessment for the affected area based
on the Rapid Assessment Values at Risk (RAVAR) model
(Calkin et al., 2011) and the Stratified Cost Index (Gebert
et al., 2007). The WFDSS system is part of a larger family of
wildfire simulation models (e.g., FlamMap, FSim, Randig)
used by US land management agencies for risk assessment
and strategic planning. These systems all implement the
MTT algorithm in various wrappers tailored to specific wild-
fire management problems and associated geographic scales,
ranging from continental-scale risk analysis (Finney et al.,
2011b) to watershed-scale (e.g., 5000–50 000 ha) fuel treat-
ment projects (Ager et al., 2012). The MTT algorithm mod-
els two-dimensional fire growth under constant weather by
Huygens’ principle where the growth and behavior of the fire
edge is modeled as a vector or wave front (Knight and Cole-
man, 1993). This method reduces distortion of fire perime-
ters and improves response to temporally varying conditions
compared to techniques that model fire growth cell-to-cell on
a gridded landscape (Finney, 2002). Perimeter validation has
been performed in many studies including Ager et al. (2012)
and Salis et al. (2013). A number of support papers have been
published on the application of MTT and related models that
detail sources of input data, parameters and model limitations
(McHugh, 2006; Stratton, 2006; Ager et al., 2011). Extensive
documentation on the functionality is contained within the
FlamMap5 help system and the functionality can be down-
loaded and run within the FlamMap5 program5. This level
of availability of support information and example data sets
does not exist with other fire spread models, nor does the
code modularity.
In Canada, the Canadian Forest Fire Danger Rating Sys-
tem (CFFDRS) (Lee et al., 2002) is used for predictive ser-
vices. The CFFDRS comprises two primary subsystems or
modules: the Canadian Forest FWI System and the Cana-
dian Forest Fire Behavior Prediction (FBP) system (Forestry
Canada Fire Danger Group, 1992; Taylor et al., 1997). Fire
monitoring, mapping and modeling is achieved based on
high-resolution radiometer (AVHRR) satellite data to detect
actively burning forest fires. The Canadian Wildland Fire In-
formation System (CWFIS) (Lee et al., 2002) is Canada’s na-
tional fire management information system, presenting daily
information on fire weather, fire behavior potential and se-
lected upper atmospheric conditions.
In this paper, we describe our efforts to leverage recent
technical advances in the systems described above in order
to build a comprehensive and easy-to-use web-based deci-
sion support tool for fire managers in the Mediterranean re-
gion. The result was the wildfire prevention and management
information system AEGIS. The system incorporates paral-
lel computer processing techniques utilizing HPC and Cloud
5www.fire.org
Computing resources to enable the rapid execution of spa-
tial fire hazard calculations and fire behavior modeling with
the MTT algorithm. Results are made available to users via a
robust web-based Graphical User Interface (GUI) and a mo-
bile application (app) that acts as a complementary tool to
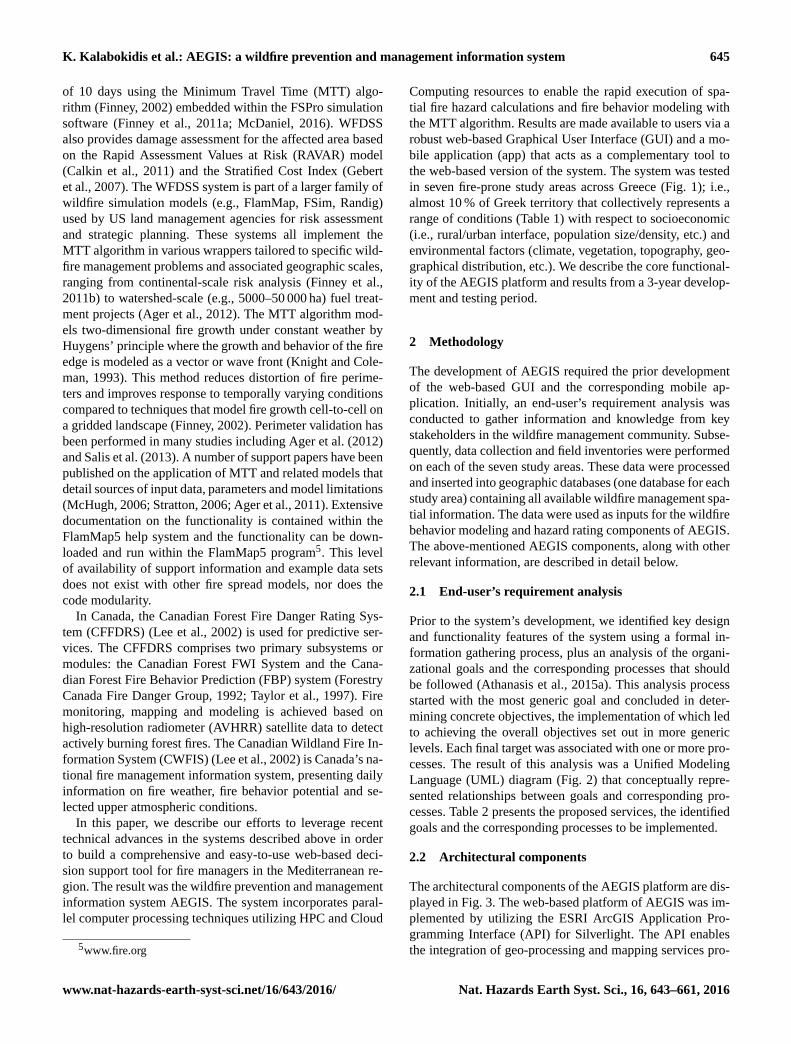
the web-based version of the system. The system was tested
in seven fire-prone study areas across Greece (Fig. 1); i.e.,
almost 10 % of Greek territory that collectively represents a
range of conditions (Table 1) with respect to socioeconomic
(i.e., rural/urban interface, population size/density, etc.) and
environmental factors (climate, vegetation, topography, geo-
graphical distribution, etc.). We describe the core functional-
ity of the AEGIS platform and results from a 3-year develop-
ment and testing period.
2 Methodology
The development of AEGIS required the prior development
of the web-based GUI and the corresponding mobile ap-
plication. Initially, an end-user’s requirement analysis was
conducted to gather information and knowledge from key
stakeholders in the wildfire management community. Subse-
quently, data collection and field inventories were performed
on each of the seven study areas. These data were processed
and inserted into geographic databases (one database for each
study area) containing all available wildfire management spa-
tial information. The data were used as inputs for the wildfire
behavior modeling and hazard rating components of AEGIS.
The above-mentioned AEGIS components, along with other
relevant information, are described in detail below.
2.1 End-user’s requirement analysis
Prior to the system’s development, we identified key design
and functionality features of the system using a formal in-
formation gathering process, plus an analysis of the organi-
zational goals and the corresponding processes that should
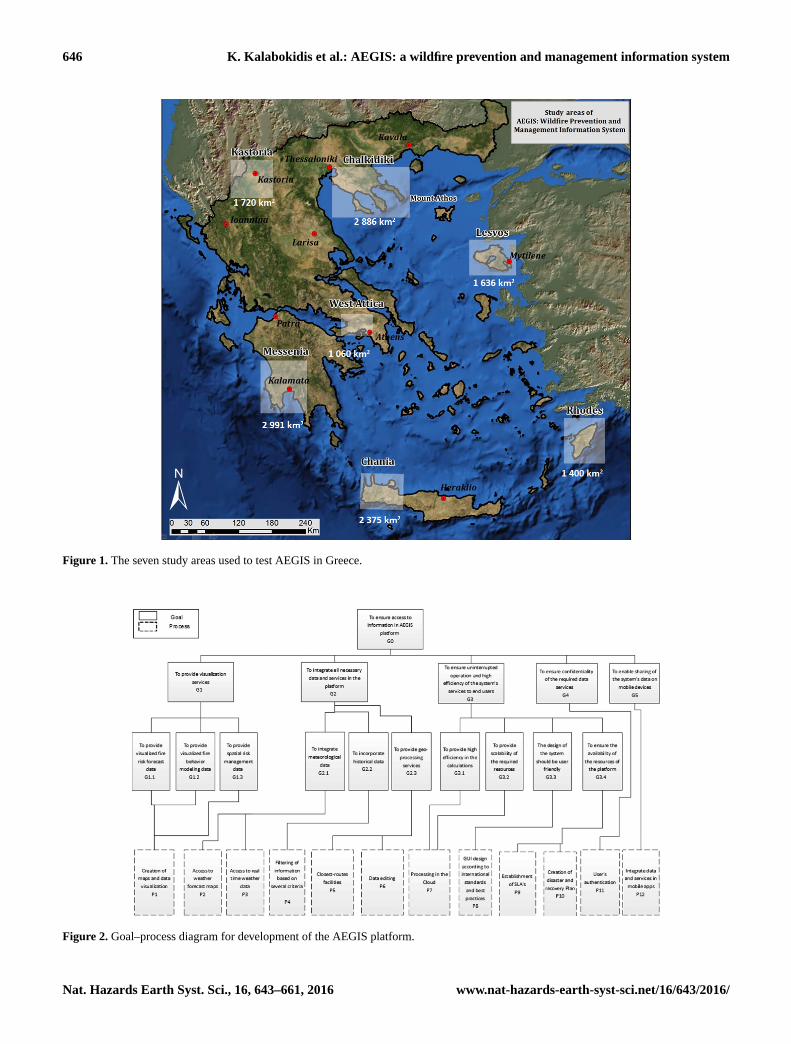
be followed (Athanasis et al., 2015a). This analysis process
started with the most generic goal and concluded in deter-
mining concrete objectives, the implementation of which led
to achieving the overall objectives set out in more generic
levels. Each final target was associated with one or more pro-
cesses. The result of this analysis was a Unified Modeling
Language (UML) diagram (Fig. 2) that conceptually repre-
sented relationships between goals and corresponding pro-
cesses. Table 2 presents the proposed services, the identified
goals and the corresponding processes to be implemented.
2.2 Architectural components
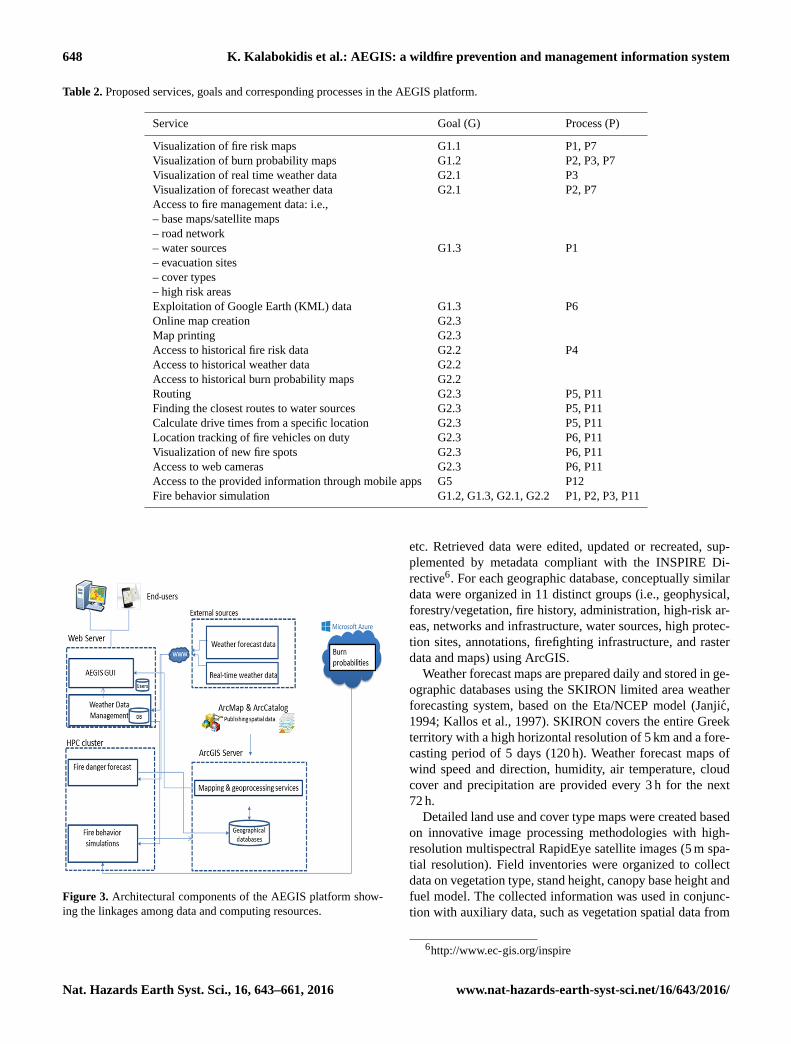
The architectural components of the AEGIS platform are dis-
played in Fig. 3. The web-based platform of AEGIS was im-
plemented by utilizing the ESRI ArcGIS Application Pro-
gramming Interface (API) for Silverlight. The API enables
the integration of geo-processing and mapping services pro-
www.nat-hazards-earth-syst-sci.net/16/643/2016/ Nat. Hazards Earth Syst. Sci., 16, 643–661, 2016
646 K. Kalabokidis et al.: AEGIS: a wildfire prevention and management information system
Figure 1. The seven study areas used to test AEGIS in Greece.
Figure 2. Goal–process diagram for development of the AEGIS platform.
Nat. Hazards Earth Syst. Sci., 16, 643–661, 2016 www.nat-hazards-earth-syst-sci.net/16/643/2016/
K. Kalabokidis et al.: AEGIS: a wildfire prevention and management information system 647
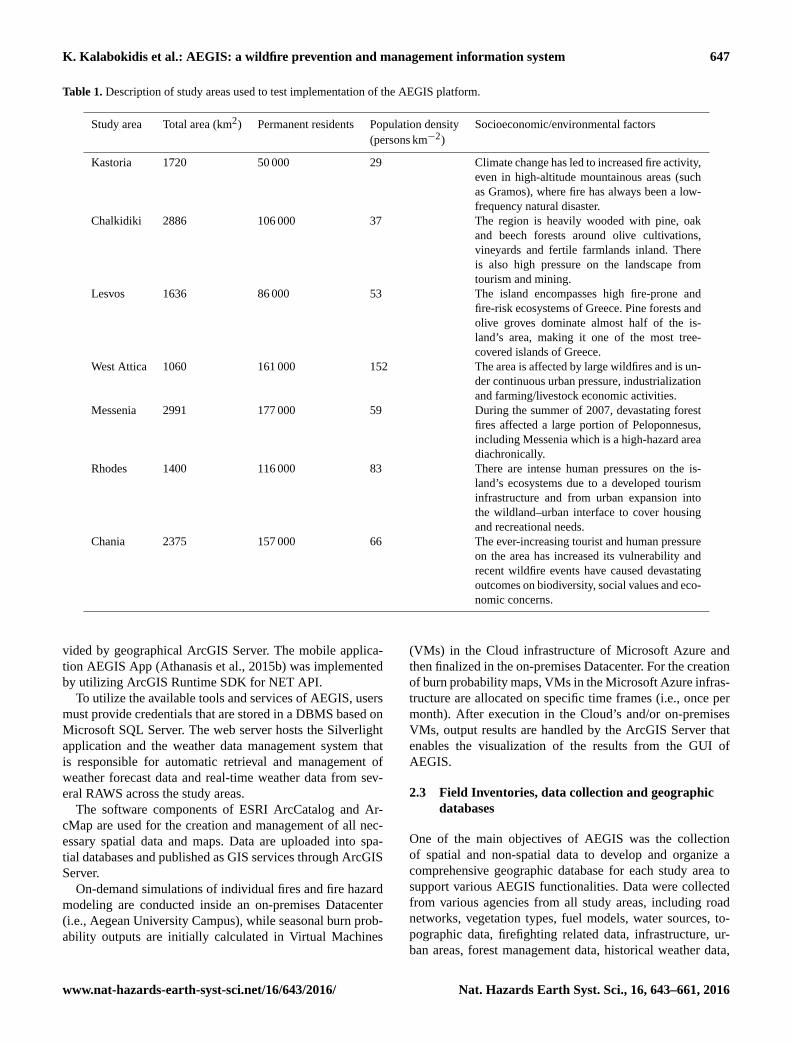
Table 1. Description of study areas used to test implementation of the AEGIS platform.
Study area Total area (km2) Permanent residents Population density Socioeconomic/environmental factors
(persons km−2)
Kastoria 1720 50 000 29 Climate change has led to increased fire activity,
even in high-altitude mountainous areas (such
as Gramos), where fire has always been a low-
frequency natural disaster.
Chalkidiki 2886 106 000 37 The region is heavily wooded with pine, oak
and beech forests around olive cultivations,
vineyards and fertile farmlands inland. There
is also high pressure on the landscape from
tourism and mining.
Lesvos 1636 86 000 53 The island encompasses high fire-prone and
fire-risk ecosystems of Greece. Pine forests and
olive groves dominate almost half of the is-
land’s area, making it one of the most tree-
covered islands of Greece.
West Attica 1060 161 000 152 The area is affected by large wildfires and is un-
der continuous urban pressure, industrialization
and farming/livestock economic activities.
Messenia 2991 177 000 59 During the summer of 2007, devastating forest
fires affected a large portion of Peloponnesus,
including Messenia which is a high-hazard area
diachronically.
Rhodes 1400 116 000 83 There are intense human pressures on the is-
land’s ecosystems due to a developed tourism
infrastructure and from urban expansion into
the wildland–urban interface to cover housing
and recreational needs.
Chania 2375 157 000 66 The ever-increasing tourist and human pressure
on the area has increased its vulnerability and
recent wildfire events have caused devastating
outcomes on biodiversity, social values and eco-
nomic concerns.
vided by geographical ArcGIS Server. The mobile applica-
tion AEGIS App (Athanasis et al., 2015b) was implemented
by utilizing ArcGIS Runtime SDK for NET API.
To utilize the available tools and services of AEGIS, users
must provide credentials that are stored in a DBMS based on
Microsoft SQL Server. The web server hosts the Silverlight
application and the weather data management system that
is responsible for automatic retrieval and management of
weather forecast data and real-time weather data from sev-
eral RAWS across the study areas.
The software components of ESRI ArcCatalog and Ar-
cMap are used for the creation and management of all nec-
essary spatial data and maps. Data are uploaded into spa-
tial databases and published as GIS services through ArcGIS
Server.
On-demand simulations of individual fires and fire hazard
modeling are conducted inside an on-premises Datacenter
(i.e., Aegean University Campus), while seasonal burn prob-
ability outputs are initially calculated in Virtual Machines
(VMs) in the Cloud infrastructure of Microsoft Azure and
then finalized in the on-premises Datacenter. For the creation
of burn probability maps, VMs in the Microsoft Azure infras-
tructure are allocated on specific time frames (i.e., once per
month). After execution in the Cloud’s and/or on-premises
VMs, output results are handled by the ArcGIS Server that
enables the visualization of the results from the GUI of
AEGIS.
2.3 Field Inventories, data collection and geographic
databases
One of the main objectives of AEGIS was the collection
of spatial and non-spatial data to develop and organize a
comprehensive geographic database for each study area to
support various AEGIS functionalities. Data were collected
from various agencies from all study areas, including road
networks, vegetation types, fuel models, water sources, to-
pographic data, firefighting related data, infrastructure, ur-
ban areas, forest management data, historical weather data,
www.nat-hazards-earth-syst-sci.net/16/643/2016/ Nat. Hazards Earth Syst. Sci., 16, 643–661, 2016
648 K. Kalabokidis et al.: AEGIS: a wildfire prevention and management information system
Table 2. Proposed services, goals and corresponding processes in the AEGIS platform.
Service Goal (G) Process (P)
Visualization of fire risk maps G1.1 P1, P7
Visualization of burn probability maps G1.2 P2, P3, P7
Visualization of real time weather data G2.1 P3
Visualization of forecast weather data G2.1 P2, P7
Access to fire management data: i.e.,
– base maps/satellite maps
– road network
– water sources G1.3 P1
– evacuation sites
– cover types
– high risk areas
Exploitation of Google Earth (KML) data G1.3 P6
Online map creation G2.3
Map printing G2.3
Access to historical fire risk data G2.2 P4
Access to historical weather data G2.2
Access to historical burn probability maps G2.2
Routing G2.3 P5, P11
Finding the closest routes to water sources G2.3 P5, P11
Calculate drive times from a specific location G2.3 P5, P11
Location tracking of fire vehicles on duty G2.3 P6, P11
Visualization of new fire spots G2.3 P6, P11
Access to web cameras G2.3 P6, P11
Access to the provided information through mobile apps G5 P12
Fire behavior simulation G1.2, G1.3, G2.1, G2.2 P1, P2, P3, P11
Figure 3. Architectural components of the AEGIS platform show-
ing the linkages among data and computing resources.
etc. Retrieved data were edited, updated or recreated, sup-
plemented by metadata compliant with the INSPIRE Di-
rective6. For each geographic database, conceptually similar
data were organized in 11 distinct groups (i.e., geophysical,
forestry/vegetation, fire history, administration, high-risk ar-
eas, networks and infrastructure, water sources, high protec-
tion sites, annotations, firefighting infrastructure, and raster
data and maps) using ArcGIS.
Weather forecast maps are prepared daily and stored in ge-
ographic databases using the SKIRON limited area weather
forecasting system, based on the Eta/NCEP model (Janjic,
1994; Kallos et al., 1997). SKIRON covers the entire Greek
territory with a high horizontal resolution of 5 km and a fore-
casting period of 5 days (120 h). Weather forecast maps of
wind speed and direction, humidity, air temperature, cloud
cover and precipitation are provided every 3 h for the next
72 h.
Detailed land use and cover type maps were created based
on innovative image processing methodologies with high-
resolution multispectral RapidEye satellite images (5 m spa-
tial resolution). Field inventories were organized to collect
data on vegetation type, stand height, canopy base height and
fuel model. The collected information was used in conjunc-
tion with auxiliary data, such as vegetation spatial data from
6http://www.ec-gis.org/inspire
Nat. Hazards Earth Syst. Sci., 16, 643–661, 2016 www.nat-hazards-earth-syst-sci.net/16/643/2016/
K. Kalabokidis et al.: AEGIS: a wildfire prevention and management information system 649
CORINE 2000 vegetation classification system (EEA, 2002)
and other forest management data, during the vegetation map
creation process. To account for seasonal effects on vegeta-
tion, two image mosaics of each study area were used for two
time periods of the same reference year. Satellite image pro-
cessing was conducted in three stages: preprocessing, divid-
ing each study area into homogeneous physiographic zones;
classification, with a fuzzy set technique and application of
a segmentation algorithm; and post-classification, applying
convolution filters for image smoothing. Finally, corrections
were applied on the results (vector files) by visual interpreta-
tion, digitization and cover type characterization over aerial
orthophotos.
Standard fuel models were used for four out of the seven
study areas, while the remaining three study areas were as-
signed a set of custom fuel models to describe the differ-
ent fuel conditions of Pinus brutia, a common pine species
of eastern Greece. Four fuel models were used to describe
these pine forests, as described by Palaiologou et al. (2013).
Tests on a number of wildfire events occurred in this vegeta-
tion type revealed that standard fuel models presented over-
estimations of both final fire size and wildfire progression
through time (Kalabokidis et al., 2013c).
2.4 Fire behavior modeling
AEGIS utilizes the MTT algorithm for fire behavior pre-
dictions and fire hazard estimation, in conjunction with
FlamMap5 modeling capabilities (Finney, 2006). The MTT
fire spread algorithm and associated crown fire models as im-
plemented in the FlamMap code libraries is by far the most
widely used and tested fire simulation in the world. MTT
has been applied in strategic and tactical fire management
planning in the US (Ager et al., 2011) and integrated into
FARSITE (Finney, 1998), FlamMap5 (Finney, 2006), FSim
(Finney et al., 2011b), FSPro (Noonan-Wright et al., 2011),
Randig (Ager et al., 2007, 2014) and other models in the
research domain. Application and testing also includes fire
systems outside of the US, including France, Spain, Italy
and Portugal (Alcasena et al., 2015; Salis et al., 2013, 2015)
where the MTT algorithm encapsulated in Randig and FCon-
stMTT (command line-based executable) was used to model
fire exposure to highly valued resources, and to model the
effect of fuel breaks on wildfire spread.
Under constant fire weather conditions, the MTT algo-
rithm searches for the fastest path of fire spread along
straight-line transects connected by nodes (cell corners) and
exposes the effects of topography and the arrangement of fu-
els on fire growth (Finney, 2006). The MTT algorithm can be
used to compute potential short-term fire behavior character-
istics (rate of spread, fireline intensity, time of arrival, flow
paths, etc.) for a single fire or simulate many fires to gen-
erate conditional burn probabilities and flame lengths using
Monte Carlo stochastic simulations, where fire weather and
fuel moisture information varies among the simulated fires
(Ager et al., 2007; Finney et al., 2011b). Burn probability is
an estimate of the likelihood of a pixel burning given a sin-
gle random ignition under burn conditions in the simulation.
Burn probability modeling represents a major advancement
in wildfire behavior modeling and risk assessment compared
to previous methods, such as those where fire likelihood was
quantified with relatively few predetermined ignition loca-
tions (i.e., fewer than 10). As a result, the product of this
process is a burn probability map that reveals areas that are
more likely to burn. The FlamMap5 library generates a num-
ber of additional outputs that we included in AEGIS includ-
ing flame length, rate of spread, fireline intensity, heat per
unit area, crown fire activity and midflame wind speed.
For individual fire simulations, MTT is implemented
within AEGIS in a transparent web-based GUI. When a fire
simulation is triggered, a command line execution of MTT
starts the simulation inside the HPC cluster. If multiple users
begin their simulations simultaneously, each simulation is as-
signed to one of the available HPC nodes and execution takes
place in parallel. Upon the completion of execution, several
output files are generated either in GRID ASCII format (ar-
rival time, fireline intensity, ignition point and rate of spread)
or vector files with information for regular and major flow
paths (Finney, 2006). After output files are created, several
ArcGIS Server geo-processing services are executed to con-
vert GRID ASCII outputs to vector format and store them
in feature classes inside a geographical database. Finally, Ar-
cGIS Server mapping services retrieves the appropriate infor-
mation from feature classes using a filtering process to select
simulation outputs and display map outputs in the AEGIS
platform.
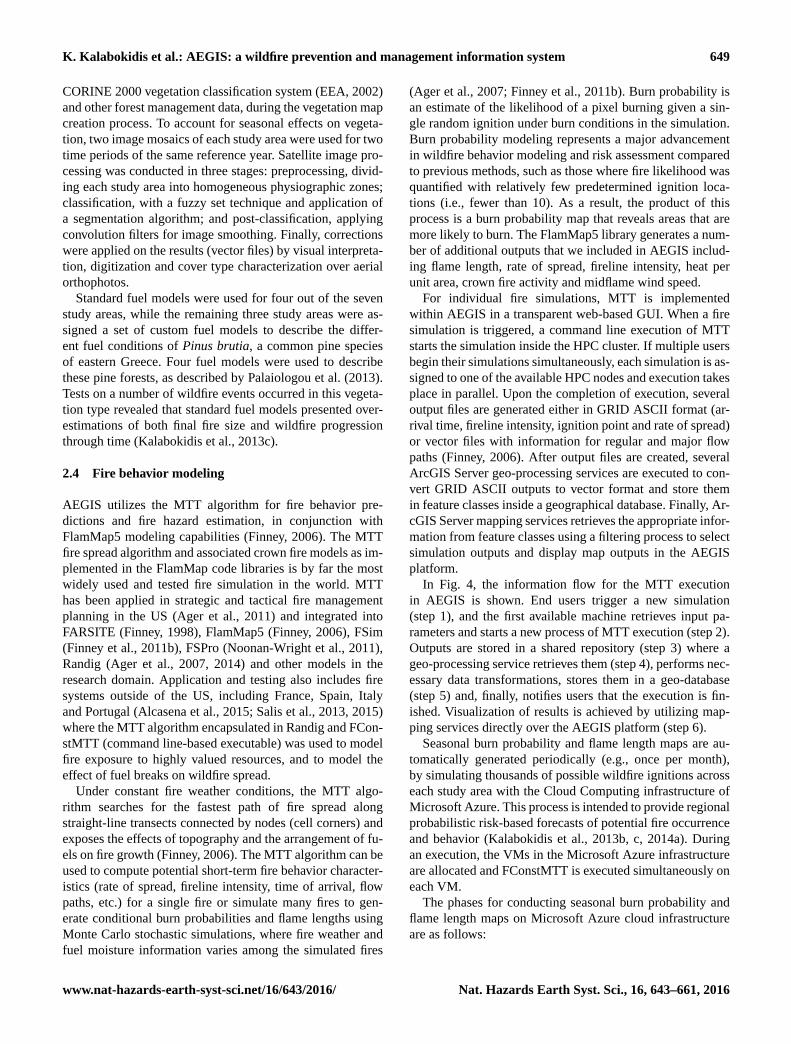
In Fig. 4, the information flow for the MTT execution
in AEGIS is shown. End users trigger a new simulation
(step 1), and the first available machine retrieves input pa-
rameters and starts a new process of MTT execution (step 2).
Outputs are stored in a shared repository (step 3) where a
geo-processing service retrieves them (step 4), performs nec-
essary data transformations, stores them in a geo-database
(step 5) and, finally, notifies users that the execution is fin-
ished. Visualization of results is achieved by utilizing map-
ping services directly over the AEGIS platform (step 6).
Seasonal burn probability and flame length maps are au-
tomatically generated periodically (e.g., once per month),
by simulating thousands of possible wildfire ignitions across
each study area with the Cloud Computing infrastructure of
Microsoft Azure. This process is intended to provide regional
probabilistic risk-based forecasts of potential fire occurrence
and behavior (Kalabokidis et al., 2013b, c, 2014a). During
an execution, the VMs in the Microsoft Azure infrastructure
are allocated and FConstMTT is executed simultaneously on
each VM.
The phases for conducting seasonal burn probability and
flame length maps on Microsoft Azure cloud infrastructure
are as follows:
www.nat-hazards-earth-syst-sci.net/16/643/2016/ Nat. Hazards Earth Syst. Sci., 16, 643–661, 2016
650 K. Kalabokidis et al.: AEGIS: a wildfire prevention and management information system
Figure 4. Information flow for on-demand MTT simulations of individual wildfires in AEGIS.
– Initialization: a deployment is uploaded in the Mi-
crosoft Azure cloud infrastructure that runs FCon-
stMTT command line-based executable.
– Execution: parallel execution of the FConstMTT exe-
cutable is conducted by dividing the overall number of
ignition points equally among the available VMs. This
partitioning of the ignitions significantly reduces execu-
tion time.
– Merging: output results are combined into a new ASCII
text file to calculate burn probabilities and flame length
categories (i.e., 20 categories) for all ignitions.
– Extraction: burn probabilities and every flame length
category are extracted from the merged output.
– Visualization: the extracted outputs are loaded in a geo-
database and visualized through the AEGIS platform.
Furthermore, outputs are available for download from
end-users to perform meta-analysis (e.g., with ArcFu-
els).
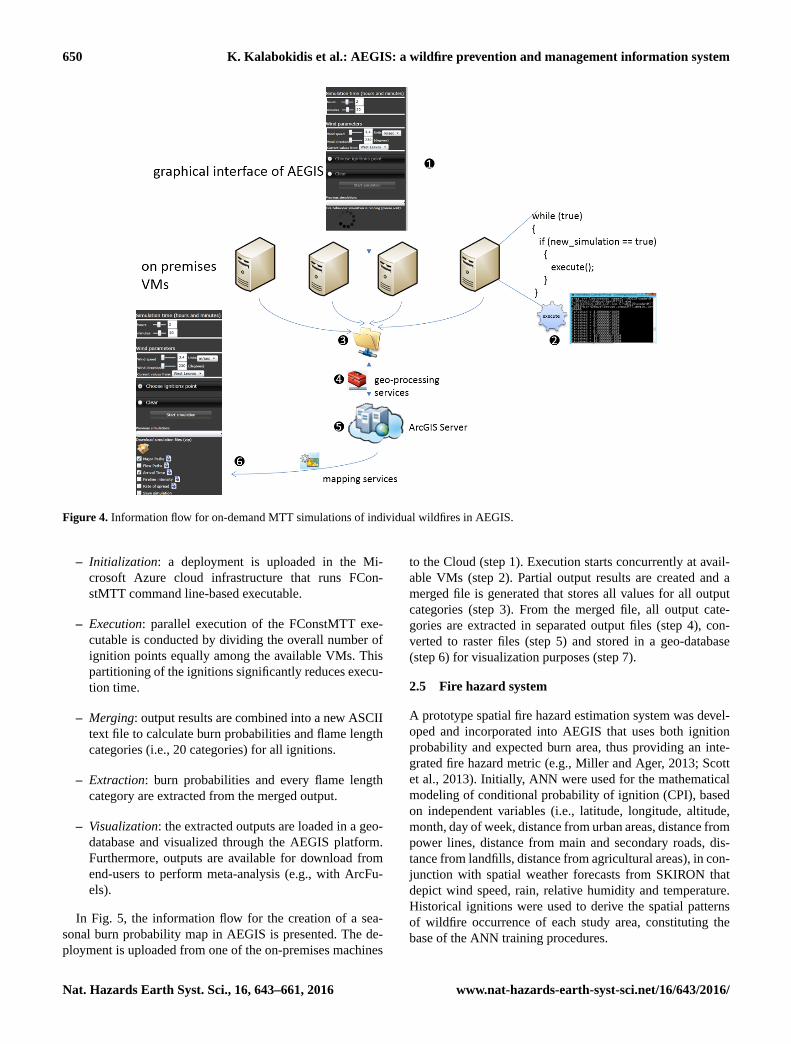
In Fig. 5, the information flow for the creation of a sea-
sonal burn probability map in AEGIS is presented. The de-
ployment is uploaded from one of the on-premises machines
to the Cloud (step 1). Execution starts concurrently at avail-
able VMs (step 2). Partial output results are created and a
merged file is generated that stores all values for all output
categories (step 3). From the merged file, all output cate-
gories are extracted in separated output files (step 4), con-
verted to raster files (step 5) and stored in a geo-database
(step 6) for visualization purposes (step 7).
2.5 Fire hazard system
A prototype spatial fire hazard estimation system was devel-
oped and incorporated into AEGIS that uses both ignition
probability and expected burn area, thus providing an inte-
grated fire hazard metric (e.g., Miller and Ager, 2013; Scott
et al., 2013). Initially, ANN were used for the mathematical
modeling of conditional probability of ignition (CPI), based
on independent variables (i.e., latitude, longitude, altitude,
month, day of week, distance from urban areas, distance from
power lines, distance from main and secondary roads, dis-
tance from landfills, distance from agricultural areas), in con-
junction with spatial weather forecasts from SKIRON that
depict wind speed, rain, relative humidity and temperature.
Historical ignitions were used to derive the spatial patterns
of wildfire occurrence of each study area, constituting the
base of the ANN training procedures.
Nat. Hazards Earth Syst. Sci., 16, 643–661, 2016 www.nat-hazards-earth-syst-sci.net/16/643/2016/
K. Kalabokidis et al.: AEGIS: a wildfire prevention and management information system 651
Figure 5. Information flow for the estimation of burn probability
maps in AEGIS.
We experimented with multiple methodologies includ-
ing the Back Propagation Neural (BPN) Networks (Rumel-
hart et al., 1986), the Kohonen Networks (Self Organizing
Maps) (Kohonen, 1982), and two types of Radial Basis Func-
tion (RBF) Networks (Tsekouras et al., 2015). The back-
propagation method proved to perform better compared to
the other two. As a result, this method was selected and ap-
plied for operational use. Development of the final algorithm
was based on trial and error techniques. Three different ac-
tivation functions were tested for transferring the signal be-
tween input and hidden nodes; i.e., logistic sigmoid, hyper-
bolic tangent sigmoid and linear functions. The input pa-
rameters were either unprocessed or normalized. Finally, the
training process was controlled by the early stopping method,
where the number of validation samples and the maximum
number of training epochs were monitored (Prechelt, 1998).
For each possible combination of the above parameters, a
back-propagation neural network was developed with one
hidden layer of five to 20 processing nodes. Eighty percent
of the sample was used for training, while the remainder was
utilized during the validation stage. The selection of these
samples was randomized during the initialization stage. Each
network was trained for 10 initializations; therefore, 1008
networks were developed for each study area. Based on the
above results, the best-performing networks of root mean
square error (RMSE) of the validation data set were saved
for each area and integrated into the graphical interface of
AEGIS to be used for the computation and cartographic rep-
resentation of wildfire ignition risk. By using FlamMap, the
predicted burned area (PBA) is estimated using the elliptical
dimensions output grid themes that give the a, b and c di-
mensions (expressed by rate of spread on meters per minute)
for a simple ellipse (Finney, 2001), to derive the burned area
per pixel for a time period of 3 h. The spatial data of the SK-
IRON model for wind speed and direction are provided as
FlamMap input, while relative humidity and air temperature
values are used to estimate fuel moisture values.
The 10 h fuel moisture content (m) is computed based on
relative humidity (H ) and air temperature (T ) by using the
following algorithm (Viney, 1991):
m= 5.658+ 0.0465×H + 3.151× 10⁻⁴× H 3
× T −1− 0.1854× T 0.77.
The 1 and the 100 h fuel moisture values are calculated by
subtracting and adding 1 % to the 10 h fuel moisture, respec-
tively, while the values of live herbaceous and live woody
moisture are predefined based on the actual date of each fire
event, linked to the standard fuel moisture scenarios of the
BehavePlus software according to Table 3. Finally, CPI is
combined with PBA in the matrix of Table 4 to derive the
resulting fire hazard index in five categories from Low to Ex-
treme levels.
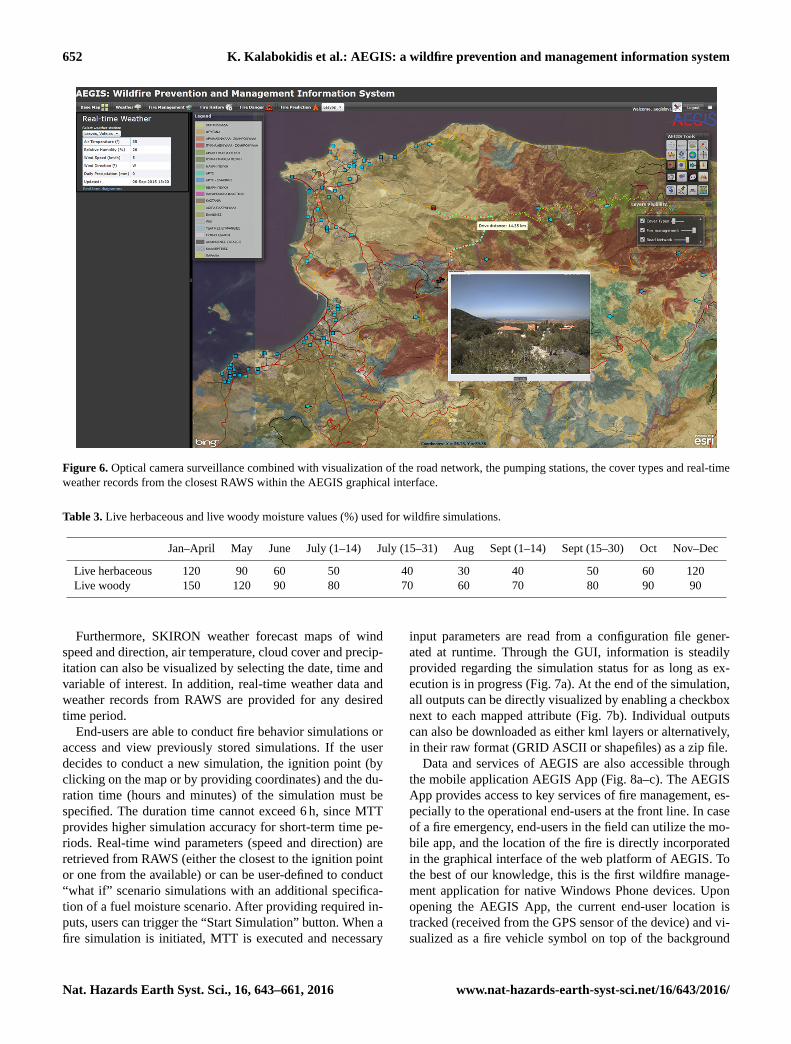
2.6 Access to data and services
All services and data provided by AEGIS are accessible
through a web-based interface eliminating the need to in-
stall specific desktop software. This minimizes deployment
time and eliminates client costs for software, thus enabling
any authorized user to immediately access the GUI from any-
where in the world over the Internet. Users have the ability
to perform GIS tasks and utilize resulting products within the
GUI (Fig. 6). The mapping schemes of Bing Maps and Open
Street Maps provide high-resolution satellite images and de-
tailed thematic maps with annotations and road network in-
formation, used as background mapping layers of AEGIS.
Land use/land cover types can also be selected and displayed,
along with annotations, study area boundaries and urban ar-
eas. Apart from background layer selection, users have ac-
cess to information to support forest fire suppression efforts.
This information includes the road network, water sources,
fire watch outlooks, monuments, helipads, gas stations, land-
fills, evacuation sites, and firefighting vehicle patrol sites.
Several tools and services such as live camera image streams,
geo-processing tools, and elevation profiling of any area of
interest are integrated. Spatial queries regarding the drive
time distances from a site and the locations of closest water
tanks, fire hydrants and pumping stations are also provided,
as well as the analysis of the shortest routes among locations
on the map based on the Bing Maps routing scheme.
www.nat-hazards-earth-syst-sci.net/16/643/2016/ Nat. Hazards Earth Syst. Sci., 16, 643–661, 2016
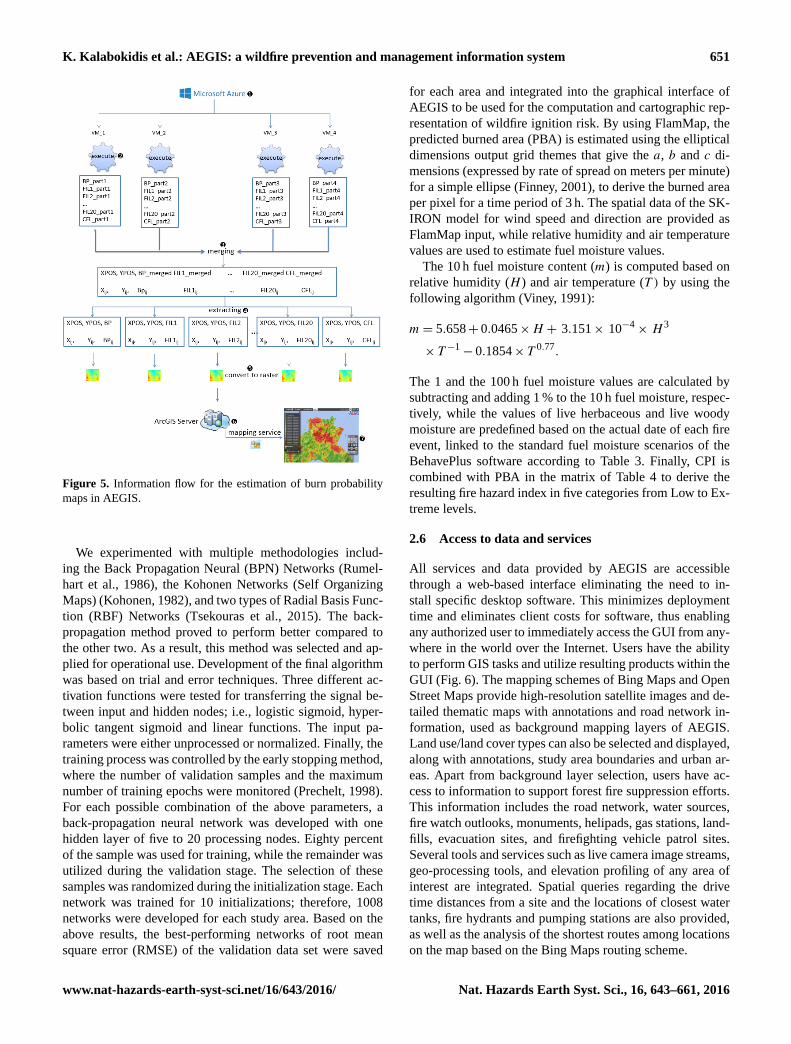
652 K. Kalabokidis et al.: AEGIS: a wildfire prevention and management information system
Figure 6. Optical camera surveillance combined with visualization of the road network, the pumping stations, the cover types and real-time
weather records from the closest RAWS within the AEGIS graphical interface.
Table 3. Live herbaceous and live woody moisture values (%) used for wildfire simulations.
Jan–April May June July (1–14) July (15–31) Aug Sept (1–14) Sept (15–30) Oct Nov–Dec
Live herbaceous 120 90 60 50 40 30 40 50 60 120
Live woody 150 120 90 80 70 60 70 80 90 90
Furthermore, SKIRON weather forecast maps of wind
speed and direction, air temperature, cloud cover and precip-
itation can also be visualized by selecting the date, time and
variable of interest. In addition, real-time weather data and
weather records from RAWS are provided for any desired
time period.
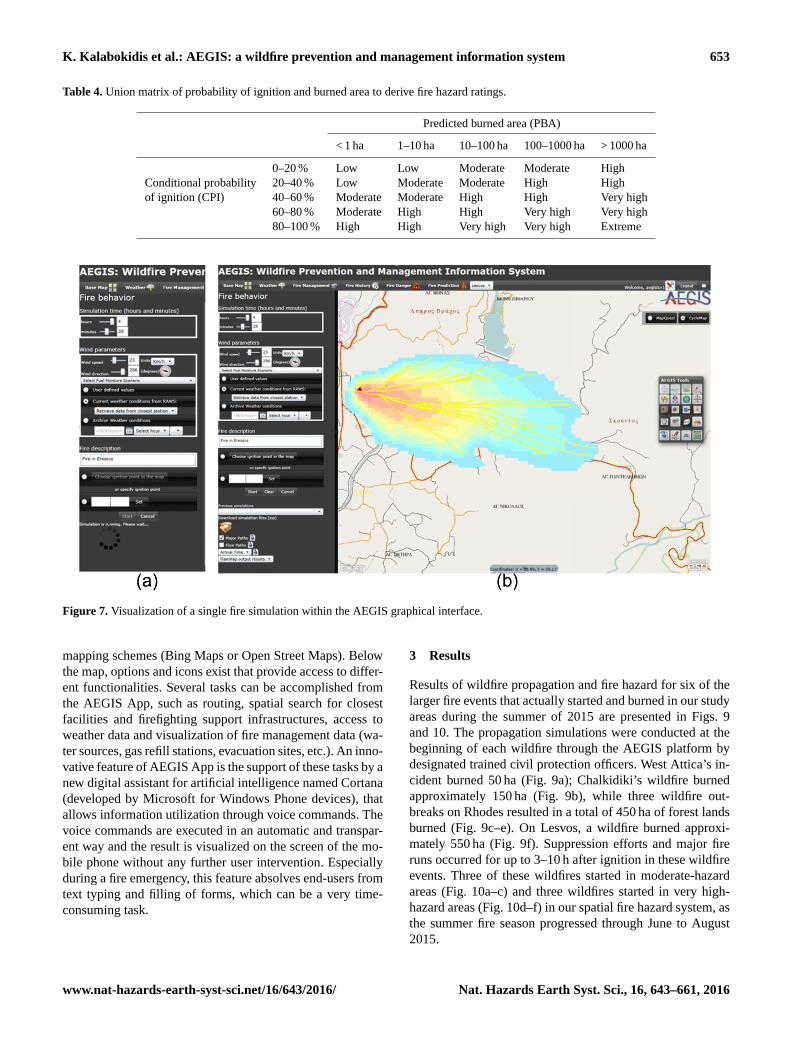
End-users are able to conduct fire behavior simulations or
access and view previously stored simulations. If the user
decides to conduct a new simulation, the ignition point (by
clicking on the map or by providing coordinates) and the du-
ration time (hours and minutes) of the simulation must be
specified. The duration time cannot exceed 6 h, since MTT
provides higher simulation accuracy for short-term time pe-
riods. Real-time wind parameters (speed and direction) are
retrieved from RAWS (either the closest to the ignition point
or one from the available) or can be user-defined to conduct
“what if” scenario simulations with an additional specifica-
tion of a fuel moisture scenario. After providing required in-
puts, users can trigger the “Start Simulation” button. When a
fire simulation is initiated, MTT is executed and necessary
input parameters are read from a configuration file gener-
ated at runtime. Through the GUI, information is steadily
provided regarding the simulation status for as long as ex-
ecution is in progress (Fig. 7a). At the end of the simulation,
all outputs can be directly visualized by enabling a checkbox
next to each mapped attribute (Fig. 7b). Individual outputs
can also be downloaded as either kml layers or alternatively,
in their raw format (GRID ASCII or shapefiles) as a zip file.
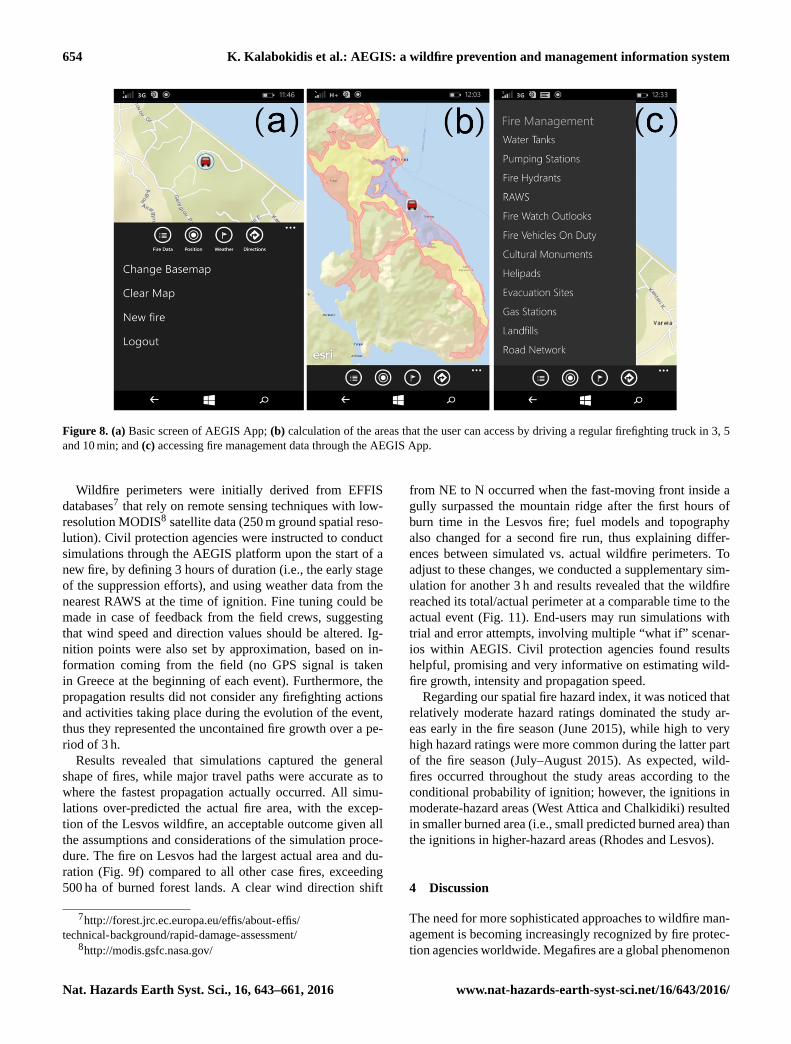
Data and services of AEGIS are also accessible through
the mobile application AEGIS App (Fig. 8a–c). The AEGIS
App provides access to key services of fire management, es-
pecially to the operational end-users at the front line. In case
of a fire emergency, end-users in the field can utilize the mo-
bile app, and the location of the fire is directly incorporated
in the graphical interface of the web platform of AEGIS. To
the best of our knowledge, this is the first wildfire manage-
ment application for native Windows Phone devices. Upon
opening the AEGIS App, the current end-user location is
tracked (received from the GPS sensor of the device) and vi-
sualized as a fire vehicle symbol on top of the background
Nat. Hazards Earth Syst. Sci., 16, 643–661, 2016 www.nat-hazards-earth-syst-sci.net/16/643/2016/
K. Kalabokidis et al.: AEGIS: a wildfire prevention and management information system 653
Table 4. Union matrix of probability of ignition and burned area to derive fire hazard ratings.
Predicted burned area (PBA)
< 1 ha 1–10 ha 10–100 ha 100–1000 ha > 1000 ha
0–20 % Low Low Moderate Moderate High
Conditional probability 20–40 % Low Moderate Moderate High High
of ignition (CPI) 40–60 % Moderate Moderate High High Very high
60–80 % Moderate High High Very high Very high
80–100 % High High Very high Very high Extreme
Figure 7. Visualization of a single fire simulation within the AEGIS graphical interface.
mapping schemes (Bing Maps or Open Street Maps). Below
the map, options and icons exist that provide access to differ-
ent functionalities. Several tasks can be accomplished from
the AEGIS App, such as routing, spatial search for closest
facilities and firefighting support infrastructures, access to
weather data and visualization of fire management data (wa-
ter sources, gas refill stations, evacuation sites, etc.). An inno-
vative feature of AEGIS App is the support of these tasks by a
new digital assistant for artificial intelligence named Cortana
(developed by Microsoft for Windows Phone devices), that
allows information utilization through voice commands. The
voice commands are executed in an automatic and transpar-
ent way and the result is visualized on the screen of the mo-
bile phone without any further user intervention. Especially
during a fire emergency, this feature absolves end-users from
text typing and filling of forms, which can be a very time-
consuming task.
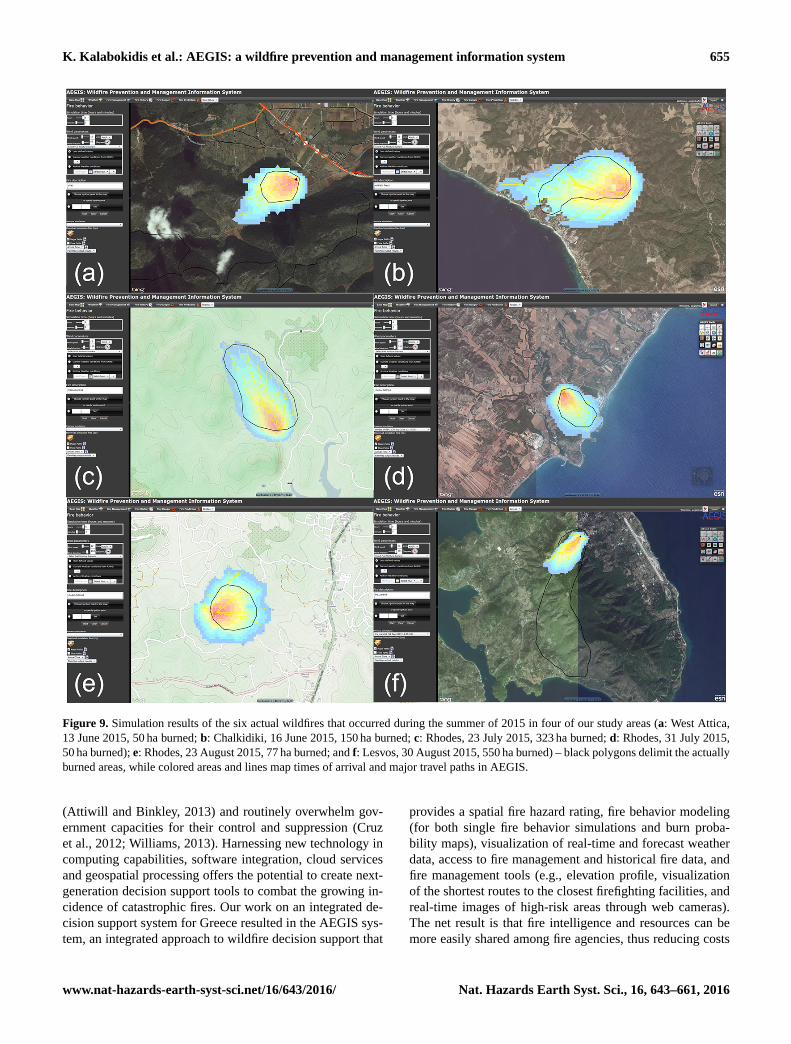
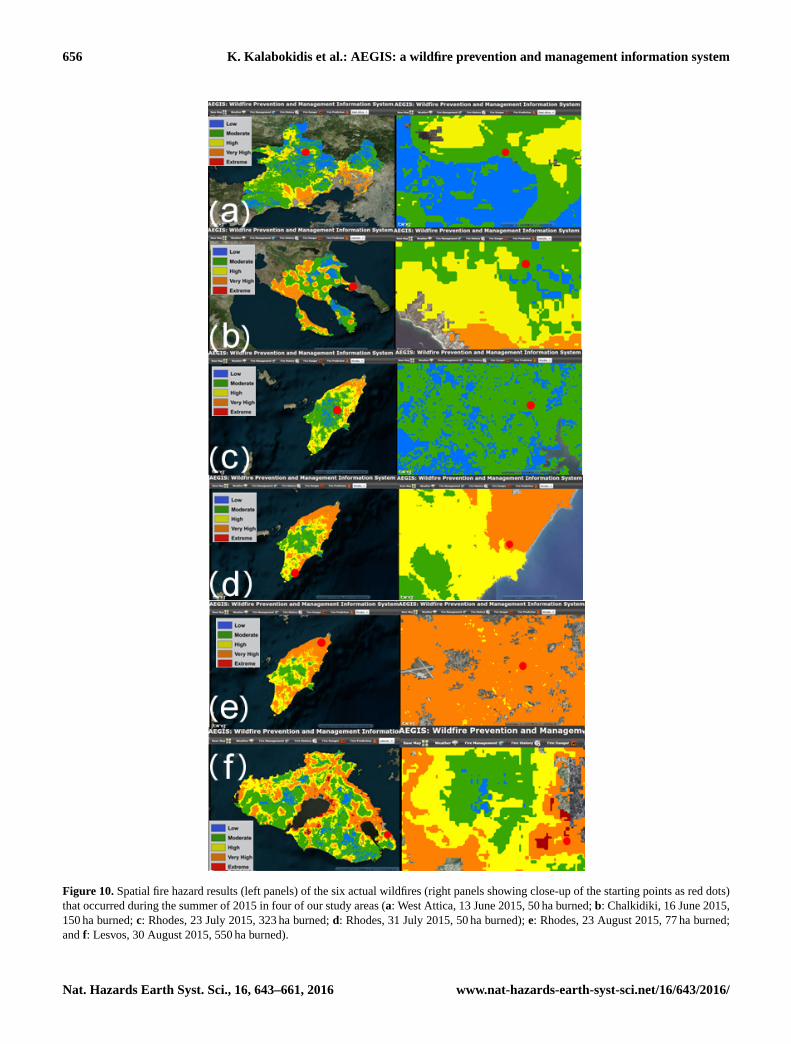
3 Results
Results of wildfire propagation and fire hazard for six of the
larger fire events that actually started and burned in our study
areas during the summer of 2015 are presented in Figs. 9
and 10. The propagation simulations were conducted at the
beginning of each wildfire through the AEGIS platform by
designated trained civil protection officers. West Attica’s in-
cident burned 50 ha (Fig. 9a); Chalkidiki’s wildfire burned
approximately 150 ha (Fig. 9b), while three wildfire out-
breaks on Rhodes resulted in a total of 450 ha of forest lands
burned (Fig. 9c–e). On Lesvos, a wildfire burned approxi-
mately 550 ha (Fig. 9f). Suppression efforts and major fire
runs occurred for up to 3–10 h after ignition in these wildfire
events. Three of these wildfires started in moderate-hazard
areas (Fig. 10a–c) and three wildfires started in very high-
hazard areas (Fig. 10d–f) in our spatial fire hazard system, as
the summer fire season progressed through June to August
2015.
www.nat-hazards-earth-syst-sci.net/16/643/2016/ Nat. Hazards Earth Syst. Sci., 16, 643–661, 2016
654 K. Kalabokidis et al.: AEGIS: a wildfire prevention and management information system
Figure 8. (a) Basic screen of AEGIS App; (b) calculation of the areas that the user can access by driving a regular firefighting truck in 3, 5
and 10 min; and (c) accessing fire management data through the AEGIS App.
Wildfire perimeters were initially derived from EFFIS
databases7 that rely on remote sensing techniques with low-
resolution MODIS8 satellite data (250 m ground spatial reso-
lution). Civil protection agencies were instructed to conduct
simulations through the AEGIS platform upon the start of a
new fire, by defining 3 hours of duration (i.e., the early stage
of the suppression efforts), and using weather data from the
nearest RAWS at the time of ignition. Fine tuning could be
made in case of feedback from the field crews, suggesting
that wind speed and direction values should be altered. Ig-
nition points were also set by approximation, based on in-
formation coming from the field (no GPS signal is taken
in Greece at the beginning of each event). Furthermore, the
propagation results did not consider any firefighting actions
and activities taking place during the evolution of the event,
thus they represented the uncontained fire growth over a pe-
riod of 3 h.
Results revealed that simulations captured the general
shape of fires, while major travel paths were accurate as to
where the fastest propagation actually occurred. All simu-
lations over-predicted the actual fire area, with the excep-
tion of the Lesvos wildfire, an acceptable outcome given all
the assumptions and considerations of the simulation proce-
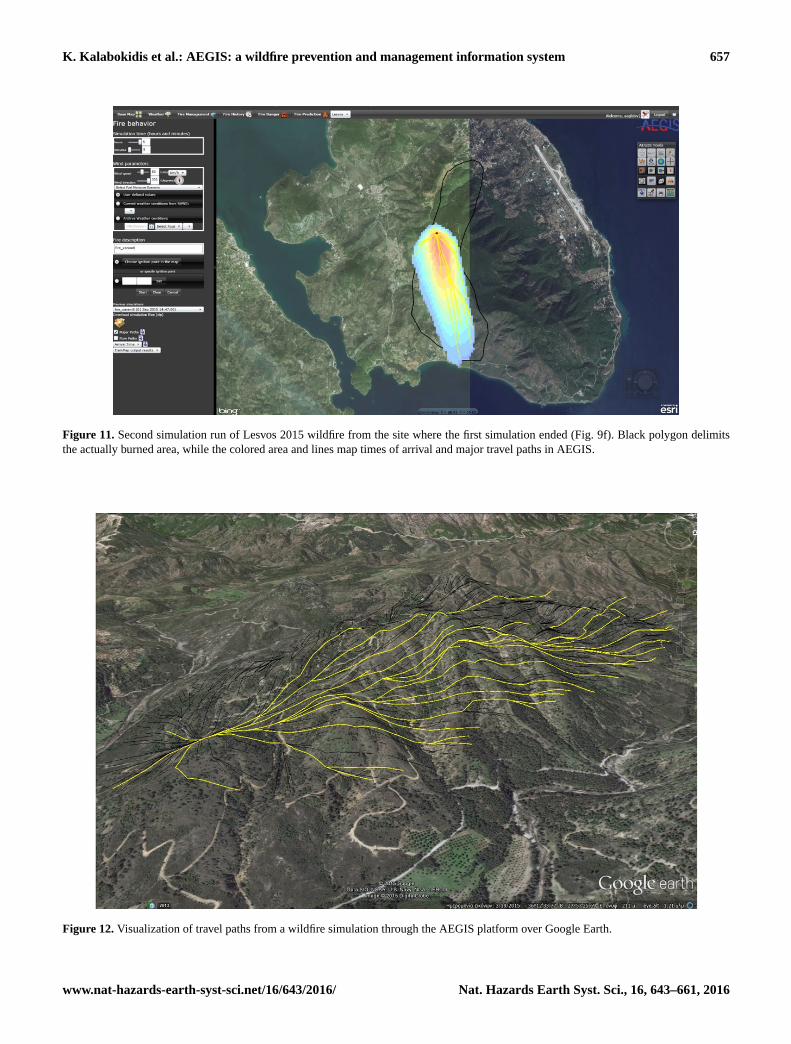
dure. The fire on Lesvos had the largest actual area and du-
ration (Fig. 9f) compared to all other case fires, exceeding
500 ha of burned forest lands. A clear wind direction shift
7http://forest.jrc.ec.europa.eu/effis/about-effis/
technical-background/rapid-damage-assessment/8http://modis.gsfc.nasa.gov/
from NE to N occurred when the fast-moving front inside a
gully surpassed the mountain ridge after the first hours of
burn time in the Lesvos fire; fuel models and topography
also changed for a second fire run, thus explaining differ-
ences between simulated vs. actual wildfire perimeters. To
adjust to these changes, we conducted a supplementary sim-
ulation for another 3 h and results revealed that the wildfire
reached its total/actual perimeter at a comparable time to the
actual event (Fig. 11). End-users may run simulations with
trial and error attempts, involving multiple “what if” scenar-
ios within AEGIS. Civil protection agencies found results
helpful, promising and very informative on estimating wild-
fire growth, intensity and propagation speed.
Regarding our spatial fire hazard index, it was noticed that
relatively moderate hazard ratings dominated the study ar-
eas early in the fire season (June 2015), while high to very
high hazard ratings were more common during the latter part
of the fire season (July–August 2015). As expected, wild-
fires occurred throughout the study areas according to the
conditional probability of ignition; however, the ignitions in
moderate-hazard areas (West Attica and Chalkidiki) resulted
in smaller burned area (i.e., small predicted burned area) than
the ignitions in higher-hazard areas (Rhodes and Lesvos).
4 Discussion
The need for more sophisticated approaches to wildfire man-
agement is becoming increasingly recognized by fire protec-
tion agencies worldwide. Megafires are a global phenomenon
Nat. Hazards Earth Syst. Sci., 16, 643–661, 2016 www.nat-hazards-earth-syst-sci.net/16/643/2016/
K. Kalabokidis et al.: AEGIS: a wildfire prevention and management information system 655
Figure 9. Simulation results of the six actual wildfires that occurred during the summer of 2015 in four of our study areas (a: West Attica,
13 June 2015, 50 ha burned; b: Chalkidiki, 16 June 2015, 150 ha burned; c: Rhodes, 23 July 2015, 323 ha burned; d: Rhodes, 31 July 2015,
50 ha burned); e: Rhodes, 23 August 2015, 77 ha burned; and f: Lesvos, 30 August 2015, 550 ha burned) – black polygons delimit the actually
burned areas, while colored areas and lines map times of arrival and major travel paths in AEGIS.
(Attiwill and Binkley, 2013) and routinely overwhelm gov-
ernment capacities for their control and suppression (Cruz
et al., 2012; Williams, 2013). Harnessing new technology in
computing capabilities, software integration, cloud services
and geospatial processing offers the potential to create next-
generation decision support tools to combat the growing in-
cidence of catastrophic fires. Our work on an integrated de-
cision support system for Greece resulted in the AEGIS sys-
tem, an integrated approach to wildfire decision support that
provides a spatial fire hazard rating, fire behavior modeling
(for both single fire behavior simulations and burn proba-
bility maps), visualization of real-time and forecast weather
data, access to fire management and historical fire data, and
fire management tools (e.g., elevation profile, visualization
of the shortest routes to the closest firefighting facilities, and
real-time images of high-risk areas through web cameras).
The net result is that fire intelligence and resources can be
more easily shared among fire agencies, thus reducing costs
www.nat-hazards-earth-syst-sci.net/16/643/2016/ Nat. Hazards Earth Syst. Sci., 16, 643–661, 2016
656 K. Kalabokidis et al.: AEGIS: a wildfire prevention and management information system
Figure 10. Spatial fire hazard results (left panels) of the six actual wildfires (right panels showing close-up of the starting points as red dots)
that occurred during the summer of 2015 in four of our study areas (a: West Attica, 13 June 2015, 50 ha burned; b: Chalkidiki, 16 June 2015,
150 ha burned; c: Rhodes, 23 July 2015, 323 ha burned; d: Rhodes, 31 July 2015, 50 ha burned); e: Rhodes, 23 August 2015, 77 ha burned;
and f: Lesvos, 30 August 2015, 550 ha burned).
Nat. Hazards Earth Syst. Sci., 16, 643–661, 2016 www.nat-hazards-earth-syst-sci.net/16/643/2016/
K. Kalabokidis et al.: AEGIS: a wildfire prevention and management information system 657
Figure 11. Second simulation run of Lesvos 2015 wildfire from the site where the first simulation ended (Fig. 9f). Black polygon delimits
the actually burned area, while the colored area and lines map times of arrival and major travel paths in AEGIS.
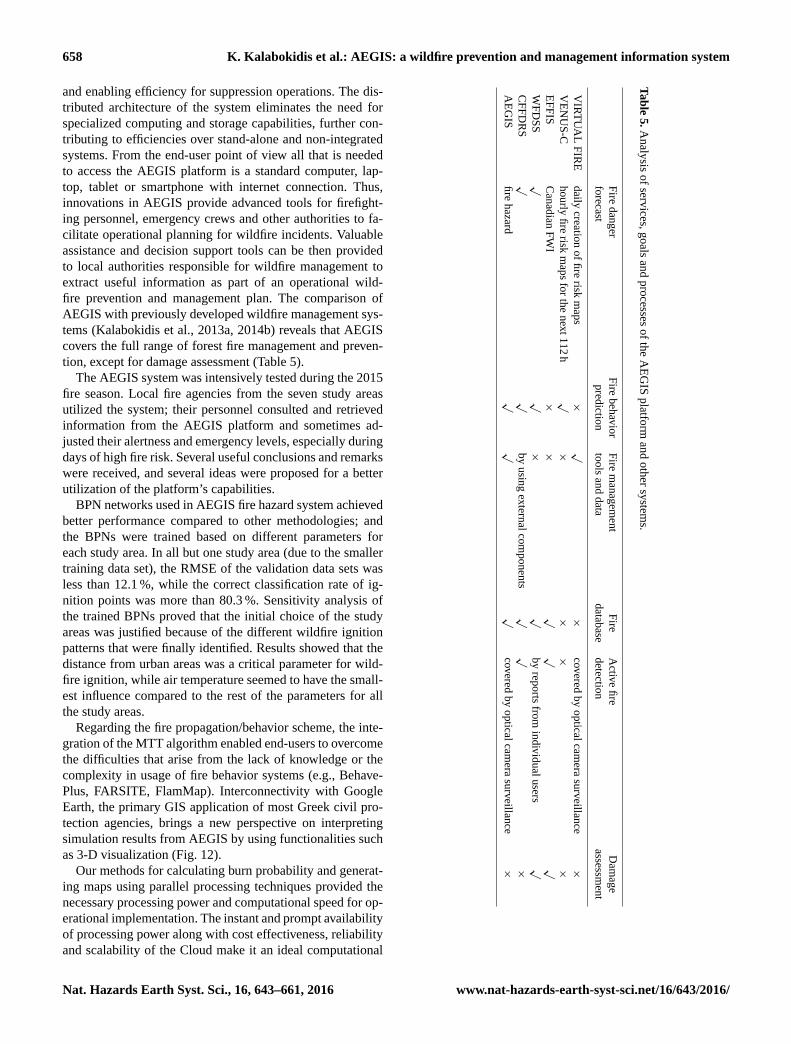
Figure 12. Visualization of travel paths from a wildfire simulation through the AEGIS platform over Google Earth.
www.nat-hazards-earth-syst-sci.net/16/643/2016/ Nat. Hazards Earth Syst. Sci., 16, 643–661, 2016
658 K. Kalabokidis et al.: AEGIS: a wildfire prevention and management information system
and enabling efficiency for suppression operations. The dis-
tributed architecture of the system eliminates the need for
specialized computing and storage capabilities, further con-
tributing to efficiencies over stand-alone and non-integrated
systems. From the end-user point of view all that is needed
to access the AEGIS platform is a standard computer, lap-
top, tablet or smartphone with internet connection. Thus,
innovations in AEGIS provide advanced tools for firefight-
ing personnel, emergency crews and other authorities to fa-
cilitate operational planning for wildfire incidents. Valuable
assistance and decision support tools can be then provided
to local authorities responsible for wildfire management to
extract useful information as part of an operational wild-
fire prevention and management plan. The comparison of
AEGIS with previously developed wildfire management sys-
tems (Kalabokidis et al., 2013a, 2014b) reveals that AEGIS
covers the full range of forest fire management and preven-
tion, except for damage assessment (Table 5).
The AEGIS system was intensively tested during the 2015
fire season. Local fire agencies from the seven study areas
utilized the system; their personnel consulted and retrieved
information from the AEGIS platform and sometimes ad-
justed their alertness and emergency levels, especially during
days of high fire risk. Several useful conclusions and remarks
were received, and several ideas were proposed for a better
utilization of the platform’s capabilities.
BPN networks used in AEGIS fire hazard system achieved
better performance compared to other methodologies; and
the BPNs were trained based on different parameters for
each study area. In all but one study area (due to the smaller
training data set), the RMSE of the validation data sets was
less than 12.1 %, while the correct classification rate of ig-
nition points was more than 80.3 %. Sensitivity analysis of
the trained BPNs proved that the initial choice of the study
areas was justified because of the different wildfire ignition
patterns that were finally identified. Results showed that the
distance from urban areas was a critical parameter for wild-
fire ignition, while air temperature seemed to have the small-
est influence compared to the rest of the parameters for all
the study areas.
Regarding the fire propagation/behavior scheme, the inte-
gration of the MTT algorithm enabled end-users to overcome
the difficulties that arise from the lack of knowledge or the
complexity in usage of fire behavior systems (e.g., Behave-
Plus, FARSITE, FlamMap). Interconnectivity with Google
Earth, the primary GIS application of most Greek civil pro-
tection agencies, brings a new perspective on interpreting
simulation results from AEGIS by using functionalities such
as 3-D visualization (Fig. 12).
Our methods for calculating burn probability and generat-
ing maps using parallel processing techniques provided the
necessary processing power and computational speed for op-
erational implementation. The instant and prompt availability
of processing power along with cost effectiveness, reliability
and scalability of the Cloud make it an ideal computational
Ta
ble
5.
An
alysis
of
services,
go
alsan
dp
rocesses
of
the
AE
GIS
platfo
rman
do
ther
system
s.
Fire
dan
ger
Fire
beh
avio
rF
irem
anag
emen
tF
ireA
ctive
fire
Dam
age
forecast
pred
iction
too
lsan
dd
atad
atabase
detectio
nassessm
ent
VIR
TU
AL
FIR
Ed
ailycreatio
no
ffi
rerisk
map
s×
√×
covered
by
op
ticalcam
erasu
rveillan
ce×
VE
NU
S-C
ho
urly
fire
riskm
aps
for
the
nex
t1
12
h√
××
××
EF
FIS
Can
adian
FW
I×
×√
√√
WF
DS
S√
√×
√b
yrep
orts
from
ind
ivid
ual
users
√
CF
FD
RS
√√
by
usin
gex
ternal
com
po
nen
ts√
√×
AE
GIS
fire
hazard
√√
√co
vered
by
op
ticalcam
erasu
rveillan
ce×
Nat. Hazards Earth Syst. Sci., 16, 643–661, 2016 www.nat-hazards-earth-syst-sci.net/16/643/2016/
K. Kalabokidis et al.: AEGIS: a wildfire prevention and management information system 659
platform for wildfire management problems. By taking ad-
vantage of the Cloud’s ability to increase/decrease the num-
ber of available VMs on demand, end-users will only con-
sume processing resources during the actual wildfires. On-
demand fire simulations are better suited to run locally rather
than in the Cloud. This is because of the significant amount
of time overhead (approximately 15 min) required to allocate
new VMs in Microsoft Azure. On-demand fire behavior sim-
ulations need to be conducted instantly and thus, time over-
heads should be minimized to achieve a timely and effective
response when a wildfire breaks out.
5 Conclusion
The AEGIS system can potentially contribute towards a more
sophisticated knowledge transfer among the various entities
involved in wildfire suppression activities including opera-
tion centers and firefighting units in the field. The system
is designed for wide-scale deployment for the different ge-
ographical areas of Greece or regional countries with mini-
mal effort and resources, providing the development of the
required input databases and services. We demonstrated a
highly scalable implementation of the system that leverages
Cloud Computing and HPC resources, allowing AEGIS to
be applied at the national and regional scale. Moreover the
mobile application, which currently is only implemented in
Windows Phone devices, will eventually be made available
for Android and iPhone devices, as well. Future updates of
the AEGIS will provide end-users with the ability to perform
simulations from their smartphones, and visualize the results
of the fire behavior directly in their mobile device. Future
work will also include validation of the fire perimeters (actual
vs. simulated ones produced by MTT), as well as the integra-
tion of the Fire Ranking and Effects Index (FIRE Index) for
the evaluation of fire effects (Kalabokidis et al., 2014c). Fur-
ther research plans include the utilization of different open
source Cloud solutions (e.g., OpenStack, promoted by the
OpenStack Foundation) for the calculation of spatial fire haz-
ard and fire behavior modeling, and the utilization of open-
source Web-GIS solutions (e.g., Geoserver) for the manipu-
lation of geo-processing and mapping services.
Acknowledgements. The research project “AEGIS: Wildfire
Prevention and Management Information System” (Code Num-
ber 1862) is implemented within the framework of the Action
ARISTEIA of the Operational Program “Education and Lifelong
Learning” (Action’s Beneficiary: General Secretariat for Research
and Technology), and is co-financed by the European Union
(European Social Fund) and the Greek State. We also thank our
entire research team for making this research project possible and
Michelle Day for editorial assistance, along with reviewers for their
comments.
Edited by: T. Glade
Reviewed by: M. Mergili and one anonymous referee
References
Abatzoglou, J. T. and Kolden, C. A.: Relationships between climate
and macroscale area burned in the western United States, Int. J.
Wildland Fire, 22, 1003–1020, 2013.
Ager, A. A., Finney, M. A., Kerns, B. K., and Maffei, H.: Modeling
wildfire risk to northern spotted owl (Strix occidentalis caurina)
habitat in Central Oregon, USA, Forest Ecol. Manag., 246, 45–
56, 2007.
Ager, A. A., Vaillant, N. M., and Finney, M. A.: Integrating fire
behavior models and geospatial analysis for wildland fire risk
assessment and fuel management planning, J. Combust., 19,
572452, doi:10.1155/2011/572452, 2011.
Ager, A. A., N. M. Vaillant, M. A. Finney, and H. K. Preisler:
Analyzing wildfire exposure and source–sink relationships on a
fire prone forest landscape, Forest Ecol. Manag., 267, 271–283,
2012.
Ager, A. A., Day, M. A., Finney, M. A., Vance-Borland, K., and
Vaillant, N. M.: Analyzing the transmission of wildfire exposure
on a fire-prone landscape in Oregon, USA, Forest Ecol. Manag.,
334, 337–390, 2014.
Alcasena, F. J., Salis, M., Ager, A. A., Arca, B., Molina, D.,
and Spano, D.: Assessing landscape scale wildfire exposure for
highly valued resources in a Mediterranean area, Environ. Man-
age., 55, 1200–1216, 2015.
Alonso-Betanzos, A., Fontenla-Romero, O., Guijarro-Berdiñas,
B., Hernández-Pereira, E., Inmaculada Paz Andrade, M. A.,
Jiménez, E., Luis Legido Soto, J., and Carballas, T.: An intel-
ligent system for forest fire risk prediction and fire fighting man-
agement in Galicia, Expert. Syst. Appl., 25, 545–554, 2003.
Athanasis, N., Kalloniatis, C., Vaitis, M., Vasilakos, C., and Kal-
abokidis, K.: Building an innovative solution for wildfire preven-
tion and management: the “AEGIS” platform, in: EMCIS 2015:
12th European Mediterranean & Middle Eastern Conference on
Information Systems, Athens, Greece, 1–16, 2015a.
Athanasis, N., Karagiannis, F., Palaiologou, P., Vasilakos, C., and
Kalabokidis, K.: AEGIS App: Wildfire Information Management
for Windows Phone Devices, Proced. Comput. Sci., 56, 544–549,
2015b.
Attiwill, P. and Binkley, D.: Exploring the mega-fire reality: A “For-
est Ecol. Manag.” conference, Forest Ecol. Manag., 294, 1–3,
2013.
Burgan, R. E.: Revisions to the 1978 National Fire-Danger Rating
System, USDA, Research Paper SE-273, Southeastern Forest Ex-
periment Station, Asheville, NC, USA, 39 pp., 1988.
Caballero, D.: FOMFIS: A computer-based system for forest fire
prevention planning, in: 3rd International Conference on Forest
Fire Research, edited by: Viegas, D. X., ADAI, 16–20 November
1998, Luso, Portugal, 2643–2652, 1998.
Calkin, D. E., Thompson, M. P., Finney, M. A., and Hyde, K. D.:
A Real-Time Risk Assessment Tool Supporting Wildland Fire
Decisionmaking, J. Forest., 109, 274–280, 2011.
Corgnati, L., Gabella, M., and Perona, G.: FIREcast system-
previsional fire danger index computation system for alpine re-
gions, in: First International Conference on Modelling, Monitor-
ing and Management of Forest Fires (FIVA 2008), edited by:
Heras, J., Brebbia, C., Viegas, D., and Leone, V., WIT Press,
Toledo, Spain, 71–80, 2008.
Cruz, M. G., Sullivan, A. L., Gould, J. S., Sims, N. C., Bannister, A.
J., Hollis, J. J., and Hurley, R. J.: Anatomy of a catastrophic wild-
www.nat-hazards-earth-syst-sci.net/16/643/2016/ Nat. Hazards Earth Syst. Sci., 16, 643–661, 2016
660 K. Kalabokidis et al.: AEGIS: a wildfire prevention and management information system
fire: The Black Saturday Kilmore East fire in Victoria, Australia,
Forest Ecol. Manag., 284, 269–285, 2012.
EEA: Corine land cover update 2000 – Technical guidelines,
Copenhagen, 56 pp., 2002.
Figueras Jové, J., Fonseca i Casas, P., Guasch Petit, A., and
Casanovas, J.: FireFight: A Decision Support System for Forest
Fire Containment, in: Improving Disaster Resilience and Mitiga-
tion – IT Means and Tools, NATO Science for Peace and Security
Series C: Environmental Security, edited by: Teodorescu, H.-N.,
Kirschenbaum, A., Cojocaru, S., and Bruderlein, C., Springer,
the Netherlands, 293–305, 2014.
Finney, M. A.: FARSITE: Fire area simulator-model development
and evaluation. Res. Pap. RMRSRP-4, USDA Forest Service,
Rocky Mountain Research Station, Ogden, UT, 1998.
Finney, M. A.: Design of Regular Landscape Fuel Treatment Pat-
terns for Modifying Fire Growth and Behavior, Forest Sci., 47,
219–228, 2001.
Finney, M. A.: Fire growth using minimum travel time methods,
Can. J. Forest Res., 32, 1420–1424, 2002.
Finney, M. A.: An overview of FlamMap fire modeling capabilities,
in: Fuels Management – How to Measure Success, edited by:
Andrews, P. L. and Butler, B. W., USDA Forest Service, Rocky
Mountain Research Station, 28–30 March 2006, Portland, OR,
213–220, 2006.
Finney, M. A., Grenfell, I. C., McHugh, C. W., Seli, R. C.,
Trethewey, D., Stratton, R. D., and Brittain, S.: A method for
ensemble wildland fire simulation, Environ. Model. Assess., 16,
153–167, 2011a.
Finney, M. A., McHugh, C. W., Grenfell, I. C., Riley, K. L., and
Short, K. C.: A simulation of probabilistic wildfire risk compo-
nents for the continental United States, Stoch. Env. Res. Risk A.,
25, 973–1000, 2011b.
Forestry Canada Fire Danger Group: Development and structure of
the Canadian Forest Fire Behavior Prediction System, Informa-
tion Report ST-X-3, Forestry Canada, Ottawa, Ontario, 64 pp.,
1992.
Gebert, K. M., Calkin, D. E., and Yoder, J.: Estimating Suppression
Expenditures for Individual Large Wildland Fires, West. J. Appl.
For., 22, 188–196, 2007.
Gumusay, M. U. and Sahin, K.: Visualization of forest fires interac-
tively on the internet, Sci. Res. Essays, 4, 1163–1174, 2009.
Iliadis, L. S.: A decision support system applying an integrated
fuzzy model for long-term forest fire risk estimation, Environ.
Modell. Softw., 20, 613–621, 2005.
Janjic, Z. I.: The Step-Mountain Eta Coordinate Model: Further De-
velopments of the Convection, Viscous Sublayer, and Turbulence
Closure Schemes, Mon. Weather Rev., 122, 927–945, 1994.
Kalabokidis, K.: Automated forest fire and flood hazard protection
system. Disaster management: linking people and the environ-
ment, Geoinformatics, 7, 14–17, 2004.
Kalabokidis, K., Xanthopoulos, G., Moore, P., Caballero, D., Kal-
los, G., Llorens, J., Roussou, O., and Vasilakos, C.: Decision sup-
port system for forest fire protection in the Euro-Mediterranean
region, Eur. J. Forest Res., 131, 597–608, 2012.
Kalabokidis, K., Athanasis, N., Gagliardi, F., Karayiannis, F.,
Palaiologou, P., Parastatidis, S., and Vasilakos, C.: Virtual Fire:
A web-based GIS platform for forest fire control, Ecol. Inform.,
16, 62–69, 2013a.
Kalabokidis, K., Athanasis, N., Vasilakos, C., and Palaiologou, P.:
Cloud Computing in Geospatial Analysis of Wildfire Danger and
Fire Growth, in: 4th Fire Behavior and Fuels Conference “At the
Crossroads: Looking Toward the Future in a Changing Environ-
ment”, edited by: Wade, D. D. and Fox, R. L., 1–4 July 2013,
International Association of Wildland Fire, St. Petersburg, Rus-
sia, 457–467, 2013b.
Kalabokidis, K., Palaiologou, P., and Finney, M. A.: Fire Behavior
Simulation in Mediterranean Forests Using the Minimum Travel
Time Algorithm, in: 4th Fire Behavior and Fuels Conference “At
the Crossroads: Looking Toward the Future in a Changing Envi-
ronment”, edited by: Wade, D. D. and Fox, R. L., 1–4 July 2013,
International Association of Wildland Fire, St. Petersburg, Rus-
sia, 468–492, 2013c.
Kalabokidis, K., Athanasis, N., Palaiologou, P., Vasilakos, M.,
Finney, M. A., and Ager, A. A.: Minimum travel time algorithm
for fire behavior and burn probability in a parallel computing en-
vironment, in: 7th International Conference on Forest Fire Re-
search, Advances in Forest Fire Research, edited by: Viegas, D.
X., 17–20 November 2014, Coimbra University Press, Coimbra,
Portugal, 882–891, 2014a.
Kalabokidis, K., Athanasis, N., Vasilakos, C., and Palaiologou, P.:
Porting of a wildfire risk and fire spread application into a cloud
computing environment, Int. J. Geogr. Inf. Sci., 28, 541–552,
2014b.
Kalabokidis, K., Palaiologou, P., and Athanasis, N.: A fire effects
index for overall assessment of wildfire events in Greece, in: 7th
International Conference on Forest Fire Research, Advances in
Forest Fire Research, edited by: Viegas, D. X., 17–20 November
2014, Imprensa da Universidade de Coimbra, Coimbra, Portugal,
1600–1614, 2014c.
Kalabokidis, K., Palaiologou, P., Gerasopoulos, E., Giannakopou-
los, C., Kostopoulou, E., and Zerefos, C.: Effect of Climate
Change Projections on Forest Fire Behavior and Values-at-Risk
in Southwestern Greece, Forests, 6, 2214–2240, 2015.
Kallos, G., Nickovic, S., Papadopoulos, A., Jovic, D., Kakaliagou,
O., Misirlis, N., Boukas, L., Mimikou, N., Sakellaridis, G., and
Papageorgiou, J.: The regional weather forecasting system SK-
IRON: An overview, in: International Symposium on Regional
Weather Prediction on Parallel Computer Environments, 15–17
October 1997, Athens, Greece, 109–122, 1997.
Kaloudis, S., Costopoulou, C. I., Lorentzos, N. A., Sideridis, A. B.,
and Karteris, M.: Design of forest management planning DSS for
wildfire risk reduction, Ecol. Inform., 3, 122–133, 2008.
Knight, I. and Coleman J.: A fire perimeter expansion algorithm
based on Huygens’ wavelet propagation, Int. J. Wildland Fire, 3.
73–84, 1993.
Kohonen, T.: Self-organized formation of topologically correct fea-
ture maps, Biol. Cybern., 43, 59–69, 1982.
Lee, B. S., Alexander, M. E., Hawkes, B. C., Lynham, T. J., Stocks,
B. J., and Englefield, P.: Information systems in support of wild-
land fire management decision making in Canada, Comput. Elec-
tron. Agr., 37, 185–198, 2002.
Losso, A., Corgnati, L., Bertoldo, S., Allegretti, M., Notarpietro,
R., and Perona, G.: SIRIO: an integrated forest fire monitoring,
detection and decision support system–performance and results
of the installation in Sanremo (Italy), in: Modelling, Monitoring
and Management of Forest Fires III, edited by: Perona, G. and
Nat. Hazards Earth Syst. Sci., 16, 643–661, 2016 www.nat-hazards-earth-syst-sci.net/16/643/2016/
K. Kalabokidis et al.: AEGIS: a wildfire prevention and management information system 661
Brebbia, C. A., WIT Transactions on Ecology and The Environ-
ment, Southhampton, UK, 79–90, 2012.
McDaniel, J.: When things get busy: FSPro and RAVAR,
http://www.wildfirelessons.net/HigherLogic/System/
DownloadDocumentFile.ashx?DocumentFileKey=
a49c24cd-9f62-465f-a569-f2eb22dda953, last access: 24
January 2016.
McHugh, C. W.: Considerations in the use of models available for
fuel treatment analysis, in: Fuels Management-How to Measure
Success, edited by: Andrews, P. L. and Butler, B. W., Proceedings
RMRS-P-41. USDA, Forest Service, Rocky Mountain Research
Station, Fort Collins, CO, 81–105, 2006.
Miller, C. and Ager, A. A.: A review of recent advances in risk
analysis for wildfire management, Int. J. Wildland Fire, 22, 1–
14, 2013.
Noonan-Wright, E. K., Opperman, T. S., Finney, M. A., Zimmer-
man, G. T., Seli, R. C., Elenz, L. M., Calkin, D. E., and Fiedler,
J. R.: Developing the US Wildland Fire Decision Support Sys-
tem, J. Combust., 14, 168473, doi:10.1155/2011/168473, 2011.
Palaiologou, P., Kalabokidis, K., and Kyriakidis, P.: Forest map-
ping by geoinformatics for landscape fire behaviour modelling
in coastal forests, Greece, Int. J. Remote Sens., 34, 4466–4490,
2013.
Peterson, S. H., Morais, M. E., Carlson, J. M., Dennison, P. E.,
Roberts, D. A., Moritz, M. A., and Weise, D. R.: Using HFire for
spatial modeling of fire in shrublands, Research Paper PSW-RP-
259, USDA Forest Service, Pacific Southwest Research Station,
Albany, CA, 44 pp., 2009.
Prechelt, L.: Early Stopping – But When?, in: Neural Networks:
Tricks of the Trade, Lecture Notes in Computer Science, edited
by: Orr, G. and Müller, K.-R., Springer, Berlin, Heidelberg, 55–
69, 1998.
Rumelhart, D., Hinton, G., and Williams, R.: Learning representa-
tions by back-propagating errors, Nature, 323, 533–538, 1986.
Salis, M., Ager, A., Arca, B., Finney, M. A., Bacciu, V., Duce, P.,
and Spano, D: Assessing exposure of human and ecological val-
ues to wildfire in Sardinia, Italy, Int. J. Wildland Fire, 22, 549–
565, 2013.
Salis, M., Ager, A. A., Alcasena, F. J., Arca, B., Finney, M. A. Pel-
lizzaro, G., and Spano, D: Analyzing seasonal patterns of wildfire
exposure factors in Sardinia, Italy, Environ. Monit. Assess., 187,
1–20, 2015.
San-Miguel-Ayanz, J., Barbosa, P., Schmuck, G., Liberta, G., and
Schulte, E.: Towards a coherent forest fire information system in
Europe: the European Forest Fire Information System (EFFIS),
in: IV International Conference on Forest Fire Research, edited
by: Viegas, D., 18–23 November 2002, Millpress Science Pub-
lishers, Luso, Coimbra, Portugal, 5–16, 2002.
Scott, J. H., Thompson, M. P., and Calkin, D. E.: A wildfire risk
assessment framework for land and resource management. Gen-
eral Technical Report RMRS-GTR-315, USDA, Forest Service,
Rocky Mountain Research Station, Fort Collins, CO, 83 pp.,
2013.
Stratton, R. D.: Guidance on spatial wildland fire analysis: models,
tools, and techniques. General Technical Report RMRS-GTR-
183, USDA, Forest Service, Rocky Mountain Research Station,
Fort Collins, CO, 15 pp., 2006.
Taylor, S. W., Pike, R., and Alexander, M. E. (Eds.): Field guide
to the Canadian Forest Fire Behavior Prediction (FBP) System
(BINDER), Natural Resources, Canada, Canadian Forest Ser-
vice, Northern Forestry Centre, Edmonton, AB, 1997.
Tsekouras, G. E., Manousakis, A., Vasilakos, C., and Kalabokidis,
K.: Improving the effect of fuzzy clustering on RBF network’s
performance in terms of particle swarm optimization, Adv. Eng.
Softw., 82, 25–37, 2015.
Vakalis, D., Sarimveis, H., Kiranoudis, C., Alexandridis, A., and
Bafas, G.: A GIS based operational system for wildland fire crisis
management I. Mathematical modelling and simulation, Appl.
Math. Model., 28, 389–410, 2004.
Van Wagner, C. E.: Development and structure of the Canadian
Forest Fire Weather Index System, Forest Technical Report 35,
Canadian Forest Service, Ottawa, Ontario, 35 pp., 1987.
Vasilakos, C., Kalabokidis, K., Hatzopoulos, J., Kallos, G., and
Matsinos, Y.: Integrating new methods and tools in fire danger
rating, Int. J. Wildland Fire, 16, 306–316, 2007.
Vasilakos, C., Kalabokidis, K., Hatzopoulos, J., and Matsinos, I.:
Identifying wildland fire ignition factors through sensitivity anal-
ysis of a neural network, Nat. Hazards, 50, 125–143, 2009.
Viney, N. R: A review of fine fuel moisture modelling. Int. J. Wild-
land Fire, 1, 215–234, 1991.
Williams, J.: Exploring the onset of high-impact mega-fires through
a forest land management prism, Forest Ecol. Manag., 294, 4–10,
2013.
Zachariassen, J., Zeller, K. F., Nikolov, N., and McClelland, T.: A
review of the Forest Service Remote Automated Weather Station
(RAWS) network, General Technical Report RMRS-GTR-119,
USDA Forest Service, Rocky Mountain Research Station, Fort
Collins, CO, 153 pp., 2003.
www.nat-hazards-earth-syst-sci.net/16/643/2016/ Nat. Hazards Earth Syst. Sci., 16, 643–661, 2016
Recommended