Lester A.Cano
CS 589
The authors introduce the various threats (swimmers, divers, boats, ships) and the difficulty of detecting these threats using land based techniques (radars, satellites, magnetometers, thermal sensors, etc..)
They propose a new approach using a wireless sensor network system with detectors stationed on buoys to measure ship generated waves.
The authors used a three axis accelerometer sensors with an iMote2 detection network to capture and relay data. Using spatial and temporal correlations the authors were able to exploit these characteristics in field trials to develop a detection algorithm.
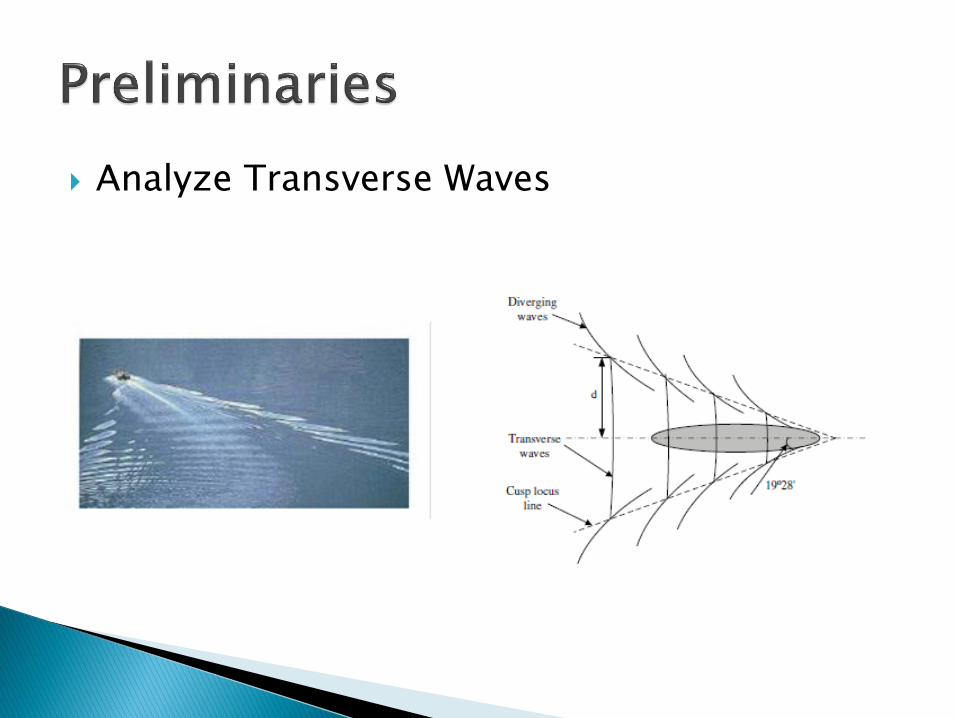
Analyze Transverse Waves

As the transverse ship waves decay their height can be calculated using the following formula:
Maximum wave height Hm at distance d from the sailing line can be expressed as the following equation:
c is a parameter related to the speed of the passing ship

As ship waves attenuate to background wave level as the waves travel sailing path, and the speed of the ship-wave Wv can be predicted by the following equation:
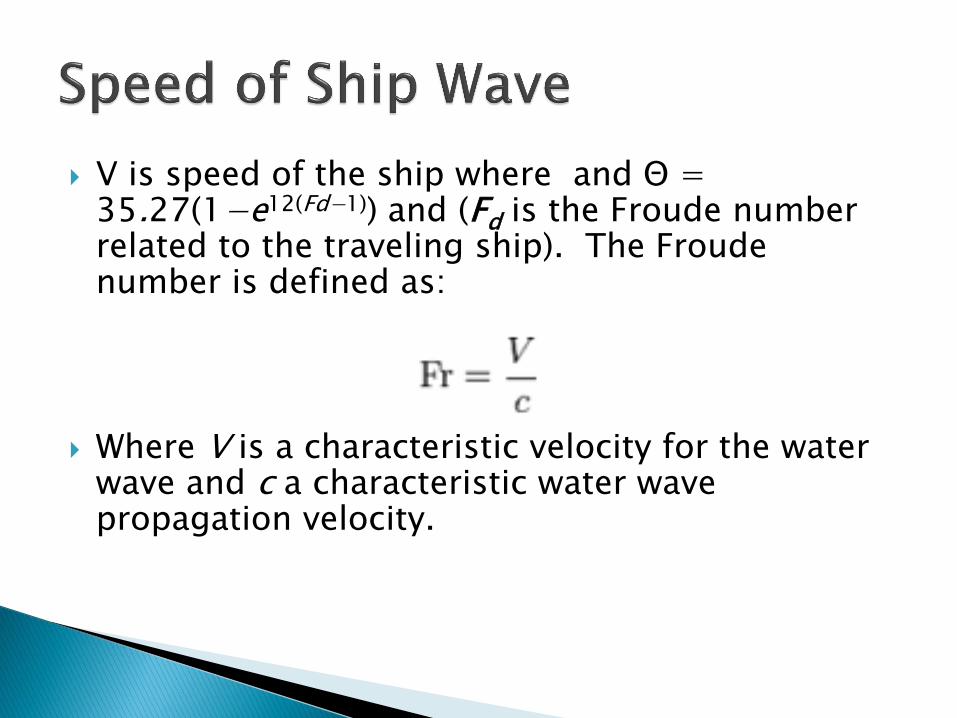
V is speed of the ship where and Θ = 35.27(1−e12(Fd−1)) and (Fd is the Froude number related to the traveling ship). The Froude number is defined as:
Where V is a characteristic velocity for the water wave and c a characteristic water wave propagation velocity.

iMote2 with accelerometer (sampling at 50Hz) and Buoy
The Basic Sensor Board contains a three axis ST Micro LIS3L02DQ accelerometer, an advanced temperature/ humidity sensor, a light sensor and a 4 channel A/D converter.
The accelerometer has a range of +/-2g with12 bit resolution
The sensor node is mounted into a bottle is then fixed the bottle on a buoy

By focusing on the Z axis of the Accelerometer signal the authors were able to determine distinct signatures for ocean waves and ship waves.

Ship waves and ocean waves have a different energy spectrum
Ocean wave without ship waves has a high single peak concentration
Ocean waves combining with ship waves has multiple peaks and wide crests without distinct peaks
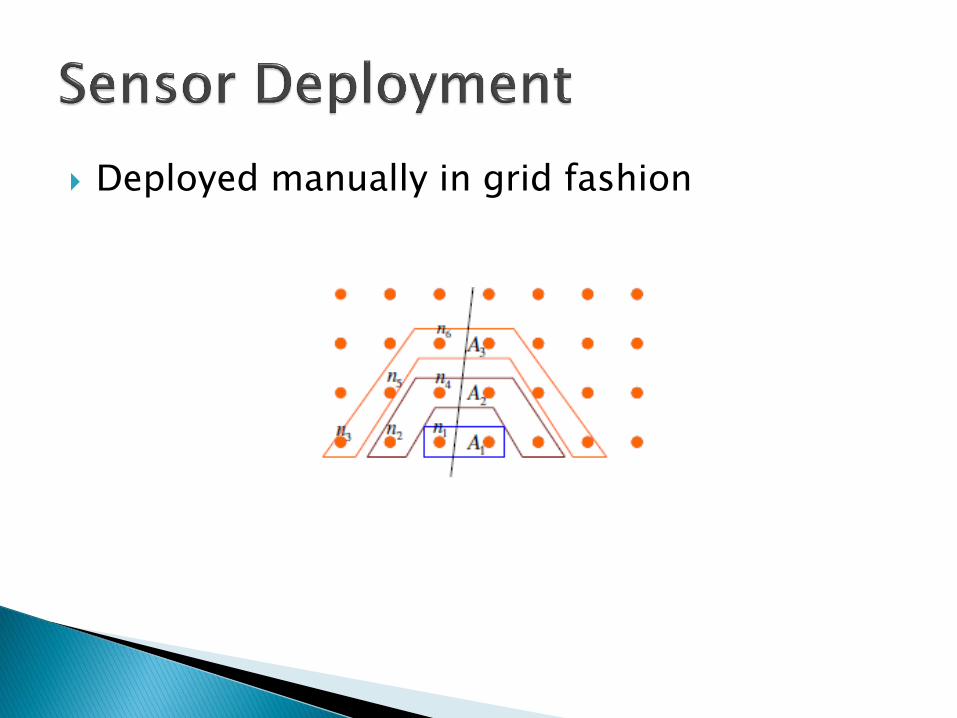
Deployed manually in grid fashion
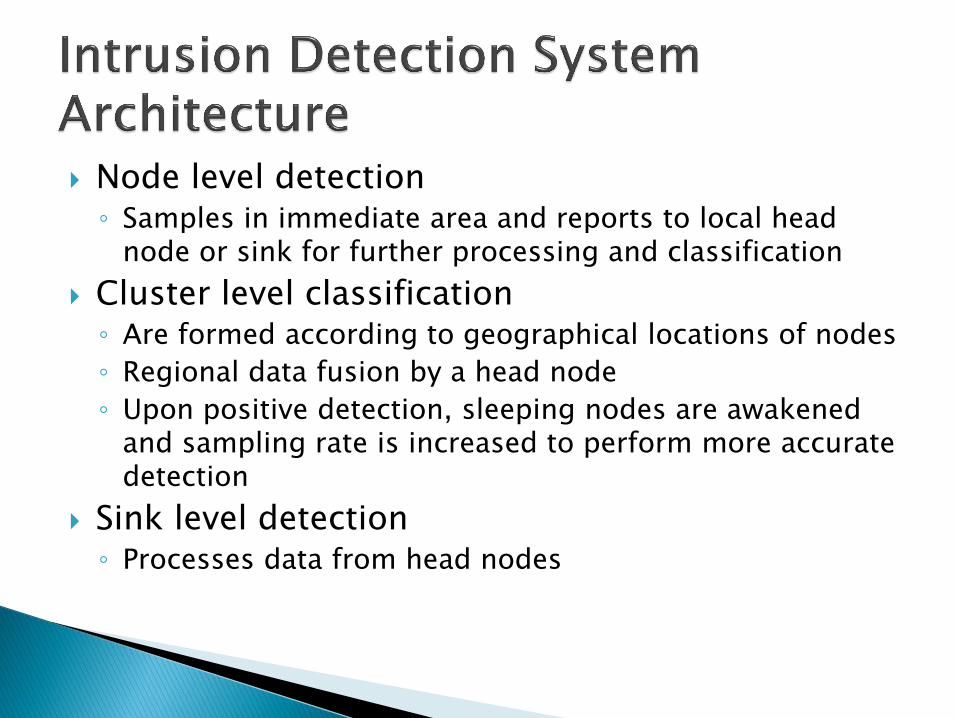
Node level detection ◦ Samples in immediate area and reports to local head
node or sink for further processing and classification
Cluster level classification ◦ Are formed according to geographical locations of nodes
◦ Regional data fusion by a head node
◦ Upon positive detection, sleeping nodes are awakened and sampling rate is increased to perform more accurate detection
Sink level detection ◦ Processes data from head nodes
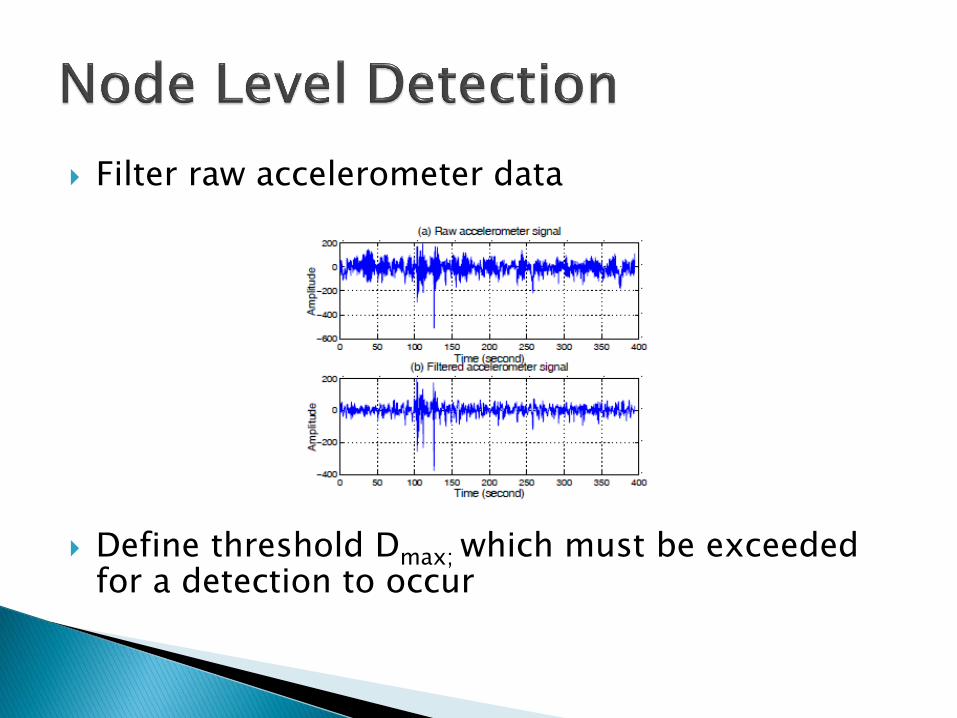
Filter raw accelerometer data
Define threshold Dmax; which must be exceeded for a detection to occur
Validate and verify individual node detections.
This avoids false positives by confirming that nearby nodes are also being disturbed and detecting ship movement.
Spatial and temporal correlations are calculated by validating the continuous disturbance of successive small areas
A Correlation coefficient which measures the spatial and temporal correlations in a cluster is defined as follows:
if C is greater than a threshold the collected node data is considered to have a correlation. This correlation is reported to the cluster head and eventually to the sink
Can also determine ship velocity
As the anomaly frequency af increases for lower threshold measurements (indicative of individual node detection, the successful detection ratio tops at ~ 0.5.
As the threshold increases along with the number of nodes detecting movement (indicative of cluster detection) the false alarms decreases significantly and as af increases so does the successful detection ratio.

Design Parameters ◦ Number or Nodes tested ◦ Cost per node ◦ Tradeoffs considered during design
Communications Power Network Node States
Note: The paper is generally well written, the authors are from Universities in
China, so any grammatical mistakes can be attributed less than ideal technical writing support. The authors provide a good overview of the problem and their approach for SID is novel and provides useful information for detection and
assessment in the water.
Alternate Power Sources ◦ Other then batteries, i.e. solar? ◦ Power consumption for various states of the sensor
Amount and type of memory Whether iMote2 onboard sensors provided any useful
information ◦ Temperature, humidity, light sensors
Could IMote2 be modeled in a simulation (using SENSE)? Could x , y accelerometer motion provide useful data? ◦ Size, Displacement
Note: The authors discuss the iMote2 as their primary sensing and communications device but provide
little data on how the device is configured for use.
Note: The power requirements for the system are nominally discussed. It appears that the iMote2 uses three AA batteries. Power management is discussed but not explained in any detail. Since SID depends heavily on cluster detection of ships moving in the area, this would probably affect the number of nodes which could be sleeping, especially if the time to wake them up is on the order of the ship moving through the area.
Different states of the system ◦ Energy costs for Idle / Sleep / TX /RX states
Carrier frequency and bands
TX and RX power and efficiency
BER and SINR (if measured)
Note: The authors did not provide much detail on how communications was
instantiated for the detection system, other than the fact this is multi-hop system and the head node must be able to communicate with the nodes in its cluster

WSN Protocol used ◦ MAC Protocols:
Fixed (TDMA), Demand (HIPERLAN/2), Random Access (CSMA/CD/CA) Performance
Throughput, stability, low overhead…
TX ranges and data rates ◦ Potential Hidden /Exposed station problems
Protocol stack used Security services available an instantiated.
◦ What layer of protocol stack was security available in.
Dominant type of data traffic ◦ Periodic, Intermittent, and / or Repetitive low-latency
Note: The authors appeared to have deployed a combined cluster star topology, with individual nodes in a cluster reporting to a head node which collects data for re-transmittal to a sink.

Probability of Assessment (PA) - the likelihood of assessing an adversary within the zone covered by an intrusion detection sensor
Probability of Sensing (PS) - probability that an intrusion detection sensor will sense an unauthorized action
Probability of Communication (PC) - probability that an intrusion detection network will communicate an unauthorized action
Probability of Detection (PD) = PS * Pc - the likelihood of detecting an adversary within the zone covered by an intrusion detection sensor

Probability of Assessed Detection (PAD) = PA * PD
Probability of Neutralization (PN) - the likelihood of rendering ineffective or stopping the actions of an adversary
Probability of Interruption (PI) - the likelihood of stopping the progress of an adversary
Probability of Effectiveness (PE) = PI * PN
Note: Provided as an alternate means of measuring system performance

Observe the overall system as a whole ◦ What are the tradeoffs being made to optimize the
system?
Cost vs. Performance?
Hardware vs. Software?
Application vs. Network?
Decide how much you want to pay for lunch and design the overall system from that perspective.
Understand what you gain as well as what you give up

Incentive ◦ For Development – Innovation, Increased
Production, Increased Performances
Process ◦ Design, Installation, Maintenance
Mechanism ◦ System Instantiation and Maintenance
Assurance ◦ Performance, Meets Requirements, Maintenance
Recommended