Noise and Vibration
CN—Control—EJ&E July 2008 Draft Environmental Impact Statement 4.10-1
4.10 Noise and Vibration Residents of communities adjacent to the EJ&E corridor expressed concern regarding potential increases in noise associated with passing trains and locomotive horns. Some residents also expressed concern about potential increases in vibration from increased train traffic on the EJ&E rail line because of the Proposed Action. In response, SEA evaluated potential noise and vibration effects from the Proposed Action and associated construction activities. Section 4.10.1 discusses noise and Section 4.10.2 discusses vibration. Refer to Section 3.10 for definitions of acoustical and vibration terms used in the following sections. The following is a summary of the findings presented in this section:
• SEA used several models to assess potential changes in train noise associated with the Proposed Action. Because of these analyses, SEA concluded that 2,996 noise-sensitive receptors, located adjacent to 12 of the 14 EJ&E segments, would experience an Ldn of 65 dBA or greater. SEA also determined that the number of noise-sensitive receptors would decrease in all of the CN rail line segments; these are benefits associated with the Proposed Action. The total number of benefited noise-sensitive receptors associated with the Proposed Action is 2,738. The net effect of noise associated with the Proposed Action would be an increase of 258 noise-sensitive receptors that would experience an Ldn of 65 dBA or greater.
• SEA also determined that 1,559 noise-sensitive receptors would experience an Ldn of 70 dBA or greater along seven segments of the EJ&E rail line.
• Construction associated with the Proposed Action would also generate noise, but construction noise effects would be temporary and localized around the connections and double track. [Section 4.10.1]
• The proposed changes in rail operations would not increase vibrations velocity levels in areas adjacent to the EJ&E corridor. SEA determined that 422 vibration-sensitive receptors would experience vibration effects associated with existing conditions and under the Proposed Action. SEA’s analysis also concluded that vibrations from future train operations on the EJ&E rail line would not be sufficient to damage the earthen Prestwick Dam, given that the peak particle velocity level that would be produced by each (existing and future) passing train would be far lower than that required to damage an earthen dam. Vibration along the portion of the EJ&E rail line that shares a property line with Fermi National Accelerator Laboratory would not affect existing operations, but could affect future expansion plans at the laboratory and the placement of highly vibration-sensitive equipment close to the EJ&E property line. Vibration from construction activities associated with the Proposed Action would be low enough to avoid damage to nearby buildings and would be of limited duration. [Section 4.10.2]
4.10.1 Noise
4.10.1.1 Methodology The Board’s environmental regulations at 49 CFR 1105.7(e)(6) require an evaluation of potential noise effects where the Board’s thresholds for environmental analysis of noise effects would be met. Table 4.10-1, below, summarizes the Board’s thresholds for environmental analysis of noise effects.

Noise and Vibration
Draft Environmental Impact Statement July 2008 CN—Control—EJ&E 4.10-2
Table 4.10-1. Thresholds for Noise Effect Assessment
Rail Line Segment Rail traffic increase of 100%, as measured by gross ton-miles annually, or an increase of at least 8 trains per day
Rail Yard 100% increase (measured by carload activity)
Intermodal Facility Increase in truck traffic greater than 10% of average annual daily traffic or 50 trucks per day
In cases that meet or exceed these thresholds, the Board requires noise effect analysis to determine if the Proposed Action would result in:
• An incremental increase in community noise exposure of 3 dBA or more
• An increase to a day-night average sound level (Ldn) of 65 dBA or greater
On previous projects, SEA determined that quantifying noise-sensitive receptors in the existing and Proposed Action 65 dBA Ldn noise contour would satisfy the Board’s requirements to determine noise effects (Board 1998a). Therefore, SEA’s method to determine potential noise effects from the Proposed Action, including both proposed changes in rail line operations on the EJ&E line, and proposed new connections, first identified the EJ&E rail line segments that would experience an increase of three dBA due to the redistribution of train traffic from CN subdivisions. On these segments, SEA quantified the number of noise-sensitive receptors in the existing and Proposed Action 65 dBA Ldn noise contours.
Noise levels in areas where the Ldn is less than 65 decibels are generally not considered adverse to human health and welfare by the scientific community and agencies such as the Federal Aviation Administration (FAA), the Department of Housing and Urban Development (HUD), the Environmental Protection Agency (EPA), and the American National Standards Institute (ANSI). The use of the 65-dBA Ldn noise effect threshold is, therefore, reasonable and protective of human health and welfare.
SEA evaluated the projected changes in average daily train traffic to determine if any EJ&E segments would experience an increased Ldn of 3 dBA or greater. Table 4.10-2 on the next page summarizes this evaluation.

Noise and Vibration
CN—Control—EJ&E July 2008 Draft Environmental Impact Statement 4.10-3
Table 4.10-2. Evaluation of 3dBA Increase Criterion Train Volume EJ&E Rail
Line Segment No.a Existing Condition Proposed Action
Increase in Ldn (dBA)
1 11.8 31.8 4
2 9.8 29.8 5
3 9.7 29.7 5
4 7.6 28.6 6
5 10.2 34.2 5
6 8.6 31.6 6
7 6.4 28.3 6
8 18.5 42.3 4
9 18.5 42.3 4
10 15.7 39.5 4
11 10.7 31.6 5
12 4.4 23.4 7
13 5.5 22.5 6
14 5.3 20.3 6
Notes: a Refers to the 14 EJ&E segments described in Chapter 3, Section 3.1-1 and shown on Figure 3.1-1.
As shown in Table 4.10-1, SEA’s the evaluation shows that 14 rail line segments on the EJ&E line would experience average noise level increases of more than three dBA as a result o the Proposed Action. Sections 4.10.1.2 and 4.10.1.3 present SEA’s analysis undertaken to determine the number of noise-sensitive receptors where those conditions would be met that would be inside the 65-dBA Ldn contour. For its analysis, SEA defined noise-sensitive receptors as areas of human habitation or substantial use where the intrusion of noise has the potential to adversely affect the occupancy, use, or enjoyment of the environment. Such areas include residences, schools, parks, and places of business requiring low levels of noise.
4.10.1.2 No-Action Because no changes in rail traffic would occur, the No-Action alternative would not affect noise levels in the Study Area.
4.10.1.3 Proposed Action
Proposed Changes in Rail Line Operations SEA used several models to assess potential changes in train noise that could be expected because of the Proposed Action: 1) a wayside noise model (to model the noise a train makes when it passes a receiver); 2) a locomotive horn noise model (to evaluate horn noise at highway/rail at-grade crossings); 3) a model for stationary noise such as wheel squeal or noise made when a train rolls over a crossover; and 4) a model for assessing noise from rail yards. These models are discussed in more detail below. SEA ran the models for the 14 EJ&E rail line segments, the six proposed connections, the five CN rail lines in the Study Area, and the rail yards that would be affected by the Proposed Action. The results of the analysis on the new construction are presented in Section 4.10.1.4. SEA also employed GIS and digital, geo-referenced aerial photographs to facilitate noise effect determinations.
Wayside Noise Model. Wayside noise refers to the noise a train makes as it travels along the rail line. Locomotives and rail cars emit wayside noise from different sources and locations. Locomotives create wayside noise from the interaction of steel wheels and steel rails, as well as the

Noise and Vibration
Draft Environmental Impact Statement July 2008 CN—Control—EJ&E 4.10-4
diesel engine and its components (engine casing, exhaust, cooling systems, etc.). Rail cars create wayside noise from the wheel/rail interaction and from rail cars themselves.
SEA created a spreadsheet-based wayside noise evaluation model using equations and guidelines published by FTA (2006). This model uses train size (number of locomotives and rail cars), speed, and daily traffic volume to calculate the distance to the 65-dBA Ldn noise contour. SEA measured train pass-bys in the Study Area to determine the Sound Exposure Level (SEL) associated with locomotive and rail car pass-bys. These SEL values represent the noise emission terms for the two types of vehicles in the wayside noise model (locomotives and rail cars) and for locomotive horns in the Study Area.
The wayside noise model calculates a cumulative Leq (equivalent hourly noise level) at 50 feet, daytime Leq at 50 feet, and nighttime Leq at 50 feet for all three categories of rail traffic that currently or are proposed to operate on the EJ&E rail line and for which traffic data was provided (EJ&E, CN, and other). The results were combined to give an overall Ldn at 50 feet for existing and proposed rail traffic. The three Ldn values are then combined to calculate an overall Ldn at 50 feet. The wayside noise model then calculates the distance to the 65-dBA Ldn noise contour.
SEA’s analysis recognized that buildings can obstruct train noise as it radiates outward from the rail line. This building-induced shielding can result in lower noise levels in areas behind the buildings. Therefore, SEA used Federal Highway Administration (FHWA) methods to quantify the effects of building-induced shielding in the wayside noise model.
Locomotive Horn Noise Model. FRA safety regulations require use of locomotive horns or whistles when trains approach public roadways at-grade (grade crossings) in areas where quiet zones do not exist. SEA used the FRA’s Locomotive Horn Noise Model to determine the location of the 65-dBA Ldn noise contour associated with each highway/rail at-grade crossing in the Study Area not in a quiet zone. Use of site-specific input data,1 either provided by the Applicants or determined by SEA, allowed SEA to create unique noise effect contours for each grade crossing included in this analysis.
Wheel Squeal at Existing Connections. When trains travel over segments of curved rail, the wheel flange interacts with the rail in a manner that can generate a high-pitched noise, called “wheel squeal.” Track lubrication systems minimize wheel squeal; however, this analysis assumed that lubrication systems are not in use in the study area. SEA evaluated wheel squeal using FTA methods.
The CN and EJ&E rail lines currently connect at five locations; however, only one location—Leithton2—would experience an increase in train traffic as a result of the Proposed Action. Therefore, SEA evaluated the number of noise-sensitive receptors within the existing and Proposed Action 65 dBA Ldn noise contour on the Leithton section of curved track. No noise-sensitive receptors are located within the existing 65-dBA Ldn noise contour. This number would increase to 202 noise-sensitive receptors within the Proposed Action 65 dBA Ldn noise contour.
Crossings and Other Special Trackwork. When trains travel over rail/rail at-grade crossings or other special trackwork, the wheels have to roll over a gap in the rail. As the wheels pass over these gaps and reach the rail on the other side of the gap, they produce a noise that is different from normal wheel-rail rolling noise. SEA evaluated noise associated with crossings and other special trackwork using FTA methods. Results of these analyses are included in the tables below that present noise effects on each segment of the EJ&E rail line.
Rail Yards. The Board’s environmental regulations require analysis of noise from rail yards if there would be a 100 percent increase in rail yard activity (cars handled, etc.). The Proposed Action has the
1 Site-specific input data include train speed, amount of shielding provided by adjacent buildings, and non-train noise
environment (urban, suburban, or rural). 2 Leithton is currently configured as a connection between the CN and EJ&E rail lines.

Noise and Vibration
CN—Control—EJ&E July 2008 Draft Environmental Impact Statement 4.10-5
potential to increase rail yard activity at two rail yards: Kirk Yard, in Indiana, from the proposed transaction and East Joliet Yard, in Illinois. SEA evaluated noise associated with rail yards using FTA methods. Table 4.10-3 summarizes the proposed changes in daily rail car handling at these yards.
Table 4.10-3. Summary of Rail Yard Activities Rail Cars Handled per Day
Rail Yard Name Existing Proposed
Net Change
East Joliet Yard 500 1,209 142%
Kirk Yard 685 2,039 198%
As shown in the table, East Joliet Yard and Kirk Yard would experience increases in rail yard activity that meet the Board’s requirements for noise analysis. Therefore, SEA evaluated noise associated with proposed changes at these facilities using FTA methods. Kirk Yard is a hump yard, where locomotives push rail cars up a small incline, and gravity propels them down the other side. The cars roll into the yard to be sorted onto different tracks, where they collide with existing rail cars. In this manner, trains are resorted, and put together again. Wheel retarders, a rail-based braking system that uses friction to slow the rail cars, control the speed at which rail cars descend from the hump and minimize their speed when they collide with stationary rail cars at very low speeds. When in use, wheel retarders emit a loud squeal. The analysis at Kirk Yard included noise from locomotive movements, rail car movements, wheel retarder squeal, car-to-car effects, and car-to-car coupling noise (emitted when trains begin moving from a stationary position). The 65-dBA Ldn contour line that SEA developed based on its analysis was plotted on digital aerial photographs. Analysis results showed no noise-sensitive land uses (residences, schools, parks, and places of business requiring low levels of noise) inside the 65-dBA Ldn contour.
East Joliet Yard is also a car classification yard, but it is not a hump yard. Locomotives will move rail cars around this site, sorting them onto different rail segments. In its analysis, SEA divided the area of the rail yard into four sections, and assumed that the total volume of rail cars handled each day would be distributed evenly across those four areas. Using FTA methods, SEA then calculated the distance to the 65 dBA Ldn noise contours for each area. The outermost contour lines were merged to form a single 65-dBA Ldn noise contour. Analysis results showed no noise-sensitive land uses inside the 65-dBA Ldn contour.
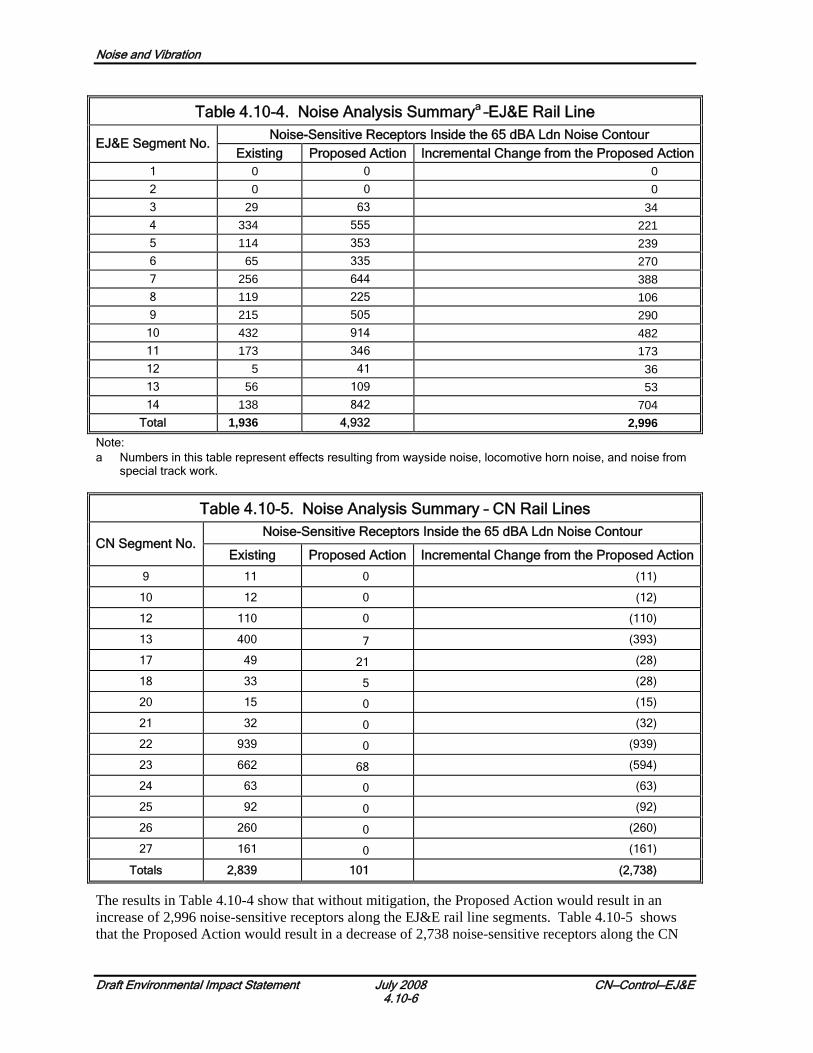
Summary. Table 4.10-4 and Table 4.10-5 on the next page summarize the noise analysis results for the EJ&E and CN rail line segments, respectively, including the number of existing noise-sensitive receptors and the incremental change from the Proposed Action.
Noise and Vibration
Draft Environmental Impact Statement July 2008 CN—Control—EJ&E 4.10-6
Table 4.10-4. Noise Analysis Summarya –EJ&E Rail Line Noise-Sensitive Receptors Inside the 65 dBA Ldn Noise Contour
EJ&E Segment No. Existing Proposed Action Incremental Change from the Proposed Action
1 0 0 0
2 0 0 0
3 29 63 34 4 334 555 221 5 114 353 239 6 65 335 270 7 256 644 388 8 119 225 106 9 215 505 290
10 432 914 482 11 173 346 173 12 5 41 36 13 56 109 53 14 138 842 704
Total 1,936 4,932 2,996 Note: a Numbers in this table represent effects resulting from wayside noise, locomotive horn noise, and noise from
special track work.
Table 4.10-5. Noise Analysis Summary – CN Rail Lines Noise-Sensitive Receptors Inside the 65 dBA Ldn Noise Contour
CN Segment No. Existing Proposed Action Incremental Change from the Proposed Action
9 11 0 (11)
10 12 0 (12)
12 110 0 (110)
13 400 7 (393)
17 49 21 (28)
18 33 5 (28)
20 15 0 (15)
21 32 0 (32)
22 939 0 (939)
23 662 68 (594)
24 63 0 (63)
25 92 0 (92)
26 260 0 (260)
27 161 0 (161)
Totals 2,839 101 (2,738)
The results in Table 4.10-4 show that without mitigation, the Proposed Action would result in an increase of 2,996 noise-sensitive receptors along the EJ&E rail line segments. Table 4.10-5 shows that the Proposed Action would result in a decrease of 2,738 noise-sensitive receptors along the CN

Noise and Vibration
CN—Control—EJ&E July 2008 Draft Environmental Impact Statement 4.10-7
rail segments – a benefit associated with the Proposed Action. The net effect of noise associated with the Proposed Action is an increase of 258 noise-sensitive receptors that are predicted to experience an Ldn of 65 dBA or greater. This increase equates to roughly one additional affected receptor per mile of rail line associated with the Proposed Action. In this context, SEA does not consider the overall increase in the number of receptors affected by noise associated with the Proposed Action to constitute an adverse environmental impact. SEA also recognizes that most of the receptors affected by noise from the Proposed Action are located primarily along the EJ&E rail line.
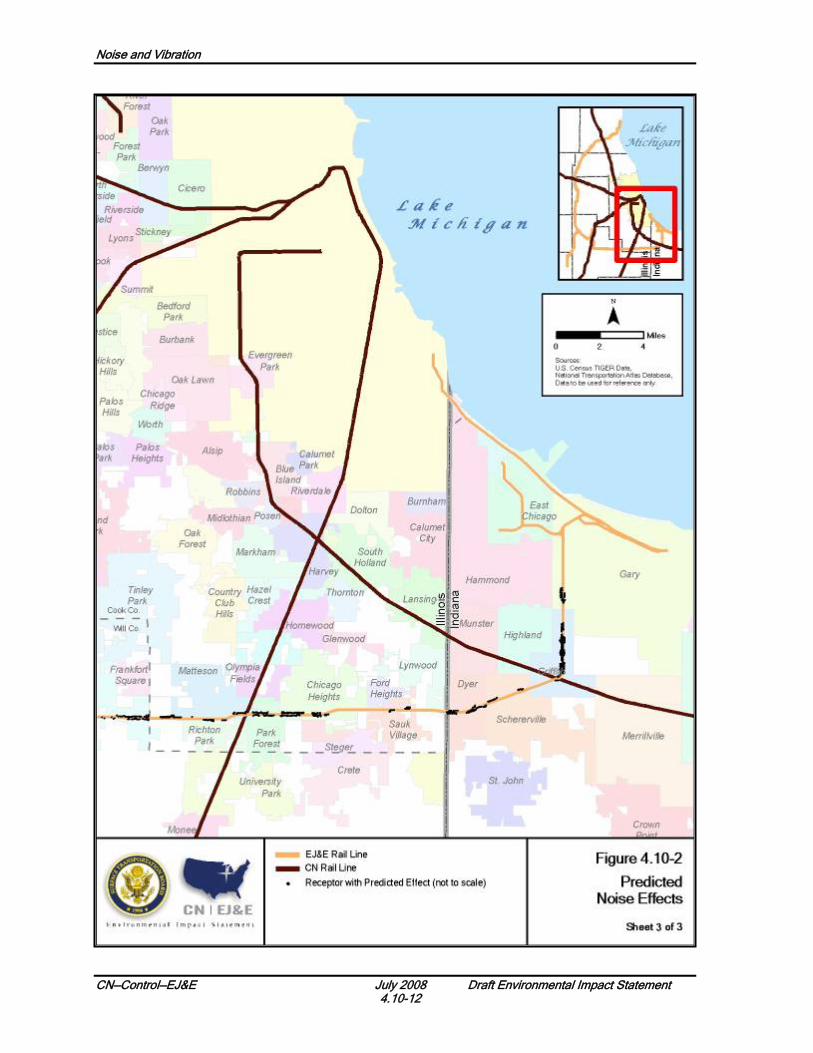
Appendix L presents the noise and vibration contours overlaid upon aerial photographs, including the existing and Proposed Action 65 dBA noise contours. Figure 4.10-1 and Figure 4.10-2 show where noise effects would occur from the Proposed Action.
Quiet Zones. Section 4.1, Rail Operations, above, presents information on quiet zones, including potential effects from the Proposed Action.
Proposed New Construction
Wheel Squeal at the Proposed Construction Sites. Table 4.10-6 below summarizes the noise analysis results for the proposed construction sites, including the number of noise-sensitive receptors that SEA determined would be exposed to an Ldn of 65 dBA or greater.
Table 4.10-6. Noise Analysis Results–Proposed Construction
Construction Site Noise-Sensitive Receptors Inside the 65 dBA Ldn Noise Contour
Leithton Double Tracka (Illinois) 34
No-Build at Munger (Illinois) 0
Proposed Munger Connection (Illinois) 0
Munger Alternative–Original Proposal (Illinois) 0
Munger Alternative–UP Connection (Illinois) 0
Munger Alternative–Northwest Quadrant (Illinois) 0
No-Build at Joliet (Illinois) 0
Proposed Joliet Connection (Illinois) 0
Joliet Alternative–Original Proposal (Illinois) 1
No-Build at Matteson (Illinois) 0
Proposed Matteson Connection (Illinois) 423
Matteson Alternative–Northeast and Southwest Quadrants (Illinois) 212
Matteson Alternative–Southwest Quadrant (Illinois) 142
No-Build at Griffith (Indiana) 0
Proposed Griffith Connection (Indiana) 229
No-Build at Ivanhoe (Indiana) 0
Proposed Ivanhoe Connection (Indiana) 0
No-Build at Kirk Yard (Indiana) 0
Proposed Kirk Yard Connection (Indiana) 0
Total 1,041
Note: a Leithton is the only double track that would be constructed on a curve and accordingly, could be subject to
wheel squeal; therefore, SEA did not evaluate the other double track segments for noise effects from wheel squeal.
Analysis results in Table 4.10-6 above show that the proposed connections would result in an increase in the number of noise-sensitive receptors due to wheel squeal on curved track. The 65-dBA Ldn noise contour is unique and the noise-sensitive receptors identified in Table 4.10-6 are not included in

Noise and Vibration
Draft Environmental Impact Statement July 2008 CN—Control—EJ&E 4.10-8
any other noise contour. The effects of this wheel squeal within the Leithton double track noise contour should be relatively minor because the Leithton double track is in an industrial area.
Double Track. The new segments of double track the Applicants intend to construct if the Proposed Action is approved and implemented would allow longer trains to park on the sidings than the existing sidings allow. Double track and sidings create places for trains to park for short periods; the locomotives idle while the trains occupy the siding. Trains currently park on sidings in the EJ&E corridor, and also occasionally park on the EJ&E main line for short periods. Under the Proposed Action, trains would continue to park in sidings and on the main line. It is not possible to identify which trains would park, where they would park, or for how long. Therefore, for the purposes of this noise analysis, SEA estimated that the average duration a train would be parked is approximately 2.4 hours. SEA performed a Rail Traffic Controller (RTC) analysis that calculated the amount of delay each train would likely incur given the amount of expected train traffic, proposed construction, and meets and passes with opposing trains and at rail/rail interlockings. SEA compared this "impeded" run to an unimpeded run with the amount of delay equal to the difference in running times. Based on this analysis, SEA determined that each train would likely experience a delay of 2.4 hours on their run to and from each end of the EJ&E rail line. SEA also assumed that trains could park anywhere on the EJ&E rail line, at any time of day or night. The Applicants stated that under both existing conditions and the Proposed Action, the average train has two locomotives,
On an idling train, the primary noise sources are the idling locomotives. Using these assumptions, and FTA methods, SEA calculated the distance to the 65-dBA Ldn contour line resulting from two locomotives idling for 2.4 hours per day. SEA plotted these noise contours surrounding the stationary idling locomotives. Next, SEA reviewed the wayside and grade-crossing contours associated with the Proposed Action. SEA determined that the 65-dBA Ldn contour associated with two locomotives idling for 2.4 hours per day lies within the 65-dBA Ldn wayside noise contour at any location on the EJ&E rail lines. Therefore, analysis results showed no new noise-sensitive receptors inside the 65 dBA Ldn contour associated with idling trains (any receptor located within this contour was already included in the wayside noise contour), and no additional noise effects associated with idling locomotives.
Construction Noise. The Applicants propose to modify portions of the EJ&E rail line, therefore construction activities could likely occur at different times and in different locations throughout the Study Area. Construction activities often generate noise and sometimes ground-borne vibration, however these emissions vary greatly depending upon the duration and complexity of the project. Table 4.10-7, following the figures, presents noise levels associated with typical construction equipment, as published by FTA.

Noise and Vibration
CN—Control—EJ&E July 2008 Draft Environmental Impact Statement 4.10-9
Figure 4.10-1. Existing and Proposed Action Noise Effects

Noise and Vibration
CN—Control—EJ&E July 2008 Draft Environmental Impact Statement 4.10-10
Figure 4.10-2. Predicted Noise Effects
Page 1 of 3

Noise and Vibration
CN—Control—EJ&E July 2008 Draft Environmental Impact Statement 4.10-11
Figure 4.10-2. Predicted Noise Effects
Page 2 of 3
Noise and Vibration
CN—Control—EJ&E July 2008 Draft Environmental Impact Statement 4.10-12
Figure 4.10-2. Predicted Noise Effects
Page 3 of 3

Noise and Vibration
CN—Control—EJ&E July 2008 Draft Environmental Impact Statement 4.10-13
Table 4.10-7. Construction Equipment Noise Levels
Equipment Typical Noise Level (dBA) 50 feet from Source
Air compressor 81 Backhoe 80 Ballast equalizer 82 Ballast tamper 83 Compactor 82 Concrete mixer 85 Concrete pump 82 Concrete vibrator 76 Crane, derrick 88 Crane, mobile 83 Dozer 85 Generator 81 Grader 85 Impact wrench 85 Jackhammer 88 Loader 85 Paver 89 Pile-driver (impact) 101 Pile-driver (sonic) 96 Pneumatic tool 85 Pump 76 Rail saw 90 Rock drill 98 Roller 74 Saw 76 Scarifier 83 Scraper 89 Shovel 82 Spike driver 77 Tie cutter 84 Tie handler 80 Tie inserter 85 Truck 88
Source: FTA, May 2006, Transit Noise and Vibration Impact Assessment, FTA-VA-90-1003-06, Federal Transit Administration, Office of Planning and Environment, available online at http://www.fta.dot.gov/documents/FTA_Noise_and_Vibration_Manual.pdf.
SEA assessed noise from potential construction activities as follows. As shown in Table 4.10-7, construction equipment has a wide range of noise levels. It is unlikely that each piece of construction equipment would be used throughout the entire duration of a construction project. Rather, each phase of a construction project may require use of certain pieces of equipment, and some equipment may be unique to that phase. Therefore, each phase of any construction project could have unique noise characteristics. Construction noise effects related to the Proposed Action would be temporary and localized around the connections and double track, and would also typically be subject to local noise ordinances. Best management practices, such as requiring OEM or higher-performing mufflers on equipment and limiting the hours of construction activities to typical weekday business hours can minimize the influence of noise from construction activities.

Noise and Vibration Administratively Confidential
Draft Environmental Impact Statement July 2008 CN—Control—EJ&E 4.10-14
Opportunities to Reduce Potential Noise Effects
The Board’s environmental regulations include noise effect thresholds, but do not include criteria for when to impose noise mitigation measures. On previous projects, including both railroad acquisition cases like the Proposed Action and cases involving the construction of new rail lines, SEA evaluated noise mitigation criteria enacted by other Federal agencies. The purpose of this review was to determine what criteria SEA would use to identify the noise-sensitive receptors predicted to experience the greatest noise effects. SEA reasoned that, with this information, SEA could evaluate this subset of predicted noise-sensitive receptors to assess potential opportunities to reduce noise effects. Based on its evaluation in prior cases, SEA established a two-part criterion of a 5 dBA increase on an Ldn basis and an overall Ldn of 70 dBA or greater for when it would be appropriate to recommend noise mitigation. SEA applied the same two-part criterion to noise-sensitive receptors predicted to experience noise effects due to the Proposed Action.
Specifically, SEA determined which rail segments on the EJ&E rail line would experience an increase of 5 dBA on an Ldn basis because of projected increases in average daily train traffic from the Proposed Action. Decreased train traffic would occur on the CN lines within the Study Area. Because there would thus be no increase in noise on the CN lines as a result of the Proposed Action, there is no need to assess the 70-dBA Ldn contour or to consider noise mitigation. On these EJ&E rail segments, SEA determined the location of the 70 dBA Ldn noise contour associated with the Proposed Action. Then SEA counted the number of noise-sensitive receptors within the contour on the EJ&E rail line segments. SEA did not perform this analysis on the CN segments, because they would experience a project-related benefit—a reduction in noise-sensitive receptors due to reduced average daily train traffic on those segments. Table 4.10-8 below presents the results of this analysis by identifying the number of noise-sensitive receptors within the 70-dBA Ldn contour line that would be adversely affected by noise from the Proposed Action.
Table 4.10-8. Noise-Sensitive Receptors Within the Proposed Action 70 dBA Ldn Contour on the EJ&E Rail Line
EJ&E Segment No. Total Receptors 4 327
5 180
6 134
7 361
12 32
13 91
14 434
Total 1,559
Appendix L presents the noise and vibration contours overlaid upon aerial photographs, including the 70-dBA noise contours. SEA’s review of the distribution of noise-sensitive receptors that would experience an Ldn of 65 dBA or greater due to the Proposed Action determined that some of these noise-sensitive receptors are located in close proximity to one another. Where noise-sensitive receptors are clustered together in this manner, there is potential that a barrier (that is, a noise wall) in the propagation path could potentially abate predicted noise levels. Given that the EJ&E rail line travels through approximately 50 communities, SEA concludes that requiring mitigation for all of the noise-sensitive receptors predicted to experience an Ldn of 70 dBA or greater may unreasonably burden the Applicants. However, SEA considers it appropriate that the Applicants determine where noise walls can provide noise reduction benefits and fulfill the feasibility and reasonability criteria as defined by the Illinois Department of Transportation. Where noise walls can be shown to provide benefits and be both reasonable and feasible, SEA encourages the Applicants to negotiate with the

Noise and Vibration
CN—Control—EJ&E July 2008 Draft Environmental Impact Statement 4.10-15
affected municipalities. Chapter 6 discusses the range of mitigation options available for SEA’s consideration.
4.10.2 Vibration
4.10.2.1 Methodology
Train traffic can vibrate nearby buildings and be intrusive and annoying to occupants. Vibration originates from the train’s steel wheels rolling on steel rails, then is transmitted through the tracks and ground into the foundations of nearby buildings, where it is transmitted into living spaces. Building occupants may experience the results of vibration in several ways, including perceptible vibration of floors, rattling of dishes and other items on shelves, rattling of windows, and a low-frequency rumbling, which is referred to as “ground-borne noise.” Ground-borne noise is usually limited to subway systems, so this analysis focuses on potential impact from ground-borne vibration.
Vibration by even the heaviest freight trains rarely causes structural damage. Even minor cosmetic damage, such as small cracks at the corners of windows, is unlikely from freight trains. Because of this, assessments of potential vibration typically focus on the potential for annoyance of building occupants and interference with vibration-sensitive equipment, such as high-resolution electron microscopes.
Vibration impact assessment generally follows the procedures and criteria outlined in the Federal Transit Administration (FTA) guidance manual (FTA 2006). The Federal Railroad Administration (FRA) guidance manual for high-speed rail projects contains virtually the same guidelines, except for an update to the vibration criteria included in the 2006 version of the FTA manual (FRA 2005). FTA uses vibration decibels (VdB) as the unit of measurement for vibration decibels.
Table 4.10-9 shows the FTA vibration affects thresholds (or criteria) for ground-borne vibration from rail transit systems based on the maximum ground vibration caused by a typical train. The unit of measure is the vibration decibel, or VdB. The vibration affects criteria are different for land uses of differing sensitivities to vibration, and also to account for how often vibration occurs by setting higher thresholds for “infrequent” and “occasional” trains. FTA defines “infrequent” as less than 30 trains per day and “occasional” as between 30 and 70 trains per day. The FTA impact thresholds are 8 VdB higher for infrequent trains and 3 VdB higher for occasional trains.
SEA assessed vibration affects associated with the Proposed Action using a threshold of 72 VdB. As Table 4.10-9 shows, 72 VdB is the maximum acceptable vibration velocity level when frequent train events occur near residences and buildings where people normally sleep.

Noise and Vibration Administratively Confidential
Draft Environmental Impact Statement July 2008 CN—Control—EJ&E 4.10-16
Table 4.10-9. FTA Effect Thresholds for Ground-Borne Vibration, General Impact Assessment
Maximum Ground-Borne Vibrationa (VdB re 1 micro inch/sec)
Land Use Category Frequent Eventsb
Occasional Eventsc
Infrequent Eventsd
Category 1. Buildings where vibration would interfere with interior operations.
65 65 65
Category 2. Residences and buildings where people normally sleep.
72 75 80
Category 3. Institutional land uses with primarily daytime use.
75 78 83
Source: FTA, May 2006, Transit Noise and Vibration Impact Assessment, FTA-VA-90-1003-06, Federal Transit Administration, Office of Planning and Environment, available online at http://www.fta.dot.gov/documents/FTA_Noise_and_Vibration_Manual.pdf.
Notes: a Maximum root mean square (RMS) vibration using an averaging time of 1 second. b Frequent events are defined as more than 70 vibration events per day. c Occasional events are defined as between 30 and 70 events per day. d Infrequent events are defined as fewer than 30 events per day.
4.10.2.2 No-Action Because no changes in rail traffic would occur, the No-Action Alternative would not affect vibration levels in the Study Area.
4.10.2.3 Proposed Action
Proposed Changes in Rail Operations Potential Vibration Effects. As discussed in Section 4.10.2.1 and shown in Table 4.10-9 above, the vibration effect threshold is a maximum level of 72 VdB for residential land uses and 75 VdB for institutional land uses such as schools, churches, and libraries. SEA used the curves in Figure 4.10-3, below, to develop effect distances for areas that are highly vibration-sensitive. The vibration effect criteria discussed above represents overall vibration velocity levels. FTA provides guidance to allow a more detailed assessment of vibration effects using the spectral content or frequency content of vibration events. A useful analogy is sound: there are high and low frequencies of sound and there are high and low frequencies of vibration energy. FTA’s guidance provides a more refined set of vibration effect criteria that are expressed as a curve that compares the frequency of the vibration energy with the overall vibration velocity. FTA presents curves that represent maximum acceptable levels of vibration for numerous land uses of differing vibration sensitivity – from workshops to physics research labs. Figure 4.10-3 presents these curves, called the vibration criteria (VC) curves. SEA’s use of the VC curves allowed a more detailed assessment of vibration effects than is achievable through use of the vibration criteria expressed above using overall VdB thresholds. The VC-E curve represents the maximum recommended vibration velocity level for the most vibration-sensitive land uses, like a physics research lab.

Noise and Vibration
CN—Control—EJ&E July 2008 Draft Environmental Impact Statement 4.10-17
Figure 4.10-3 FTA Criteria for Detailed Vibration Analysis
Source, FTA, May 2006, Transit Noise and Vibration Impact Assessment, FTA-VA-90-1003-06, Federal Transit
Administration, Office of Planning and Environment, available online at http://www.fta.dot.gov/documents/FTA_Noise_and_Vibration_Manual.pdf.
Table 4.10-10, below, shows the predicted effect distances at each of the vibration measurement sites. SEA selected the vibration monitoring sites because it considered them representative of their surroundings. Vibration levels associated with train pass-by events would not be dramatically different between existing conditions and Proposed Action. Therefore, SEA does not anticipate adverse effects due to train-induced ground-borne vibration.
Table 4.10-11, that follows, gives the predicted effect distances for each EJ&E rail line segment. The subsequent Table 4.10-12 lists the predicted effect distances for all sections of special trackwork on the EJ&E rail line. The table includes the milepost of the center of the special trackwork, the effect distance as measured from the centerline of the closest EJ&E track, and longitudinal distance of the effect zone as measured from the centerline of the special trackwork. The term special trackwork refers to portions of rail that have gaps in it. For example, where two rail lines intersect (a crossing frog or crossing diamond) there are gaps in the rail line to allow the wheel flange to cross the intersecting tracks. Because of these gaps, and the way train wheels interact with them, vibration levels associated with train wheels moving over the crossing diamonds are higher than vibration levels associated with trains moving over typical continuously welded rail. SEA uses the term special trackwork to refer to segments of track like this, that have gaps and therefore generate higher vibration velocities when trains roll over them. SEA assessed the magnitude of these higher vibration levels associated with special trackwork; Table 4.10-12 presents the results of this assessment.

Noise and Vibration
Draft Environmental Impact Statement July 2008 CN—Control—EJ&E 4.10-18
Table 4.10-10. Predicted Vibration Effect Distances at Measurement Sites
Trainsa Weighted AverageTrain Speed (mph)
Maximum Train Speed (mph) Measurement Site EJ&E
Segment Closest Arterial
Street Existing Future Existing Future Existing Future
Lmax at 75 ft
(VdB)b
Effect Threshold
(VdB) c
Effect Distance
(ft)d
V1. Lake Zurich, IL 14 Main Street 5.3 20.3 31 31 33 36 72.4 72 80
V2A. Barrington, IL A 14 Northwest Hwy. 5.3 20.3 37 39 40 40 72.4 72 80
V2B. Barrington, IL Be 14 Main Street 5.3 20.3 37 39 40 40 82.2 72 170
V2C. Barrington, IL C 14 Main Street 5.3 20.3 37 39 40 40 72.4 72 80
V2D. Barrington, IL D 14 West Hillside Avenue 5.3 20.3 37 39 40 40 72.4 72 80
V3. Hoffman Estates, IL
14 Shoe Factory Road 5.3 20.3 36 37 40 45 72.4 72 80
V4B. Warrenville, IL 11 Batavia Road 10.7 31.6 38 41 45 45 72.4 72 80
V5. Aurora, IL 10 Ogden Avenue 15.7 39.5 35 40 45 45 72.4 72 80
V6. Crest Hill, IL 9 Gaylord Street 18.5 42.3 31 34 44 44 72.4 72 80
V7A. Joliet, IL 8 Woodruff Street 18.5 42.3 9 10 10 10 72.4 72 80
V8. Matteson, IL 7 Main Street 6.4 28.3 38 41 43 45 72.4 72 80
V9A. Chicago Heights, IL
6 Western Avenue 8.6 31.6 24 30 45 30 76.6 72 130
V9B. Dyer, IN 6 Calumet Avenue 10.2 34.2 35 25 35 45 76.6 72 210
V10A. Griffith, INf 4 Broad Street 7.6 28.6 24 25 25 25 82.2 72 210
V10B. Griffith, INg 4 Broad Street 7.6 28.6 24 25 25 25 82.2 72 210
V12. Griffith, IN 4 45th Avenue 7.6 28.6 24 25 25 25 76.6 72 130
V13 Gary, IN 4 15th Avenue 9.7 29.7 38 38 45 45 76.6 72 130
Notes: a Average number of freight trains per day. b) Maximum RMS vibration level averaged over a 15-second interval. Levels given in decibels (VdB) using a decibel reference of 1µin/sec. c Effect threshold for maximum rail car vibration. d Distance measured from centerline of closest track. e Sites close to special trackwork, therefore vibration levels are higher here than they are in areas that are not adjacent to special trackwork. f Measurement was conducted in February 2008. g Measurement was conducted in April 2008.

Noise and Vibration
CN—Control—EJ&E July 2008 Draft Environmental Impact Statement 4.10-19
Table 4.10-11. Predicted Vibration Effect Distances for each EJ&E Segment, Standard Track
Trainsa Maximum Train Speed (mph)b
City EJ&E Segment
Closest Arterial Street
Existing Future Existing Future
Effect Threshold (VdB)c
Effect Distance (ft)
Gary 2 5th Avenue 9.8 29.8 45 45 72 130
Gary (V13) 3 15th Avenue 9.7 29.7 44 45 72 130
Griffith 4 40th Pl. 7.6 28.6 44 43 72 130
Griffith (V12) 4 Elm Street 7.6 28.6 42 32 72 130
Griffith (V10) 4 Broad Street 7.6 28.6 25 25 72 210
Schererville 5 Kennedy Avenue 10.2 34.2 40 45 72 210
Dyer (V9B) 5 Hart Street 10.2 34.2 45 30 72 210
Sauk Village 5 Torrance Avenue 10.2 34.2 44 45 72 210
Ford Heightsd 5 Bishop Ford Fwy. 10.2 34.2 45 30 72 210
Ford Heightse 5 Bishop Ford Fwy. 10.2 34.2 45 30 72 130
Chicago Heights 6 East End 8.6 31.6 21 23 72 130
Park Forest A (V9A) 6 Western Avenue 8.6 31.6 35 45 72 130
Mattesonf 6 Main Street 6.4 28.3 43 45 72 130
Mattesong (V8) 7 Main Street 6.4 28.3 43 45 72 80
Frankfort 7 Harlem Avenue 6.4 28.3 45 45 72 80
New Lenox 7 S. Gougar Road 6.4 28.3 45 31 72 80
Joliet 7 Cherry Hill Road 6.4 28.3 45 33 72 80
Joliet Yard (V7A) 8 Woodruff Street 18.5 42.3 10 10 72 80
Crest Hill (V6) 9 Division Street 18.5 42.3 44 44 72 80
Plainfield 9 135th Street 18.5 42.3 42 45 72 80
Plainfield 10 Hafenrichter Road 15.7 39.5 44 45 72 80
Aurora (V5) 10 Ogden Avenue US 34
15.7 39.5 45 45 72 80
Naperville 11 Diehl Road 10.7 31.6 45 45 72 80
Warrenville (V4B) 11 Batavia Road 10.7 31.6 45 45 72 80
West Chicago 11 Aurora Street 10.7 31.6 30 30 72 80
West Chicago 12 Hawthorne Lane 4.4 23.4 35 45 72 80
Wayne 12 Army Trail Road 4.4 23.4 45 45 72 80

Noise and Vibration
Draft Environmental Impact Statement July 2008 CN—Control—EJ&E 4.10-20
Table 4.10-11. Predicted Vibration Effect Distances for each EJ&E Segment, Standard Track
Trainsa Maximum Train Speed (mph)b
Elgin 13 W. Bartlett Road 5.5 22.5 45 45 72 80
Elgin 14 Spaulding Road 5.3 20.3 45 45 72 80
Hoffman Estates (V3) 14 Shoe Factory Road 5.3 20.3 40 45 72 80
Barrington (V2D) 14 W. Hillside Avenue 5.3 20.3 40 40 72 80
Barrington (V2C) 14 Main Street 5.3 20.3 40 40 72 80
Barrington (V2A) 14 Northwest Hwy. 5.3 20.3 40 45 72 80
Barrington 14 Lake Zurich Road 5.3 20.3 40 45 72 80
Lake Zurich (V1) 14 Main Street 5.3 20.3 33 36 72 80
North Chicago 14 -- 3.2 3.2 -- -- No Change No Change
Notes: a Average number of freight trains per day. b The maximum speed of all freight trains was considered and the highest value was reported c Effect threshold for maximum rail car vibration. d East of Bishop Ford Freeway. e West of Bishop Ford Freeway. f East of Main Street. g West of Main Street.

Noise and Vibration
CN—Control—EJ&E July 2008 Draft Environmental Impact Statement 4.10-21
Table 4.10-12. Predicted Vibration Effect Distances for EJ&E Sections with Special Trackwork
Serial No.
City EJ&E Segment
Milepost Closest Arterial Road Length (ft)a Effect Distance (ft)
1 Gary, IN 1 44.40 E 5th Avenue 255 190
2 Gary, IN 1 43.55 E 5th Avenue 300 190
3 Gary, IN 1 43.40 E 5th Avenue 260 190
4 Gary, IN 2 42.17 E 5th Avenue 255 190
5 Gary, IN 2 42.11 E 5th Avenue 255 190
6 Gary, IN 3 41.75 E 9th Avenue 260 190
7 Gary, IN 3 41.56 E 9th Avenue 250 190
8 Gary, IN 3 40.60 E 15th Avenue 255 190
9 Gary, IN 3 40.17 E 25th Avenue 310 190
10 Gary, IN 3 40.01E 25th Avenue 245 190
11 Gary, IN 4 39.68E Black Oak Road 590 190
12 Griffith, IN 4 36.19E Broad Street 925 220
13 Griffith, IN 5 35.75E Broad Street 1,060 220
14 Schererville, IN 5 34.95E Kennedy Avenue 730 220
15 Schererville, IN 5 34.40E Kennedy Avenue 254 220
16 Schererville, IN 5 33.80E Kennedy Avenue 210 220
17 Dyer, IN 5 31.30E Lake Street 210 220
18 Chicago Heights, IL 5 26.46E State Street 260 190
19 Chicago Heights, IL 5 26.22E State Street 650 190
20 Chicago Heights, IL 5 25.92E Wentworth Avenue 610 190
21 Chicago Heights, IL 5 25.26E Chicago Road 470 190
22 Chicago Heights, IL 6 25.06E Chicago Road 235 190
23 Chicago Heights, IL 6 24.82E Chicago Road 325 190
24 Chicago Heights, IL 6 24.61E Euclid Avenue 230 190
25 Chicago Heights, IL 6 24.40E Euclid Avenue 460 190
26 Matteson, IL 6 22.50E Main Street 315 170
27 Matteson, IL 6 22.20E Main Street 460 170
28 Matteson, IL 7 21.74E Main Street 810 170
29 Matteson, ILb 7 20.40E Cicero Avenue 260 80
30 Matteson, IL 7 19.10E Central Avenue 240 170
31 Frankfort, ILb 7 14.60E Sauk Trail Road 290 80
32 Frankfort, IL 7 14.40E Center Road 250 170
33 Frankfort, IL 7 14.25E Center Road 530 170
34 Frankfort, IL 7 13.37E Wolf Road 260 170
35 Frankfort, IL 7 13.15E Wolf Road 240 170
36 Frankfort, ILb 7 11.60E Owens Road (116th Avenue)
270 80
37 Joliet, IL 7 01.74E Rowell Avenue 255 170
38 Joliet, IL 7 01.40E Washington Street 650 170
39 Joliet, IL 7 00.75E Washington Street 540 170
40 Joliet, IL 8 00.77E Washington Street 220 170
41 Joliet, IL 8 00.64E Lincoln Highway 410 170
42 Joliet, IL 8 00.45E Lincoln Highway 255 170
43 Joliet, IL 8 00.00W Joliet Yard 2,710 170
44 Joliet, IL 8 00.62W Charlesworth Avenue 255 170

Noise and Vibration
CN—Control—EJ&E July 2008 Draft Environmental Impact Statement 4.10-22
Table 4.10-12. Predicted Vibration Effect Distances for EJ&E Sections with Special Trackwork
Serial No.
City EJ&E Segment
Milepost Closest Arterial Road Length (ft)a Effect Distance (ft)
45 Joliet, IL 8 00.77W Woodruff Road 360 170
46 Joliet, IL 8 01.53W Woodruff Road 255 170
47 Joliet, IL 8 01.62W Woodruff Road 255 170
48 Joliet, IL 8 01.80W Broadway Street 255 170
49 Joliet, IL 8 02.00W Broadway Street 255 170
50 Crest Hill, IL 9 02.40W Broadway Street 310 170
51 Crest Hill, IL 9 05.50W Gaylord Road 255 170
52 Crest Hill, IL 9 05.95W Division Street 255 170
53 Plainfield, ILa 9 09.80W Naperville Road 255 80
54 Plainfield, IL 9 10.65W Van Dyke Road 255 170
55 Plainfield, IL 9 10.90W Van Dyke Road 1,160 170
56 Plainfield, IL 9 11.24W 135th Street 255 170
57 Plainfield, IL 9 11.53W 135th Street 255 170
58 Plainfield, IL 10 11.80W 135th Street 255 170
59 Plainfield, IL 10 12.47W 127th Street 255 170
60 Plainfield, IL 10 14.68W 111th Street 255 170
61 Plainfield, IL 10 16.10W Wolf's Crossing 255 170
62 Aurora, IL 10 18.37W Ogden Avenue 255 170
63 Aurora, IL 10 18.64W Ogden Avenue 255 170
64 Aurora, IL 11 20.73W Liberty Street 360 170
65 Aurora, IL 11 21.10W Liberty Street 255 170
66 Naperville, IL 11 21.95W Diehl Road 255 170
67 Naperville, IL 11 22.57W Diehl Road 360 170
68 Naperville, IL 11 22.81W Diehl Road 255 170
69 Warrenville, IL 11 25.88W Batavia Road 255 170
70 West Chicago, IL 11 28.55W Ann Street 255 170
71 West Chicago, IL 11 28.90W Washington Street 400 170
72 West Chicago, IL 11 29.30W Washington Street 540 170
73 West Chicago, IL 12 29.94W Hawthorne Lane 730 170
74 West Chicago, IL 12 31.04W Hawthorne Lane 255 170
75 Wayne, ILa 12 31.80W North Avenue 270 80
76 Bartlett, IL 13 35.68W Stearns Road 260 170
77 Bartlett, IL 13 36.10W Stearns Road 365 170
78 Elgin, IL 13 36.95W Bartlett Road 510 170
79 Elgin, IL 13 37.48W Spaulding Road 810 170
80 Elgin, IL 13 37.62W Spaulding Road 240 170
81 Barrington, IL 14 49.39W Main Street 265 170
82 Lake Zurich, IL 14 54.50W Main Street 255 170
83 Lake Zurich, IL 14 54.30W Main Street 255 170
Notes: a Longitudinal effect distance from center of special trackwork in both directions. b Indicates spring switches, which do not increase vibration at crossovers. The effect distances for crossovers
with spring switches are the same as the effect distances for corresponding standard track.

Noise and Vibration
CN—Control—EJ&E July 2008 Draft Environmental Impact Statement 4.10-23
SEA used the data in Table 4.10-11 and Table 4.10-12, above, to plot vibration effect contours and count the number of sensitive receptors inside those contours (where the predicted vibration levels from the increased train traffic on the EJ&E rail line under the Proposed Action would exceed the FTA vibration effect threshold). SEA’s vibration analysis determined that CN and EJ&E train pass-by events produce comparable levels of ground-borne vibration. Therefore, SEA’s analysis does not anticipate an increase in vibration velocities associated with train pass-by events. Therefore, the vibration effects contours plotted by SEA are representative of existing rail traffic and traffic associated with the Proposed Action. Use of vibration affects contours allowed SEA to assess the number of vibration-sensitive receptors that would experience train-induced vibration levels during a pass-by event that exceed the vibration affect criteria. Table 4.10-13, below, presents the number of vibration-sensitive receptors predicted to experience vibration effects as a result of train activity on each EJ&E segment.
Table 4.10-13. Vibration-Sensitive Receptors Along the EJ&E Rail Line
EJ&E Segment No. Vibration-Sensitive Receptors
1 0
2 0
3 13
4 176
5 67
6 23
7 11
8 19
9 23
10 5
11 31
12 2
13 19
14 33
Total 422
The vibration monitoring data showed that CN and EJ&E trains generate similar vibration levels. Therefore, maximum vibration levels from train traffic following the Proposed Action are expected to be the same as the levels as the vibration that results from existing trains. However, the number of trains per day would be greater following the Proposed Action, which means that the vibration events would occur more frequently. As discussed in Section 4.10.2.1, Methodology, the frequency of train pass-by events is one factor that determines which vibration effect thresholds (or criteria) should be used to assess vibration affects. Appendix L presents the noise and vibration contours overlaid upon aerial photographs.
Potential for Vibration Damage to Prestwick Dam. During the public scoping meetings, the public expressed concern that increased train operations would cause vibration damage to Prestwick Dam, an earthen dam south of West Sauk Trail in Frankfort, Illinois. The dam is more than 1,500 feet from the EJ&E tracks. In response to the concerns raised, SEA measured vibration at two locations:

Noise and Vibration
Draft Environmental Impact Statement July 2008 CN—Control—EJ&E 4.10-24
Channel 1 and Channel 2. Channel 1 was in a grassy area 40 feet south of West Sauk Trail, and Channel 2 is 110 feet south of West Sauk Trail on the face of the dam.
Three trains passed during the measurements. SEA analyzed the vibration signals from those trains to determine the peak particle velocity (PPV) during the period when each train was passing. Table 4.10-14, below, lists the PPV measurements. Vibration from the trains was not distinctly different from background vibration, and it is not clear whether the PPV values were caused by the freight trains or vehicular traffic on West Sauk Trail.
Table 4.10-14. Measured PPV, Prestwick Dam PPV, Channel 1
(in/sec) PPV, Channel 2
(in/sec) Train 1 0.0024 0.0021
Train 2 0.0015 0.0052
Train 2 0.0031 0.0006
The 2006 FTA manual recommends the limits in Table 4.10-15, below, for assessing potential for building damage from train vibration. The FTA bases the criteria on those of Swiss Standard SN640312a from the Association of Swiss Highway Professionals (1992). The FRA manual, which is based on the 1995 FTA manual, suggests damage threshold criteria of 0.50 in/sec PPV for fragile buildings and 0.12 in/sec PPV for extremely fragile historic buildings.
Table 4.10-15. FTA Recommended Damage Criteria Building Category Limit, PPV
(in/sec)
I. Reinforced-concrete, steel or timber (no plaster) 0.5
II. Engineered concrete and masonry (no plaster) 0.3
III. Non-engineered timber and masonry buildings 0.2
IV. Buildings extremely susceptible to vibration damage
0.12
SEA measured train-induced ground-borne vibrations at the Prestwick Dam. Measured vibration velocity levels are over 20 times lower than the most conservative vibration damage threshold shown in the table above. SEA concluded that vibration from any future train operations on the EJ&E tracks would be well below the level necessary to damage Prestwick Dam.
Potential for Vibration Effects on Fermi National Accelerator Laboratory. Fermi National Accelerator Laboratory (Fermilab), in Batavia, Illinois, expressed concerns about increases in daily train traffic, longer trains, and heavier rail cars on the EJ&E rail line as a result of the Proposed Action. Most of Fermilab’s existing and proposed research facilities are below-ground, with facilities that are vibration-tolerant, such as offices and administrative buildings, at ground level. Fermilab is concerned that the Proposed Action could increase ground-borne vibrations (both at and below the ground surface) and raises concerns that, as a result, a portion of the Fermilab campus closest to the EJ&E rail line could become incompatible with future research expansion plans.
In response, SEA performed a three-dimensional analysis of train-induced ground-borne vibrations along the portion of the EJ&E rail line that shares a property line with Fermilab (see Figure 3.10-3). Using site-specific information about geotechnical and geophysical conditions (provided by Fermilab), SEA developed a proprietary analytical model that assessed vibration wave propagation in the soils and rock at Fermilab. SEA assessed the validity of the model by analyzing data from other projects and comparing the model’s results with the results from the other projects. SEA concluded that the model was valid. Then SEA used this model in a series of analyses that simulated the

Noise and Vibration
CN—Control—EJ&E July 2008 Draft Environmental Impact Statement 4.10-25
passage of trains along this portion of the EJ&E rail line. SEA compared analysis results with the vibration criteria (VC) curve (maximum acceptable levels of vibration) for highly vibration-sensitive land uses such as physics nano-scale research laboratories, like the Fermilab. Ground-borne vibration levels are not cumulative; they are not assessed on a 24-hour basis. Rather, vibration levels are assessed on an event-specific basis. Therefore, SEA evaluated the vibration levels associated with train pass-by events, and not on a total daily train traffic basis.
Analysis results indicate that train-induced vibration would not affect current research activities at Fermilab (regardless of the number of trains per day on the EJ&E rail line), because current research activities are not located along the eastern property line near the EJ&E rail line. The analysis results can also help assess how the Proposed Action might affect future research expansion and development plans at the Fermilab campus. SEA’s three-dimensional vibration analysis assessed vibrations at the ground surface. SEA determined that train-induced vibration levels at the ground surface would exceed the relevant vibration affects threshold for physics laboratories (limits represented by the VC-E curve shown in Figure 4.10-3, above) in an area extending 500 feet west of the EJ&E rail line. However, at this distance, subsurface vibration levels at depths of 100 and 250 feet below the ground would not exceed the recommended vibration limits represented by the VC-E curve. Figure 4.10-4, below, presents analysis results graphically. In the figure, the horizontal lines at the top of the figure show vibration effects thresholds represented by the VC-B, VC-C, VC-D, and VC-E curves. As explained above, these curves represent vibration effects thresholds for vibration-sensitive land uses. Each curve represents the maximum allowable vibration levels for a category of land use; each curve represents a land use that is more sensitive to vibration than the curve above it.
Figure 4.10-4 also shows vibration levels predicted at the ground surface (0 feet), 100 feet below the ground, and 250 feet below the ground. The figure compares SEA’s vibration predictions at these three elevations, from a point 500 feet west of the EJ&E rail line. By inspection, the figure shows that, at a point 500 feet from the EJ&E rail line, subsurface vibration levels would not exceed the recommended vibration limits represented by the VC-E curve, which represents the maximum allowable vibration levels for facilities like Fermilab. The figure also shows that vibration levels at the ground surface would exceed the recommended vibration limits represented by the VC-E curve.
Figure 4.10-4. Refined Vibration Analysis Results

Noise and Vibration
Draft Environmental Impact Statement July 2008 CN—Control—EJ&E 4.10-26
Most of Fermilab’s existing and proposed research facilities are below-ground, with facilities that are vibration-tolerant, such as offices and administrative buildings, at ground level. Because Fermilab has not selected specific locations for its future expansion projects (although some of their future research facilities will be constructed underground), SEA cannot conclusively state whether vibration from the Proposed Action would adversely affect Fermilab. However, results of these analyses provide insight that would assist Fermilab evaluate the compatibility of the eastern portion of its campus with short-term and long-range development plans in light of the Proposed Action.
Proposed New Construction
Potential Vibration Effects. SEA evaluated the potential for operational vibration impacts associated with the proposed connections and double track using the same methods used to assess operational vibration impacts due to train traffic on the EJ&E rail line. Table 4.10-16, below, shows results of this assessment.
Table 4.10-16. Vibration Analysis Results–Proposed Construction
Construction Site Vibration-Sensitive Receptors
Leithton Double Tracka (Illinois) 0
No-Build at Munger (Illinois) 0
Proposed Munger Connection (Illinois) 0
Munger Alternative–Original Proposal (Illinois) 0
Munger Alternative–UP Connection (Illinois) 1
Munger Alternative–Northwest Quadrant (Illinois) 0
No-Build at Joliet (Illinois) 0
Proposed Joliet Connection (Illinois) 0
Joliet Alternative–Original Proposal (Illinois) 0
No-Build at Matteson (Illinois) 0
Proposed Matteson Connection (Illinois) 3
Matteson Alternative–Northeast and Southwest Quadrants (Illinois)
3
Matteson Alternative–Southwest Quadrant (Illinois) 2
No-Build at Griffith (Indiana) 0
Proposed Griffith Connection (Indiana) 0
No-Build at Ivanhoe (Indiana) 0
Proposed Ivanhoe Connection (Indiana) 0
No-Build at Kirk Yard (Indiana) 0
Proposed Kirk Yard Connection (Indiana) 0
SEA’s analysis indicated potential effects on vibration-sensitive receptors associated with the three Matteson construction alternatives and the Munger Alternative-UP Connection.
Impact Thresholds for Construction Vibration. Most impact thresholds for construction vibration are based on minimizing the potential for damage to nearby structures. The construction procedure that is most commonly associated with building damage is blasting, either for mining operations or for excavating through rock layers. Blasting would not be required for this project, which would substantially reduce the potential for structural damage as a result of vibration. Other construction

Noise and Vibration
CN—Control—EJ&E July 2008 Draft Environmental Impact Statement 4.10-27
procedures that generate relatively high vibration levels include pile driving, use of hoe rams and jackhammers for demolition, vibratory compaction, and tracked vehicles such as bulldozers.
Limits for construction vibration are usually expressed in terms of the peak particle velocity (PPV). The most common vibration limit is a PPV of 2 in/sec, which is largely based on studies performed by the U.S. Bureau of Mines (USBM). A study reported in USBM Bulletin 656 investigated the effect of blasting vibration on roadways, bridges, concrete structures, and residential structures (Nicholls, Johnson, and Duvall 1971). The results indicated that minor damage such as cracks in masonry, drywall, and plaster in old residential structures can occur at a vibration level above 5.4 in/sec. The “threshold of damage” limit recommended by the USBM was 4.0 in/sec, which was considered sufficient to avoid structural or cosmetic damage to residences. A recommendation from the U.S. Office of Surface Mining is to use a limit of 0.75 in/sec to protect against growth of hairline cracks in weak residential structures, including hairline cracks that may be too small to be seen without magnification.
SEA also assessed construction-induced vibration using other thresholds to more fully assess the potential for construction-induced vibration affects to residences and historic structures in the Study Area. Several European standards specify substantially lower limits to protect against damage to fragile historic structures. One example is Swiss Standard SN640312a from the Association of Swiss Highway Professionals (1992). The values from the Swiss Standard are shown below in Table 4.10-17. Based on the definitions in the Swiss Standard, residences in the Study Area would be categorized as average sensitivity and any historic buildings in the corridor would be classified as particularly high sensitivity. The rate of occurrence would be considered frequent. The Swiss Standard indicates that a vibration limit of between 0.12 and 0.24 in/sec (PPV) for vibration below 30 Hz would be appropriate for the sensitive historic structures. This is substantially lower than the vibration limits in most other standards.
Table 4.10-17. Guideline Values for Construction Vibration (Swiss Standard SN640312a)
Sensitivity Category Rate of Occurrence Guideline Value (in/sec) 1. Very Low Sensitivity Up to 3 times the values for Sensitivity
Category 3
2. Low Sensitivity Up to 2 times the values for Sensitivity Category 3
3. Average Sensitivity Occasional Frequent Permanent
< 30 Hz 0.59 0.24 0.12
30 to 60 Hz 0.79 0.31 0.16
> 60 Hz 1.18 0.47 0.24
4. Particularly High Sensitivity
Between 0.5 and 1 times the values for Sensitivity Category 3
Based on this information, SEA established the recommended limits for construction-related vibration effects for the Proposed Action as follows.
Fragile historic buildings: 0.12 in/sec (PPV)
Non-historic buildings including single-family residences and commercial buildings: 0.5 in/se. (PPV)
If construction-related vibration levels remain below these thresholds, damage to buildings is unlikely. These thresholds are also low enough to ensure that nearby residents would not perceive construction-related vibration.
Construction Vibration Impacts. SEA assessed construction-induced vibration as follows: The construction processes for the six planned connections and double track that are expected to generate

Noise and Vibration
Draft Environmental Impact Statement July 2008 CN—Control—EJ&E 4.10-28
the highest vibration levels include pile driving, demolition using a hoe ram, and use of heavy tracked equipment such as bulldozers and backhoes. Data provided in the FRA/FTA manuals on typical vibration levels from different classes of construction equipment at a distance of 50 feet were used as the starting point in SEA’s assessment (FRA 2005; FTA 2006). Table 4.10-18 below presents the vibration levels for various classes of construction equipment.
Table 4.10-18. Vibration Source Levels for Construction Equipment Equipment PPV at 25 ft (in/sec)
upper range 1.518 Pile driver (impact)
typical 0.644
upper range 0.734 Pile driver (sonic)
typical 0.170
Clam shovel drop (slurry wall) 0.202
in soil 0.008 Hydromill (slurry wall)
in rock 0.017
Vibratory roller 0.210
Hoe ram 0.089
Large bulldozer 0.089
Caisson drilling 0.089
Loaded trucks 0.076
Jackhammer 0.035
Small bulldozer 0.003
Sources: FTA, May 2006, Transit Noise and Vibration Impact Assessment, FTA-VA-90-1003-06, Federal Transit Administration, Office of Planning and Environment, available online at http://www.fta.dot.gov/documents/FTA_Noise_and_Vibration_Manual.pdf. FRA, October 2005, High-Speed Ground Transportation Noise and Vibration Impact Assessment, Federal Railroad Administration, Office of Railroad Development.
SEA used the typical vibration level for impact pile driving in Table 4.10-17 (PPV=0.644 in/sec) as the basis for assessing the potential for vibration to exceed the damage threshold. SEA estimated construction vibration impact distances using procedures in the FRA/FTA guidance manuals. Figure 4.10-5, as follows, shows the vibration levels versus distance for a range of construction processes.
Figure 4.10-5. shows that vibration velocities associated with construction equipment attenuate very quickly with increasing distance from the source. SEA’s assessment of construction-induced vibration reached the following conclusions:
• For the upper range of impact pile driving, potential for damage to normal buildings extends out to 50 feet and potential for damage to fragile historic buildings extends out to 120 feet.
• For typical vibration from pile driving, the potential for damage is reduced to 30 feet for normal buildings and 70 feet for fragile historic buildings.
The Applicants did not provide detailed construction plans; therefore, SEA was unable to perform a detailed assessment of construction-induced vibration. SEA expects the Applicants to implement best management practices when developing construction plans and performing construction-related activities to ensure that construction-related vibration effects are minimized.

Noise and Vibration
CN—Control—EJ&E July 2008 Draft Environmental Impact Statement 4.10-29
Figure 4.10-5. Typical Vibration Levels from Construction Equipment
Note: The right-hand axis is the approximate RMS vibration velocity in decibels assuming a crest factor of 4.
4.10.3 Conclusions
SEA concludes that the magnitude of the net increase in noise-sensitive receptors that would be exposed to an Ldn of 65 dBA or greater due to the Proposed Action does not constitute an adverse environmental effect. SEA recognizes that the very low net increase in noise-sensitive receptors affected by noise associated with the Proposed Action is due to a net benefit (a reduction) in the number of affected noise-sensitive receptors adjacent to CN rail lines and an increase in the number of affected noise-sensitive receptors adjacent to the EJ&E rail line. SEA notes that noise-sensitive receptors located within the 70 dBA contour line would be adversely affected by the Proposed Action. SEA encourages the Applicants to coordinate with municipalities adjacent to the EJ&E rail line and identify measures to reduce train noise levels in their community.
In some areas along the EJ&E line, noise-sensitive receptors predicted to be exposed to an Ldn of 70 dBA or greater appear to be clustered together in close proximity to one another. Given that the EJ&E rail line travels through approximately 50 communities, SEA concludes that requiring mitigation for all of noise-sensitive receptors predicted to experience an Ldn of 65 dBA or greater would be unreasonable. However, SEA considers it appropriate that the Applicants determine where noise walls could provide noise reduction benefits and fulfill the feasibility and reasonability criteria as defined by the Illinois Department of Transportation. Where noise walls can be shown to provide benefits and be both reasonable and feasible with respect to receptors predicted to experience an Ldn of 70 dBA or greater, SEA encourages the Applicants to negotiate with the affected municipalities.
SEA also concludes that magnitude of train-induced ground-borne vibration velocity levels associated with the passby of EJ&E trains is substantially similar to the magnitude of train-induced ground-borne vibration velocity levels associated with the passby of CN trains. On this basis, SEA does not anticipate a substantial change in vibration velocity levels associated with train pass-by events due to the Proposed Action. SEA also concludes that train-induced ground-borne vibration velocity levels at Fermi National Accelerator Laboratory may be incompatible with potential expansion plans at the

Noise and Vibration
Draft Environmental Impact Statement July 2008 CN—Control—EJ&E 4.10-30
ground surface within 500 feet west of the EJ&E rail line. At this distance, vibration velocity levels would be compatible with future development plans at depths of 100 and 250 feet below the ground.
Recommended