grdc.com.au
26TH JULY 2017
GRAINS RESEARCH UPDATE ROWENA
DRIVING PROFIT THROUGH RESEARCH

AGENDA
Time Topic Speaker(s)
9:00 AM Welcome
9:10 AM What Asia wants from Australian wheat in an increasingly competitive market
Ken Quail (AEGIC)
9:40 AM Crop rotations ‐ how they compare for risk, profit and system benefit
Crop choice, frequency and sequence
Yield, price and gross margin relationships and the value of rotation on soil water, nutrition, weeds and disease
Simon Fritsch (AgriPath)
10:15 AM Landing the chickpea crop safely – strategies for late season disease management
Kevin Moore (NSW DPI)
10:45 AM Morning tea
11:15 AM Russian wheat aphid ‐ what's happening? Melina Miles (DAF Qld)
11:30 AM Buying a new silo? Design features to look for and faults to avoid
Philip Burrill (DAF Qld)
12:00 PM Spray drift ‐ how do we stop it?
Identifying acceptable spray conditions
Drift mitigation strategies and when to stop spraying
Product volatility and formulation differences ‐ how important are they?
Bill Gordon (Nufarm)
12:30 PM Boom setup for different spray jobs ‐ pre and post‐em herbicides in stubble and late season fungicides/insecticides
Bill Gordon (Nufarm)
1:00 PM Lunch
1:50 PM Autonomous tractors ‐ platforms and applications under development
Craig Baillie (USQ)
2:20 PM Chickpeas and header fires ‐ where do they start and how can
we better manage risk? Lessons from thermal imaging of
components in working headers to identify potential ignition
sources
Ben White (Kondinin Group)
2:50 PM Groundcover, stubble type and management impact on fallow efficiency
Richard Daniel (NGA)
3:15 PM Close
Rowena Grains Research Update

Row
ena
GR
DC
Gra
ins
Res
earc
h U
pdat
e 20
17
2
Contents
What does Asia want from Australian wheat in an increasingly competitive market ..................................... 3 Ken Quail, Roslyn Jettner, Chris Carter and Larisa Cato
Crop rotations ‐ how they compare for risk, profit and system benefit .......................................................... 7 Simon Fritsch
Minimising risk of disease in 2017 chickpea crops ......................................................................................... 8 Kevin Moore, Nicole Dron, Kristy Hobson, Kurt Lindbeck, Mark Richards and Sean Bithell
Insect pest management update Canola aphids, Russian wheat aphid, and rutherglen bug ......................... 14 Melina Miles, Adam Quade and Richard Lloyd
Buying a new silo ‐ faults & design features to look for ............................................................................... 20 Philip Burrill
Spray application tips and tactics ................................................................................................................ 23 Bill Gordon
10 tips for reducing spray drift .................................................................................................................... 28 Bill Gordon
Developments in autonomous tractors ....................................................................................................... 30 Craig Baillie, Craig Lobsey, Cheryl McCarthy, Dio Antille, Alex Thomasson, Zhe Xu and Salah Sukkarieh
Harvester fires: tips for avoidance .............................................................................................................. 36 Ben White
Groundcover and stubble type impact on fallow efficiency ......................................................................... 39 Brendan Burton
Compiled by Independent Consultants Australia Network (ICAN) Pty Ltd.
PO Box 718, Hornsby NSW 1630 Ph: (02) 9482 4930, Fx: (02) 9482 4931, E‐mail: [email protected] Follow us on twitter @GRDCNorth or Facebook: http://www.facebook.com/icanrural
DISCLAIMER
This publication has been prepared by the Grains Research and Development Corporation, on the basis of information available at the time of publication without any independent verification. Neither the Corporation and its editors nor any contributor to this publication represent that the contents of this publication are accurate or complete; nor do we accept any omissions in the contents, however they may arise. Readers who act on the information in this publication do so at their risk. The Corporation and contributors may identify products by proprietary or trade names to help readers identify any products of any manufacturer referred to. Other products may perform as well or better than those specifically referred to.
CAUTION: RESEARCH ON UNREGISTERED PESTICIDE USE
Any research with unregistered pesticides or unregistered products reported in this document does not constitute a recommendation for that particular use by the authors, the authors’ organisations or the management committee. All pesticide applications must be in accord with the currently registered label for that particular pesticide, crop, pest, use pattern and region.
Varieties displaying this symbol beside them are protected under the Plant Breeders Rights Act 1994.
® Registered trademark
Row
ena GR
DC
Grains R
esearch Update 2017
3
What does Asia want from Australian wheat in an increasingly competitive market
Ken Quail, Roslyn Jettner, Chris Carter and Larisa Cato Australian Export Grains Innovation Centre
Key words
Wheat, quality, noodles, bread, Asia
GRDC Code AEG00005
Key messages
Australian wheat is well regarded in many South East Asian (SEA) markets for its quality and suitability for a wide range of noodles however texture attributes and targets could be more targeted.
At present, Australia has less opportunity to supply wheat with suitable quality for the growing SEA bread and confectionary markets.
Ukrainian and Russian wheat are currently a modest threat to Australia’s key wheat export markets in SEA, however it is recognised that the potential threat is large. We need to use our “window of opportunity” effectively.
Background
South East Asia (SEA) is the largest and fastest growing market for Australian wheat, importing 42.9 mmt over the past 5 years valued at A$2.6 billion per annum. This accounts for over half of the Australian total wheat export revenue. The historically dominant and growing market share held by Australian wheat in SEA has traditionally been underpinned by factors including proximity to Australian grain ports, which means shorter voyage times, as well as the quality attributes Australian wheat.
These SEA markets are critical to supporting demand and prices for Australian wheat and therefore, extremely important for Australian growers. Within these markets, Australian exports are experiencing intense competition from wheat supplied from the Ukraine, Russia and Argentina at lower prices, as well as strong competition from North American wheat based on functional performance for baking applications. To remain competitive in SEA and maintain or improve our price differential relative to the alternative suppliers, it is essential that we understand SEA market requirements for wheat.
A better understanding of SEA requirements will better align the Australian industry to supply these markets and translate to an improved value proposition, making us more competitive. With improved competitiveness, the value returned to growers from these markets will be stronger than the scenario where we compete purely on a price basis with low cost origins such as the Black Sea and Argentina.
Aims
To identify the quality attributes and their preferred levels most valued by key SEA wheat end‐users for noodle and bread products that can enhance the demand and value of Australian wheat.

Row
ena
GR
DC
Gra
ins
Res
earc
h U
pdat
e 20
17
4
To assess the competitive threat of wheat supplied from Ukraine and Russia.
Method
Wheat technical and purchasing staff from twenty flour milling companies across Malaysia, Singapore, Indonesia and the Philippines participated in the research project aimed at identifying their preferences and target levels of wheat quality characteristics for a range of fresh noodles and breads and their technical service requirements. The product range included Malaysian style Hokkien noodles, Indonesian fresh noodles (mie basah), Philippines fresh wet noodles, Malaysian loaf bread, Indonesian sweet buns and loaf bread, and Philippines Pan de Sal and sandwich bread.
The project applied choice analysis methodology to collect objective information on wheat preference of grain end‐users. This is a technique derived from paired comparisons and adapted by Louviere and Woodworth (1983) to deliver an experimental framework that provides a coherent way to study “stated preferences’ using a small sample set.
The executive interview was the initial contact with flour mills, designed to introduce the research project to management, confirm participation, collate company background and select end‐products for the study.
The comparative importance of 31 wheat quality, functional and technical service attributes for the selection of wheat for SEA fresh noodle and bread products was ranked from most to least importance by mill technicians and wheat purchasers from each company using a best‐worst scaling (BWS) survey method as described by Louviere et al (2013).
The BWS for mill technicians consisted of 31 choice sets of six attributes per set, with the six attributes being drawn from a pool of 31 attributes. The experimental design ensured that each attribute was equally represented in 31 choice sets and all attributes were evaluated against each other. When faced with a particular choice set, each mill technician would choose the most and least important of the presented attributes based on their need to select grain for a particular end‐use. For wheat purchasers, the survey consisted of 30 choice sets of five attributes per set, with those five attributes being drawn from a pool of 25 attributes.
By presenting each participant with a series of subsets, and then undertaking appropriate analysis, it is possible to create a ranking of the full list of attributes. Experimental design was provided by Professor Jordan Louviere, University of Adelaide and utilises a Balanced Incomplete Block Design (BIBD) being an orthogonal function of the full factorial.
Each of the BWS surveys was presented to project participants in the form of a customised macro‐enabled excel sheet on touch screen tablets. At the mid‐point of each survey, participants completed a question set to define the minimum, maximum and preferred values for a set of quality attributes for noodle and bread products.
Results
For wheat purchasers, perhaps unsurprisingly, price and wheat protein content, overwhelmingly dominate their selection of wheat to buy for fresh noodles and breads in the studied markets. More interesting and less well‐known was mill technician’s preferences for different attributes when making noodle or bread products.
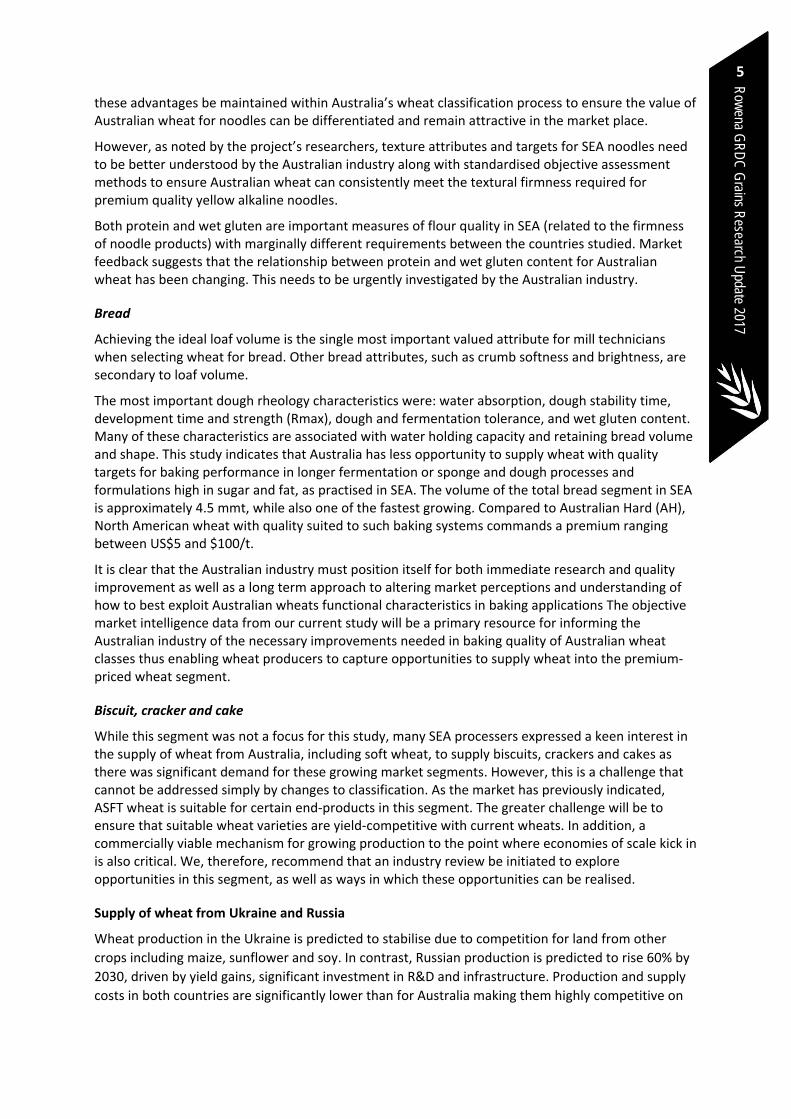
Fresh noodles
Noodle texture (firmness and elasticity) and noodle colour (brightness and colour stability) were the quality attributes of most importance when selecting wheat for fresh noodles. Australian wheat has the advantage over alternate origin wheats for noodle brightness, colour stability and yellowness; and is considered the most suitable wheat for fresh noodles in these markets. It is imperative that
Row
ena GR
DC
Grains R
esearch Update 2017
5
these advantages be maintained within Australia’s wheat classification process to ensure the value of Australian wheat for noodles can be differentiated and remain attractive in the market place.
However, as noted by the project’s researchers, texture attributes and targets for SEA noodles need to be better understood by the Australian industry along with standardised objective assessment methods to ensure Australian wheat can consistently meet the textural firmness required for premium quality yellow alkaline noodles.
Both protein and wet gluten are important measures of flour quality in SEA (related to the firmness of noodle products) with marginally different requirements between the countries studied. Market feedback suggests that the relationship between protein and wet gluten content for Australian wheat has been changing. This needs to be urgently investigated by the Australian industry.
Bread
Achieving the ideal loaf volume is the single most important valued attribute for mill technicians when selecting wheat for bread. Other bread attributes, such as crumb softness and brightness, are secondary to loaf volume.
The most important dough rheology characteristics were: water absorption, dough stability time, development time and strength (Rmax), dough and fermentation tolerance, and wet gluten content. Many of these characteristics are associated with water holding capacity and retaining bread volume and shape. This study indicates that Australia has less opportunity to supply wheat with quality targets for baking performance in longer fermentation or sponge and dough processes and formulations high in sugar and fat, as practised in SEA. The volume of the total bread segment in SEA is approximately 4.5 mmt, while also one of the fastest growing. Compared to Australian Hard (AH), North American wheat with quality suited to such baking systems commands a premium ranging between US$5 and $100/t.
It is clear that the Australian industry must position itself for both immediate research and quality improvement as well as a long term approach to altering market perceptions and understanding of how to best exploit Australian wheats functional characteristics in baking applications The objective market intelligence data from our current study will be a primary resource for informing the Australian industry of the necessary improvements needed in baking quality of Australian wheat classes thus enabling wheat producers to capture opportunities to supply wheat into the premium‐priced wheat segment.
Biscuit, cracker and cake
While this segment was not a focus for this study, many SEA processers expressed a keen interest in the supply of wheat from Australia, including soft wheat, to supply biscuits, crackers and cakes as there was significant demand for these growing market segments. However, this is a challenge that cannot be addressed simply by changes to classification. As the market has previously indicated, ASFT wheat is suitable for certain end‐products in this segment. The greater challenge will be to ensure that suitable wheat varieties are yield‐competitive with current wheats. In addition, a commercially viable mechanism for growing production to the point where economies of scale kick in is also critical. We, therefore, recommend that an industry review be initiated to explore opportunities in this segment, as well as ways in which these opportunities can be realised.
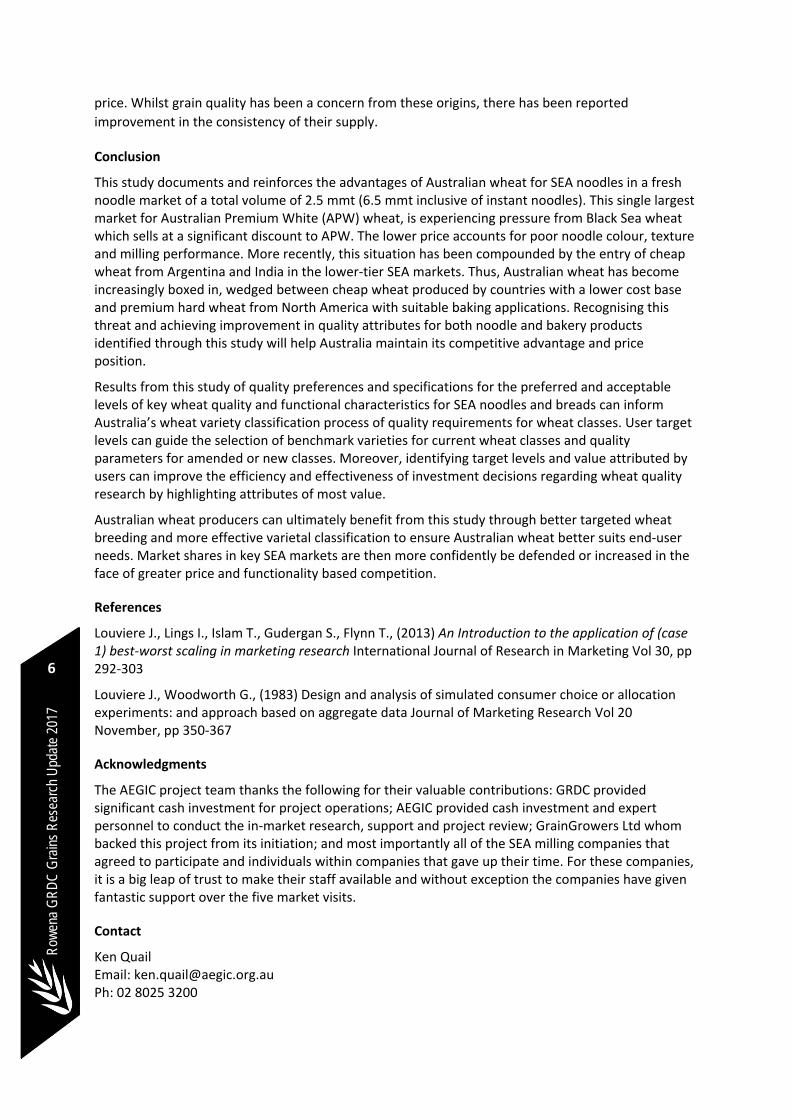
Supply of wheat from Ukraine and Russia
Wheat production in the Ukraine is predicted to stabilise due to competition for land from other
crops including maize, sunflower and soy. In contrast, Russian production is predicted to rise 60% by
2030, driven by yield gains, significant investment in R&D and infrastructure. Production and supply
costs in both countries are significantly lower than for Australia making them highly competitive on
Row
ena
GR
DC
Gra
ins
Res
earc
h U
pdat
e 20
17
6
price. Whilst grain quality has been a concern from these origins, there has been reported
improvement in the consistency of their supply.
Conclusion
This study documents and reinforces the advantages of Australian wheat for SEA noodles in a fresh noodle market of a total volume of 2.5 mmt (6.5 mmt inclusive of instant noodles). This single largest market for Australian Premium White (APW) wheat, is experiencing pressure from Black Sea wheat which sells at a significant discount to APW. The lower price accounts for poor noodle colour, texture and milling performance. More recently, this situation has been compounded by the entry of cheap wheat from Argentina and India in the lower‐tier SEA markets. Thus, Australian wheat has become increasingly boxed in, wedged between cheap wheat produced by countries with a lower cost base and premium hard wheat from North America with suitable baking applications. Recognising this threat and achieving improvement in quality attributes for both noodle and bakery products identified through this study will help Australia maintain its competitive advantage and price position.
Results from this study of quality preferences and specifications for the preferred and acceptable levels of key wheat quality and functional characteristics for SEA noodles and breads can inform Australia’s wheat variety classification process of quality requirements for wheat classes. User target levels can guide the selection of benchmark varieties for current wheat classes and quality parameters for amended or new classes. Moreover, identifying target levels and value attributed by users can improve the efficiency and effectiveness of investment decisions regarding wheat quality research by highlighting attributes of most value.
Australian wheat producers can ultimately benefit from this study through better targeted wheat breeding and more effective varietal classification to ensure Australian wheat better suits end‐user needs. Market shares in key SEA markets are then more confidently be defended or increased in the face of greater price and functionality based competition.
References
Louviere J., Lings I., Islam T., Gudergan S., Flynn T., (2013) An Introduction to the application of (case 1) best‐worst scaling in marketing research International Journal of Research in Marketing Vol 30, pp 292‐303
Louviere J., Woodworth G., (1983) Design and analysis of simulated consumer choice or allocation experiments: and approach based on aggregate data Journal of Marketing Research Vol 20 November, pp 350‐367
Acknowledgments
The AEGIC project team thanks the following for their valuable contributions: GRDC provided significant cash investment for project operations; AEGIC provided cash investment and expert personnel to conduct the in‐market research, support and project review; GrainGrowers Ltd whom backed this project from its initiation; and most importantly all of the SEA milling companies that agreed to participate and individuals within companies that gave up their time. For these companies, it is a big leap of trust to make their staff available and without exception the companies have given fantastic support over the five market visits.
Contact
Ken Quail Email: [email protected] Ph: 02 8025 3200

Row
ena GR
DC
Grains R
esearch Update 2017
7
Crop rotations ‐ how they compare for risk, profit and system benefit
Simon Fritsch, AgriPath
Contact details
Simon Fritsch AgriPath Ph: 0428 638 501 Email: [email protected]
Notes:

Row
ena
GR
DC
Gra
ins
Res
earc
h U
pdat
e 20
17
8
Minimising risk of disease in 2017 chickpea crops
Kevin Moore1, Nicole Dron1, Kristy Hobson1, Kurt Lindbeck2, Mark Richards2 and Sean Bithell1
NSW DPI 1Tamworth and 2Wagga Wagga
Key words
Chickpea, Ascochyta, Botrytis, Phytophthora, Sclerotinia, waterlogging, management
GRDC codes
DAN00176, DAN00212, DAN00172, DAN00177
Take home message
2016 conditions were very conducive to Ascochyta, Botrytis, Phytophthora and Sclerotinia diseases in chickpea crops throughout the GRDC Northern Region.
Large amounts of inoculum of these pathogens will be available to infect 2017 chickpea crops.
Strategies described in this paper will reduce the risk of these diseases; the more strategies employed, the greater the benefit for chickpea growers in 2017.
Background
Following high incidences of diseases (Ascochyta, Phytophthora, Sclerotinia and Botrytis) in 2016 chickpea crops throughout NSW and Queensland, there will be large amounts of inoculum to infect 2017 chickpea crops.
This paper describes strategies that will reduce the risk of each of these diseases. Some of these strategies are based on local and international field experiments; others are based on observations of reduced disease in 2016 crops. The more strategies employed, the greater the benefit for chickpea growers in 2017 and beyond.
Ascochyta blight, AB, Asco (fungus Phoma rabiei previously called Ascochyta rabiei)
Ascochyta inoculum will be present in four forms:
1. Ascochyta infected chickpea residue being discharged out the back of headers or spread by floods and surface water;
2. Seed internally infected by the fungus (a consequence of pod infection);
3. Seed contaminated externally with infected chickpea residue during harvest and handling;
4. Volunteer chickpea plants infected over summer and autumn.
The following will reduce the occurrence and impact of Ascochyta Blight in 2017 chickpea crops.
Grow varieties with improved AB resistance (experiment/observation): These varieties will have less disease and require fewer fungicide sprays.
Burn cereal stubble (this holds AB inoculum, observation): Infected chickpea residue discharged during harvest of 2016 crops blows onto paddocks that are intended for chickpeas in 2017; most of these will have had a cereal crop in 2016 (or 2015).
Remove volunteers (observation): Volunteer chickpea plants infected with Ascochyta will provide inoculum even if the volunteer plants are killed with herbicide. Controlling volunteers early will restrict their size and limit the amount of inoculum they can produce.
Row
ena GR
DC
Grains R
esearch Update 2017
9
Treat all planting seed (experiment): Proper treatment of seed with a registered fungicide will control both internally borne Ascochyta and external contamination.
Sow later in planting window (experiment/observation): This reduces the number of infection events.
Wider rows 66cm+ (experiment/observation): Wide rows improve airflow through the crop leading to more rapid drying after a rain event or dew. They also delay canopy closure and improve penetration of fungicides later in the season.
Tyne openers rather than disc (observation): 2016 observations of less Ascochyta where crops had been sown with tynes is thought to reflect burial and movement of Ascochyta inoculum away from the emerging seedlings.
Double crop sorghum, cotton (experiment/observation): Stress and high biomass favour Ascochyta. 2016 crops double cropped into sorghum or cotton residue were less affected by waterlogging and did not produce the biomass of chickpeas sown into winter cereal or long fallow paddocks.
Fungicide before 1st post emergent rain event, even PBA Seamer (experiment/observation): 2016 crops that had an early preventative Ascochyta fungicide had less disease than crops that were not sprayed until after the disease was detected. Even though PBA Seamer is rated resistant to Ascochyta, growers are urged to apply a preventative fungicide because: (a) the large amount of inoculum will increase disease pressure, (b) it safeguards against changes in the Ascochyta pathogen that are more aggressive or virulent on PBA Seamer and (c) it insures against contamination of PBA Seamer crops with plants of varieties with lower or no Ascochyta resistance eg PBA HatTrick , PBA Boundary or Kyabra (varietal purity is still a major issue in our chickpea industry).
Phytophthora root rot, PRR (fungus‐like Oomycete Phytophthora medicaginis)
Phytophthora inoculum will be present in three forms:
5. Chickpea plants that had PRR in previous seasons (up to 10years back);
6. Other hosts e.g. medics, lucerne, and other leguminous plants including sulla (Hedysarum spp) and sesbania (Sesbania spp) in which Phytophthora can survive and multiply;
7. Soil and water containing PRR infected material and survival structures (oospores, chlamydospores).
The following will reduce the risk of PRR in 2017 chickpea crops.
Avoid PRR high risk paddocks where annual or perennial medics have been a component of pastures and where PRR has occurred in the past chickpea or lucerne; the oospores of Phytophthora medicaginis can survive for more than 10 years.
Avoid paddocks with areas prone to waterlogging although the conditions which induce waterlogging may not occur every year.
Avoid paddocks exposed to water flow from previous chickpea or medics areas; PRR infected material and survival structures can be spread though water movement to neighbouring paddock/s.
Metalaxyl‐based seed dressings are registered for PPR, but they are relatively expensive and provide only 6‐8 weeks protection after sowing.
Grow a variety with the highest level of resistance, particularly in medium‐high risk situations, such as where medics, chickpea or lucerne crops have been grown in the past 5‐6 years.
Row
ena
GR
DC
Gra
ins
Res
earc
h U
pdat
e 20
17
10
Sclerotinia stem and basal rot (fungi Sclerotinia sclerotiorum, S. minor)
In the GRDC northern region, Sclerotinia spp infect chickpea plants two ways (a) Sclerotia germinate directly in or on soil and invade the plant through root or basal stem tissue, producing Sclerotia on and within the basal stem tissues, (b) Sclerotia germinate indirectly, produce apothecia at ground level and these release air borne ascospores (carpogenic germination) that infect plant parts higher in the canopy. In most seasons we only see direct germination because carpogenic germination needs cool moist conditions. In August/September 2016, Sclerotinia disease was very common in chickpea crops in north western NSW and southern QLD due to high levels of canopy leaf wetness and favourable temperatures. Importantly, every case of Sclerotinia involved carpogenic germination ie infection at mid canopy meaning that the Sclerotia formed on and inside the chickpea stems would have been captured during harvest. This led to problems at receival because the cylindrical Sclerotia formed inside the stems resembled ryegrass ergots and some loads were rejected or docked. Sclerotinia inoculum will be present in several forms:
8. Sclerotia spread by floods and surface water;
9. Sclerotia admixed with chickpea seed and introduced into 2017 chickpea paddocks during planting;
10. Sclerotia in canola residue in paddocks intended for chickpea in 2017; large Sclerotia can survive for up to 10 yr;
11. Sclerotia in weed hosts in paddocks intended for chickpea in 2017;
12. Sclerotia already present in paddocks with a history of broadleaf crops and recent Sclerotinia outbreaks.
The following will reduce the risk of Sclerotinia in 2017 chickpea crops.
Grow varieties with lowest susceptibility: Sclerotinia basal rot was assessed in field trials at Wagga Wagga in 2014 and 2016 which led to the following tentative ratings:
Very susceptible: PBA Maiden
Susceptible: Ambar , Genesis TM 090, Neelam , PBA Slasher , PBA Striker , PBA Monarch
Moderately susceptible: PBA Boundary , PBA HatTrick , PBA Seamer
Avoid paddocks with a history of Sclerotinia. Paddocks with a history of Sclerotinia will already have a population of viable sclerotia before the crop is sown and these are a disease risk. A frequent history of the disease also indicates that the environment is also most likely favourable for Sclerotinia to develop. Be aware that even adjoining paddocks can be at risk, due to movement of air‐borne ascospores of the Sclerotinia fungus.
Avoid paddocks with a history of canola. Canola is a very good host for Sclerotinia stem rot. Experience in southern NSW has shown that the number of sclerotia in the soil can build up very quickly when canola is frequent in the cropping rotation.
Avoid paddocks with a history of broadleaf weeds. The collective host range of the Sclerotinia fungi (Sclerotinia sclerotiorum, S. minor) exceeds 400 plant species, mostly broadleaf plants. Weeds can be important in maintaining sclerotial populations in paddocks, even when the frequency of broadleaf host crops in the rotation is low. Broadleaf weeds such as capeweed, shepherds purse and variegated thistle are just some common hosts for Sclerotinia.
Sow within the planting window. Observations from field trials at Wagga Wagga suggest that early sown chickpea is more prone to developing symptoms of Sclerotinia infection; this includes both direct infection and canopy infection from air‐borne spores. Plots sown within the recommended sowing window developed significantly less disease. Dense crop canopies from an early sowing also favour Sclerotinia stem rot later in the season.
Row
ena GR
DC
Grains R
esearch Update 2017
11
Botrytis seedling disease, BSD (fungus Botrytis cinerea)
BSD and Botrytis Grey Mould, BGM are caused by the same fungus, Botrytis cinerea, but they are very different diseases. BSD is a seed‐borne disease that can occur at any temperature and under any conditions. BSD can ONLY occur if pods of chickpea crops from which the seed came were affected by BGM. BSD is readily controlled with the standard chickpea seed treatments. BSD inoculum will be present in two forms:
13. Seed from pods infected with B. cinerea during a prior BGM outbreak.
14. Primary infections of BSD (ie from B. cinerea infected seed); primary infections lead to secondary infection of initially healthy seedlings through root contact.
The following will reduce the risk of BSD in 2017 chickpea crops.
Treat all planting seed: Field trials conducted in 2011 at Moree, Narrabri and Breeza using two B. cinerea infected seed lots from the 2010 BGM epidemic, showed treating chickpea seed with registered seed dressings controlled BSD, improved crop establishment and increased yield but proper coverage and rate were essential.
Avoid using B. cinerea infected seed: Even though seed treatment controls BSD, Botrytis infected seed will have lower vigour than non‐infected seed.
Botrytis grey mould, BGM (fungus Botrytis cinerea)
BGM is an air‐borne foliar disease active ONLY when temperatures warm up towards spring (ca 15°C). It is more prevalent in the warmer regions of the north, where significant crop losses can occur in wet winters and springs as occurred in 2016. BGM is controlled with foliar fungicides; seed treatment is ineffective. Testing chickpea seed from the 2016 harvest at Tamworth has found that half the seed lots tested to date (December 2016) are internally infected with Botrytis. Not treating this seed will lead to BSD (but will have no impact on BGM in 2017). Botrytis cinerea is ubiquitous, has a wide host range (over 138 genera in 70 families) and is a good saprophyte, meaning it can survive, grow and sporulate on just about any dead plant tissue. The fungus readily produces air borne spores and some isolates form sclerotia. This means that inoculum of BGM is always present and if conditions favour BGM, it will occur irrespective of what has happened earlier in the chickpea season.
The following will reduce the risk of BGM in 2017 chickpea crops.
Paddock selection: Avoid planting chickpeas next to paddocks where BGM was an issue the previous season. As for Ascochyta blight, chickpeas should be grown as far away from paddocks in which BGM was a problem as is practically possible. However, under conducive conditions, this practice will not guarantee that crops will remain BGM free, because of the pathogen’s wide host range, ability to colonise dead plant tissue, and the airborne nature of its spores.
Sow later: If long‐term weather forecasts suggest a wetter‐than‐normal 2017 season (La Nina) consider sowing in the later part of the planting window as this will reduce biomass production; BGM is favoured by dense canopies.
Wider rows 66cm+: Wide rows improve airflow through the crop leading to more rapid drying after a rain event or dew. They also delay canopy closure and improve penetration of fungicides later in the season.
Foliar fungicide: In areas outside central QLD, spraying for BGM is not needed in most years. However, in seasons and situations favourable to the disease, a preventative spray of a registered fungicide immediately prior to canopy closure, followed by another application 2 weeks later will assist in minimising BGM development in most years. If BGM is detected in a district or in an individual crop particularly during flowering or pod fill, a fungicide spray should
Row
ena
GR
DC
Gra
ins
Res
earc
h U
pdat
e 20
17
12
be applied before the next rain event. None of the fungicides currently registered or under permit for chickpea BGM have eradicant activity, so their application will not eradicate established infections. Consequently, timely and thorough application is critical.
Waterlogging
Waterlogging (WL) and other stresses can reduce resistance and efficacy of management. Plants exposed to environmental stresses have altered architecture, metabolism and elongation; these reduce the plant’s ability to maintain resistance and re‐shoot post disease infection. This was evident across chickpea crops in 2016 with increased severity of AB on resistant lines (including PBA HatTrick , MR) when under WL stress. Preventative fungicide spray application on stressed, disease prone areas is critical to reducing yield loss.
There are currently no released varieties with significantly improved waterlogging (WL) tolerance; further studies are currently being carried out to exploit potential for improvement in conjunction with PRR resistance. During the 2016 season the northern growing region reported significant crop losses due to PRR. Surveying and quantitative PCR testing of soil samples collected from a number sites across this region concluded that both PRR and waterlogging were involved in plant death at various growth stages. Differentiating WL and PRR crop damage is difficult, often WL is incorrectly identified as PRR.
Distinguishing WL from PRR
Water logging symptoms occur 1‐3 days post flooding compared to a minimum of 7 days for PRR. Both WL and PRR can have similar above ground symptoms with red/yellowing, wilting, and death of plants. However, WL affected plants often succumb too quickly to have red/yellowing or lower leaf drop as always occurs with PRR. PRR symptoms may be delayed if temperatures are cool and soil moist. Waterlogging is a result of lack of oxygen to roots; PRR is the result of an organism killing roots. Waterlogging is thus more common and pronounced during warmer periods because (i) warm water cannot hold as much oxygen as cold water, and (ii) during warm weather, plants grow faster and thus need more oxygen.
Affected whole plants need to be examined shortly after prolonged rain or flood event (1‐3 days). Are the plants easy to pull out? PRR affected plants have little to no lateral roots and offer no resistance when pulled. Initially, WL affected plants have intact lateral roots and will not pull easily. Note: waiting longer than7 days to do the pull test on WL affected plants allows opportunistic soil fungi to decay lateral roots leading to misidentification as root rot.
PRR infected plants may have dark brown or black lesions on the tap root. Often such lesions extend above ground level forming a slightly sunken canker with a distinct junction with healthy stem tissue above.
Plants are most susceptible to WL at flowering and early pod fill unlike PRR which can occur at all growth stages.
The following will reduce the risk of waterlogging in 2017 chickpea crops.
Avoid poorly drained paddocks and those prone to waterlogging.
Sow later if the weather forecast for 2017 predicts a wetter‐than‐normal early‐to‐mid season. Evidence suggests that in chickpea and other crops early vigour associated with plants in the early vegetative phase will re‐shoot and recover root growth more efficiently reducing plant death.

Row
ena GR
DC
Grains R
esearch Update 2017
13
Additional Information
Further information on chickpea disease management can be found at the Pulse Australia website www.pulseaus.com.au and in the NSW DPI 2017 Winter Crop Variety Sowing Guide.
Acknowledgements
This research is made possible by the significant contributions of growers through both trial cooperation, field access and the support of the GRDC; the authors most gratefully thank them and the GRDC. Thanks to Woods Grains, Goondiwindi, Glen Coughran, “Beefwood”, Moree and Joe Fleming, “Parraweena”, Blackville for providing seed for the trials. We also thank agronomists for help with the crop inspections and submitting specimens, Paul McIntosh, Pulse Australia for industry liaison and chemical companies who provide products for research purposes and trial management.
Contact details
Kevin Moore NSWDPI, Department of Primary Industries, Tamworth, Ph: 02 6763 1133 Mb: 0488 251 866 Fx: 02 6763 1100 Email: [email protected]
Varieties displaying this symbol are protected under the Plant Breeders Rights Act 1994.
TM Registered Trademark
Row
ena
GR
DC
Gra
ins
Res
earc
h U
pdat
e 20
17
14
Insect pest management update Canola aphids, Russian wheat aphid, and rutherglen bug
Melina Miles, Adam Quade & Richard Lloyd, QDAF, Toowoomba
Key words
Rutherglen bug, canola, sorghum, Russian wheat aphid
GRDC code
DAQ00196
Take home message
Russian wheat aphid (RWA) has not yet been detected north of Rankin Springs in the Riverina district of NSW. Vigilance is required to ensure early detection of any outbreaks in the northern region this winter‐spring.
Rutherglen bug are damaging pests of sorghum, and of establishing summer crops adjacent to canola stubble. Thresholds and control options for sorghum are established. Research is commencing on the canola stubble scenario.
Russian Wheat Aphid (RWA) as a pest in the northern grains region
RWA is considered a high priority pest by the grains industry because of its potential to cause significant yield losses in wheat and barley if not well managed. Triticale and rye are also susceptible to crop loss, but oats are considered relatively tolerant.
The RWA is more damaging to cereals that the aphid species we already have in Australia. We don’t yet know how susceptible Australian varieties are to RWA.GRDC is investing in the development of resistant cultivars for Australia. In the meantime, international experience with RWA has been that in seasons following outbreaks, yield losses are generally lower as growers are better equipped to detect and manage infestations, and natural enemies establish and contribute to the suppression of populations. In South Australia and Victoria in 2016, infested crops that were treated to control RWA, recovered to grow and yield normally.
It is inevitable that RWA will establish in the northern grains region, but we don’t know when we will begin to see it in crops. Given how widely distributed RWA is in SA and Victoria, it seems likely that RWA has been in Australia for some time prior to the 2016 outbreak. An outbreak is most likely in the event of favourable conditions for RWA populations to over‐summer, build up in winter and move into early crops in autumn. The environmental conditions that favoured the outbreak in the southern region were a wet summer (summer hosts), a warm autumn and early sowing of winter cereals (favour rapid population growth and movement from weed hosts to crops). In addition to crop hosts, non‐crop and pasture grass species in the genera Poa, Bromus, Hordeum, Lolium, and Phalaris may also host RWA. It remains to be seen whether RWA over‐summer on grass hosts or crops (e.g. sorghum, maize, millet, canary) in the cropping landscape.
In the 2017 season, it is important that crops are monitored more frequently than they might usually be to ensure early detection of RWA, should it occur. In southern Australia (Victoria and South Australia) RWA has been detected in establishing crops already this year. The high rainfall over summer and the abundance of volunteer cereals and grass weeds has provided a green bridge from 2016 to 2017.
Row
ena GR
DC
Grains R
esearch Update 2017
15
Sample for RWA in the same way you would sample for other cereal aphids. Concentrate on the margins of field and in areas of the paddock that are stressed (e.g. dry, wet, root disease). Look for both symptoms (see description below) and the presence of aphids.
The following thresholds are recommended:
Emergence to tillering ‐ 20 RWA per plant; and
Tillering onwards (Z30‐59) – 10 aphids per tiller.
If control of RWA is warranted, there is a current APVMA Emergency Use Permit PER82792 (expires 30 June 2018) is for chlorpyrifos and pirimicarb. Pirimicarb will kill aphids, but not the beneficial insects in the crop. If possible, use this option first to preserve beneficials which may then suppress further outbreaks.
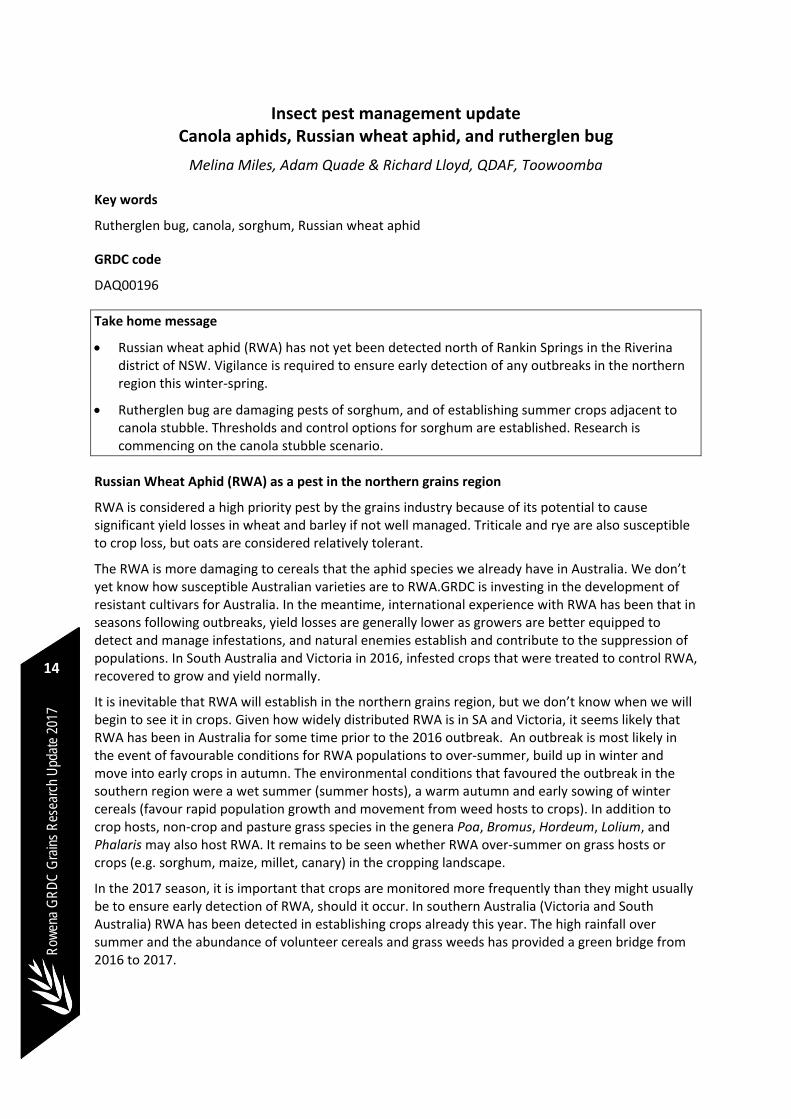
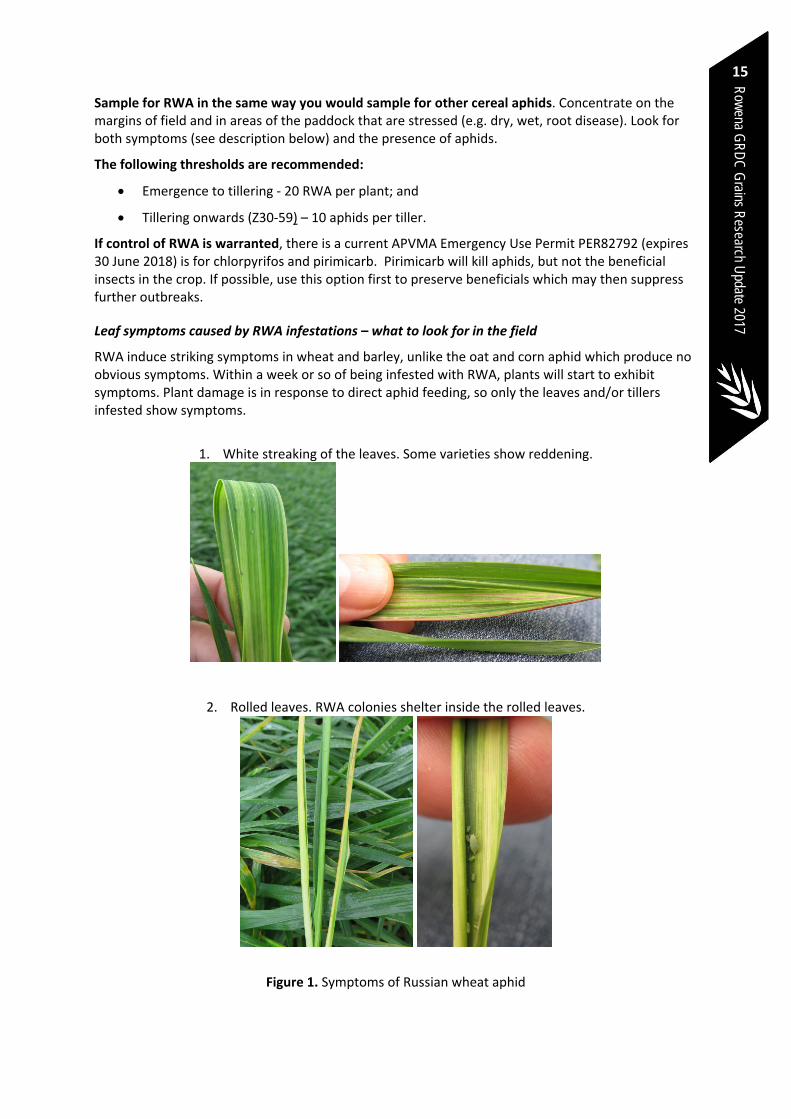
Leaf symptoms caused by RWA infestations – what to look for in the field
RWA induce striking symptoms in wheat and barley, unlike the oat and corn aphid which produce no obvious symptoms. Within a week or so of being infested with RWA, plants will start to exhibit symptoms. Plant damage is in response to direct aphid feeding, so only the leaves and/or tillers infested show symptoms.
1. White streaking of the leaves. Some varieties show reddening.
2. Rolled leaves. RWA colonies shelter inside the rolled leaves.
Figure 1. Symptoms of Russian wheat aphid
Row
ena
GR
DC
Gra
ins
Res
earc
h U
pdat
e 20
17
16
Some of these symptoms are similar to those caused by wheat streak mosaic virus (WSMV) and phenoxy damage in cereals –close examination of symptomatic plants is recommended to check for RWA.
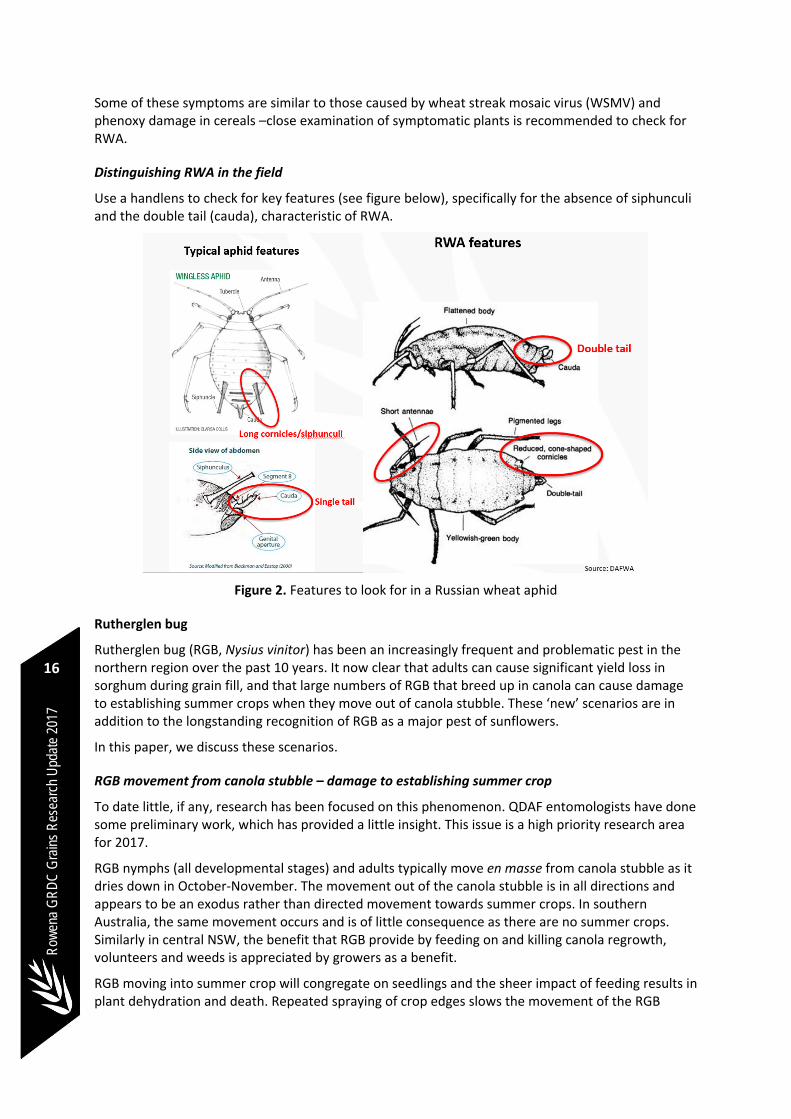
Distinguishing RWA in the field
Use a handlens to check for key features (see figure below), specifically for the absence of siphunculi and the double tail (cauda), characteristic of RWA.
Figure 2. Features to look for in a Russian wheat aphid
Rutherglen bug
Rutherglen bug (RGB, Nysius vinitor) has been an increasingly frequent and problematic pest in the northern region over the past 10 years. It now clear that adults can cause significant yield loss in sorghum during grain fill, and that large numbers of RGB that breed up in canola can cause damage to establishing summer crops when they move out of canola stubble. These ‘new’ scenarios are in addition to the longstanding recognition of RGB as a major pest of sunflowers.
In this paper, we discuss these scenarios.
RGB movement from canola stubble – damage to establishing summer crop
To date little, if any, research has been focused on this phenomenon. QDAF entomologists have done some preliminary work, which has provided a little insight. This issue is a high priority research area for 2017.
RGB nymphs (all developmental stages) and adults typically move en masse from canola stubble as it dries down in October‐November. The movement out of the canola stubble is in all directions and appears to be an exodus rather than directed movement towards summer crops. In southern Australia, the same movement occurs and is of little consequence as there are no summer crops. Similarly in central NSW, the benefit that RGB provide by feeding on and killing canola regrowth, volunteers and weeds is appreciated by growers as a benefit.
RGB moving into summer crop will congregate on seedlings and the sheer impact of feeding results in plant dehydration and death. Repeated spraying of crop edges slows the movement of the RGB
Row
ena GR
DC
Grains R
esearch Update 2017
17
further into the summer crop, but does not prevent the death of plants in rows closest to the canola. The movement from the canola stubble can continue for weeks.
The number of RGB moving has also made barrier strips, ploughed strips and water‐filled channels ineffective in stopping the movement. The absence of effective, long residual products that can be applied to bare earth between canola stubble and summer crops is a major constraint in having a simple management option.
There are 3 key approaches being considered for research to resolve this problem.
1. Preventing the build‐up of RGB populations in canola stubble. Understanding the ecology and behaviour of RGB in the canola crop to determine when eggs are being deposited (in the soil). One of the key questions is around the potential impact of RGB to canola. Knowing what impact RGB has on other crops (sunflower and sorghum) during grain fill, it is possible that there may be benefits to the canola crop from controlling RGB during flowering‐harvest.
2. Effective options to minimise the movement of RGB between canola stubble and summer crop. In the absence of effective bare‐earth residual options, we are considering the potential of trap crops to slow, and possibly stop the movement of RGB. Neonicotinoid seed treatments are essentially a way to deliver a highly effective residual insecticide to RGB. We expect that it may be possible to have migrating RGB populations stop, feed and then die in a trap crop planted between the canola stubble and the susceptible summer crop. The trap crop would be maintained only for the period during which RGB were moving. This approach is completely novel, and will be trialled for the first time in the spring of 2017.
3. Reducing the RGB populations within canola fields. Evaluating options to reduce the size of the population moving out of the stubble through the application of less disruptive options within the canola field. For example, the use of diatomaceous earth, biopesticides, spray oils, swathing insecticide (rather than complete coverage) are options to be trialled for reducing the impact of whole‐field treatment with broad‐spectrum insecticides as is being done currently.
RGB in sorghum
Until 2007, RGB was not considered a major pest of sorghum although it has been recognised as a major pest of sunflowers for a long time. Possibly, RGB were controlled in sorghum when crops were treated for midge. However, in 2007, extremely high infestations of RGB in early sorghum crops resulted in damage; heads with low percentage of seed set. In 2007‐08, QDAF entomologists undertook research to understand the impact of RGB in sorghum.
In 2016‐17, RGB populations were extremely high, and they persisted in crops for weeks. At the same time, heatwave conditions were affecting sorghum crops. In combination, the RGB and the heat resulted in many sorghum crops with low yields and poor quality. In this paper, we describe RGB damage, so it can be distinguished from heat damage.
As if this wasn’t enough, control of RGB proved to be a challenge for some. Questions were asked about the efficacy of products and the possibility that RGB were resistant to some insecticides. In response to the challenges with effective control of RGB in 2016‐17, QDAF entomologists screened a large number of insecticides to evaluate both contact and residual efficacy. The results of this work, as it relates to RGB control in sorghum, are presented here.
RGB damage and thresholds in sorghum
Rutherglen bug females need to feed on developing seed before they can start to produce eggs. Consequently, damage to sorghum at the susceptible crop stages (flowering – soft dough) is caused by adults only. Nymphs are generally present in sorghum crops as the grain starts to colour.
Row
ena
GR
DC
Gra
ins
Res
earc
h U
pdat
e 20
17
18
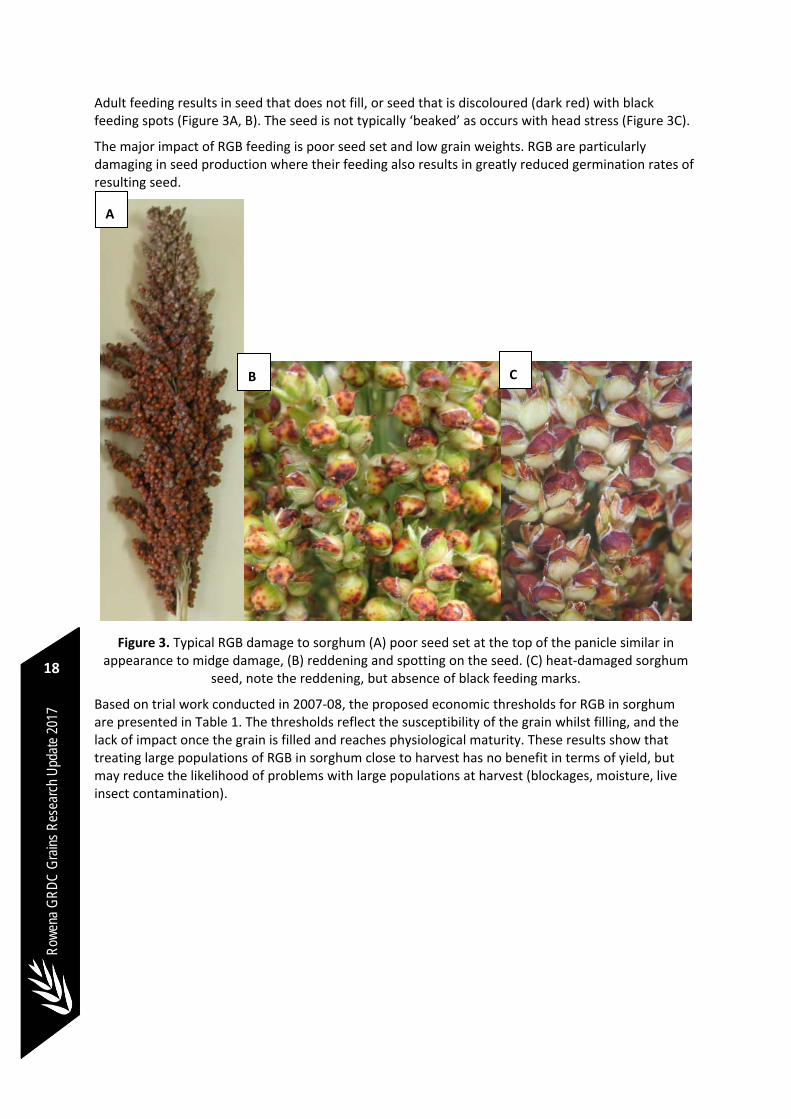
Adult feeding results in seed that does not fill, or seed that is discoloured (dark red) with black feeding spots (Figure 3A, B). The seed is not typically ‘beaked’ as occurs with head stress (Figure 3C).
The major impact of RGB feeding is poor seed set and low grain weights. RGB are particularly damaging in seed production where their feeding also results in greatly reduced germination rates of resulting seed.
Figure 3. Typical RGB damage to sorghum (A) poor seed set at the top of the panicle similar in appearance to midge damage, (B) reddening and spotting on the seed. (C) heat‐damaged sorghum
seed, note the reddening, but absence of black feeding marks.
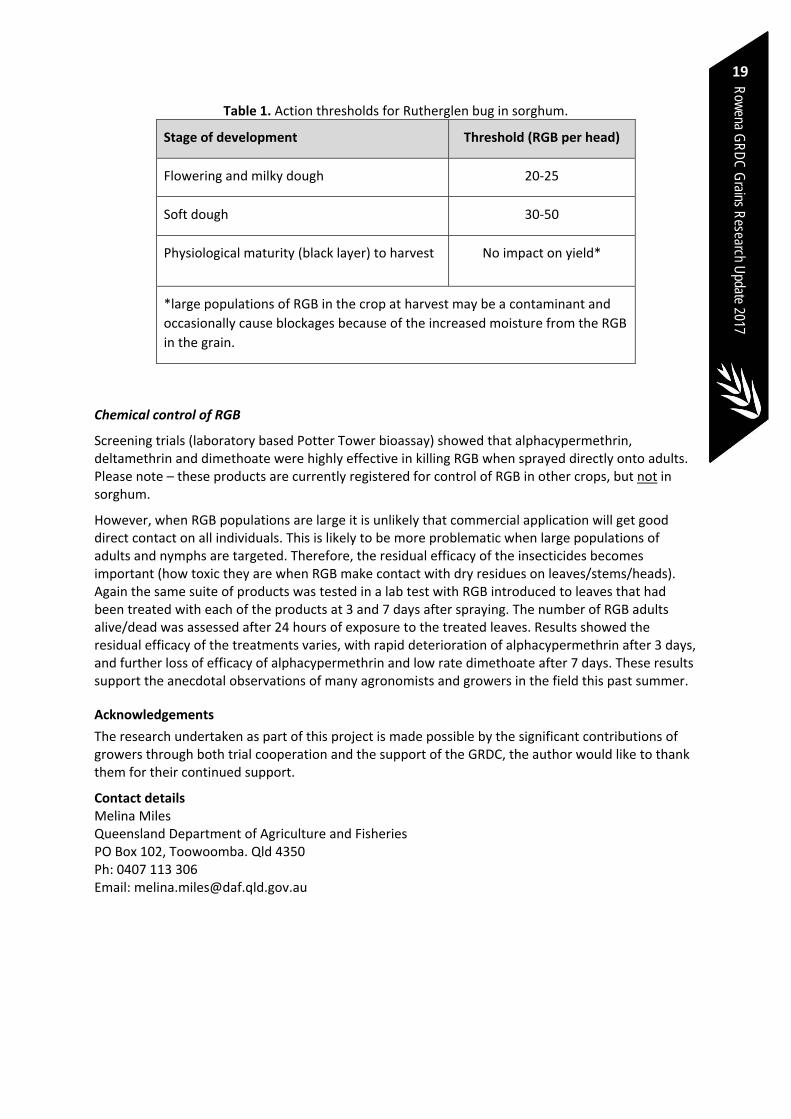
Based on trial work conducted in 2007‐08, the proposed economic thresholds for RGB in sorghum are presented in Table 1. The thresholds reflect the susceptibility of the grain whilst filling, and the lack of impact once the grain is filled and reaches physiological maturity. These results show that treating large populations of RGB in sorghum close to harvest has no benefit in terms of yield, but may reduce the likelihood of problems with large populations at harvest (blockages, moisture, live insect contamination).
A
B C
Row
ena GR
DC
Grains R
esearch Update 2017
19
Table 1. Action thresholds for Rutherglen bug in sorghum.
Stage of development Threshold (RGB per head)
Flowering and milky dough 20‐25
Soft dough 30‐50
Physiological maturity (black layer) to harvest No impact on yield*
*large populations of RGB in the crop at harvest may be a contaminant and
occasionally cause blockages because of the increased moisture from the RGB
in the grain.
Chemical control of RGB
Screening trials (laboratory based Potter Tower bioassay) showed that alphacypermethrin, deltamethrin and dimethoate were highly effective in killing RGB when sprayed directly onto adults. Please note – these products are currently registered for control of RGB in other crops, but not in sorghum.
However, when RGB populations are large it is unlikely that commercial application will get good direct contact on all individuals. This is likely to be more problematic when large populations of adults and nymphs are targeted. Therefore, the residual efficacy of the insecticides becomes important (how toxic they are when RGB make contact with dry residues on leaves/stems/heads). Again the same suite of products was tested in a lab test with RGB introduced to leaves that had been treated with each of the products at 3 and 7 days after spraying. The number of RGB adults alive/dead was assessed after 24 hours of exposure to the treated leaves. Results showed the residual efficacy of the treatments varies, with rapid deterioration of alphacypermethrin after 3 days, and further loss of efficacy of alphacypermethrin and low rate dimethoate after 7 days. These results support the anecdotal observations of many agronomists and growers in the field this past summer.
Acknowledgements
The research undertaken as part of this project is made possible by the significant contributions of growers through both trial cooperation and the support of the GRDC, the author would like to thank them for their continued support.
Contact details Melina Miles Queensland Department of Agriculture and Fisheries PO Box 102, Toowoomba. Qld 4350 Ph: 0407 113 306 Email: [email protected]
Row
ena
GR
DC
Gra
ins
Res
earc
h U
pdat
e 20
17
20
Buying a new silo ‐ faults & design features to look for
Philip Burrill, DAF Qld
Key words
Buying silos, silo design features, silo faults
GRDC code
PRB00001
Take home messages
Grain silos have a typical working life of 25 to 30 years or more. It is worth investing time to consider the type of silo and its features so it is an asset to the business, not a liability.
Have a mix of silo sizes / capacities that allow for grain quality segregations when required.
Ensure the new silo meets the Australian sealable silo standard (AS2628) so fumigations for grain storage pests are effective.
Silos should be easy to clean – hygiene, fitted with aeration cooling and sealable when fumigation is required.
A safe ladder and work area at the top of the silo is required for both grain inspections and maintenance to rubber seals on lids and vents.
Fumigation
A good starting point is to look for a manufacturer that can guarantee their silos will meet the Australian Standard AS2628. The GRDC extension team, researchers and industry has worked for many years to establish this silo sealing standard. It aims to enable growers to quickly and confidently identify new silos that are designed and built to a quality standard to ensure effective fumigations are achieved when required.
This is absolutely crucial, as it allows growers to store grain for long periods, confident that when storage pests are detected, grain can be effectively fumigated. Australia now only has fumigant (gas) products for controlling live insect pests in stored grain.
When fumigation products like phosphine, sulfuryl fluoride (Profume®), or controlled atmospheres, such as carbon dioxide and nitrogen are used to kill pests, the storage being treated must be able to hold a given concentration of the product in the gas phase for a specified length of time (C X T). In unsealed structures the fumigation gas is lost rapidly, resulting in poor pest control.
What to look for when purchasing silos:
The silo was originally ‘designed’ and built as a sealable silo;
Good quality structural strength in the silo’s steel frame and sheeting to ensure it can still be made gas‐tight for fumigations, after years of use, with only minor maintenance;
Good quality rubber is used on seals around all silo openings;
A system that will apply firm, even pressure right around the rubber seals on openings;
Design & location of silo roof vents for aeration are easy to seal effectively and maintain;
The bottom silo outlet will seal properly against the weight of grain when silo is full;
Bottom outlet can be ‘resealed’ gas‐tight after some grain has been out‐loaded;
Row
ena GR
DC
Grains R
esearch Update 2017
21
Fumigation recirculation plumbing is fitted to larger silo > 150 tonnes capacity; and
Good quality pressure relief valve, UV light resistant, large capacity.
Aeration
Aeration cooling of grain in storage is one of the most valuable, non‐chemical tools we have in Australia for reducing pest problems and maintaining grain quality attributes.
While the low air flows (2 to 4 L/s/t) for aeration cooling won’t reduce grain moisture significantly, it will provide uniform moisture conditions throughout the silo, prevent moisture migration and lower grain temperatures.
The cool, uniform grain conditions that are achieved with effective aeration, slow or stop the insect pest life cycle, reduce mould growth and maintain grain quality. Aeration fans can also be used for ventilation after fumigation, thereby reducing the required ventilation periods to meet residue standards.
Prior to buying silos, it can be helpful to seek independent advice on the appropriate aeration fan size, fan type and the auto controller used to run fans. Not all silo manufacturers or silo suppliers have staff trained in the area of aeration equipment.
What to look for with aeration:
Fan size & specifications ‐ advice on fans suited the size of silo and grain types you will store;
Aeration ducting ‐ suited to grain types stored and ease of cleaning when silo is empty;
Roof vents or ‘Chinaman’ hat vents – correct design with no back‐pressure on fans and easy to access to undertake maintenance; and
Automatic aeration fan controller ‐ good quality unit with reliable service back up if required.
Hygiene
Look for a silo that is easy to clean when it is empty. Look at the internal design, such walls, aeration ducting and perforated flooring. Is it going to trap grain residues in areas that are hard to clean? Insect pests will live and breed in residues left in silos. This allows newly harvested, clean grain to be rapidly infested.
What to look for with hygiene:
Silo internal walls that do not hold grain residues;
Aeration ducting – that is easy to clean when silo is empty;
Full floor, perforated flooring in base of flat bottom silos – if possible, avoid this design. With Australian conditions insects will live under flooring in grain residues that build up over time; and
Silo base structural design – silo base that does not pool water under silo if washing out.
Ease of filling and out‐loading grain
How easy will it be to fill or outload from your silos? The overall storage facility site layout for truck movement, plus matching auger reach heights to silos are the more obvious considerations.
In some cases requesting an additional 20 to 30 cm in the silo base leg height to raise the outlet, can assist with moving auger hoppers into place, or allow for a conveyor belt under a row of silos in the future.

Row
ena
GR
DC
Gra
ins
Res
earc
h U
pdat
e 20
17
22
For the silo top fill point, the top lid rotation position and design needs to be considered to ensure augers can be moved into position without damaging lids, roof ladder rails or vents.
What to look for with filling and out‐loading:
Height of silo base outlet suits your equipment and future out‐load requirements;
Top fill point design provides easy auger access and low risk of damage to top lid; and
Any ground operated top lid opening / closing system is well designed for simple operation.
Selecting the mix of silo sizes & types
Spend time considering your long term future needs of grain types grown and the quality segregation requirements for these grains. Should you purchase four large capacity flat bottom silos, or buy two large capacity silos and a number of medium size cone based silos?
Growers are well aware of the importance of testing for various grain quality attributes at harvest time including the usual ‐ grain moisture content, protein, screening, weather damage grain etc. A mix of storage sizes can allow for grain segregations to achieve optimum dollar return for various grain markets. It may also provide the option to blend where appropriate.
Summary
There are many benefits to on‐farm grain storage, but buying a cheap, poorly designed, inferior silo is going to cause more problems than it is worth over the long term.
Storing grain on farm gives you marketing flexibility and benefits with harvest time logistics, but it only works if every effort is made to ensure grain quality in storage is maintained. The first step is to investing in a quality silo that is an asset to your business.
Further reading
GRDC Factsheet – “ Silos Buyer’s Guide” http://storedgrain.com.au/silo‐buyers‐guide/
GRDC Booklet– “ Grain Storage Facilities – planning for efficiency & quality” http://storedgrain.com.au/grain‐storage‐facilities/
Kondinin – Research Report “Grain Silos” September 2015 No. 068 www.farmingahead.com.au
GRDC booklet – “Fumigating with phosphine, other fumigants and controlled atmospheres” http://storedgrain.com.au/fumigating‐with‐phosphine‐and‐ca/
GRDC ‐ Stored Grain Information Hub: http://storedgrain.com.au
Acknowledgements
The author wishes to acknowledge the significant contributions of Grain growers partnership in on‐farm research, silo manufactures, storage equipment suppliers and DAF Qld’s Postharvest research team. The author would also like to thank GRDC, and GRDC’s national grain storage extension team for their continued support.
Contact details
Philip Burrill Department of Agriculture & Fisheries, AgriScience Qld. Hermitage research facility, 604 Yangan road, Warwick Qld. 4370 Phone: 0427 696 500 or 1800 WEEVIL Email: [email protected]
® Registered Trademark
Row
ena GR
DC
Grains R
esearch Update 2017
23
Spray application tips and tactics
Bill Gordon, Nufarm Australia
Key words
Spray application, spray coverage
Take home message
Product choice and rate, timing and total application volume will normally have the largest impacts on the efficacy achieved from any spray job. The sprayer setup and operating parameters can also have a significant effect on the outcome by affecting the spray coverage on the target, as well as the drift potential. Assessing spray coverage is a simple process that can help to improve the sprayer setup.
Introduction
Throughout the season there are a number of situations where spray applications are made to very different types of targets, often with products that have different types of translocation. This variation generally requires a change in nozzle type or orifice size and the operating parameters to achieve a change in total application volume and/or spray quality.
After adjusting the sprayer setup, being able to determine where the spray droplets are landing allows the operator to change the sprayer setup to improve the coverage for particular spray jobs. Often this requires that the operator is able to assess the impact of changes to the set up on where the droplets land.
A starting point – how many setups should the operator have?
As a general guide, the main spray jobs, application volumes and typical spray qualities required by an operator are covered in table 1. This highlights the fact that often more than 2 sets of nozzles are required to cover all situations.
For each type of spray application there may be subtle variations in the sprayer setup or operation that can be made to improve the coverage. This paper discusses some of the practical considerations the operator should take into account when choosing the set up for various spray jobs throughout a typical season, including the factors influencing spray coverage and how to compare setups and operating parameters for continual improvement.
Row
ena
GR
DC
Gra
ins
Res
earc
h U
pdat
e 20
17
24
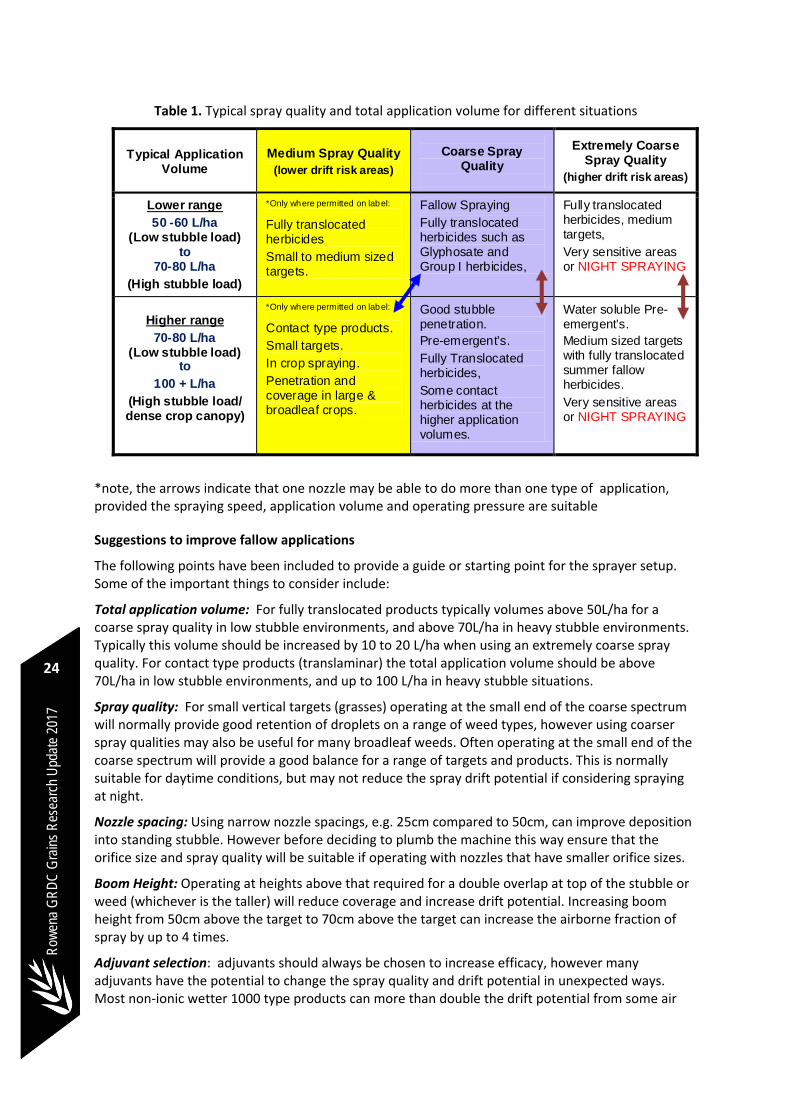
Table 1. Typical spray quality and total application volume for different situations
Typical Application Volume
Medium Spray Quality
(lower drift risk areas)
Coarse Spray Quality
Extremely Coarse Spray Quality
(higher drift risk areas)
Lower range
50 -60 L/ha (Low stubble load)
to 70-80 L/ha
(High stubble load)
*Only where permitted on label:
Fully translocated herbicides
Small to medium sized targets.
Fallow Spraying
Fully translocated herbicides such as Glyphosate and Group I herbicides,
Fully translocated herbicides, medium targets,
Very sensitive areas or NIGHT SPRAYING
Higher range
70-80 L/ha (Low stubble load)
to
100 + L/ha
(High stubble load/ dense crop canopy)
*Only where permitted on label:
Contact type products.
Small targets.
In crop spraying.
Penetration and coverage in large & broadleaf crops.
Good stubble penetration.
Pre-emergent’s.
Fully Translocated herbicides,
Some contact herbicides at the higher application volumes.
Water soluble Pre-emergent’s.
Medium sized targets with fully translocated summer fallow herbicides.
Very sensitive areas or NIGHT SPRAYING
*note, the arrows indicate that one nozzle may be able to do more than one type of application, provided the spraying speed, application volume and operating pressure are suitable
Suggestions to improve fallow applications
The following points have been included to provide a guide or starting point for the sprayer setup. Some of the important things to consider include:
Total application volume: For fully translocated products typically volumes above 50L/ha for a coarse spray quality in low stubble environments, and above 70L/ha in heavy stubble environments. Typically this volume should be increased by 10 to 20 L/ha when using an extremely coarse spray quality. For contact type products (translaminar) the total application volume should be above 70L/ha in low stubble environments, and up to 100 L/ha in heavy stubble situations.
Spray quality: For small vertical targets (grasses) operating at the small end of the coarse spectrum will normally provide good retention of droplets on a range of weed types, however using coarser spray qualities may also be useful for many broadleaf weeds. Often operating at the small end of the coarse spectrum will provide a good balance for a range of targets and products. This is normally suitable for daytime conditions, but may not reduce the spray drift potential if considering spraying at night.
Nozzle spacing: Using narrow nozzle spacings, e.g. 25cm compared to 50cm, can improve deposition into standing stubble. However before deciding to plumb the machine this way ensure that the orifice size and spray quality will be suitable if operating with nozzles that have smaller orifice sizes.
Boom Height: Operating at heights above that required for a double overlap at top of the stubble or weed (whichever is the taller) will reduce coverage and increase drift potential. Increasing boom height from 50cm above the target to 70cm above the target can increase the airborne fraction of spray by up to 4 times.
Adjuvant selection: adjuvants should always be chosen to increase efficacy, however many adjuvants have the potential to change the spray quality and drift potential in unexpected ways. Most non‐ionic wetter 1000 type products can more than double the drift potential from some air

Row
ena GR
DC
Grains R
esearch Update 2017
25
inducted coarse nozzles. For fallow spraying it is important to select adjuvants that do not increase the drift potential of the spray application.
Spraying speed: Reducing spraying speed can reduce dust and wheel tracks, will improve penetration into stubble and crop canopies and can reduce shadowing.
Nozzle design: There are a number of nozzle designs that have twin patterns, where one pattern is angled forward and the other angled backwards. Generally twin nozzles are best utilised for increasing deposition onto vertical targets, which may also increase stubble interception. Twin nozzles are best operated at lower spraying speeds, commonly less than 16 km/h.
Risk assessment: Before any spray application it is important to fully assess any risks including the weather conditions, sensitive areas and volatility risk.
Pre‐emergent herbicides
Most applications of pre‐emergent herbicides will benefit from using coarser spray qualities to increase penetration through stubble and by increasing the total application volume, however volumes above 150 L/a generally do not provide further significant improvements in efficacy.
For products with relatively low water solubility, such as trifluralin and pendimethalin, avoiding the tie up of product onto stubble is critical to maximising herbicide contact with the soil. When using a conventional nozzle spacing of 50cm, a VC spray quality or larger (such as XC) set to produce a double overlap at the top of the stubble can minimise retention on stubbles, however the uniformity of the spray deposit onto the soil surface will be more variable than compared to a coarse spray quality due to the lower number of droplets produced.
For reasonably water soluble products such as atrazine, simazine and metalochlor, interception by the stubble may have a smaller impact on efficacy, provided a reasonable rainfall event can wash the product back onto the soil. Where rainfall is anticipated, the more water soluble products may be applied in a lower total application volume, typically above 70‐80 L/ha.
Generally reducing spraying speeds will improve the penetration into stubble and improve the evenness of the application. Narrower nozzle spacings can also be of benefit, provided the spray quality and boom height are suitable.
Alternately, many operators have plumbed machines with nozzle spacings to match the crop row width. Where nozzles are positioned in the centre of the inter‐row gap between standing stubble lines, the nozzle height may be lowered to obtain an overlap close to the base of the stubble. This may improve soil contact and reduce interception by the stubble, provided spraying speeds and wind speeds do not excessive.
Early season grass sprays in‐crop
Droplet retention on small, vertical grasses is usually optimised when using a medium spray quality (where permitted on label), however in a heavy standing stubble, the smaller droplet sizes tend to increase the amount of product deposited onto the stubble. Generally a spray quality at the smaller end of the coarse spectrum (towards medium) combined with total application volumes above 70‐80 L/ha will provide a reasonable outcome.
Where operators typically operate at higher spraying speeds, or with larger than coarse droplets, they may notice increased shadowing of small weeds behind stubble. Where this is occurring, slowing down would help, but ensuring that each new job is driven in the opposite direction to the last can also improve overall level of control, particularly when a ‘double knock’ strategy is employed.
Row
ena
GR
DC
Gra
ins
Res
earc
h U
pdat
e 20
17
26
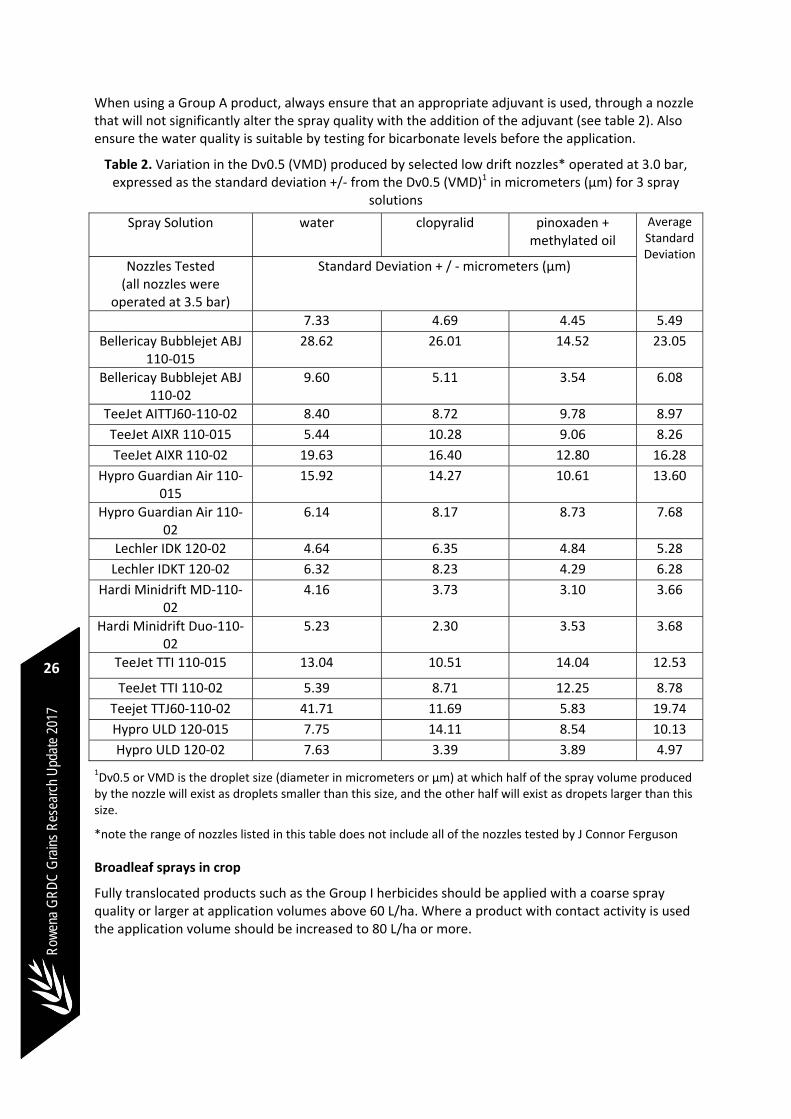
When using a Group A product, always ensure that an appropriate adjuvant is used, through a nozzle that will not significantly alter the spray quality with the addition of the adjuvant (see table 2). Also ensure the water quality is suitable by testing for bicarbonate levels before the application.
Table 2. Variation in the Dv0.5 (VMD) produced by selected low drift nozzles* operated at 3.0 bar, expressed as the standard deviation +/‐ from the Dv0.5 (VMD)1 in micrometers (μm) for 3 spray
solutions
1Dv0.5 or VMD is the droplet size (diameter in micrometers or μm) at which half of the spray volume produced by the nozzle will exist as droplets smaller than this size, and the other half will exist as dropets larger than this size.
*note the range of nozzles listed in this table does not include all of the nozzles tested by J Connor Ferguson
Broadleaf sprays in crop
Fully translocated products such as the Group I herbicides should be applied with a coarse spray quality or larger at application volumes above 60 L/ha. Where a product with contact activity is used the application volume should be increased to 80 L/ha or more.
Spray Solution water clopyralid pinoxaden + methylated oil
Average Standard Deviation
Nozzles Tested (all nozzles were
operated at 3.5 bar)
Standard Deviation + / ‐ micrometers (μm)
7.33 4.69 4.45 5.49
Bellericay Bubblejet ABJ 110‐015
28.62 26.01 14.52 23.05
Bellericay Bubblejet ABJ 110‐02
9.60 5.11 3.54 6.08
TeeJet AITTJ60‐110‐02 8.40 8.72 9.78 8.97
TeeJet AIXR 110‐015 5.44 10.28 9.06 8.26
TeeJet AIXR 110‐02 19.63 16.40 12.80 16.28
Hypro Guardian Air 110‐015
15.92 14.27 10.61 13.60
Hypro Guardian Air 110‐02
6.14 8.17 8.73 7.68
Lechler IDK 120‐02 4.64 6.35 4.84 5.28
Lechler IDKT 120‐02 6.32 8.23 4.29 6.28
Hardi Minidrift MD‐110‐02
4.16 3.73 3.10 3.66
Hardi Minidrift Duo‐110‐02
5.23 2.30 3.53 3.68
TeeJet TTI 110‐015 13.04 10.51 14.04 12.53
TeeJet TTI 110‐02 5.39 8.71 12.25 8.78
Teejet TTJ60‐110‐02 41.71 11.69 5.83 19.74
Hypro ULD 120‐015 7.75 14.11 8.54 10.13
Hypro ULD 120‐02 7.63 3.39 3.89 4.97

Row
ena GR
DC
Grains R
esearch Update 2017
27
Late season applications into dense canopies
Late season fungicide and insecticide applications, along with pre‐harvest desiccation, typically require that the droplets are able to penetrate into the canopy. The size of the canopy and the architecture of the plants will greatly influence how far droplets can penetrate into the canopy.
Leaf type, leaf shape and leaf surface all affect how well droplets will be retained. Droplet retention on most cereals and large grass type crops will be improved by using a medium spray quality (where permitted on label), however penetration through a canopy may be increased using a coarse spray quality. Droplet retention on many broadleaf crops may allow for good retention when using coarse spray qualities.
With a standard boom sprayer there are only a limited number of things the operator can do to potentially improve the penetration into the canopy, those include:
Reducing the spraying speed
Increasing the application volume
Manipulating the spray quality, and
Utilise a narrower nozzle spacing
To make a greater impact on penetration into the canopy generally requires the use air assistance to help transport droplets into the canopy. While the addition of air into the equation can add another layer of complexity to the sprayer setup, it can also provide large improvements in canopy penetration when correctly setup and adjusted.
To assess which variations in the sprayer setup and operating parameters can actually improve the penetration into dense canopies, useful tools include water sensitive paper (WSP) and the SNAPCARD app, which can help the operator to determine where improvements are being made.
Consider assessing spray deposits to improve your spray coverage
Using tools such as water sensitive paper will allow the operator to look at where the droplets are landing and to compare various sprayer setups to see which ones provide the best coverage.
Often it is difficult to see small improvements in coverage. A tool that can measure the level of spray deposit can assist when trying to evaluate changes. The SNAPCARD app allows spray operators to measure the spray deposits onto water sensitive paper by indicating a ‘percent coverage.’ Taking regular measurements and recording this information allows for continual improvements in the sprayer setup for different types of spray applications.
Further reading
https://grdc.com.au/GrowNotesSprayApplication
Contact details
Bill Gordon Nufarm Australia Limited 11 Hienneman Road, Wellcamp, Q.4350 Ph: 0418 794 514 Email: [email protected]
Row
ena
GR
DC
Gra
ins
Res
earc
h U
pdat
e 20
17
28
10 tips for reducing spray drift
Bill Gordon, Nufarm Australia
Key words
spray drift reduction, spray application
Take home message
Spray operators need to understand and adjust the variables they have direct control over to minimise the risk of off target movement of spray. Where they are not able to control factors, such as the weather, they must access reliable forecast information to plan when to apply products at times of lowest risk.
1. Choose all products in the tank mix carefully, this includes the choice of active ingredient, the
formulation type and the adjuvant used. Tools are now available to assess the impact of tank
mix on the percentage of drift prone droplets produced.
2. Understand the products mode of action and coverage requirements on the target– read the
crop protection product label and technical literature for guidance on spray quality, buffer (no‐
spray) zones and wind speed requirements.
3. Select the coarsest spray quality that will provide an acceptable level of control. Be prepared to
increase application volumes when coarser spray qualities are used, or when the delta T value
approaches 10 to 12. Use water sensitive paper and the SnapCard® app to assess the impact of
coarser spray qualities on coverage at the target.
4. Always expect that surface temperature inversions will form later in the day, as sunset
approaches, and they are likely to persist overnight and beyond sunrise on many occasions. If
the spray operator cannot determine that an inversion is not present, then no spraying should
occur.
5. Use weather forecasting information to plan the application. Bureau of Meteorology (BOM)
meteograms and forecasting websites can provide information on likely wind speed and
direction for 5 to 7 days in advance of the intended day of spraying. Pay close attention to
variations between predicted maximum and minimum temperatures above 5 to7 degrees
Celsius, delta T values below 2, low overnight wind speeds (less than 11 km/h) and predictions
of dew or frost as these all indicate the likely presence of a surface inversion.
6. Only start spraying after the sun has risen more than 20 degrees above the horizon and the wind
speed has been above 4 to 5 km/h for more than 20 to 30 minutes, with a clear direction that is
away from adjacent sensitive areas.
7. Set the boom height to achieve double overlap of the spray patterns. With a 110 degree nozzle
using a 50cm nozzle spacing, this is 50cm above the top of the stubble or crop canopy. Boom

Row
ena GR
DC
Grains R
esearch Update 2017
29
height and stability is critical, use height control systems for wider booms or reduce the spraying
speed to avoid boom bounce.
8. Avoid high spraying speeds, particularly when ground cover is minimal. Spraying speeds above
16 to 18 km/h with trailing rigs, and above 20 to 22 km/h with self‐propelled sprayers greatly
increase losses due to affects at the nozzle and the aerodynamics of the machine.
9. Be prepared to leave unsprayed buffers when the label requires, or when the wind direction is
towards sensitive areas. For ground application of non‐volatile products using a coarse spray
quality (or larger) during daylight hours and wind speeds between 3 and 20 km/h a 300m
downwind buffer is generally sufficient, however you should always refer to the spray drift
restraints on the product label. Smaller spray qualities will require larger buffers.
10. Continually monitor the weather conditions at the site of application. Always measure and
record the wind speed, wind direction, temperature and relative humidity at the start of
spraying and at the end of every tank, according to the label requirements. Label ‘no‐spray’
zones and downwind buffer distances are based on wind measurements at 2m above the
ground.
Contact details
Bill Gordon Spray Application Specialist ‐ Nufarm Australia Email: [email protected] Mobile: 0418 794 514
® Registered trademark
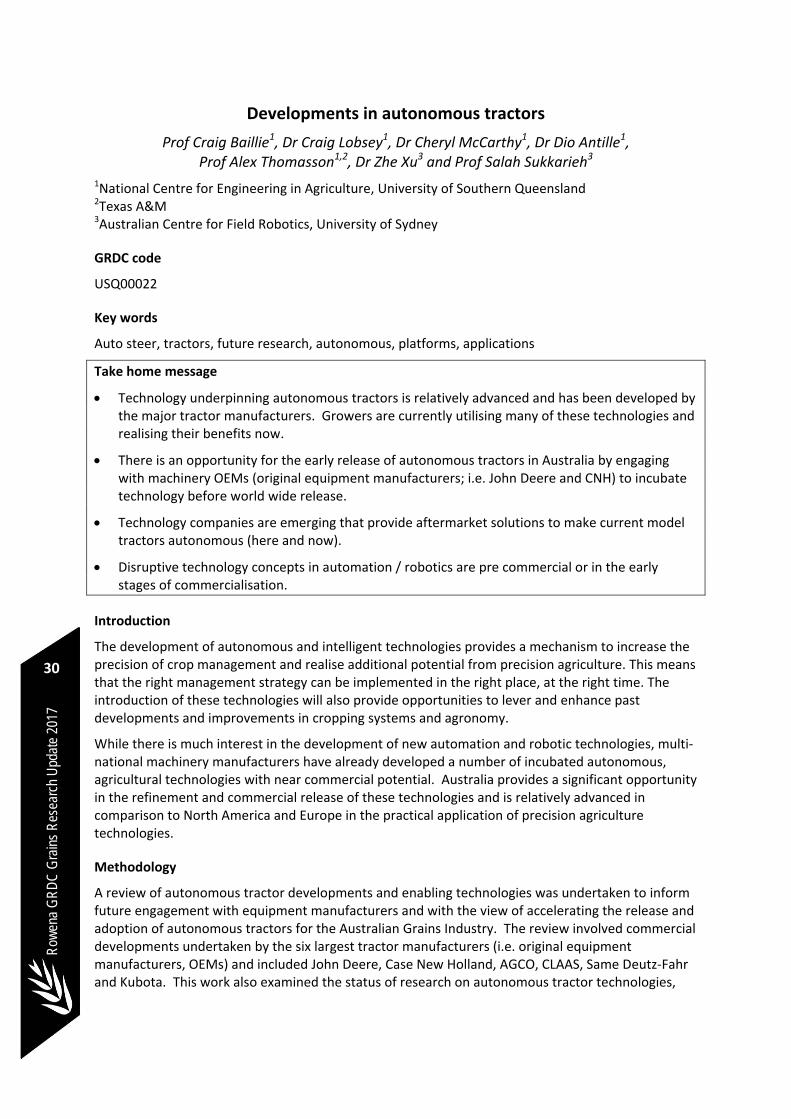
Row
ena
GR
DC
Gra
ins
Res
earc
h U
pdat
e 20
17
30
Developments in autonomous tractors
Prof Craig Baillie1, Dr Craig Lobsey1, Dr Cheryl McCarthy1, Dr Dio Antille1, Prof Alex Thomasson1,2, Dr Zhe Xu3 and Prof Salah Sukkarieh3
1National Centre for Engineering in Agriculture, University of Southern Queensland 2Texas A&M 3Australian Centre for Field Robotics, University of Sydney
GRDC code
USQ00022
Key words
Auto steer, tractors, future research, autonomous, platforms, applications
Take home message
Technology underpinning autonomous tractors is relatively advanced and has been developed by the major tractor manufacturers. Growers are currently utilising many of these technologies and realising their benefits now.
There is an opportunity for the early release of autonomous tractors in Australia by engaging with machinery OEMs (original equipment manufacturers; i.e. John Deere and CNH) to incubate technology before world wide release.
Technology companies are emerging that provide aftermarket solutions to make current model tractors autonomous (here and now).
Disruptive technology concepts in automation / robotics are pre commercial or in the early stages of commercialisation.
Introduction
The development of autonomous and intelligent technologies provides a mechanism to increase the precision of crop management and realise additional potential from precision agriculture. This means that the right management strategy can be implemented in the right place, at the right time. The introduction of these technologies will also provide opportunities to lever and enhance past developments and improvements in cropping systems and agronomy.
While there is much interest in the development of new automation and robotic technologies, multi‐national machinery manufacturers have already developed a number of incubated autonomous, agricultural technologies with near commercial potential. Australia provides a significant opportunity in the refinement and commercial release of these technologies and is relatively advanced in comparison to North America and Europe in the practical application of precision agriculture technologies.
Methodology
A review of autonomous tractor developments and enabling technologies was undertaken to inform future engagement with equipment manufacturers and with the view of accelerating the release and adoption of autonomous tractors for the Australian Grains Industry. The review involved commercial developments undertaken by the six largest tractor manufacturers (i.e. original equipment manufacturers, OEMs) and included John Deere, Case New Holland, AGCO, CLAAS, Same Deutz‐Fahr and Kubota. This work also examined the status of research on autonomous tractor technologies,

Row
ena GR
DC
Grains R
esearch Update 2017
31
the current status of intellectual property in this space, aftermarket technology developments, fully autonomous tractor concepts and emerging technologies.
Results and discussion
OEM developments
Autonomous vehicle enabling technologies are relatively advanced in agriculture and informed by both the potential for efficiency gains from more precise operation of tractors and the laborious, systematic nature of machine operation in agriculture. The agricultural operating environment is also conveniently suited to automation with vehicles operating in large, well defined open areas that are relatively free of obstruction and personnel.
A number of technologies have been developed over the last two decades to improve the operational efficiency and productivity of tractors (e.g. guidance, drive‐by‐wire, continuously variable transmissions). Technologies have also been developed to improve management of crops using precision agriculture (PA) techniques (e.g. precision seeding, variable rate application, yield monitoring). Machine to machine communications are improving logistics and coordination between multiple vehicles and new telematics solutions are now available that provide in‐field management of tractor operations and monitoring of vehicle performance. These technologies are routinely used today and there is a range of products commercially available or in active development. While these technologies are being developed as products to augment human operation of the tractor, they form key technological elements of full tractor autonomy (i.e. a pathway to autonomy).
Each of the 6 major tractor manufacturers has made significant developments that inform key components of an autonomous tractor and essentially a technology pathway to autonomy. Currently this technology has been developed to augment human operations which are currently accessible via features or product offerings on tractors commercially sold and available to Australian farmers including the following:
hands free tractor / implement guidance including Global Navigation Satellite System (GNSS; eg GPS and GLONASS) and vision based solutions;
variable rate control including functionality where the tractor and implement (i.e. seeding, spraying, fertilising etc.) operate in concert;
machine optimisation via constantly varying transmissions and adaptive control to environmental conditions and work requirements;
path planning / automated machine operations which includes auto turn and auto control of implement functionality for example, raising and lowering, starting and stopping operations (i.e. seeding, spraying, fertilising etc.);
sensing and perception which includes interaction / awareness of the machine and i) the surrounding environment, ii) the crop and iii) the task being undertaken; and
telematics and infield communications for remote control of tractor operations and uploading of task related data.
Table 1 provides a summary of these features which indicate each of the 6 major tractor manufacturers has made significant developments that inform key components of an autonomous tractor and essentially a technology pathway to autonomy. Currently this technology has been developed to augment human operations which are currently accessible via features or product offerings on tractors commercially sold and available to Australian farmers.
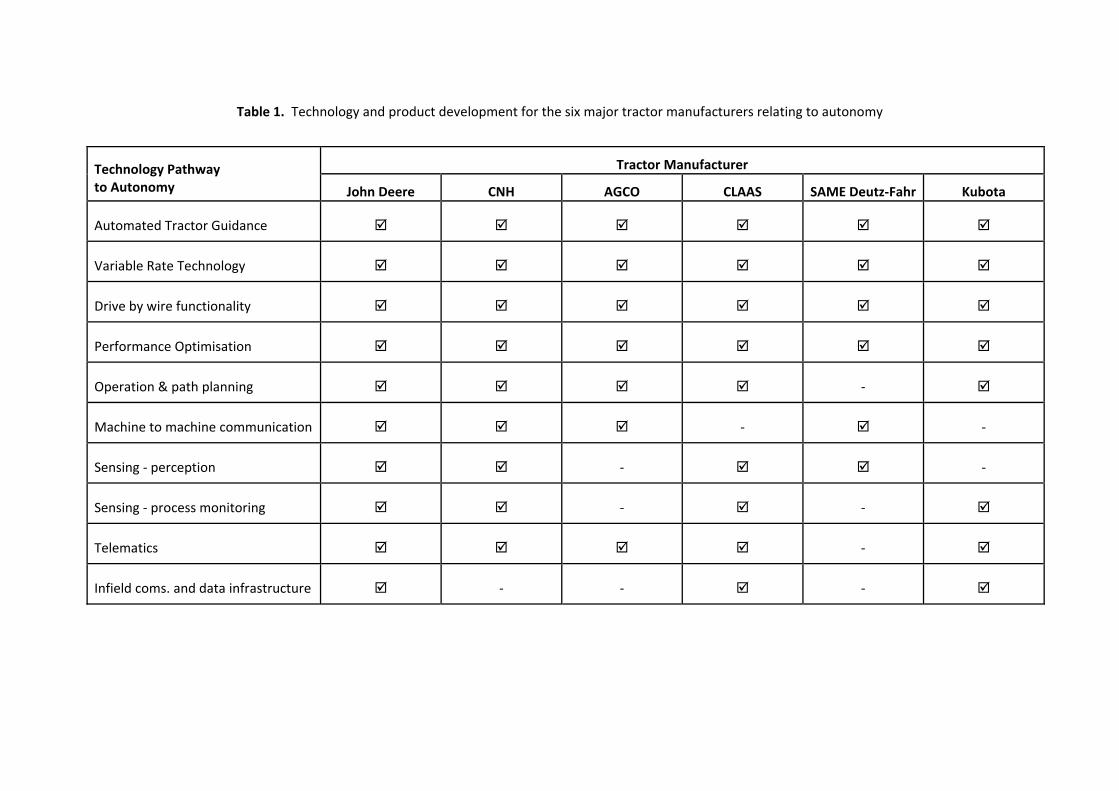
Table 1. Technology and product development for the six major tractor manufacturers relating to autonomy
Technology Pathway to Autonomy
Tractor Manufacturer
John Deere CNH AGCO CLAAS SAME Deutz‐Fahr Kubota
Automated Tractor Guidance
Variable Rate Technology
Drive by wire functionality
Performance Optimisation
Operation & path planning ‐
Machine to machine communication ‐ ‐
Sensing ‐ perception ‐ ‐
Sensing ‐ process monitoring ‐ ‐
Telematics ‐
Infield coms. and data infrastructure ‐ ‐ ‐
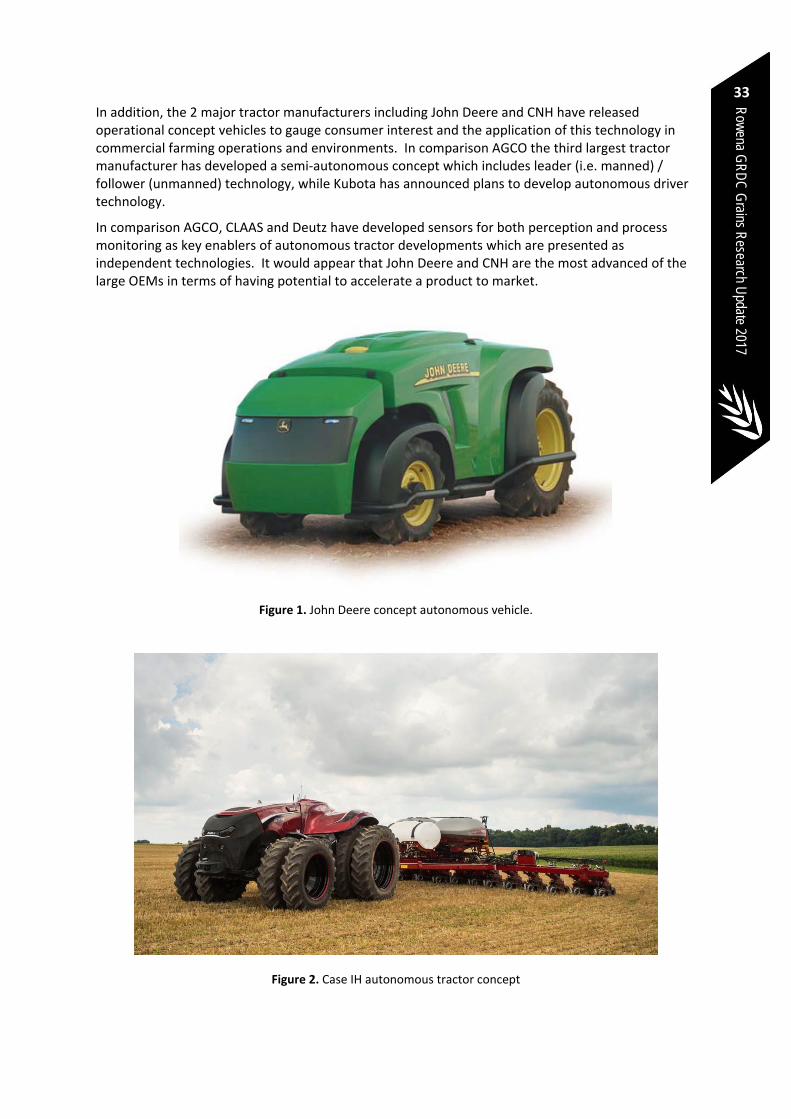
Row
ena GR
DC
Grains R
esearch Update 2017
33 In addition, the 2 major tractor manufacturers including John Deere and CNH have released operational concept vehicles to gauge consumer interest and the application of this technology in commercial farming operations and environments. In comparison AGCO the third largest tractor manufacturer has developed a semi‐autonomous concept which includes leader (i.e. manned) / follower (unmanned) technology, while Kubota has announced plans to develop autonomous driver technology.
In comparison AGCO, CLAAS and Deutz have developed sensors for both perception and process monitoring as key enablers of autonomous tractor developments which are presented as independent technologies. It would appear that John Deere and CNH are the most advanced of the large OEMs in terms of having potential to accelerate a product to market.
Figure 1. John Deere concept autonomous vehicle.
Figure 2. Case IH autonomous tractor concept
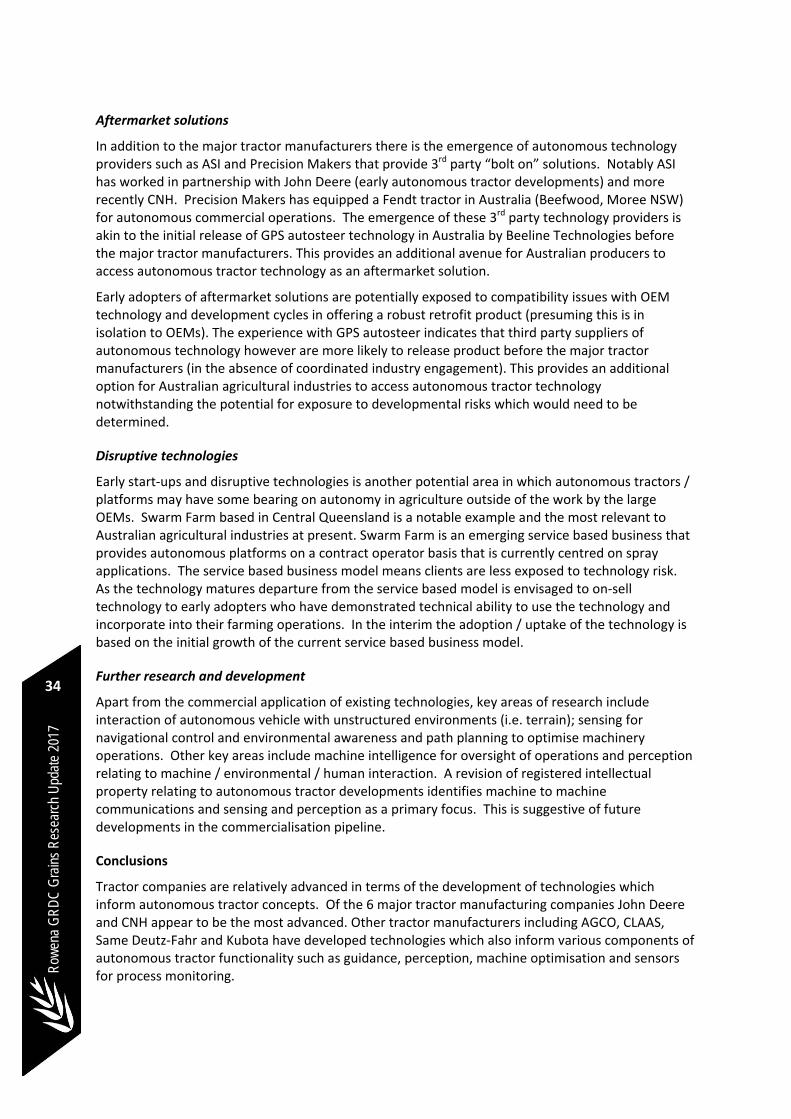
Row
ena
GR
DC
Gra
ins
Res
earc
h U
pdat
e 20
17
34
Aftermarket solutions
In addition to the major tractor manufacturers there is the emergence of autonomous technology providers such as ASI and Precision Makers that provide 3rd party “bolt on” solutions. Notably ASI has worked in partnership with John Deere (early autonomous tractor developments) and more recently CNH. Precision Makers has equipped a Fendt tractor in Australia (Beefwood, Moree NSW) for autonomous commercial operations. The emergence of these 3rd party technology providers is akin to the initial release of GPS autosteer technology in Australia by Beeline Technologies before the major tractor manufacturers. This provides an additional avenue for Australian producers to access autonomous tractor technology as an aftermarket solution.
Early adopters of aftermarket solutions are potentially exposed to compatibility issues with OEM technology and development cycles in offering a robust retrofit product (presuming this is in isolation to OEMs). The experience with GPS autosteer indicates that third party suppliers of autonomous technology however are more likely to release product before the major tractor manufacturers (in the absence of coordinated industry engagement). This provides an additional option for Australian agricultural industries to access autonomous tractor technology notwithstanding the potential for exposure to developmental risks which would need to be determined.
Disruptive technologies
Early start‐ups and disruptive technologies is another potential area in which autonomous tractors / platforms may have some bearing on autonomy in agriculture outside of the work by the large OEMs. Swarm Farm based in Central Queensland is a notable example and the most relevant to Australian agricultural industries at present. Swarm Farm is an emerging service based business that provides autonomous platforms on a contract operator basis that is currently centred on spray applications. The service based business model means clients are less exposed to technology risk. As the technology matures departure from the service based model is envisaged to on‐sell technology to early adopters who have demonstrated technical ability to use the technology and incorporate into their farming operations. In the interim the adoption / uptake of the technology is based on the initial growth of the current service based business model.
Further research and development
Apart from the commercial application of existing technologies, key areas of research include interaction of autonomous vehicle with unstructured environments (i.e. terrain); sensing for navigational control and environmental awareness and path planning to optimise machinery operations. Other key areas include machine intelligence for oversight of operations and perception relating to machine / environmental / human interaction. A revision of registered intellectual property relating to autonomous tractor developments identifies machine to machine communications and sensing and perception as a primary focus. This is suggestive of future developments in the commercialisation pipeline.
Conclusions
Tractor companies are relatively advanced in terms of the development of technologies which inform autonomous tractor concepts. Of the 6 major tractor manufacturing companies John Deere and CNH appear to be the most advanced. Other tractor manufacturers including AGCO, CLAAS, Same Deutz‐Fahr and Kubota have developed technologies which also inform various components of autonomous tractor functionality such as guidance, perception, machine optimisation and sensors for process monitoring.

Row
ena GR
DC
Grains R
esearch Update 2017
35 In addition to the large tractor manufacturers is the emergence of technology companies providing aftermarket solutions. Similar to the advent of GPS auto steer, these companies provide an independent opportunity for farming enterprises to engage in autonomous tractor technology. The compatibility and field readiness of these technologies requires further investigation although it is noted that there are some examples of deployment under commercial operating conditions.
Emerging / disruptive technologies also feature as a potential opportunity for autonomous technologies on farm and a number of companies have developed platforms that are pre commercial or in the early stages of commercial release. In comparison to the large tractor manufacturers the accelerated roll out of these technologies will be tempered by early adopter interest in new technology and farming systems concepts as well as the establishment of dealer network and support services.
Acknowledgement of GRDC
The research undertaken as part of this project is made possible by the significant contribution of growers through the support of GRDC. The authors would like to thank them for their continued support. This paper is an extract from the final report for project USQ00022 – Future FARM Theme 3 Intelligent Infrastructure Phase 1 Review.
Contact details
Craig Baillie University of Southern Queensland Mb: 0428 750 060 Email: [email protected]
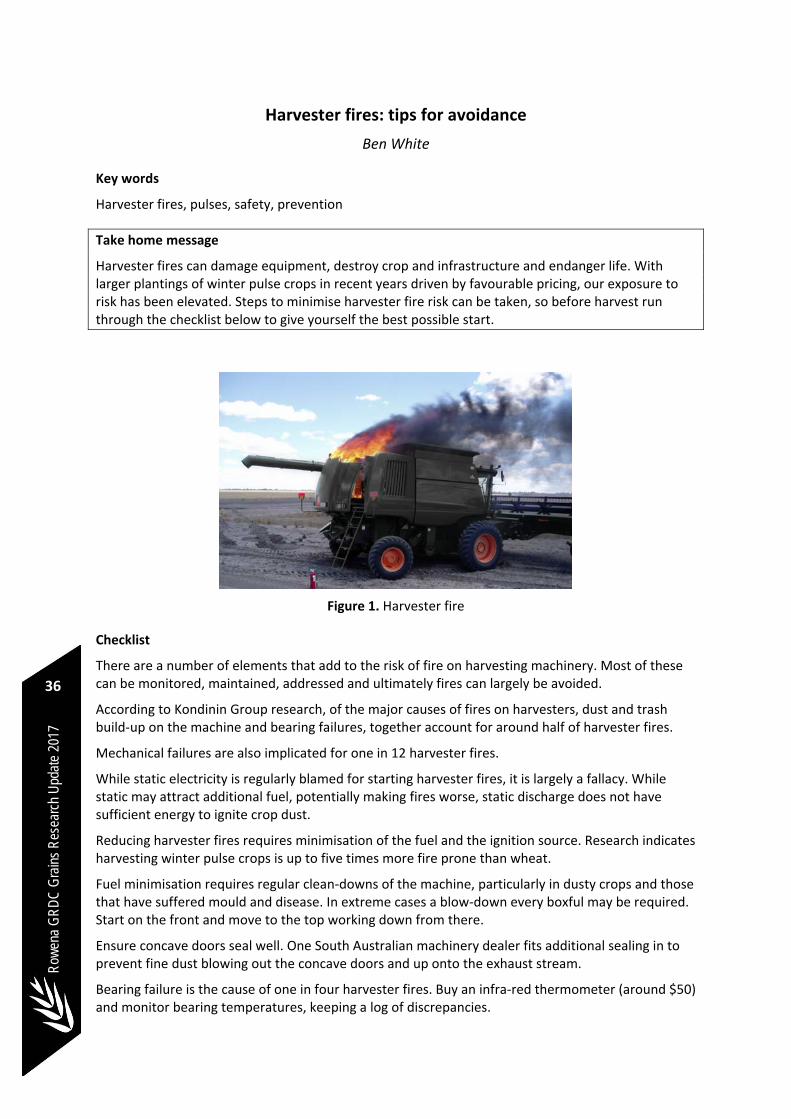
Row
ena
GR
DC
Gra
ins
Res
earc
h U
pdat
e 20
17
36
Harvester fires: tips for avoidance
Ben White
Key words
Harvester fires, pulses, safety, prevention
Take home message
Harvester fires can damage equipment, destroy crop and infrastructure and endanger life. With larger plantings of winter pulse crops in recent years driven by favourable pricing, our exposure to risk has been elevated. Steps to minimise harvester fire risk can be taken, so before harvest run through the checklist below to give yourself the best possible start.
Figure 1. Harvester fire
Checklist
There are a number of elements that add to the risk of fire on harvesting machinery. Most of these can be monitored, maintained, addressed and ultimately fires can largely be avoided.
According to Kondinin Group research, of the major causes of fires on harvesters, dust and trash build‐up on the machine and bearing failures, together account for around half of harvester fires.
Mechanical failures are also implicated for one in 12 harvester fires.
While static electricity is regularly blamed for starting harvester fires, it is largely a fallacy. While static may attract additional fuel, potentially making fires worse, static discharge does not have sufficient energy to ignite crop dust.
Reducing harvester fires requires minimisation of the fuel and the ignition source. Research indicates harvesting winter pulse crops is up to five times more fire prone than wheat.
Fuel minimisation requires regular clean‐downs of the machine, particularly in dusty crops and those that have suffered mould and disease. In extreme cases a blow‐down every boxful may be required. Start on the front and move to the top working down from there.
Ensure concave doors seal well. One South Australian machinery dealer fits additional sealing in to prevent fine dust blowing out the concave doors and up onto the exhaust stream.
Bearing failure is the cause of one in four harvester fires. Buy an infra‐red thermometer (around $50) and monitor bearing temperatures, keeping a log of discrepancies.
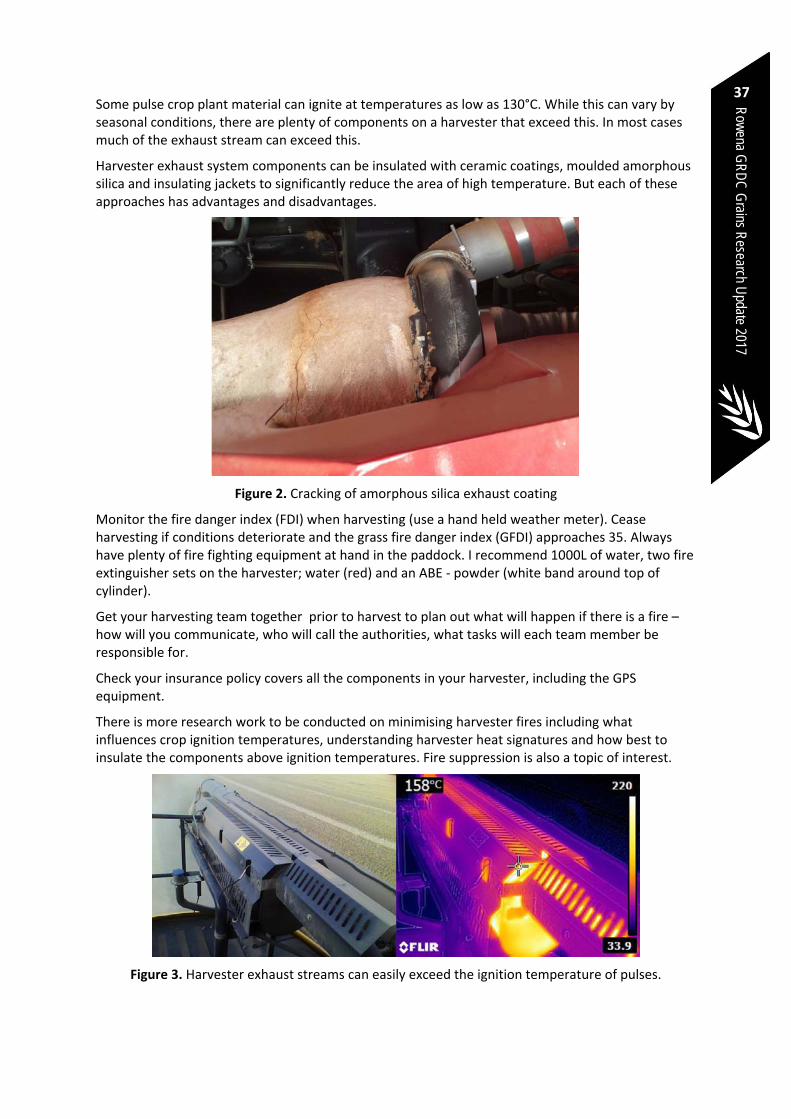
Row
ena GR
DC
Grains R
esearch Update 2017
37 Some pulse crop plant material can ignite at temperatures as low as 130°C. While this can vary by seasonal conditions, there are plenty of components on a harvester that exceed this. In most cases much of the exhaust stream can exceed this.
Harvester exhaust system components can be insulated with ceramic coatings, moulded amorphous silica and insulating jackets to significantly reduce the area of high temperature. But each of these approaches has advantages and disadvantages.
Figure 2. Cracking of amorphous silica exhaust coating
Monitor the fire danger index (FDI) when harvesting (use a hand held weather meter). Cease harvesting if conditions deteriorate and the grass fire danger index (GFDI) approaches 35. Always have plenty of fire fighting equipment at hand in the paddock. I recommend 1000L of water, two fire extinguisher sets on the harvester; water (red) and an ABE ‐ powder (white band around top of cylinder).
Get your harvesting team together prior to harvest to plan out what will happen if there is a fire – how will you communicate, who will call the authorities, what tasks will each team member be responsible for.
Check your insurance policy covers all the components in your harvester, including the GPS equipment.
There is more research work to be conducted on minimising harvester fires including what influences crop ignition temperatures, understanding harvester heat signatures and how best to insulate the components above ignition temperatures. Fire suppression is also a topic of interest.
Figure 3. Harvester exhaust streams can easily exceed the ignition temperature of pulses.

Row
ena
GR
DC
Gra
ins
Res
earc
h U
pdat
e 20
17
38
Acknowledgements
Ben White and the late Dr Graeme Quick previously worked together to produce the GRDC Reducing Harvester Fire Risk: The Back Pocket Guide (DGQ00003). The guide can be accessed from the link: www.grdc.com.au/GRDC‐BPG‐ReducingHarvesterFireRisk
Contact details
Ben White Agricultural Engineer Mb: 0407 941 923 Email: [email protected]
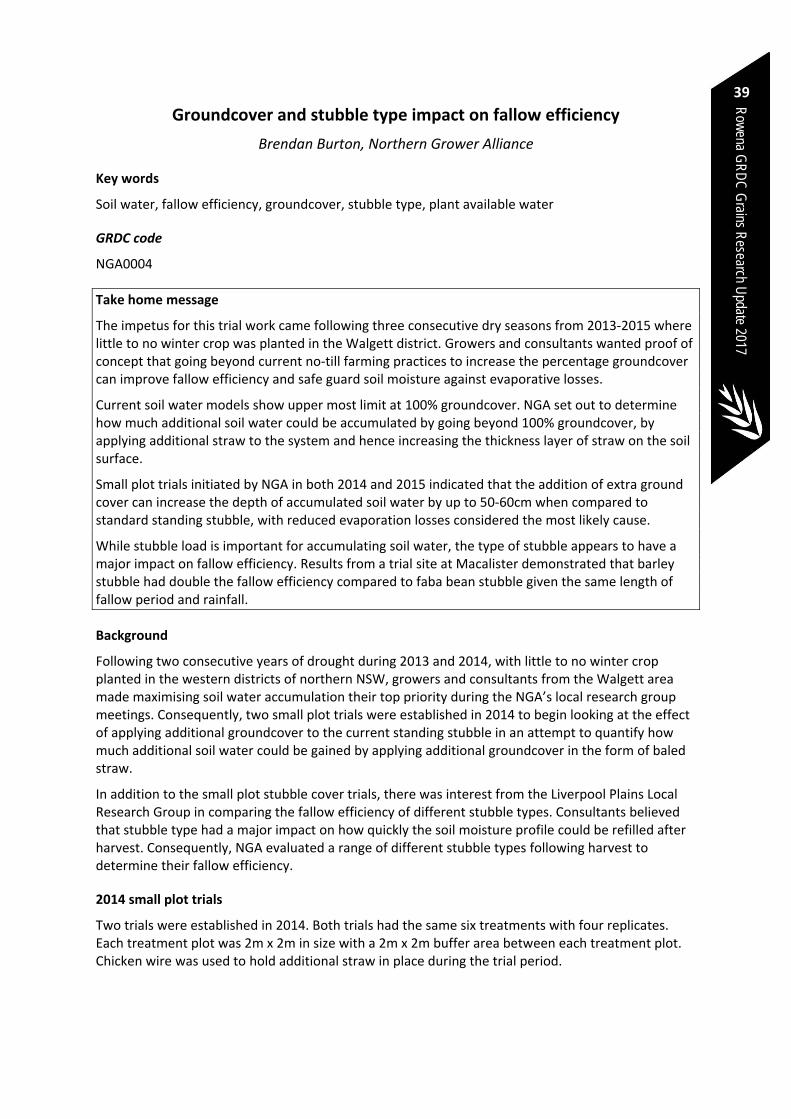
Row
ena GR
DC
Grains R
esearch Update 2017
39
Groundcover and stubble type impact on fallow efficiency
Brendan Burton, Northern Grower Alliance
Key words
Soil water, fallow efficiency, groundcover, stubble type, plant available water
GRDC code
NGA0004
Take home message
The impetus for this trial work came following three consecutive dry seasons from 2013‐2015 where little to no winter crop was planted in the Walgett district. Growers and consultants wanted proof of concept that going beyond current no‐till farming practices to increase the percentage groundcover can improve fallow efficiency and safe guard soil moisture against evaporative losses.
Current soil water models show upper most limit at 100% groundcover. NGA set out to determine how much additional soil water could be accumulated by going beyond 100% groundcover, by applying additional straw to the system and hence increasing the thickness layer of straw on the soil surface.
Small plot trials initiated by NGA in both 2014 and 2015 indicated that the addition of extra ground cover can increase the depth of accumulated soil water by up to 50‐60cm when compared to standard standing stubble, with reduced evaporation losses considered the most likely cause.
While stubble load is important for accumulating soil water, the type of stubble appears to have a major impact on fallow efficiency. Results from a trial site at Macalister demonstrated that barley stubble had double the fallow efficiency compared to faba bean stubble given the same length of fallow period and rainfall.
Background
Following two consecutive years of drought during 2013 and 2014, with little to no winter crop planted in the western districts of northern NSW, growers and consultants from the Walgett area made maximising soil water accumulation their top priority during the NGA’s local research group meetings. Consequently, two small plot trials were established in 2014 to begin looking at the effect of applying additional groundcover to the current standing stubble in an attempt to quantify how much additional soil water could be gained by applying additional groundcover in the form of baled straw.
In addition to the small plot stubble cover trials, there was interest from the Liverpool Plains Local Research Group in comparing the fallow efficiency of different stubble types. Consultants believed that stubble type had a major impact on how quickly the soil moisture profile could be refilled after harvest. Consequently, NGA evaluated a range of different stubble types following harvest to determine their fallow efficiency.
2014 small plot trials
Two trials were established in 2014. Both trials had the same six treatments with four replicates. Each treatment plot was 2m x 2m in size with a 2m x 2m buffer area between each treatment plot. Chicken wire was used to hold additional straw in place during the trial period.
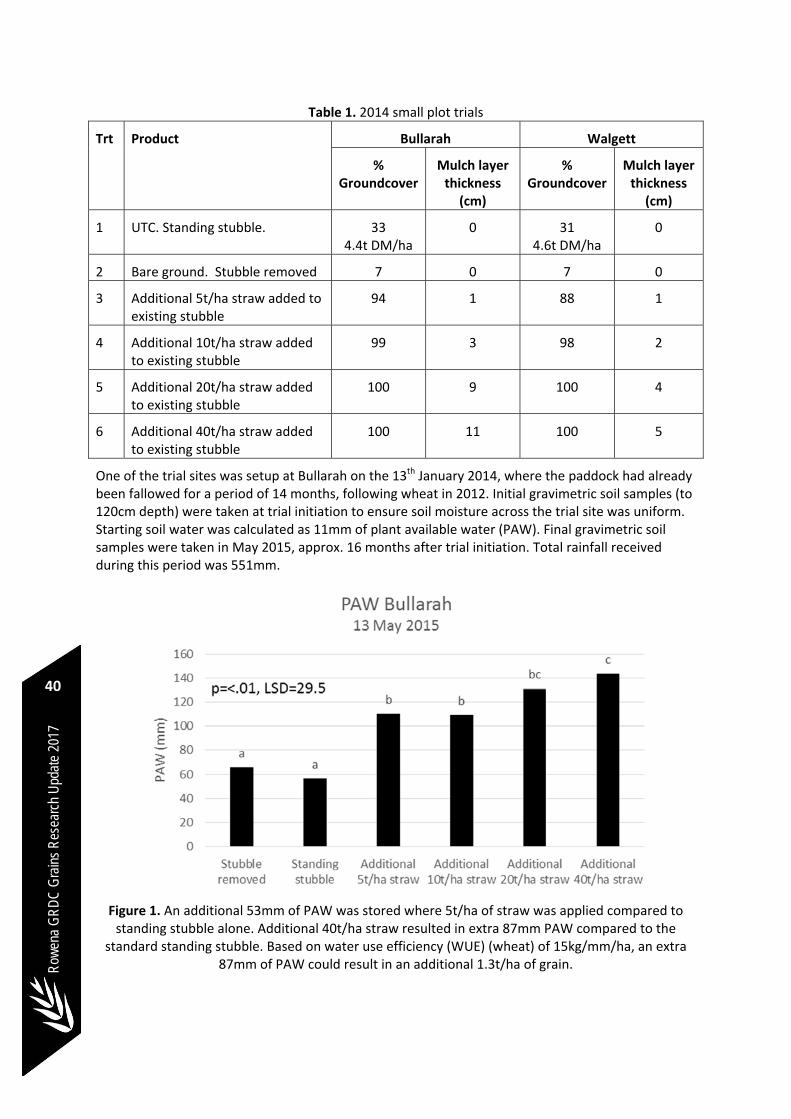
Row
ena
GR
DC
Gra
ins
Res
earc
h U
pdat
e 20
17
40
Table 1. 2014 small plot trials
Trt Product Bullarah Walgett
% Groundcover
Mulch layer thickness (cm)
% Groundcover
Mulch layer thickness (cm)
1 UTC. Standing stubble. 33 4.4t DM/ha
0 31 4.6t DM/ha
0
2 Bare ground. Stubble removed 7 0 7 0
3 Additional 5t/ha straw added to existing stubble
94 1 88 1
4 Additional 10t/ha straw added to existing stubble
99 3 98 2
5 Additional 20t/ha straw added to existing stubble
100 9 100 4
6 Additional 40t/ha straw added to existing stubble
100 11 100 5
One of the trial sites was setup at Bullarah on the 13th January 2014, where the paddock had already been fallowed for a period of 14 months, following wheat in 2012. Initial gravimetric soil samples (to 120cm depth) were taken at trial initiation to ensure soil moisture across the trial site was uniform. Starting soil water was calculated as 11mm of plant available water (PAW). Final gravimetric soil samples were taken in May 2015, approx. 16 months after trial initiation. Total rainfall received during this period was 551mm.
Figure 1. An additional 53mm of PAW was stored where 5t/ha of straw was applied compared to standing stubble alone. Additional 40t/ha straw resulted in extra 87mm PAW compared to the
standard standing stubble. Based on water use efficiency (WUE) (wheat) of 15kg/mm/ha, an extra 87mm of PAW could result in an additional 1.3t/ha of grain.
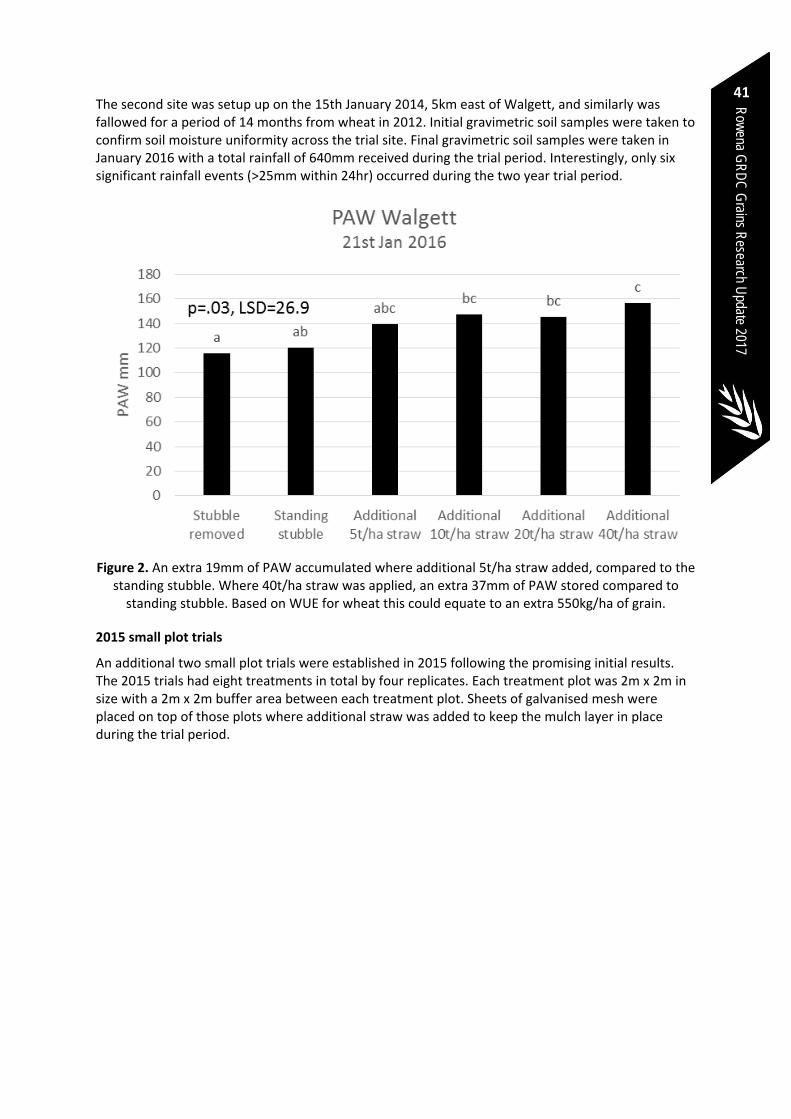
Row
ena GR
DC
Grains R
esearch Update 2017
41 The second site was setup up on the 15th January 2014, 5km east of Walgett, and similarly was fallowed for a period of 14 months from wheat in 2012. Initial gravimetric soil samples were taken to confirm soil moisture uniformity across the trial site. Final gravimetric soil samples were taken in January 2016 with a total rainfall of 640mm received during the trial period. Interestingly, only six significant rainfall events (>25mm within 24hr) occurred during the two year trial period.
Figure 2. An extra 19mm of PAW accumulated where additional 5t/ha straw added, compared to the standing stubble. Where 40t/ha straw was applied, an extra 37mm of PAW stored compared to standing stubble. Based on WUE for wheat this could equate to an extra 550kg/ha of grain.
2015 small plot trials
An additional two small plot trials were established in 2015 following the promising initial results. The 2015 trials had eight treatments in total by four replicates. Each treatment plot was 2m x 2m in size with a 2m x 2m buffer area between each treatment plot. Sheets of galvanised mesh were placed on top of those plots where additional straw was added to keep the mulch layer in place during the trial period.
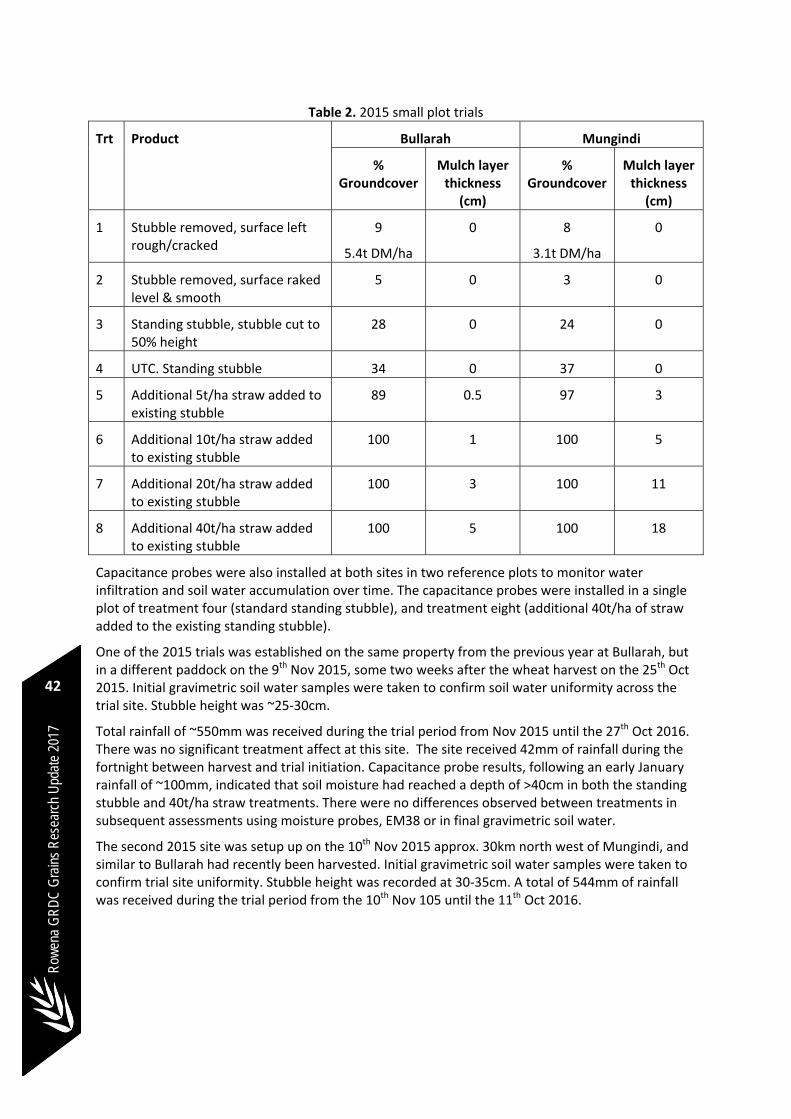
Row
ena
GR
DC
Gra
ins
Res
earc
h U
pdat
e 20
17
42
Table 2. 2015 small plot trials
Trt Product Bullarah Mungindi
% Groundcover
Mulch layer thickness (cm)
% Groundcover
Mulch layer thickness (cm)
1 Stubble removed, surface left rough/cracked
9
5.4t DM/ha
0 8
3.1t DM/ha
0
2 Stubble removed, surface raked level & smooth
5 0 3 0
3 Standing stubble, stubble cut to 50% height
28 0 24 0
4 UTC. Standing stubble 34 0 37 0
5 Additional 5t/ha straw added to existing stubble
89 0.5 97 3
6 Additional 10t/ha straw added to existing stubble
100 1 100 5
7 Additional 20t/ha straw added to existing stubble
100 3 100 11
8 Additional 40t/ha straw added to existing stubble
100 5 100 18
Capacitance probes were also installed at both sites in two reference plots to monitor water infiltration and soil water accumulation over time. The capacitance probes were installed in a single plot of treatment four (standard standing stubble), and treatment eight (additional 40t/ha of straw added to the existing standing stubble).
One of the 2015 trials was established on the same property from the previous year at Bullarah, but in a different paddock on the 9th Nov 2015, some two weeks after the wheat harvest on the 25th Oct 2015. Initial gravimetric soil water samples were taken to confirm soil water uniformity across the trial site. Stubble height was ~25‐30cm.
Total rainfall of ~550mm was received during the trial period from Nov 2015 until the 27th Oct 2016. There was no significant treatment affect at this site. The site received 42mm of rainfall during the fortnight between harvest and trial initiation. Capacitance probe results, following an early January rainfall of ~100mm, indicated that soil moisture had reached a depth of >40cm in both the standing stubble and 40t/ha straw treatments. There were no differences observed between treatments in subsequent assessments using moisture probes, EM38 or in final gravimetric soil water.
The second 2015 site was setup up on the 10th Nov 2015 approx. 30km north west of Mungindi, and similar to Bullarah had recently been harvested. Initial gravimetric soil water samples were taken to confirm trial site uniformity. Stubble height was recorded at 30‐35cm. A total of 544mm of rainfall was received during the trial period from the 10th Nov 105 until the 11th Oct 2016.
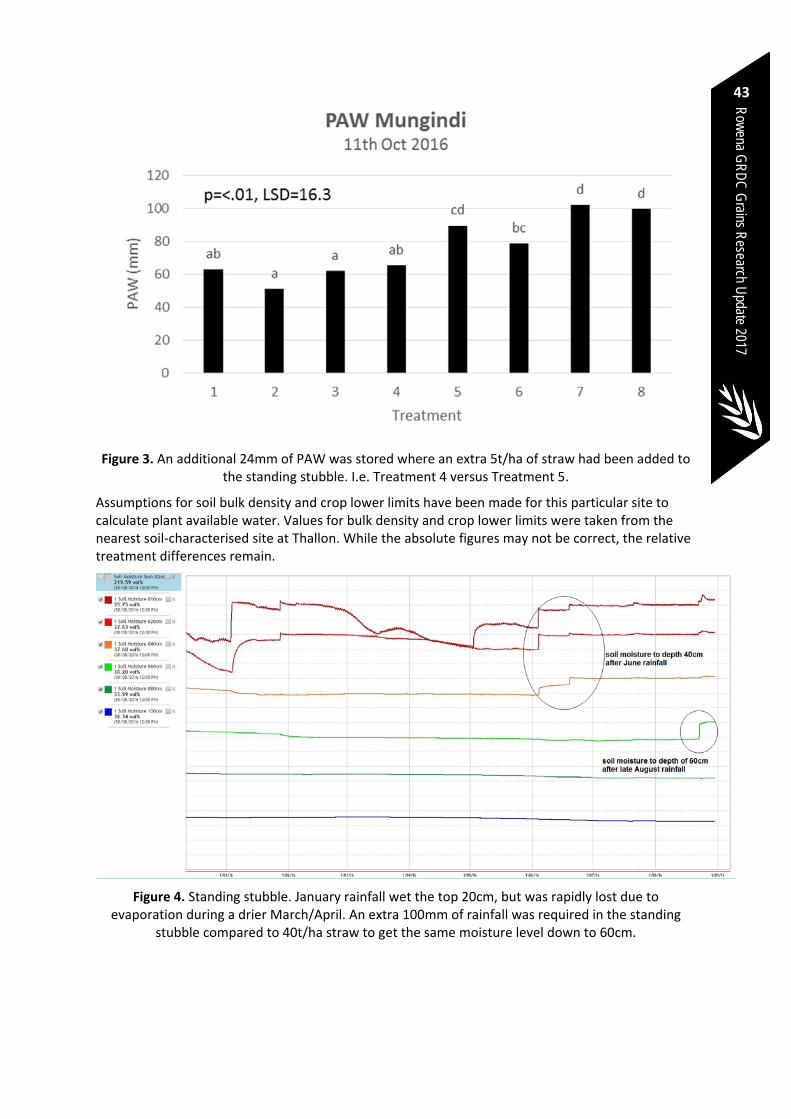
Row
ena GR
DC
Grains R
esearch Update 2017
43
Figure 3. An additional 24mm of PAW was stored where an extra 5t/ha of straw had been added to the standing stubble. I.e. Treatment 4 versus Treatment 5.
Assumptions for soil bulk density and crop lower limits have been made for this particular site to calculate plant available water. Values for bulk density and crop lower limits were taken from the nearest soil‐characterised site at Thallon. While the absolute figures may not be correct, the relative treatment differences remain.
Figure 4. Standing stubble. January rainfall wet the top 20cm, but was rapidly lost due to evaporation during a drier March/April. An extra 100mm of rainfall was required in the standing
stubble compared to 40t/ha straw to get the same moisture level down to 60cm.
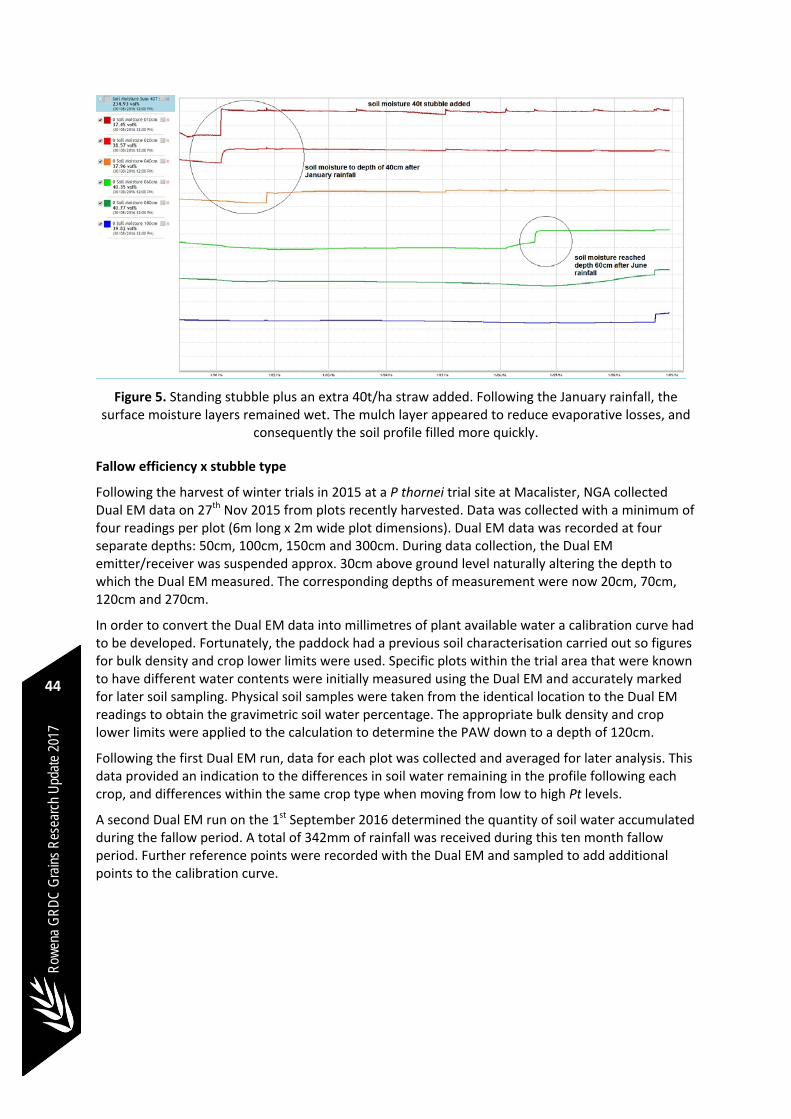
Row
ena
GR
DC
Gra
ins
Res
earc
h U
pdat
e 20
17
44
Figure 5. Standing stubble plus an extra 40t/ha straw added. Following the January rainfall, the surface moisture layers remained wet. The mulch layer appeared to reduce evaporative losses, and
consequently the soil profile filled more quickly.
Fallow efficiency x stubble type
Following the harvest of winter trials in 2015 at a P thornei trial site at Macalister, NGA collected Dual EM data on 27th Nov 2015 from plots recently harvested. Data was collected with a minimum of four readings per plot (6m long x 2m wide plot dimensions). Dual EM data was recorded at four separate depths: 50cm, 100cm, 150cm and 300cm. During data collection, the Dual EM emitter/receiver was suspended approx. 30cm above ground level naturally altering the depth to which the Dual EM measured. The corresponding depths of measurement were now 20cm, 70cm, 120cm and 270cm.
In order to convert the Dual EM data into millimetres of plant available water a calibration curve had to be developed. Fortunately, the paddock had a previous soil characterisation carried out so figures for bulk density and crop lower limits were used. Specific plots within the trial area that were known to have different water contents were initially measured using the Dual EM and accurately marked for later soil sampling. Physical soil samples were taken from the identical location to the Dual EM readings to obtain the gravimetric soil water percentage. The appropriate bulk density and crop lower limits were applied to the calculation to determine the PAW down to a depth of 120cm.
Following the first Dual EM run, data for each plot was collected and averaged for later analysis. This data provided an indication to the differences in soil water remaining in the profile following each crop, and differences within the same crop type when moving from low to high Pt levels.
A second Dual EM run on the 1st September 2016 determined the quantity of soil water accumulated during the fallow period. A total of 342mm of rainfall was received during this ten month fallow period. Further reference points were recorded with the Dual EM and sampled to add additional points to the calibration curve.
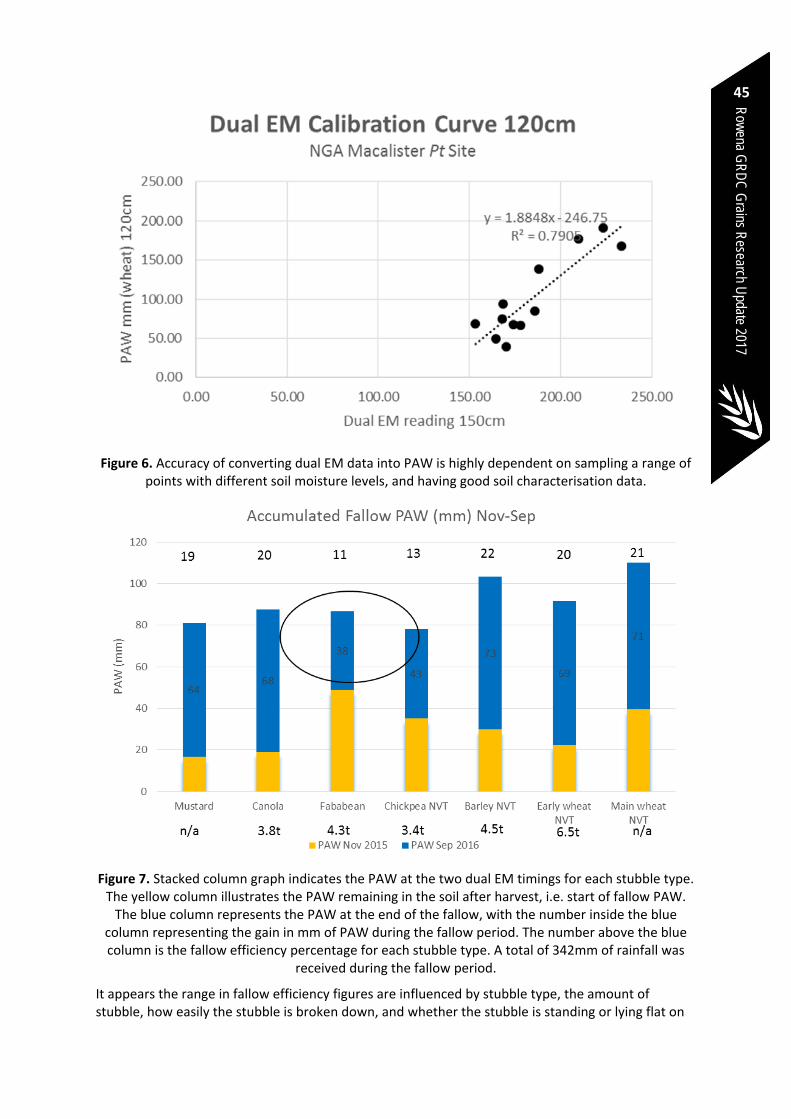
Row
ena GR
DC
Grains R
esearch Update 2017
45
Figure 6. Accuracy of converting dual EM data into PAW is highly dependent on sampling a range of points with different soil moisture levels, and having good soil characterisation data.
Figure 7. Stacked column graph indicates the PAW at the two dual EM timings for each stubble type. The yellow column illustrates the PAW remaining in the soil after harvest, i.e. start of fallow PAW. The blue column represents the PAW at the end of the fallow, with the number inside the blue
column representing the gain in mm of PAW during the fallow period. The number above the blue column is the fallow efficiency percentage for each stubble type. A total of 342mm of rainfall was
received during the fallow period.
It appears the range in fallow efficiency figures are influenced by stubble type, the amount of stubble, how easily the stubble is broken down, and whether the stubble is standing or lying flat on
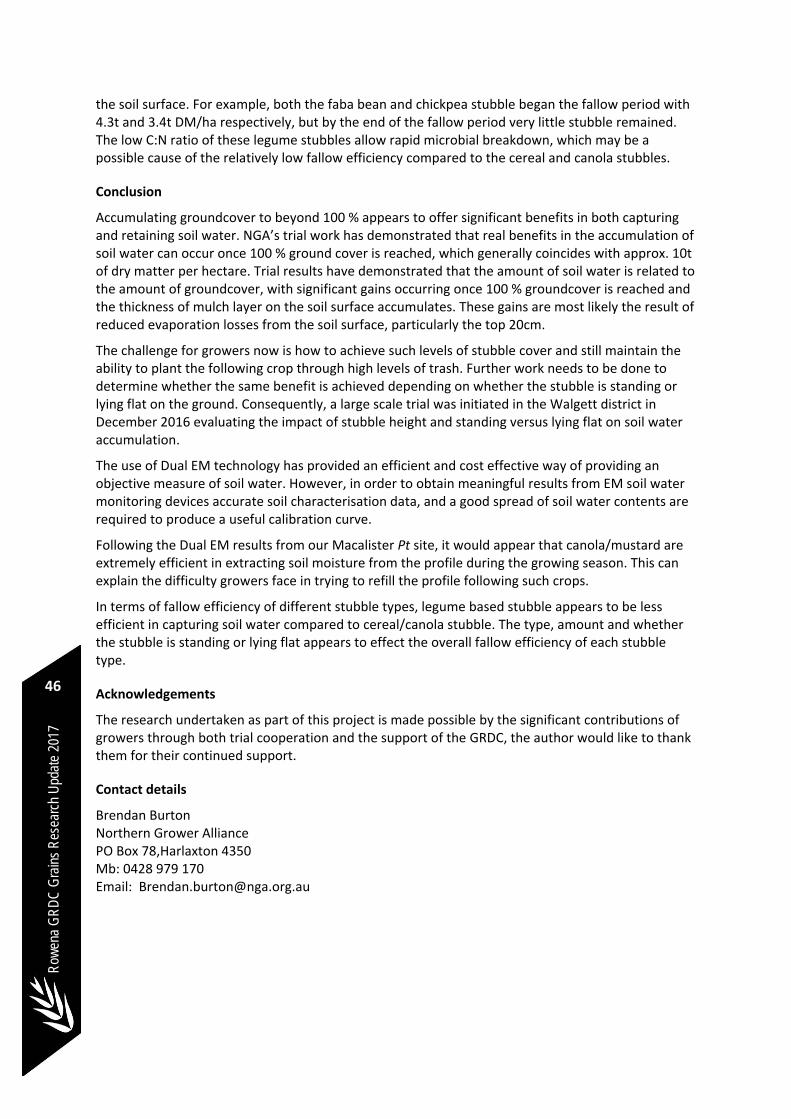
Row
ena
GR
DC
Gra
ins
Res
earc
h U
pdat
e 20
17
46
the soil surface. For example, both the faba bean and chickpea stubble began the fallow period with 4.3t and 3.4t DM/ha respectively, but by the end of the fallow period very little stubble remained. The low C:N ratio of these legume stubbles allow rapid microbial breakdown, which may be a possible cause of the relatively low fallow efficiency compared to the cereal and canola stubbles.
Conclusion
Accumulating groundcover to beyond 100 % appears to offer significant benefits in both capturing and retaining soil water. NGA’s trial work has demonstrated that real benefits in the accumulation of soil water can occur once 100 % ground cover is reached, which generally coincides with approx. 10t of dry matter per hectare. Trial results have demonstrated that the amount of soil water is related to the amount of groundcover, with significant gains occurring once 100 % groundcover is reached and the thickness of mulch layer on the soil surface accumulates. These gains are most likely the result of reduced evaporation losses from the soil surface, particularly the top 20cm.
The challenge for growers now is how to achieve such levels of stubble cover and still maintain the ability to plant the following crop through high levels of trash. Further work needs to be done to determine whether the same benefit is achieved depending on whether the stubble is standing or lying flat on the ground. Consequently, a large scale trial was initiated in the Walgett district in December 2016 evaluating the impact of stubble height and standing versus lying flat on soil water accumulation.
The use of Dual EM technology has provided an efficient and cost effective way of providing an objective measure of soil water. However, in order to obtain meaningful results from EM soil water monitoring devices accurate soil characterisation data, and a good spread of soil water contents are required to produce a useful calibration curve.
Following the Dual EM results from our Macalister Pt site, it would appear that canola/mustard are extremely efficient in extracting soil moisture from the profile during the growing season. This can explain the difficulty growers face in trying to refill the profile following such crops.
In terms of fallow efficiency of different stubble types, legume based stubble appears to be less efficient in capturing soil water compared to cereal/canola stubble. The type, amount and whether the stubble is standing or lying flat appears to effect the overall fallow efficiency of each stubble type.
Acknowledgements
The research undertaken as part of this project is made possible by the significant contributions of growers through both trial cooperation and the support of the GRDC, the author would like to thank them for their continued support.
Contact details
Brendan Burton Northern Grower Alliance PO Box 78,Harlaxton 4350 Mb: 0428 979 170 Email: [email protected]
Recommended