2018 Federal Employee Viewpoint SurveyEmpowering Employees. Inspiring Change.
Governmentwide Management Report
United States Office of Personnel Management OPM.GOV/FEVS #FEVS
Table of Contents
About The 2018 FEVS .............................................................................................................................................................................1
Survey Results/Findings ..........................................................................................................................................................................2
Participant Overview .........................................................................................................................................................................2
Response Rates .................................................................................................................................................................................3
Highlights from the 2018 FEVS .........................................................................................................................................................5
The 16 Annual Employee Survey (AES) Items in Regulation ..............................................................................................................6
Employee Engagement Index (EEI) ................................................................................................................................................. 10
Employee Engagement Index Results by Agency Size and Top Agency Scores ......................................................................... 11
Global Satisfaction Index ............................................................................................................................................................... 13
Global Satisfaction Index Results by Agency Size and Top Agency Scores ................................................................................ 14
Appendix A: Participating Agency Response Rates by Employee Population Size Categories ............................................................. 16
Appendix B: Analytical Methods and Additional FEVS Resources ....................................................................................................... 20
Appendix C: Item Change Summary ................................................................................................................................................... 22
Appendix D: Trend Analysis ............................................................................................................................................................... 24
Appendix E: Work/Life Program Results ............................................................................................................................................. 28
Appendix F: Governmentwide Respondent Characteristics ............................................................................................................... 31
Appendix G: FEVS Indices .................................................................................................................................................................. 34
1
About The 2018 FEVS
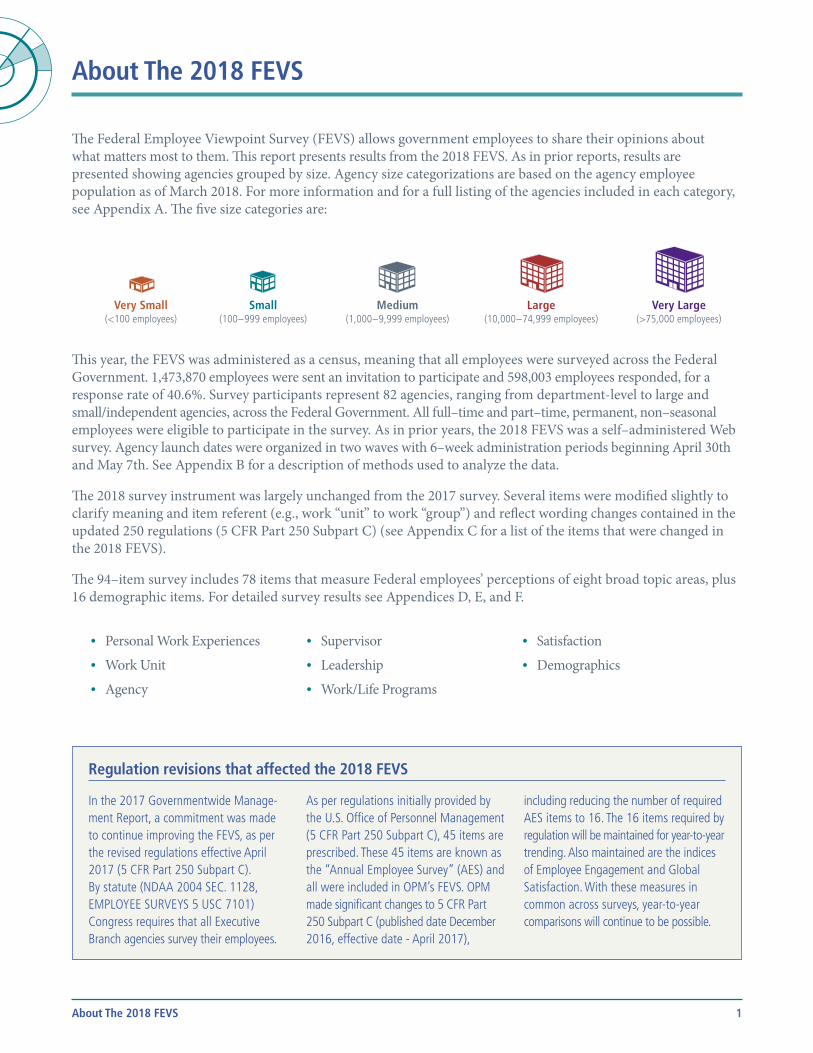
The Federal Employee Viewpoint Survey (FEVS) allows government employees to share their opinions about what matters most to them. This report presents results from the 2018 FEVS. As in prior reports, results are presented showing agencies grouped by size. Agency size categorizations are based on the agency employee population as of March 2018. For more information and for a full listing of the agencies included in each category, see Appendix A. The five size categories are:
Very Small(<100 employees)
Small(100 – 999 employees)
Medium(1,000 – 9,999 employees)
Large(10,000 – 74,999 employees)
Very Large(>75,000 employees)
This year, the FEVS was administered as a census, meaning that all employees were surveyed across the Federal Government. 1,473,870 employees were sent an invitation to participate and 598,003 employees responded, for a response rate of 40.6%. Survey participants represent 82 agencies, ranging from department-level to large and small/independent agencies, across the Federal Government. All full–time and part–time, permanent, non–seasonal employees were eligible to participate in the survey. As in prior years, the 2018 FEVS was a self–administered Web survey. Agency launch dates were organized in two waves with 6–week administration periods beginning April 30th and May 7th. See Appendix B for a description of methods used to analyze the data.
The 2018 survey instrument was largely unchanged from the 2017 survey. Several items were modified slightly to clarify meaning and item referent (e.g., work “unit” to work “group”) and reflect wording changes contained in the updated 250 regulations (5 CFR Part 250 Subpart C) (see Appendix C for a list of the items that were changed in the 2018 FEVS).
The 94–item survey includes 78 items that measure Federal employees’ perceptions of eight broad topic areas, plus 16 demographic items. For detailed survey results see Appendices D, E, and F.
• Personal Work Experiences• Work Unit• Agency
• Supervisor• Leadership• Work/Life Programs
• Satisfaction• Demographics
Regulation revisions that affected the 2018 FEVS
In the 2017 Governmentwide Management Report, a commitment was made to continue improving the FEVS, as per the revised regulations effective April 2017 (5 CFR Part 250 Subpart C). By statute (NDAA 2004 SEC. 1128, EMPLOYEE SURVEYS 5 USC 7101) Congress requires that all Executive Branch agencies survey their employees.
As per regulations initially provided by the U.S. Office of Personnel Management (5 CFR Part 250 Subpart C), 45 items are prescribed. These 45 items are known as the “Annual Employee Survey” (AES) and all were included in OPM’s FEVS. OPM made significant changes to 5 CFR Part 250 Subpart C (published date December 2016, effective date April 2017),
including reducing the number of required AES items to 16. The 16 items required by regulation will be maintained for year toyear trending. Also maintained are the indices of Employee Engagement and Global Satisfaction. With these measures in common across surveys, year to year comparisons will continue to be possible.
About The 2018 FEVS
2
Survey Results/Findings
Each year Federal employees at all levels of an organization, at different locations, and conducting work in a variety of different ways, respond to the request to voice their opinions through the FEVS. By highlighting specific item scores, this section will provide an overview of who Federal employees are, how many responded, and some details about their views.
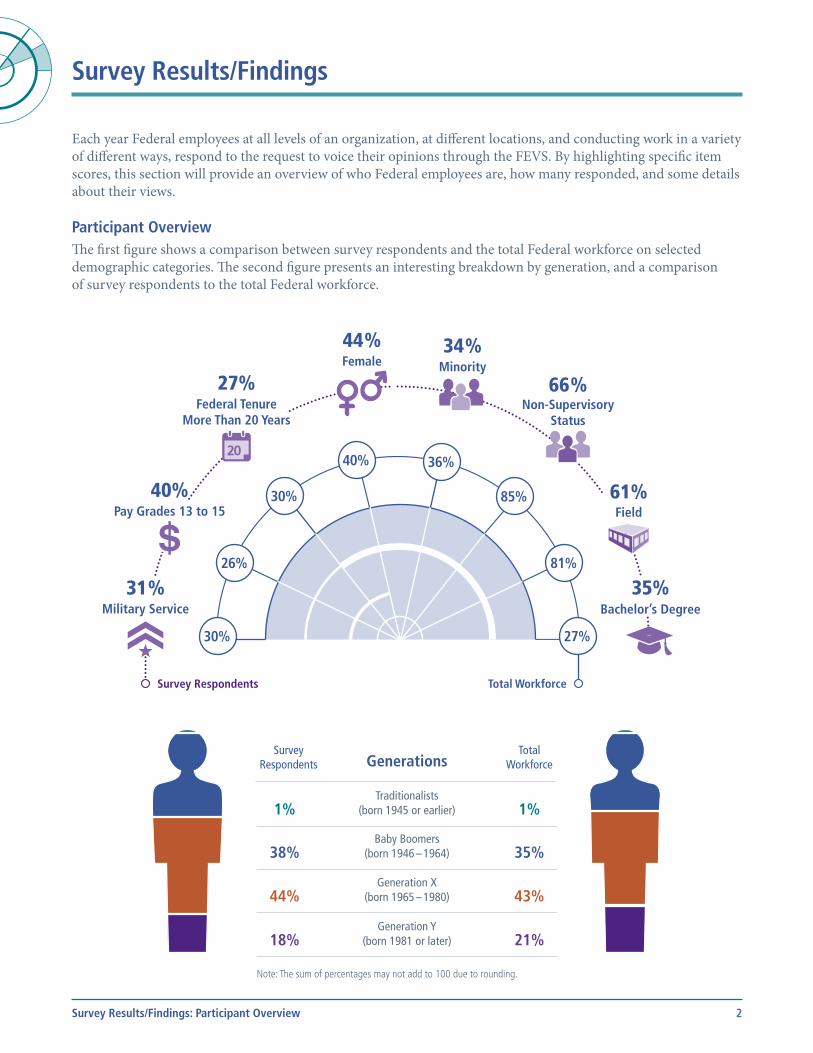
Participant OverviewThe first figure shows a comparison between survey respondents and the total Federal workforce on selected demographic categories. The second figure presents an interesting breakdown by generation, and a comparison of survey respondents to the total Federal workforce.
Survey Respondents Total Workforce
Military Service
Survey Respondents
31 %
Total Workforce
30%
Pay Grades 13 to 15
Survey Respondents
40%
Total Workforce
26%
Federal Tenure More Than 20 Years
Survey Respondents
27%
Total Workforce
30%
20
Female
Survey Respondents
44 %
Total Workforce
40%
Minority
Survey Respondents
34 %
Total Workforce
36%
Non-Supervisory Status
Survey Respondents
66 %
Total Workforce
85%Field
Survey Respondents
61%
Total Workforce
81%
Bachelor’s Degree
Survey Respondents
35%
Total Workforce
27%
GenerationsSurvey
RespondentsTotal
Workforce
Traditionalists (born 1945 or earlier)
Survey Respondents
1%Total Workforce
1%
Baby Boomers (born 1946 – 1964)
Survey Respondents
38%Total Workforce
35%
Generation X (born 1965 – 1980)
Survey Respondents
44%Total Workforce
43%
Generation Y (born 1981 or later)
Survey Respondents
18%Total Workforce
21%
Note: The sum of percentages may not add to 100 due to rounding.
Survey Results/Findings: Participant Overview
3
Survey Results/Findings (continued)
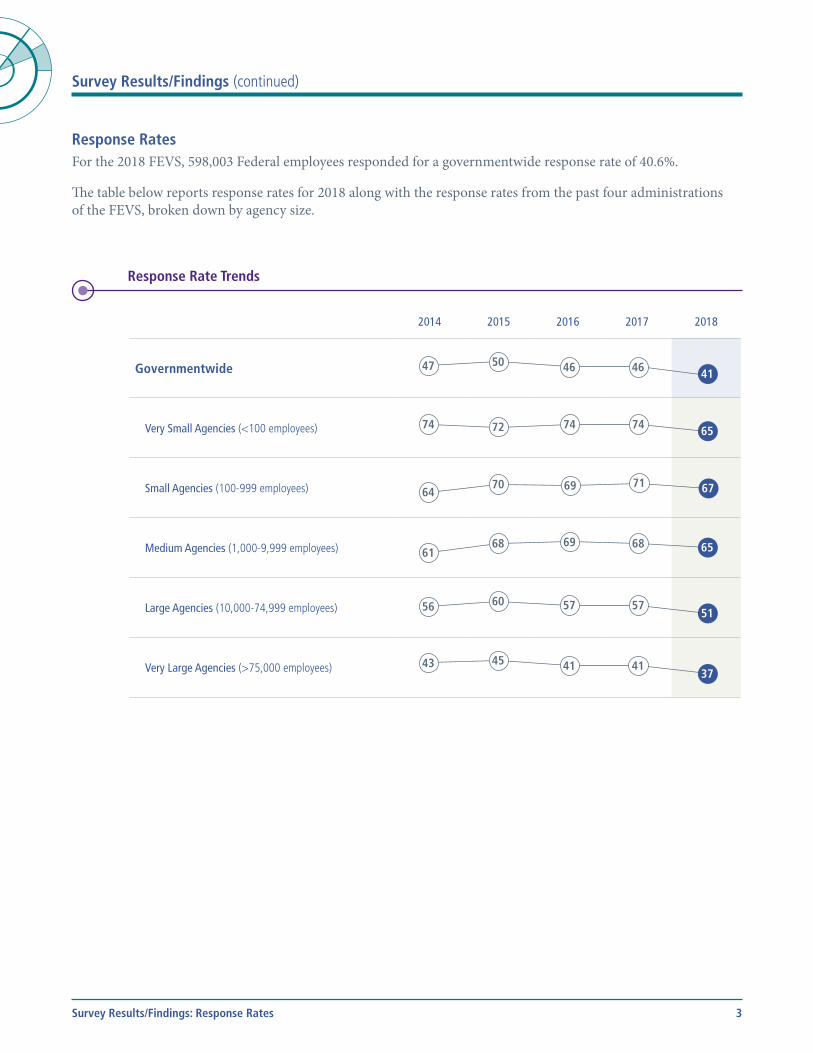
Response RatesFor the 2018 FEVS, 598,003 Federal employees responded for a governmentwide response rate of 40.6%.
The table below reports response rates for 2018 along with the response rates from the past four administrations of the FEVS, broken down by agency size.
Response Rate Trends
2014 2015 2016 2017 2018
Governmentwide
47. 50. Increased from 2014. 46. Decreased from 2015. 46. No change from 2016. 41. Decreased from 2017.
Very Small Agencies (<100 employees)
74. 72. Decreased from 2014. 74. Increased from 2015. 74. No change from 2016. 65. Decreased from 2017.
Small Agencies (100-999 employees)
64. 70. Increased from 2014. 69. Decreased from 2015. 71. Increased from 2016. 67. Decreased from 2017.
Medium Agencies (1,000-9,999 employees)
61. 68. Inreased from 2014. 69. Increased from 2015. 68. Decreased from 2016. 65. Decreased from 2017.
Large Agencies (10,000-74,999 employees)
56. 60. Inreased from 2014. 57. Decreased from 2015. 57. No change from 2016. 51. Decreased from 2017.
Very Large Agencies (>75,000 employees)
43. 45. Inreased from 2014. 41. Decreased from 2015. 41. No change from 2016. 37. Decreased from 2017.
4646 415047
74 74 657274
69 71 677064
69 68 656861
575751
6056
41 4137
4543
Survey Results/Findings: Response Rates
4
Survey Results/Findings (continued)
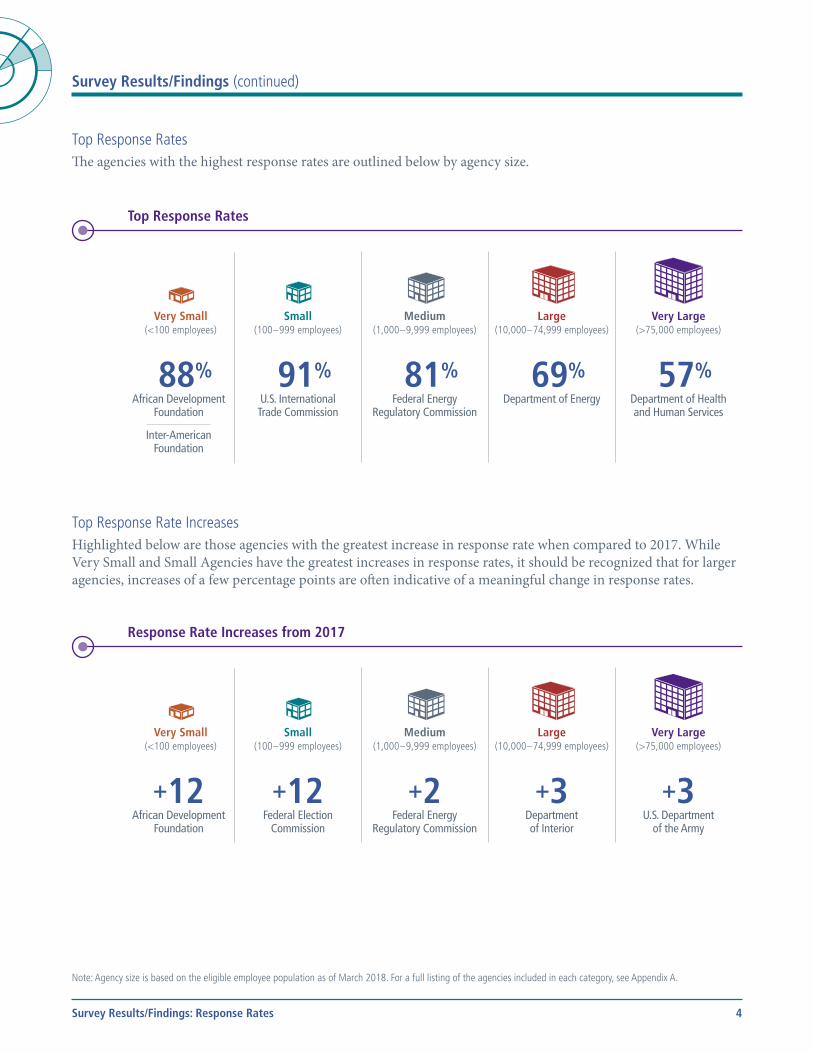
Top Response RatesThe agencies with the highest response rates are outlined below by agency size.
Top Response Rates
Very Small(<100 employees)
88%African Development
Foundation
Inter-American Foundation
Small(100 – 999 employees)
91%U.S. International Trade Commission
Medium(1,000 – 9,999 employees)
81%Federal Energy
Regulatory Commission
Large(10,000 – 74,999 employees)
69%Department of Energy
Very Large(>75,000 employees)
57%Department of Health and Human Services
Top Response Rate IncreasesHighlighted below are those agencies with the greatest increase in response rate when compared to 2017. While Very Small and Small Agencies have the greatest increases in response rates, it should be recognized that for larger agencies, increases of a few percentage points are often indicative of a meaningful change in response rates.
Response Rate Increases from 2017
Very Small(<100 employees)
+12African Development
Foundation
Small(100 – 999 employees)
+12Federal Election
Commission
Medium(1,000 – 9,999 employees)
+2Federal Energy
Regulatory Commission
Large(10,000 – 74,999 employees)
+3Department of Interior
Very Large(>75,000 employees)
+3U.S. Department
of the Army
Note: Agency size is based on the eligible employee population as of March 2018. For a full listing of the agencies included in each category, see Appendix A.
Survey Results/Findings: Response Rates
5
Survey Results/Findings (continued)
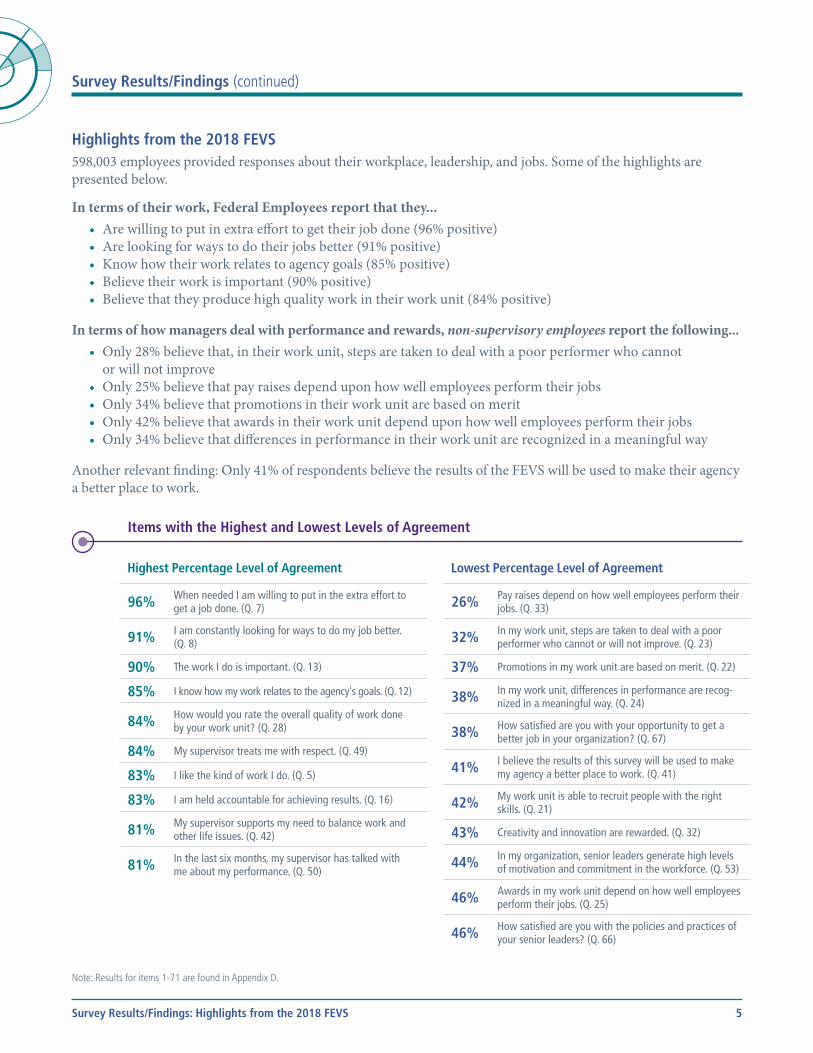
Highlights from the 2018 FEVS598,003 employees provided responses about their workplace, leadership, and jobs. Some of the highlights are presented below.
In terms of their work, Federal Employees report that they...• Are willing to put in extra effort to get their job done (96% positive)• Are looking for ways to do their jobs better (91% positive)• Know how their work relates to agency goals (85% positive)• Believe their work is important (90% positive)• Believe that they produce high quality work in their work unit (84% positive)
In terms of how managers deal with performance and rewards, non-supervisory employees report the following...• Only 28% believe that, in their work unit, steps are taken to deal with a poor performer who cannot
or will not improve • Only 25% believe that pay raises depend upon how well employees perform their jobs• Only 34% believe that promotions in their work unit are based on merit• Only 42% believe that awards in their work unit depend upon how well employees perform their jobs• Only 34% believe that differences in performance in their work unit are recognized in a meaningful way
Another relevant finding: Only 41% of respondents believe the results of the FEVS will be used to make their agency a better place to work.
Items with the Highest and Lowest Levels of Agreement
Highest Percentage Level of Agreement
96% When needed I am willing to put in the extra effort to get a job done. (Q. 7)
91% I am constantly looking for ways to do my job better. (Q. 8)
90% The work I do is important. (Q. 13)
85% I know how my work relates to the agency's goals. (Q. 12)
84% How would you rate the overall quality of work done by your work unit? (Q. 28)
84% My supervisor treats me with respect. (Q. 49)
83% I like the kind of work I do. (Q. 5)
83% I am held accountable for achieving results. (Q. 16)
81% My supervisor supports my need to balance work and other life issues. (Q. 42)
81% In the last six months, my supervisor has talked with me about my performance. (Q. 50)
Lowest Percentage Level of Agreement
26% Pay raises depend on how well employees perform their jobs. (Q. 33)
32% In my work unit, steps are taken to deal with a poor performer who cannot or will not improve. (Q. 23)
37% Promotions in my work unit are based on merit. (Q. 22)
38% In my work unit, differences in performance are recog-nized in a meaningful way. (Q. 24)
38% How satisfied are you with your opportunity to get a better job in your organization? (Q. 67)
41% I believe the results of this survey will be used to make my agency a better place to work. (Q. 41)
42% My work unit is able to recruit people with the right skills. (Q. 21)
43% Creativity and innovation are rewarded. (Q. 32)
44% In my organization, senior leaders generate high levels of motivation and commitment in the workforce. (Q. 53)
46% Awards in my work unit depend on how well employees perform their jobs. (Q. 25)
46% How satisfied are you with the policies and practices of your senior leaders? (Q. 66)
Survey Results/Findings: Highlights from the 2018 FEVS
Note: Results for items 171 are found in Appendix D.
6
Survey Results/Findings (continued)
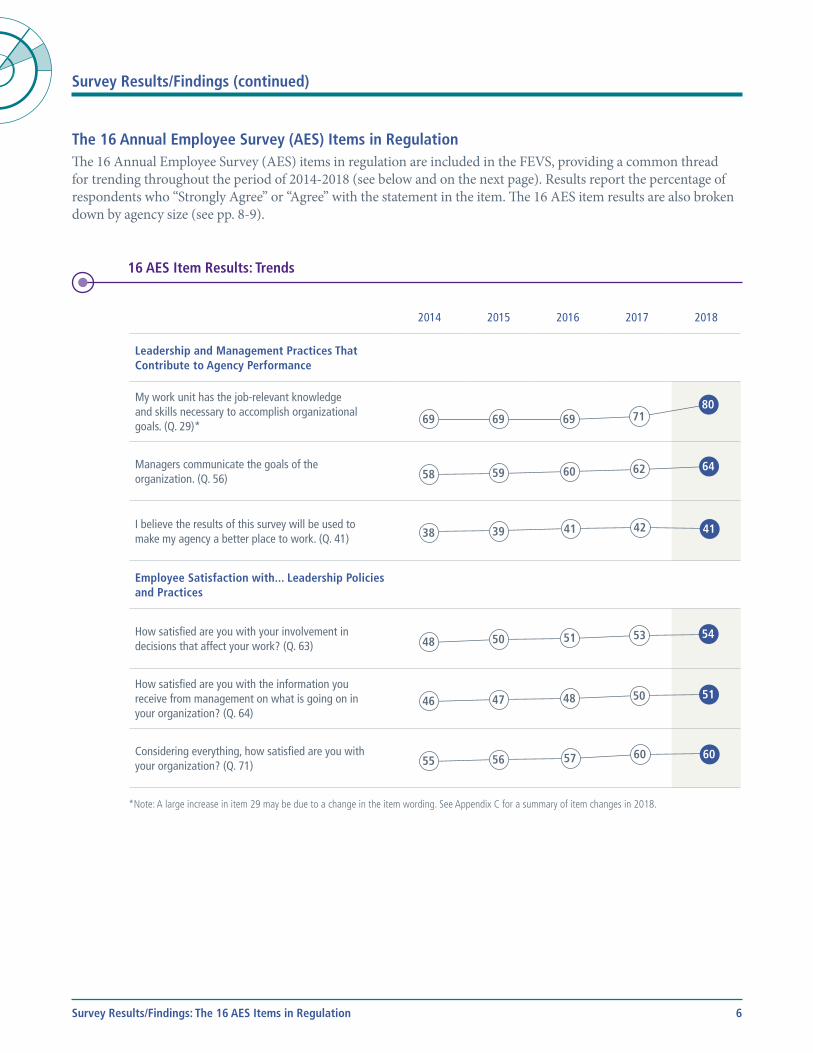
The 16 Annual Employee Survey (AES) Items in Regulation The 16 Annual Employee Survey (AES) items in regulation are included in the FEVS, providing a common thread for trending throughout the period of 2014-2018 (see below and on the next page). Results report the percentage of respondents who “Strongly Agree” or “Agree” with the statement in the item. The 16 AES item results are also broken down by agency size (see pp. 8-9).
16 AES Item Results: Trends
2014 2015 2016 2017 2018
Leadership and Management Practices That Contribute to Agency Performance
My work unit has the job-relevant knowledge and skills necessary to accomplish organizational goals. (Q. 29)*
69. 69. No change from 2014. 69. No change from 2015. 71. Increased from 2016. 80. Increased from 2017.
Managers communicate the goals of the organization. (Q. 56)
58. 59. Increased from 2014. 60. Increased from 2015. 62. Increased from 2016. 64. Increased from 2017.
I believe the results of this survey will be used to make my agency a better place to work. (Q. 41)
38. 39. Increased from 2014. 41. Increased from 2015. 42. Increased from 2016. 41. Decreased from 2017.
Employee Satisfaction with... Leadership Policies and Practices
How satisfied are you with your involvement in decisions that affect your work? (Q. 63)
48. 50. Increased from 2014. 51. Increased from 2015. 53. Increased from 2016. 64. Increased from 2017.
How satisfied are you with the information you receive from management on what is going on in your organization? (Q. 64)
46. 47. Increased from 2014. 48. Increased from 2015. 50. Increased from 2016. 51. Increased from 2017.
Considering everything, how satisfied are you with your organization? (Q. 71)
55. 56. Increased from 2014. 57. Increased from 2015. 60. Increased from 2016. 60. No change from 2017.
60 62 645958
41 42 413938
51 53 545048
48 50 514746
57 60 605655
69 7180
6969
*Note: A large increase in item 29 may be due to a change in the item wording. See Appendix C for a summary of item changes in 2018.
Survey Results/Findings: The 16 AES Items in Regulation
7
Survey Results/Findings (continued)
2014 2015 2016 2017 2018
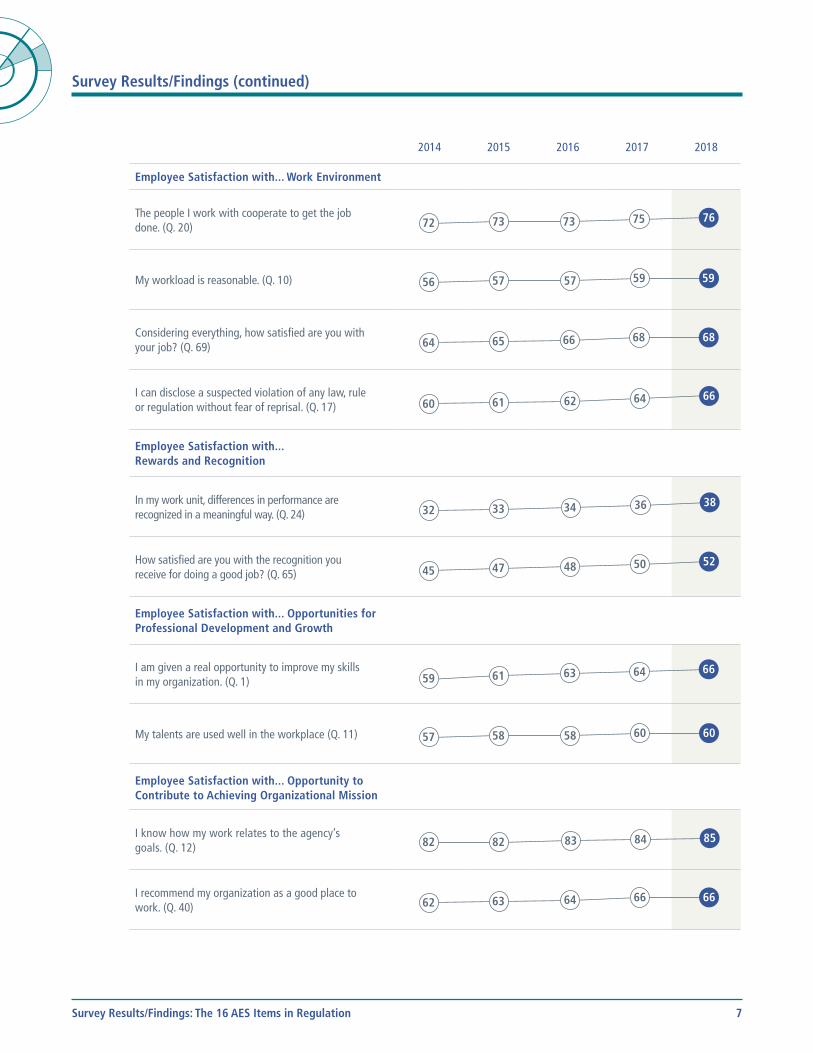
Employee Satisfaction with... Work Environment
The people I work with cooperate to get the job done. (Q. 20)
72. 73. Increased from 2014. 73. No change from 2015. 75. Increased from 2016. 76. Increased from 2017.
My workload is reasonable. (Q. 10)
56. 57. Increased from 2014. 57. No change from 2015. 59. Increased from 2016. 59. No change from 2017.
Considering everything, how satisfied are you with your job? (Q. 69)
64. 65. Increased from 2014. 66. Increased from 2015. 68. Increased from 2016. 68. No change from 2017.
I can disclose a suspected violation of any law, rule or regulation without fear of reprisal. (Q. 17)
60. 61. Increased from 2014. 62. Increased from 2015. 64. Increased from 2016. 66. Increased from 2017.
Employee Satisfaction with... Rewards and Recognition
In my work unit, differences in performance are recognized in a meaningful way. (Q. 24)
32. 33. Increased from 2014. 34. Increased from 2015. 36. Increased from 2016. 38. Increased from 2017.
How satisfied are you with the recognition you receive for doing a good job? (Q. 65)
45. 47. Increased from 2014. 48. Increased from 2015. 50. Increased from 2016. 52. Increased from 2017.
Employee Satisfaction with... Opportunities for Professional Development and Growth
I am given a real opportunity to improve my skills in my organization. (Q. 1)
59. 61. Increased from 2014. 63. Increased from 2015. 64. Increased from 2016. 66. Increased from 2017.
My talents are used well in the workplace (Q. 11)
57. 58. Increased from 2014. 58. No change from 2015. 60. Increased from 2016. 60. No change from 2017.
Employee Satisfaction with... Opportunity to Contribute to Achieving Organizational Mission
I know how my work relates to the agency’s goals. (Q. 12)
82. 82. No change from 2014. 83. Increased from 2015. 84. Increased from 2016. 85. Increased from 2017.
I recommend my organization as a good place to work. (Q. 40)
62. 63. Increased from 2014. 64. Increased from 2015. 66. Increased from 2016. 66. No change from 2017.
73 75 767372
57 59 595756
66 68 686564
62 64 666160
34 36 383332
48 50 524745
63 64 666159
58 60 605857
83 84 858282
64 66 666362
Survey Results/Findings: The 16 AES Items in Regulation
8
Survey Results/Findings (continued)
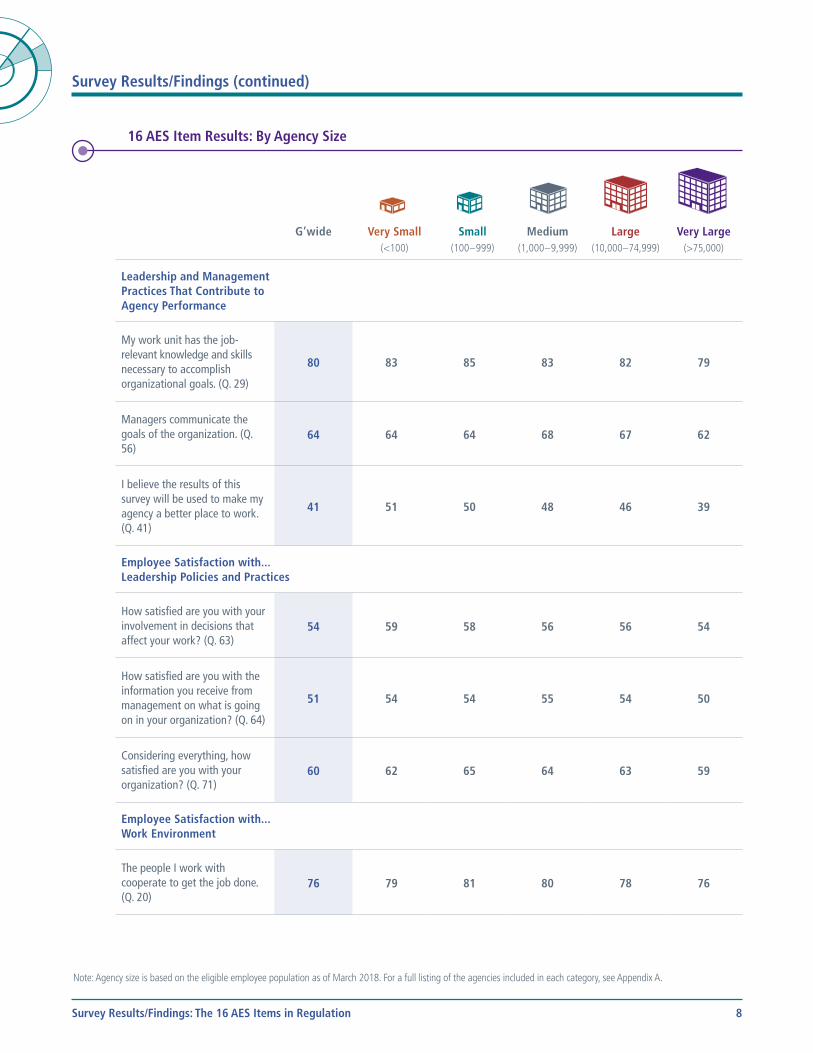
16 AES Item Results: By Agency Size
G’wide Very Small
(<100)
Small(100 – 999)
Medium(1,000 – 9,999)
Large(10,000 – 74,999)
Very Large(>75,000)
Leadership and Management Practices That Contribute to Agency Performance
My work unit has the job-relevant knowledge and skills necessary to accomplish organizational goals. (Q. 29)
80 83 85 83 82 79
Managers communicate the goals of the organization. (Q. 56)
64 64 64 68 67 62
I believe the results of this survey will be used to make my agency a better place to work. (Q. 41)
41 51 50 48 46 39
Employee Satisfaction with... Leadership Policies and Practices
How satisfied are you with your involvement in decisions that affect your work? (Q. 63)
54 59 58 56 56 54
How satisfied are you with the information you receive from management on what is going on in your organization? (Q. 64)
51 54 54 55 54 50
Considering everything, how satisfied are you with your organization? (Q. 71)
60 62 65 64 63 59
Employee Satisfaction with... Work Environment
The people I work with cooperate to get the job done. (Q. 20)
76 79 81 80 78 76
Note: Agency size is based on the eligible employee population as of March 2018. For a full listing of the agencies included in each category, see Appendix A.
Survey Results/Findings: The 16 AES Items in Regulation
9
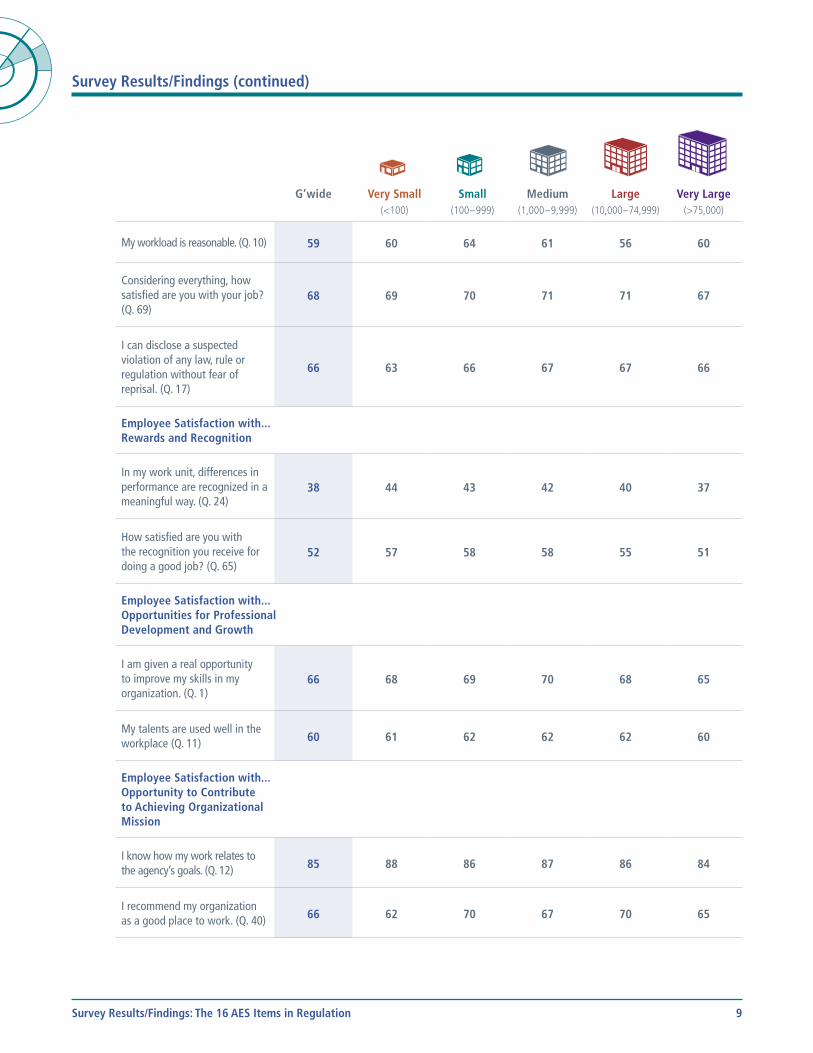
Survey Results/Findings (continued)
G’wide Very Small
(<100)
Small(100 – 999)
Medium(1,000 – 9,999)
Large(10,000 – 74,999)
Very Large(>75,000)
My workload is reasonable. (Q. 10) 59 60 64 61 56 60
Considering everything, how satisfied are you with your job? (Q. 69)
68 69 70 71 71 67
I can disclose a suspected violation of any law, rule or regulation without fear of reprisal. (Q. 17)
66 63 66 67 67 66
Employee Satisfaction with... Rewards and Recognition
In my work unit, differences in performance are recognized in a meaningful way. (Q. 24)
38 44 43 42 40 37
How satisfied are you with the recognition you receive for doing a good job? (Q. 65)
52 57 58 58 55 51
Employee Satisfaction with... Opportunities for Professional Development and Growth
I am given a real opportunity to improve my skills in my organization. (Q. 1)
66 68 69 70 68 65
My talents are used well in the workplace (Q. 11) 60 61 62 62 62 60
Employee Satisfaction with... Opportunity to Contribute to Achieving Organizational Mission
I know how my work relates to the agency’s goals. (Q. 12) 85 88 86 87 86 84
I recommend my organization as a good place to work. (Q. 40) 66 62 70 67 70 65
Survey Results/Findings: The 16 AES Items in Regulation
10
Survey Results/Findings (continued)
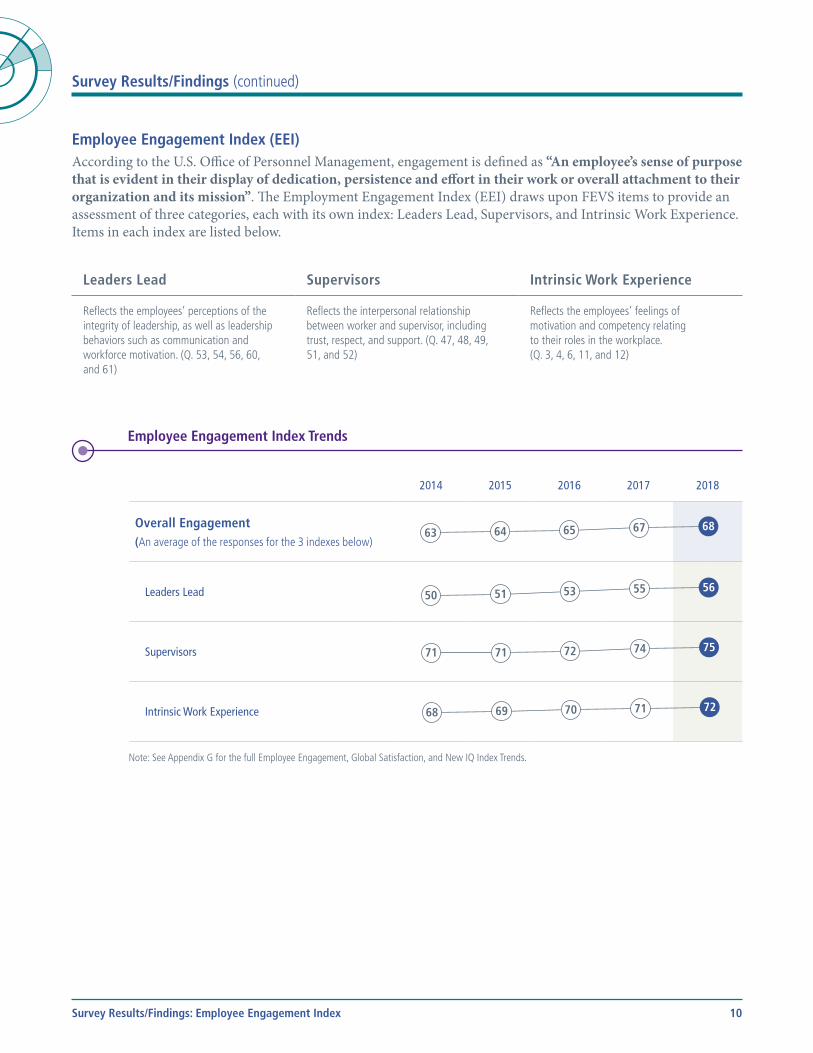
Employee Engagement Index (EEI)According to the U.S. Office of Personnel Management, engagement is defined as “An employee’s sense of purpose that is evident in their display of dedication, persistence and effort in their work or overall attachment to their organization and its mission”. The Employment Engagement Index (EEI) draws upon FEVS items to provide an assessment of three categories, each with its own index: Leaders Lead, Supervisors, and Intrinsic Work Experience. Items in each index are listed below.
Leaders Lead Supervisors Intrinsic Work Experience
Reflects the employees’ perceptions of the integrity of leadership, as well as leadership behaviors such as communication and workforce motivation. (Q. 53, 54, 56, 60, and 61)
Reflects the interpersonal relationship between worker and supervisor, including trust, respect, and support. (Q. 47, 48, 49, 51, and 52)
Reflects the employees’ feelings of motivation and competency relating to their roles in the workplace. (Q. 3, 4, 6, 11, and 12)
Employee Engagement Index Trends
2014 2015 2016 2017 2018
Overall Engagement (An average of the responses for the 3 indexes below)
63. 64. Inreased from 2014. 65. Increased from 2015. 67. Increased from 2016. 68. Increased from 2017.
Leaders Lead
50. 51. Inreased from 2014. 53. Increased from 2015. 55. Increased from 2016. 56. Increased from 2017.
Supervisors
71. 71. No change from 2014. 72. Increased from 2015. 74. Increased from 2016. 75. Increased from 2017.
Intrinsic Work Experience
68. 69. Increased from 2014. 70. Increased from 2015. 71. Increased from 2016. 72. Increased from 2017.
63 65 67 64 68
68 70 71 69 72
71 72 74 71 75
50 53 55 51 56
Note: See Appendix G for the full Employee Engagement, Global Satisfaction, and New IQ Index Trends.
Survey Results/Findings: Employee Engagement Index
11
Survey Results/Findings (continued)
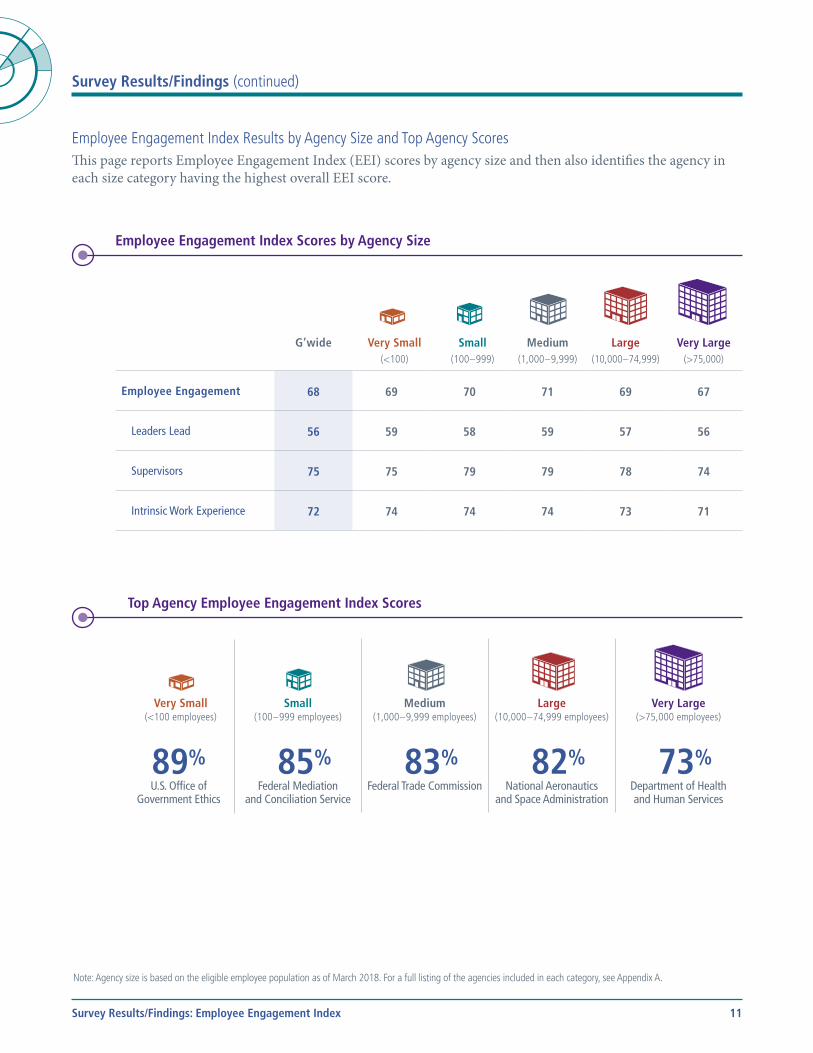
Employee Engagement Index Results by Agency Size and Top Agency ScoresThis page reports Employee Engagement Index (EEI) scores by agency size and then also identifies the agency in each size category having the highest overall EEI score.
Employee Engagement Index Scores by Agency Size
G’wide Very Small
(<100)
Small(100 – 999)
Medium(1,000 – 9,999)
Large(10,000 – 74,999)
Very Large(>75,000)
Employee Engagement 68 69 70 71 69 67
Leaders Lead 56 59 58 59 57 56
Supervisors 75 75 79 79 78 74
Intrinsic Work Experience 72 74 74 74 73 71
Top Agency Employee Engagement Index Scores
Very Small(<100 employees)
89%U.S. Office of
Government Ethics
Small(100 – 999 employees)
85%Federal Mediation
and Conciliation Service
Medium(1,000 – 9,999 employees)
83%Federal Trade Commission
Large(10,000 – 74,999 employees)
82%National Aeronautics
and Space Administration
Very Large(>75,000 employees)
73%Department of Health and Human Services
Note: Agency size is based on the eligible employee population as of March 2018. For a full listing of the agencies included in each category, see Appendix A.
Survey Results/Findings: Employee Engagement Index
12
Survey Results/Findings (continued)
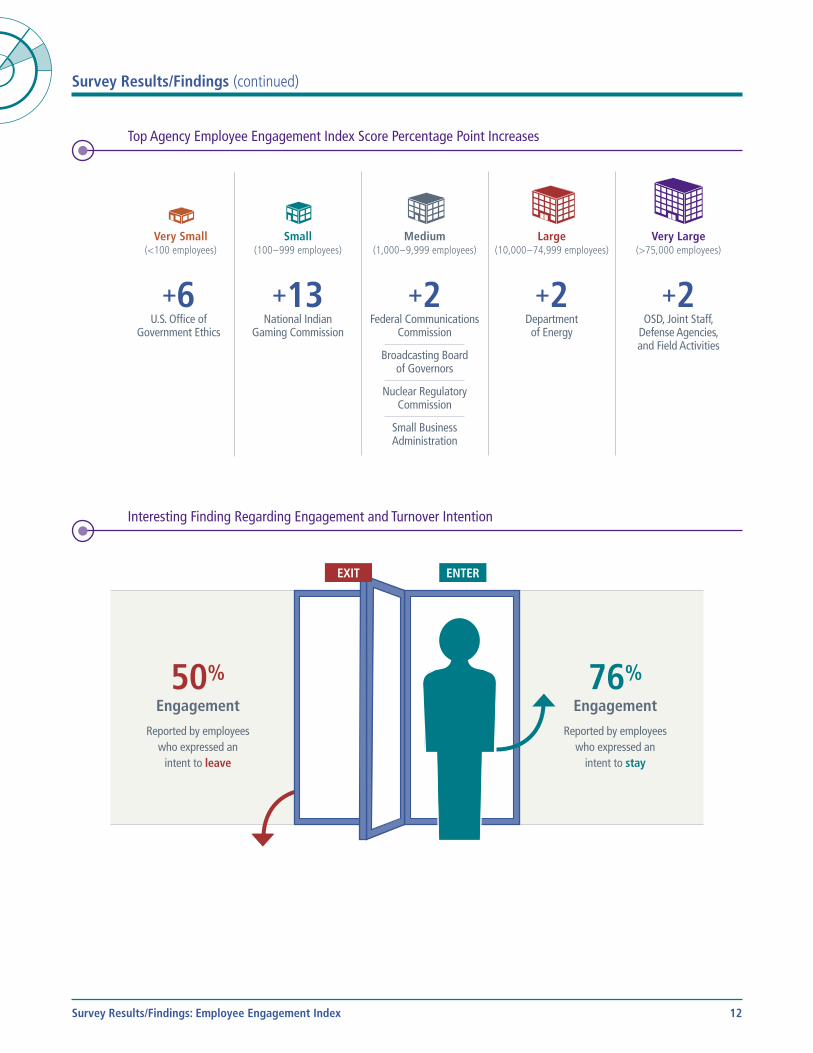
Top Agency Employee Engagement Index Score Percentage Point Increases
Very Small(<100 employees)
+6U.S. Office of
Government Ethics
Small(100 – 999 employees)
+13National Indian
Gaming Commission
Medium(1,000 – 9,999 employees)
+2Federal Communications
Commission
Broadcasting Board of Governors
Nuclear Regulatory Commission
Small Business Administration
Large(10,000 – 74,999 employees)
+2Department of Energy
Very Large(>75,000 employees)
+2OSD, Joint Staff,
Defense Agencies, and Field Activities
Interesting Finding Regarding Engagement and Turnover Intention
ENTEREXIT
50%Engagement
Reported by employees who expressed an
intent to leave
76%Engagement
Reported by employees who expressed an
intent to stay
Survey Results/Findings: Employee Engagement Index
13
Survey Results/Findings (continued)
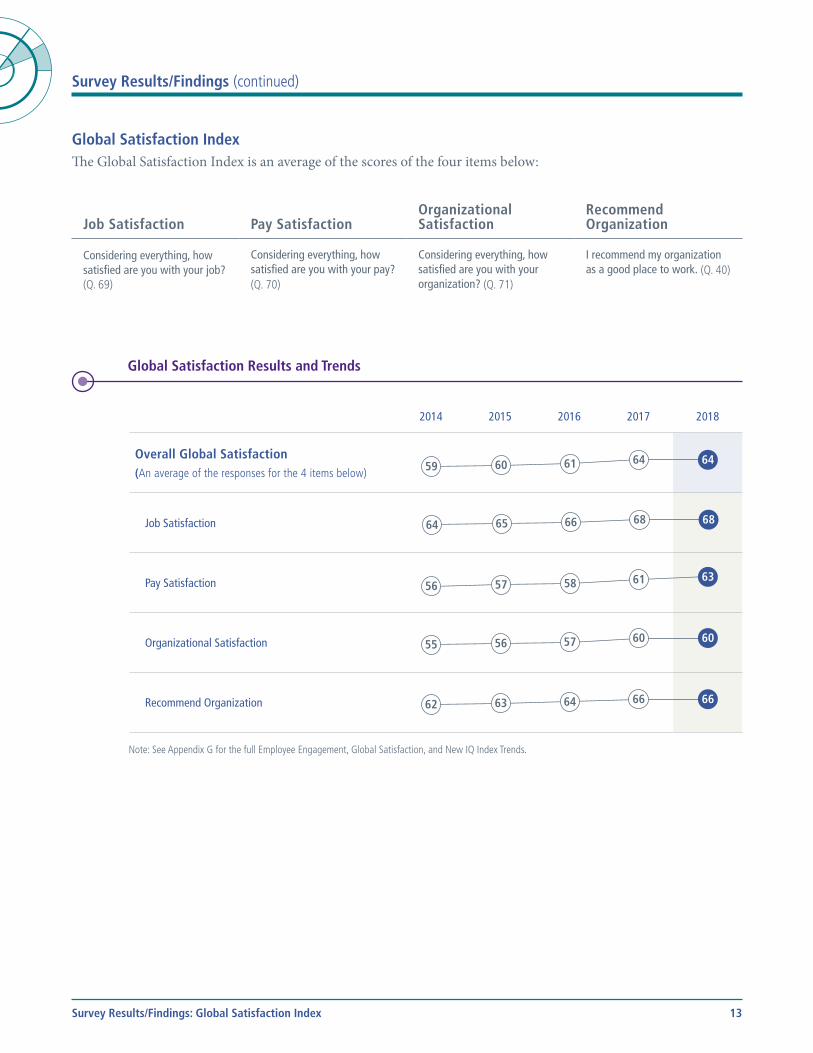
Global Satisfaction IndexThe Global Satisfaction Index is an average of the scores of the four items below:
Job Satisfaction
Pay Satisfaction
Organizational Satisfaction
Recommend Organization
Considering everything, how satisfied are you with your job? (Q. 69)
Considering everything, how satisfied are you with your pay? (Q. 70)
Considering everything, how satisfied are you with your organization? (Q. 71)
I recommend my organization as a good place to work. (Q. 40)
Global Satisfaction Results and Trends
2014 2015 2016 2017 2018
Overall Global Satisfaction (An average of the responses for the 4 items below)
59. 60. Increased from 2014. 61. Increased from 2015. 64. Increased from 2016. 64. No change from 2017.
Job Satisfaction
64. 65. Increased from 2014. 66. Increased from 2015. 68. Increased from 2016. 68. No change from 2017.
Pay Satisfaction
56. 57. Increased from 2014. 58. Increased from 2015. 61. Increased from 2016. 63. Increased from 2017.
Organizational Satisfaction
55. 56. Increased from 2014. 57. Increased from 2015. 60. Increased from 2016. 60. No change from 2017.
Recommend Organization
62. 63. Increased from 2014. 64. Increased from 2015. 66. Increased from 2016. 66. No change from 2017.
59 61 64 60 64
64 66 68 65 68
56 58 61 57 63
55 60 57 56 60
62 64 66 63 66
Note: See Appendix G for the full Employee Engagement, Global Satisfaction, and New IQ Index Trends.
Survey Results/Findings: Global Satisfaction Index

14
Survey Results/Findings (continued)
Global Satisfaction Index Results by Agency Size and Top Agency ScoresGlobal Satisfaction agency findings are displayed in the following figures. The figure below shows scores for the overall 2018 Global Satisfaction index and the score for the four items that make up the index by agency size category. Also shown for each size category is the agency with the highest Global Satisfaction score, and on page 15, the agency that improved its overall Global Satisfaction score the most since 2017.
Global Satisfaction Scores by Agency Size
G’wide Very Small
(<100)
Small(100 – 999)
Medium(1,000 – 9,999)
Large(10,000 – 74,999)
Very Large(>75,000)
Global Satisfaction 64 63 67 67 68 63
Job Satisfaction 68 69 70 71 71 67
Pay Satisfaction 63 60 63 67 66 62
Organizational Satisfaction 60 62 65 64 63 59
Recommend Organization 66 62 70 67 70 65
Top Agency Global Satisfaction Scores
Very Small(<100 employees)
83%U.S. Office of
Government Ethics
National Capital Planning Commission
Small(100 – 999 employees)
88%National Indian
Gaming Commission
Medium(1,000 – 9,999 employees)
82%Securities and Exchange
Commission
Large(10,000 – 74,999 employees)
80%National Aeronautics
and Space Administration
Very Large(>75,000 employees)
71%Department of Health and Human Services
Note: Agency size is based on the eligible employee population as of March 2018. For a full listing of the agencies included in each category, see Appendix A.
Survey Results/Findings: Global Satisfaction Index
15
Survey Results/Findings (continued)
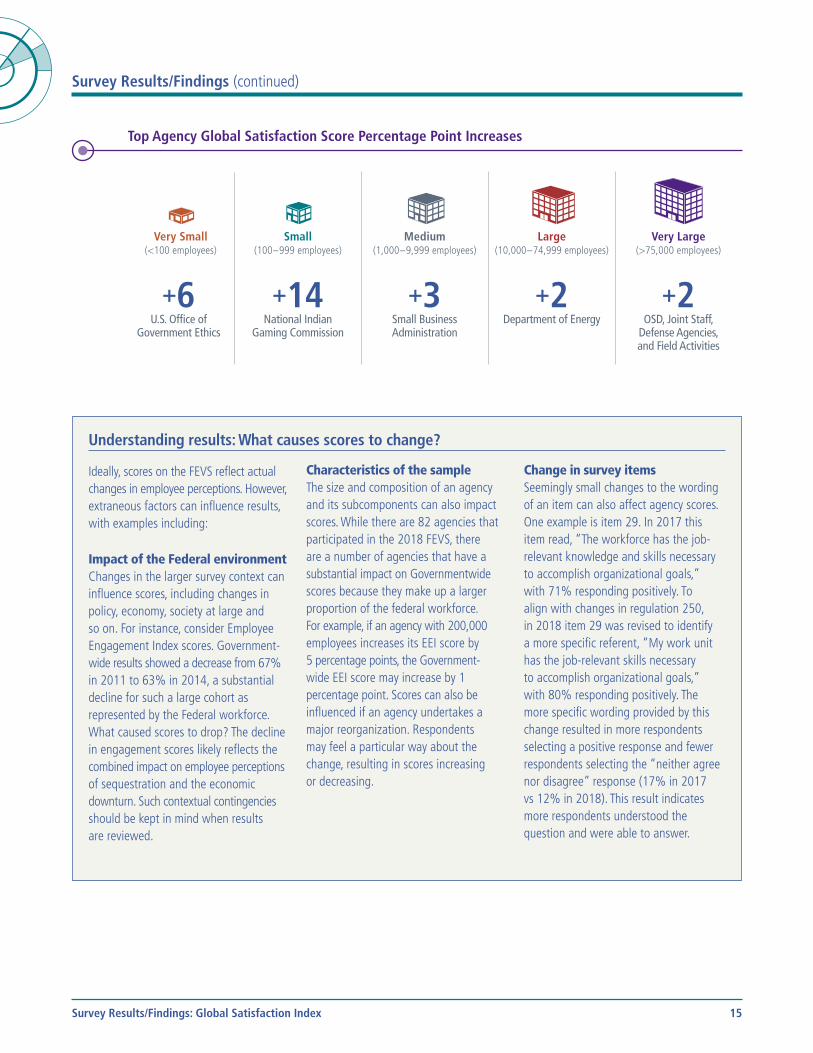
Top Agency Global Satisfaction Score Percentage Point Increases
Very Small(<100 employees)
+6U.S. Office of
Government Ethics
Small(100 – 999 employees)
+14National Indian
Gaming Commission
Medium(1,000 – 9,999 employees)
+3Small Business Administration
Large(10,000 – 74,999 employees)
+2Department of Energy
Very Large(>75,000 employees)
+2OSD, Joint Staff,
Defense Agencies, and Field Activities
Understanding results: What causes scores to change?
Ideally, scores on the FEVS reflect actual changes in employee perceptions. However, extraneous factors can influence results, with examples including:
Impact of the Federal environment Changes in the larger survey context can influence scores, including changes in policy, economy, society at large and so on. For instance, consider Employee Engagement Index scores. Governmentwide results showed a decrease from 67% in 2011 to 63% in 2014, a substantial decline for such a large cohort as represented by the Federal workforce. What caused scores to drop? The decline in engagement scores likely reflects the combined impact on employee perceptions of sequestration and the economic downturn. Such contextual contingencies should be kept in mind when results are reviewed.
Characteristics of the sampleThe size and composition of an agency and its subcomponents can also impact scores. While there are 82 agencies that participated in the 2018 FEVS, there are a number of agencies that have a substantial impact on Governmentwide scores because they make up a larger proportion of the federal workforce. For example, if an agency with 200,000 employees increases its EEI score by 5 percentage points, the Governmentwide EEI score may increase by 1 percentage point. Scores can also be influenced if an agency undertakes a major reorganization. Respondents may feel a particular way about the change, resulting in scores increasing or decreasing.
Change in survey itemsSeemingly small changes to the wording of an item can also affect agency scores. One example is item 29. In 2017 this item read, “The workforce has the jobrelevant knowledge and skills necessary to accomplish organizational goals,” with 71% responding positively. To align with changes in regulation 250, in 2018 item 29 was revised to identify a more specific referent, “My work unit has the jobrelevant skills necessary to accomplish organizational goals,” with 80% responding positively. The more specific wording provided by this change resulted in more respondents selecting a positive response and fewer respondents selecting the “neither agree nor disagree” response (17% in 2017 vs 12% in 2018). This result indicates more respondents understood the question and were able to answer.
Survey Results/Findings: Global Satisfaction Index
16
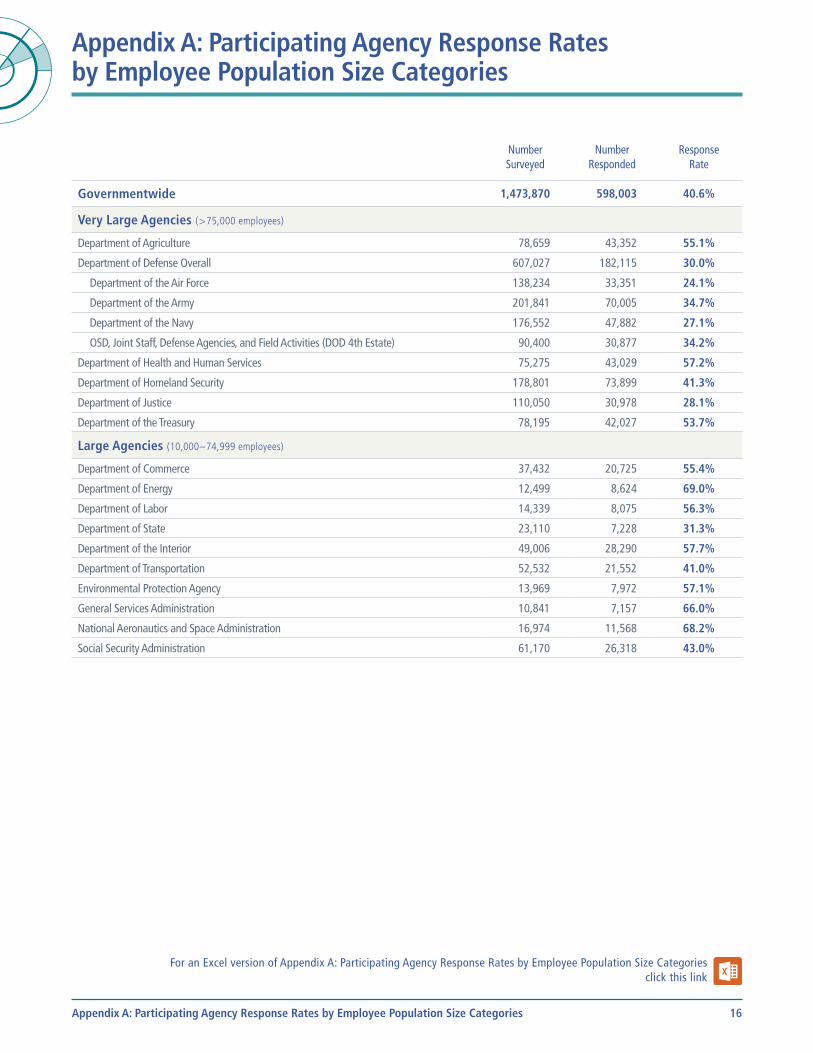
Appendix A: Participating Agency Response Rates by Employee Population Size Categories
NumberSurveyed
NumberResponded
ResponseRate
Governmentwide 1,473,870 598,003 40.6%
Very Large Agencies ( > 75,000 employees)
Department of Agriculture 78,659 43,352 55.1%
Department of Defense Overall 607,027 182,115 30.0%
Department of the Air Force 138,234 33,351 24.1%
Department of the Army 201,841 70,005 34.7%
Department of the Navy 176,552 47,882 27.1%
OSD, Joint Staff, Defense Agencies, and Field Activities (DOD 4th Estate) 90,400 30,877 34.2%
Department of Health and Human Services 75,275 43,029 57.2%
Department of Homeland Security 178,801 73,899 41.3%
Department of Justice 110,050 30,978 28.1%
Department of the Treasury 78,195 42,027 53.7%
Large Agencies (10,000 – 74,999 employees)
Department of Commerce 37,432 20,725 55.4%
Department of Energy 12,499 8,624 69.0%
Department of Labor 14,339 8,075 56.3%
Department of State 23,110 7,228 31.3%
Department of the Interior 49,006 28,290 57.7%
Department of Transportation 52,532 21,552 41.0%
Environmental Protection Agency 13,969 7,972 57.1%
General Services Administration 10,841 7,157 66.0%
National Aeronautics and Space Administration 16,974 11,568 68.2%
Social Security Administration 61,170 26,318 43.0%
For an Excel version of Appendix A: Participating Agency Response Rates by Employee Population Size Categories click this link
Appendix A: Participating Agency Response Rates by Employee Population Size Categories
17
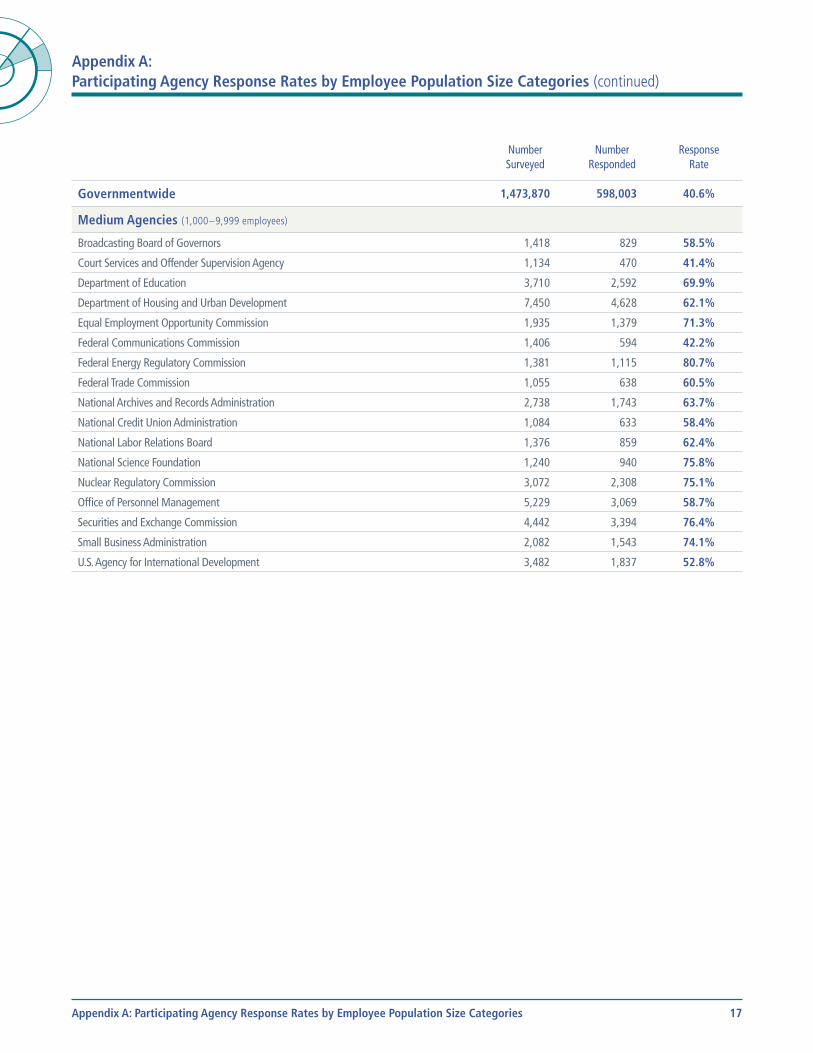
Appendix A: Participating Agency Response Rates by Employee Population Size Categories (continued)
NumberSurveyed
NumberResponded
ResponseRate
Governmentwide 1,473,870 598,003 40.6%
Medium Agencies (1,000 – 9,999 employees)
Broadcasting Board of Governors 1,418 829 58.5%
Court Services and Offender Supervision Agency 1,134 470 41.4%
Department of Education 3,710 2,592 69.9%
Department of Housing and Urban Development 7,450 4,628 62.1%
Equal Employment Opportunity Commission 1,935 1,379 71.3%
Federal Communications Commission 1,406 594 42.2%
Federal Energy Regulatory Commission 1,381 1,115 80.7%
Federal Trade Commission 1,055 638 60.5%
National Archives and Records Administration 2,738 1,743 63.7%
National Credit Union Administration 1,084 633 58.4%
National Labor Relations Board 1,376 859 62.4%
National Science Foundation 1,240 940 75.8%
Nuclear Regulatory Commission 3,072 2,308 75.1%
Office of Personnel Management 5,229 3,069 58.7%
Securities and Exchange Commission 4,442 3,394 76.4%
Small Business Administration 2,082 1,543 74.1%
U.S. Agency for International Development 3,482 1,837 52.8%
Appendix A: Participating Agency Response Rates by Employee Population Size Categories
18
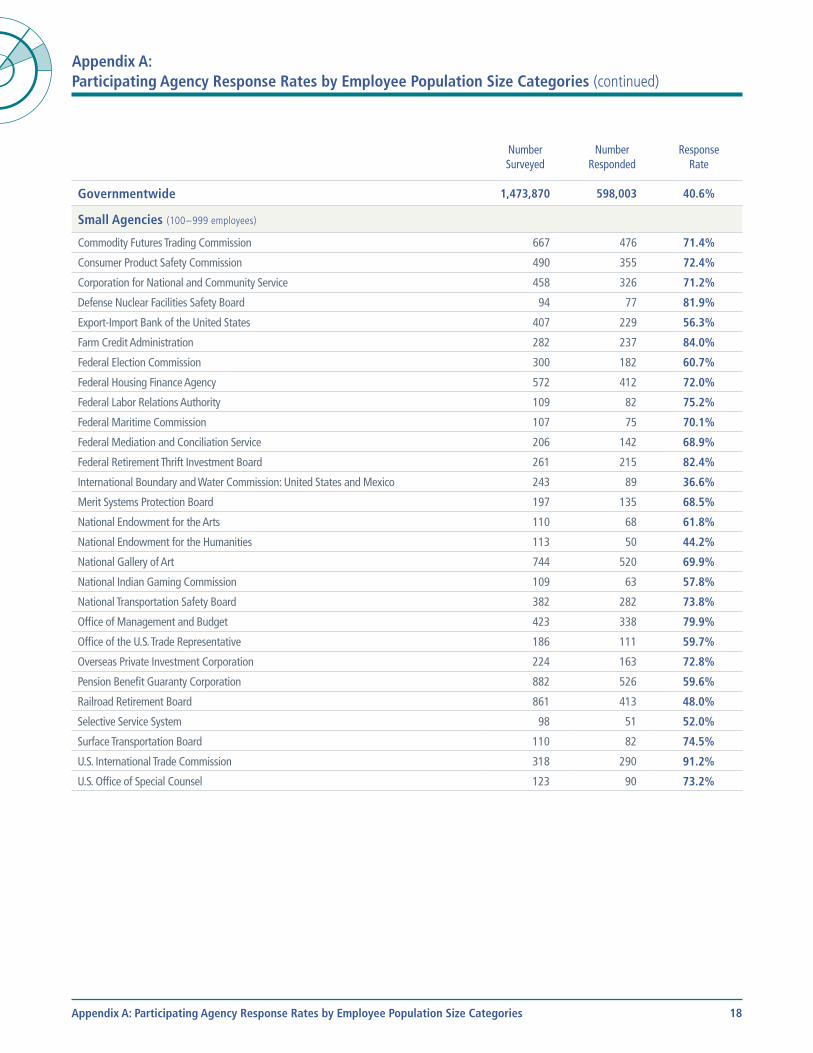
Appendix A: Participating Agency Response Rates by Employee Population Size Categories (continued)
NumberSurveyed
NumberResponded
ResponseRate
Governmentwide 1,473,870 598,003 40.6%
Small Agencies (100 – 999 employees)
Commodity Futures Trading Commission 667 476 71.4%
Consumer Product Safety Commission 490 355 72.4%
Corporation for National and Community Service 458 326 71.2%
Defense Nuclear Facilities Safety Board 94 77 81.9%
Export-Import Bank of the United States 407 229 56.3%
Farm Credit Administration 282 237 84.0%
Federal Election Commission 300 182 60.7%
Federal Housing Finance Agency 572 412 72.0%
Federal Labor Relations Authority 109 82 75.2%
Federal Maritime Commission 107 75 70.1%
Federal Mediation and Conciliation Service 206 142 68.9%
Federal Retirement Thrift Investment Board 261 215 82.4%
International Boundary and Water Commission: United States and Mexico 243 89 36.6%
Merit Systems Protection Board 197 135 68.5%
National Endowment for the Arts 110 68 61.8%
National Endowment for the Humanities 113 50 44.2%
National Gallery of Art 744 520 69.9%
National Indian Gaming Commission 109 63 57.8%
National Transportation Safety Board 382 282 73.8%
Office of Management and Budget 423 338 79.9%
Office of the U.S. Trade Representative 186 111 59.7%
Overseas Private Investment Corporation 224 163 72.8%
Pension Benefit Guaranty Corporation 882 526 59.6%
Railroad Retirement Board 861 413 48.0%
Selective Service System 98 51 52.0%
Surface Transportation Board 110 82 74.5%
U.S. International Trade Commission 318 290 91.2%
U.S. Office of Special Counsel 123 90 73.2%
Appendix A: Participating Agency Response Rates by Employee Population Size Categories
19
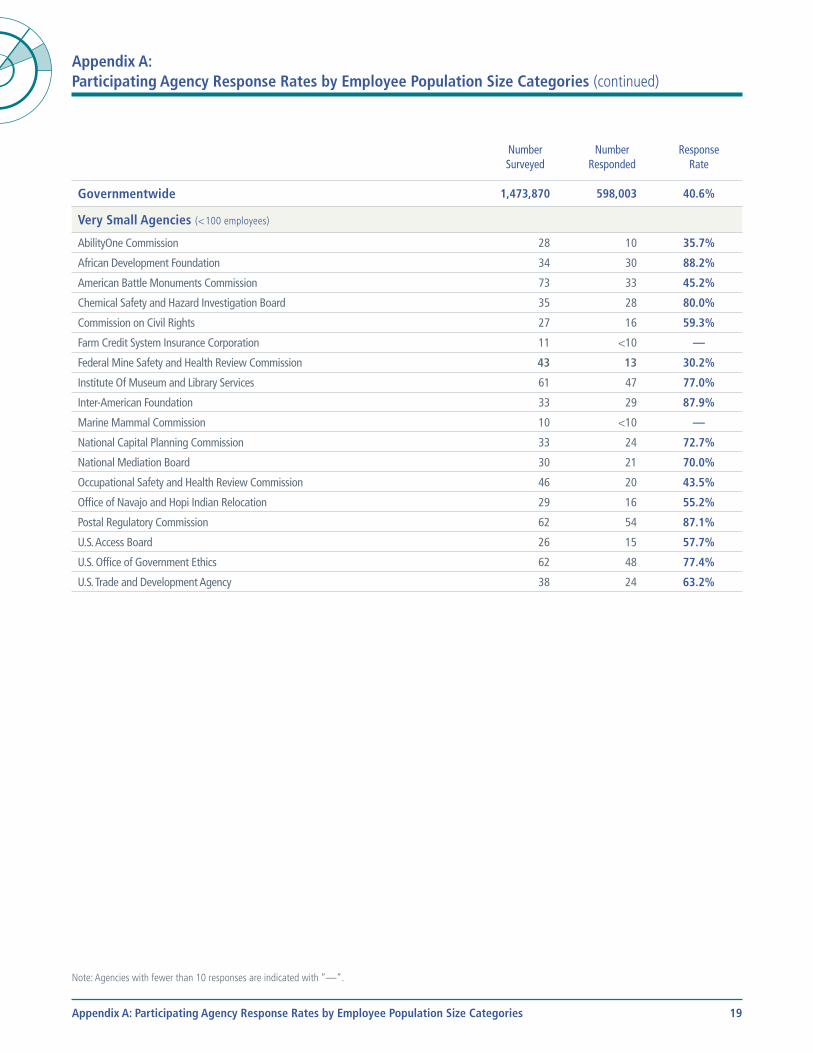
Appendix A: Participating Agency Response Rates by Employee Population Size Categories (continued)
NumberSurveyed
NumberResponded
ResponseRate
Governmentwide 1,473,870 598,003 40.6%
Very Small Agencies (< 100 employees)
AbilityOne Commission 28 10 35.7%
African Development Foundation 34 30 88.2%
American Battle Monuments Commission 73 33 45.2%
Chemical Safety and Hazard Investigation Board 35 28 80.0%
Commission on Civil Rights 27 16 59.3%
Farm Credit System Insurance Corporation 11 <10 —
Federal Mine Safety and Health Review Commission 43 13 30.2%
Institute Of Museum and Library Services 61 47 77.0%
Inter-American Foundation 33 29 87.9%
Marine Mammal Commission 10 <10 —
National Capital Planning Commission 33 24 72.7%
National Mediation Board 30 21 70.0%
Occupational Safety and Health Review Commission 46 20 43.5%
Office of Navajo and Hopi Indian Relocation 29 16 55.2%
Postal Regulatory Commission 62 54 87.1%
U.S. Access Board 26 15 57.7%
U.S. Office of Government Ethics 62 48 77.4%
U.S. Trade and Development Agency 38 24 63.2%
Note: Agencies with fewer than 10 responses are indicated with “—”.
Appendix A: Participating Agency Response Rates by Employee Population Size Categories
20
Appendix B: Analytical Methods and Additional FEVS Resources
Analytical MethodsThe data collected from 2018 survey respondents were weighted to ensure survey estimates accurately represent the survey population. Use of unweighted data could produce biased estimates of population statistics. The final data set reflects the agency composition and demographic makeup of the Federal workforce within plus or minus 1 percentage point. Demographic results are not weighted. OPM employed a number of grouping procedures to simplify presentation of data analysis results in this report. Most of the items had six response categories: Strongly Agree, Agree, Neither Agree nor Disagree, Disagree, Strongly Disagree, and No Basis to Judge/Do Not Know. In some instances, these responses are collapsed into one positive category (Strongly Agree and Agree), one negative category (Strongly Disagree and Disagree), and a neutral category (Neither Agree nor Disagree). For more information on FEVS methods, including data weighting and analysis, see the FEVS Technical Report at https://www.opm.gov/fevs/reports/technical-reports.
Additional FEVS ResourcesThere are multiple FEVS governmentwide resources and tools available. Each is described with links below for ease of access.
WebsitesFEVS website Agencies and the general public can access governmentwide data reports, as well as special topic reports and infographics
produced from the FEVS. The website includes results from the 2004 administration of the survey to the present. Access the FEVS website at www.opm.gov/FEVS. Questions and feedback for the site can be sent to [email protected].
UnlockTalent A tool available to both the public and agencies for viewing comprehensive data visualizations with broad displays
of FEVS data. These displays allow agencies to identify subcomponents for action to improve engagement and overall satisfaction as well as highlight indicators that can contribute to a high performing organization. Agency specific case studies, best practices, videos, trainings, and other helpful resources can be found on the UnlockTalent Connect page. This site can be accessed at www.unlocktalent.gov. Questions and feedback can be sent to [email protected].
DataPublic Release Data File (PRDF) A public release data file will be available for the FEVS. Data from 2017 and years prior are available for download
at: https://www.opm.gov/fevs/public-data-file. Note: The 2018 PRDF will be available no later than November 2018.
Other FEVS Reports and Governmentwide Data Reports In addition to the Governmentwide Management Report, there are three additional governmentwide data reports
available on the FEVS website under “Reports” (access the FEVS website at https://www.opm.gov/fevs/reports).
Report by AgencyDisplays question-by-question counts and percentages for each response option of the FEVS by participating agency and also governmentwide. Reports are available as far back as 2004.
Report by DemographicsDisplays question-by-question counts and percentages for each response option of the FEVS by demographic groups and also governmentwide. Reports are available as far back as 2004.
Report on Demographic Questions by Agency (unweighted)Displays counts and percentages by participating agencies’ demographic and workforce profile (e.g., work location, supervisory status, sex, age, pay category, intention to retire) of the FEVS. Both respondent counts and percentage estimates are unweighted. Reports are available as far back as 2004.
Appendix B: Analytical Methods and Additional FEVS Resources
21
Appendix B: Analytical Methods and Additional FEVS Resources (continued)
Other FEVS Related Data For benchmarking purposes, results for the FEVS Employee Engagement Index and items in regulation (5 USC,
Part 250, Subpart C) from the U.S. Department of Veterans Affairs’ workforce survey are linked here: https://www.va.gov/NCOD/VAworkforcesurveys.asp.
Appendix B: Analytical Methods and Additional FEVS Resources
22
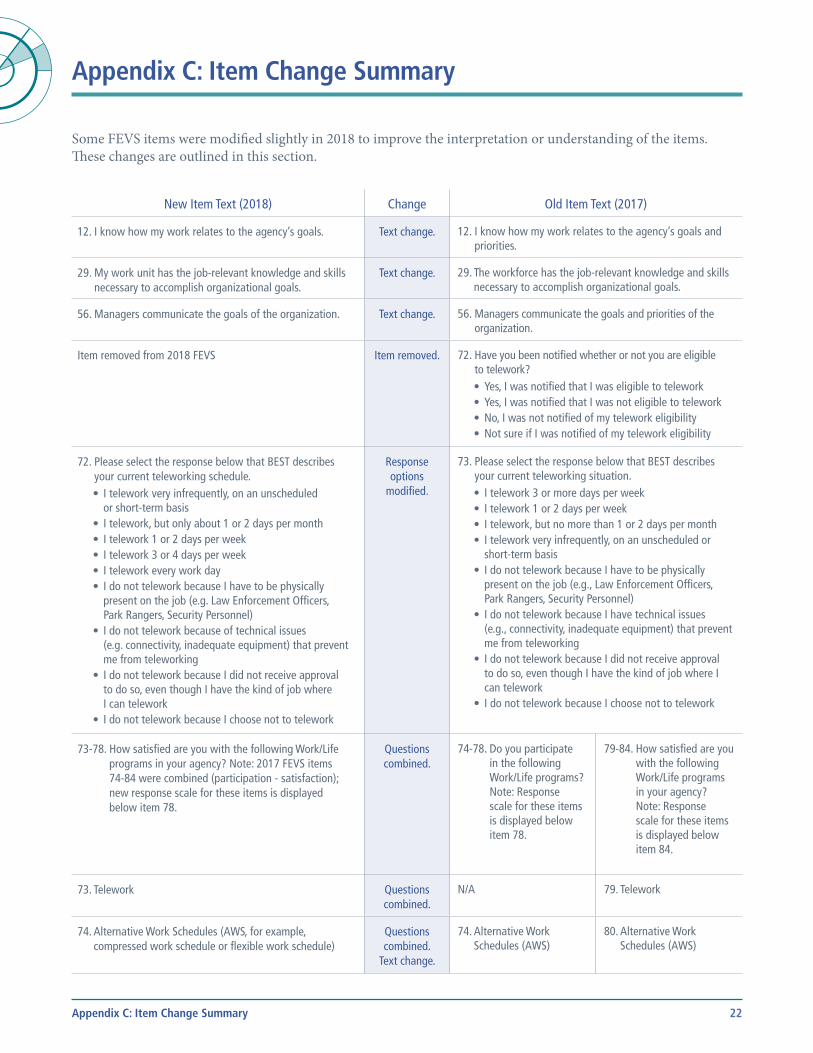
Appendix C: Item Change Summary
Some FEVS items were modified slightly in 2018 to improve the interpretation or understanding of the items. These changes are outlined in this section.
New Item Text (2018) Change Old Item Text (2017)New Item Text (2018).
12. I know how my work relates to the agency’s goals.Change.
Text change.Old Item Text (2017).
12. I know how my work relates to the agency’s goals and priorities.
New Item Text (2018).
29. My work unit has the job-relevant knowledge and skills necessary to accomplish organizational goals.
Change.
Text change.Old Item Text (2017).
29. The workforce has the job-relevant knowledge and skills necessary to accomplish organizational goals.
New Item Text (2018).
56. Managers communicate the goals of the organization.Change.
Text change.Old Item Text (2017).
56. Managers communicate the goals and priorities of the organization.
New Item Text (2018).
Item removed from 2018 FEVSChange.
Item removed.Old Item Text (2017).
72. Have you been notified whether or not you are eligible to telework?• Yes, I was notified that I was eligible to telework• Yes, I was notified that I was not eligible to telework• No, I was not notified of my telework eligibility• Not sure if I was notified of my telework eligibility
New Item Text (2018).
72. Please select the response below that BEST describes your current teleworking schedule.• I telework very infrequently, on an unscheduled
or short-term basis• I telework, but only about 1 or 2 days per month• I telework 1 or 2 days per week• I telework 3 or 4 days per week• I telework every work day• I do not telework because I have to be physically
present on the job (e.g. Law Enforcement Officers, Park Rangers, Security Personnel)
• I do not telework because of technical issues (e.g. connectivity, inadequate equipment) that prevent me from teleworking
• I do not telework because I did not receive approval to do so, even though I have the kind of job where I can telework
• I do not telework because I choose not to telework
Change.
Response options
modified.
Old Item Text (2017).
73. Please select the response below that BEST describes your current teleworking situation.• I telework 3 or more days per week• I telework 1 or 2 days per week• I telework, but no more than 1 or 2 days per month• I telework very infrequently, on an unscheduled or
short-term basis• I do not telework because I have to be physically
present on the job (e.g., Law Enforcement Officers, Park Rangers, Security Personnel)
• I do not telework because I have technical issues (e.g., connectivity, inadequate equipment) that prevent me from teleworking
• I do not telework because I did not receive approval to do so, even though I have the kind of job where I can telework
• I do not telework because I choose not to telework
New Item Text (2018).
73-78. How satisfied are you with the following Work/Life programs in your agency? Note: 2017 FEVS items 74-84 were combined (participation - satisfaction); new response scale for these items is displayed below item 78.
Change.
Questions combined.
Old Participation Item Text (2017).
74-78. Do you participate in the following Work/Life programs? Note: Response scale for these items is displayed below item 78.
Old Satisfaction Item Text (2017).
79-84. How satisfied are you with the following Work/Life programs in your agency? Note: Response scale for these items is displayed below item 84.
New Item Text (2018).
73. TeleworkChange.
Questions combined.
Old Participation Item Text (2017). Telework:
N/AOld Satisfaction Item Text (2017).
79. Telework
New Item Text (2018).
74. Alternative Work Schedules (AWS, for example, compressed work schedule or flexible work schedule)
Change.
Questions combined.
Text change.
Old Participation Item Text (2017).
74. Alternative Work Schedules (AWS)
Old Satisfaction Item Text (2017).
80. Alternative Work Schedules (AWS)
Appendix C: Item Change Summary
23
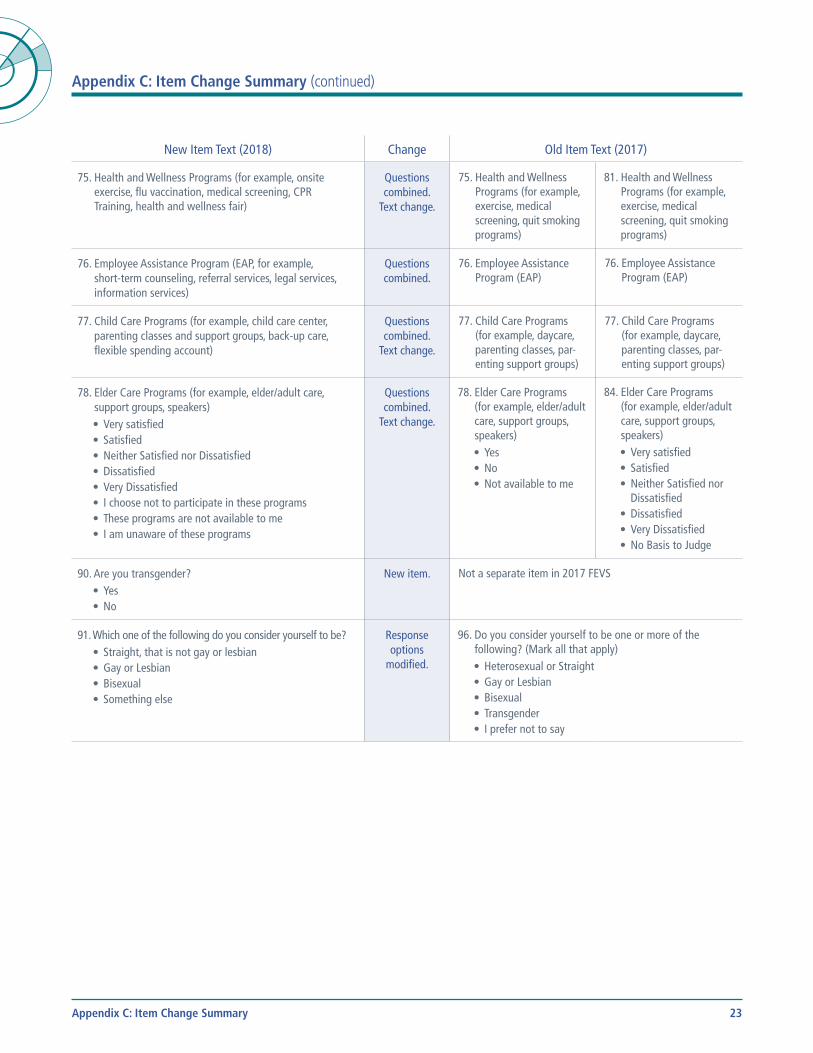
Appendix C: Item Change Summary (continued)
New Item Text (2018) Change Old Item Text (2017)New Item Text (2018).
75. Health and Wellness Programs (for example, onsite exercise, flu vaccination, medical screening, CPR Training, health and wellness fair)
Change.
Questions combined.
Text change.
Old Participation Item Text (2017).
75. Health and Wellness Programs (for example, exercise, medical screening, quit smoking programs)
Old Satisfaction Item Text (2017).
81. Health and Wellness Programs (for example, exercise, medical screening, quit smoking programs)
New Item Text (2018).
76. Employee Assistance Program (EAP, for example, short-term counseling, referral services, legal services, information services)
Change.
Questions combined.
Old Participation Item Text (2017).
76. Employee Assistance Program (EAP)
Old Satisfaction Item Text (2017).
76. Employee Assistance Program (EAP)
New Item Text (2018).
77. Child Care Programs (for example, child care center, parenting classes and support groups, back-up care, flexible spending account)
Change.
Questions combined.
Text change.
Old Participation Item Text (2017).
77. Child Care Programs (for example, daycare, parenting classes, par-enting support groups)
Old Satisfaction Item Text (2017).
77. Child Care Programs (for example, daycare, parenting classes, par-enting support groups)
New Item Text (2018).
78. Elder Care Programs (for example, elder/adult care, support groups, speakers)• Very satisfied• Satisfied• Neither Satisfied nor Dissatisfied• Dissatisfied• Very Dissatisfied• I choose not to participate in these programs• These programs are not available to me• I am unaware of these programs
Change.
Questions combined.
Text change.
Old Participation Item Text (2017).
78. Elder Care Programs (for example, elder/adult care, support groups, speakers)• Yes• No• Not available to me
Old Satisfaction Item Text (2017).
84. Elder Care Programs (for example, elder/adult care, support groups, speakers)• Very satisfied• Satisfied• Neither Satisfied nor
Dissatisfied• Dissatisfied• Very Dissatisfied• No Basis to Judge
New Item Text (2018).
90. Are you transgender?• Yes• No
Change.
New item.Old Item Text (2017).
Not a separate item in 2017 FEVS
New Item Text (2018).
91. Which one of the following do you consider yourself to be?• Straight, that is not gay or lesbian• Gay or Lesbian• Bisexual• Something else
Change.
Response options
modified.
Old Item Text (2017).
96. Do you consider yourself to be one or more of the following? (Mark all that apply)• Heterosexual or Straight• Gay or Lesbian• Bisexual• Transgender• I prefer not to say
Appendix C: Item Change Summary
24
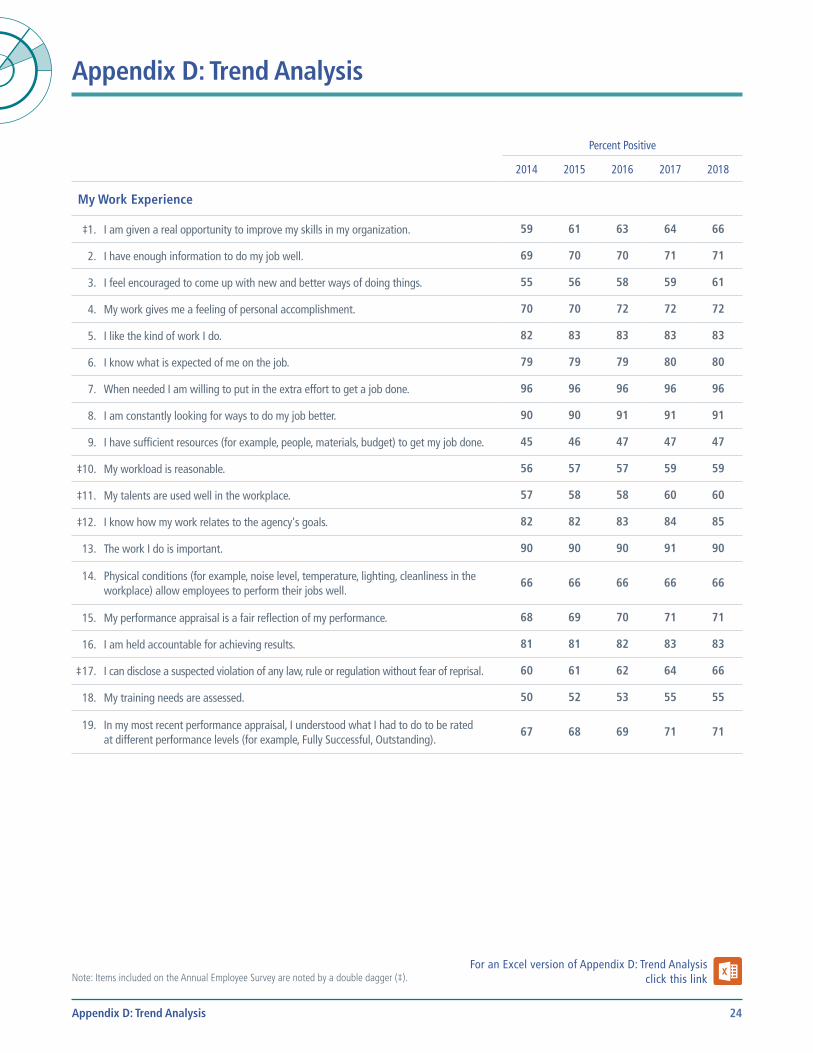
Appendix D: Trend Analysis
Percent Positive
2014 2015 2016 2017 2018
My Work Experience
‡1. I am given a real opportunity to improve my skills in my organization. 59 61 63 64 66
2. I have enough information to do my job well. 69 70 70 71 71
3. I feel encouraged to come up with new and better ways of doing things. 55 56 58 59 61
4. My work gives me a feeling of personal accomplishment. 70 70 72 72 72
5. I like the kind of work I do. 82 83 83 83 83
6. I know what is expected of me on the job. 79 79 79 80 80
7. When needed I am willing to put in the extra effort to get a job done. 96 96 96 96 96
8. I am constantly looking for ways to do my job better. 90 90 91 91 91
9. I have sufficient resources (for example, people, materials, budget) to get my job done. 45 46 47 47 47
‡10. My workload is reasonable. 56 57 57 59 59
‡11. My talents are used well in the workplace. 57 58 58 60 60
‡12. I know how my work relates to the agency's goals. 82 82 83 84 85
13. The work I do is important. 90 90 90 91 90
14. Physical conditions (for example, noise level, temperature, lighting, cleanliness in the workplace) allow employees to perform their jobs well.
66 66 66 66 66
15. My performance appraisal is a fair reflection of my performance. 68 69 70 71 71
16. I am held accountable for achieving results. 81 81 82 83 83
‡ 17. I can disclose a suspected violation of any law, rule or regulation without fear of reprisal. 60 61 62 64 66
18. My training needs are assessed. 50 52 53 55 55
19. In my most recent performance appraisal, I understood what I had to do to be rated at different performance levels (for example, Fully Successful, Outstanding).
67 68 69 71 71
Note: Items included on the Annual Employee Survey are noted by a double dagger (‡).For an Excel version of Appendix D: Trend Analysis
click this link
Appendix D: Trend Analysis
25
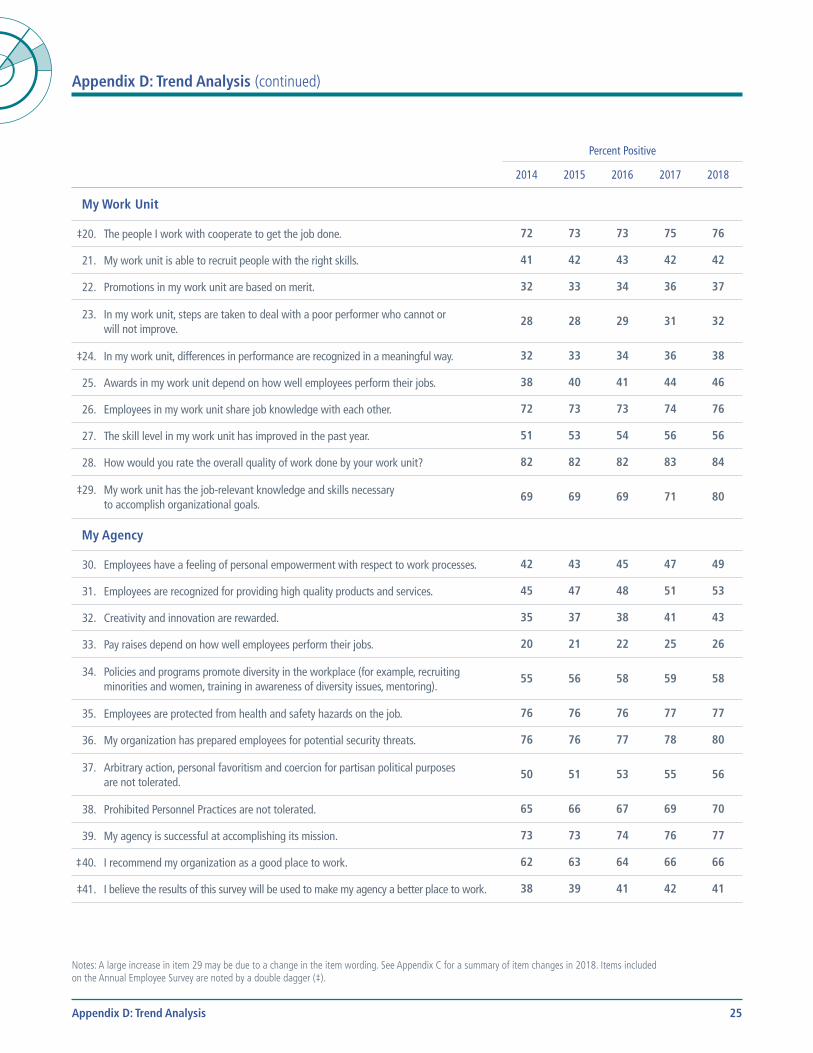
Appendix D: Trend Analysis (continued)
Percent Positive
2014 2015 2016 2017 2018
My Work Unit
‡20. The people I work with cooperate to get the job done. 72 73 73 75 76
21. My work unit is able to recruit people with the right skills. 41 42 43 42 42
22. Promotions in my work unit are based on merit. 32 33 34 36 37
23. In my work unit, steps are taken to deal with a poor performer who cannot or will not improve.
28 28 29 31 32
‡24. In my work unit, differences in performance are recognized in a meaningful way. 32 33 34 36 38
25. Awards in my work unit depend on how well employees perform their jobs. 38 40 41 44 46
26. Employees in my work unit share job knowledge with each other. 72 73 73 74 76
27. The skill level in my work unit has improved in the past year. 51 53 54 56 56
28. How would you rate the overall quality of work done by your work unit? 82 82 82 83 84
‡29. My work unit has the job-relevant knowledge and skills necessary to accomplish organizational goals.
69 69 69 71 80
My Agency
30. Employees have a feeling of personal empowerment with respect to work processes. 42 43 45 47 49
31. Employees are recognized for providing high quality products and services. 45 47 48 51 53
32. Creativity and innovation are rewarded. 35 37 38 41 43
33. Pay raises depend on how well employees perform their jobs. 20 21 22 25 26
34. Policies and programs promote diversity in the workplace (for example, recruiting minorities and women, training in awareness of diversity issues, mentoring).
55 56 58 59 58
35. Employees are protected from health and safety hazards on the job. 76 76 76 77 77
36. My organization has prepared employees for potential security threats. 76 76 77 78 80
37. Arbitrary action, personal favoritism and coercion for partisan political purposes are not tolerated.
50 51 53 55 56
38. Prohibited Personnel Practices are not tolerated. 65 66 67 69 70
39. My agency is successful at accomplishing its mission. 73 73 74 76 77
‡ 40. I recommend my organization as a good place to work. 62 63 64 66 66
‡41. I believe the results of this survey will be used to make my agency a better place to work. 38 39 41 42 41
Notes: A large increase in item 29 may be due to a change in the item wording. See Appendix C for a summary of item changes in 2018. Items included on the Annual Employee Survey are noted by a double dagger (‡).
Appendix D: Trend Analysis
26
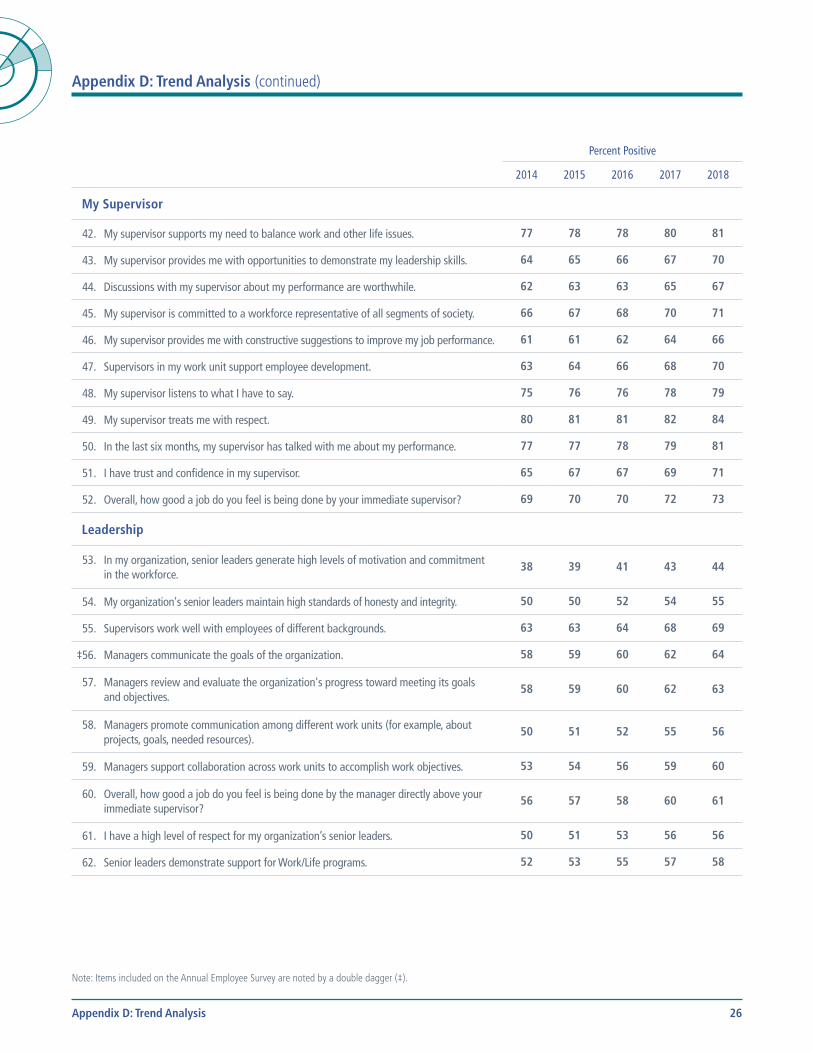
Appendix D: Trend Analysis (continued)
Percent Positive
2014 2015 2016 2017 2018
My Supervisor
42. My supervisor supports my need to balance work and other life issues. 77 78 78 80 81
43. My supervisor provides me with opportunities to demonstrate my leadership skills. 64 65 66 67 70
44. Discussions with my supervisor about my performance are worthwhile. 62 63 63 65 67
45. My supervisor is committed to a workforce representative of all segments of society. 66 67 68 70 71
46. My supervisor provides me with constructive suggestions to improve my job performance. 61 61 62 64 66
47. Supervisors in my work unit support employee development. 63 64 66 68 70
48. My supervisor listens to what I have to say. 75 76 76 78 79
49. My supervisor treats me with respect. 80 81 81 82 84
50. In the last six months, my supervisor has talked with me about my performance. 77 77 78 79 81
51. I have trust and confidence in my supervisor. 65 67 67 69 71
52. Overall, how good a job do you feel is being done by your immediate supervisor? 69 70 70 72 73
Leadership
53. In my organization, senior leaders generate high levels of motivation and commitment in the workforce.
38 39 41 43 44
54. My organization's senior leaders maintain high standards of honesty and integrity. 50 50 52 54 55
55. Supervisors work well with employees of different backgrounds. 63 63 64 68 69
‡56. Managers communicate the goals of the organization. 58 59 60 62 64
57. Managers review and evaluate the organization's progress toward meeting its goals and objectives.
58 59 60 62 63
58. Managers promote communication among different work units (for example, about projects, goals, needed resources).
50 51 52 55 56
59. Managers support collaboration across work units to accomplish work objectives. 53 54 56 59 60
60. Overall, how good a job do you feel is being done by the manager directly above your immediate supervisor?
56 57 58 60 61
61. I have a high level of respect for my organization’s senior leaders. 50 51 53 56 56
62. Senior leaders demonstrate support for Work/Life programs. 52 53 55 57 58
Note: Items included on the Annual Employee Survey are noted by a double dagger (‡).
Appendix D: Trend Analysis
27
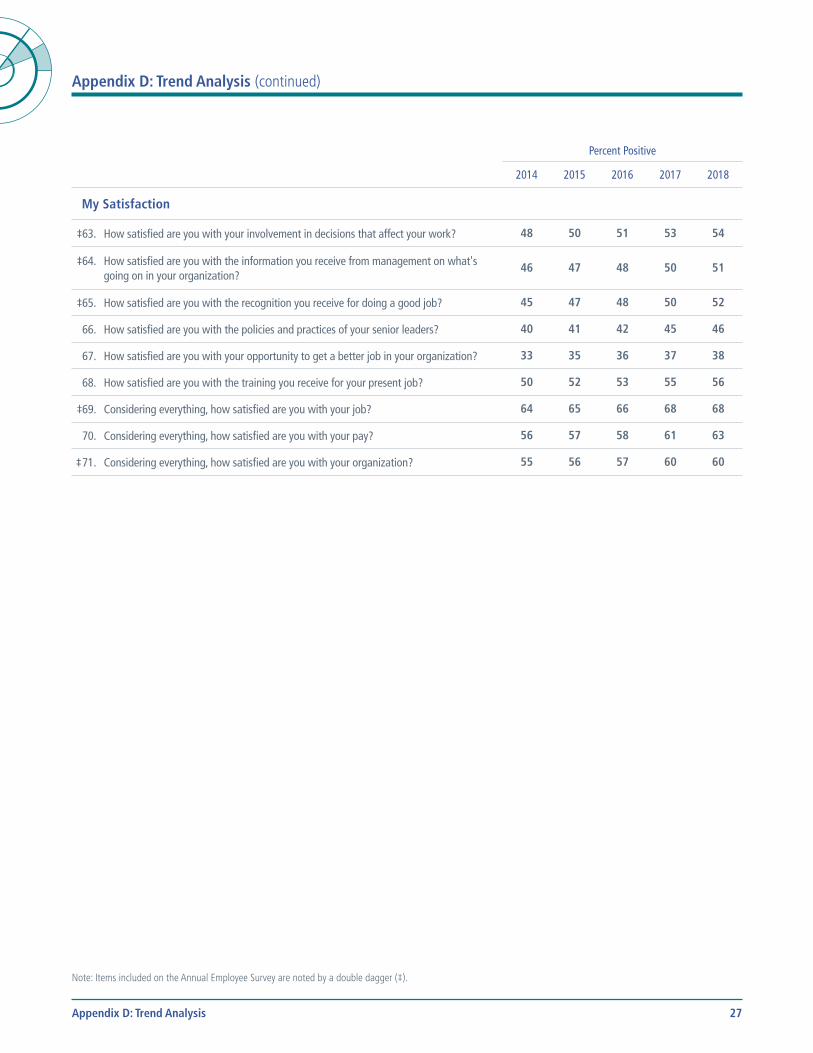
Appendix D: Trend Analysis (continued)
Percent Positive
2014 2015 2016 2017 2018
My Satisfaction
‡63. How satisfied are you with your involvement in decisions that affect your work? 48 50 51 53 54
‡64. How satisfied are you with the information you receive from management on what's going on in your organization?
46 47 48 50 51
‡65. How satisfied are you with the recognition you receive for doing a good job? 45 47 48 50 52
66. How satisfied are you with the policies and practices of your senior leaders? 40 41 42 45 46
67. How satisfied are you with your opportunity to get a better job in your organization? 33 35 36 37 38
68. How satisfied are you with the training you receive for your present job? 50 52 53 55 56
‡69. Considering everything, how satisfied are you with your job? 64 65 66 68 68
70. Considering everything, how satisfied are you with your pay? 56 57 58 61 63
‡ 71. Considering everything, how satisfied are you with your organization? 55 56 57 60 60
Note: Items included on the Annual Employee Survey are noted by a double dagger (‡).
Appendix D: Trend Analysis
28
Appendix E: Work/Life Program Results
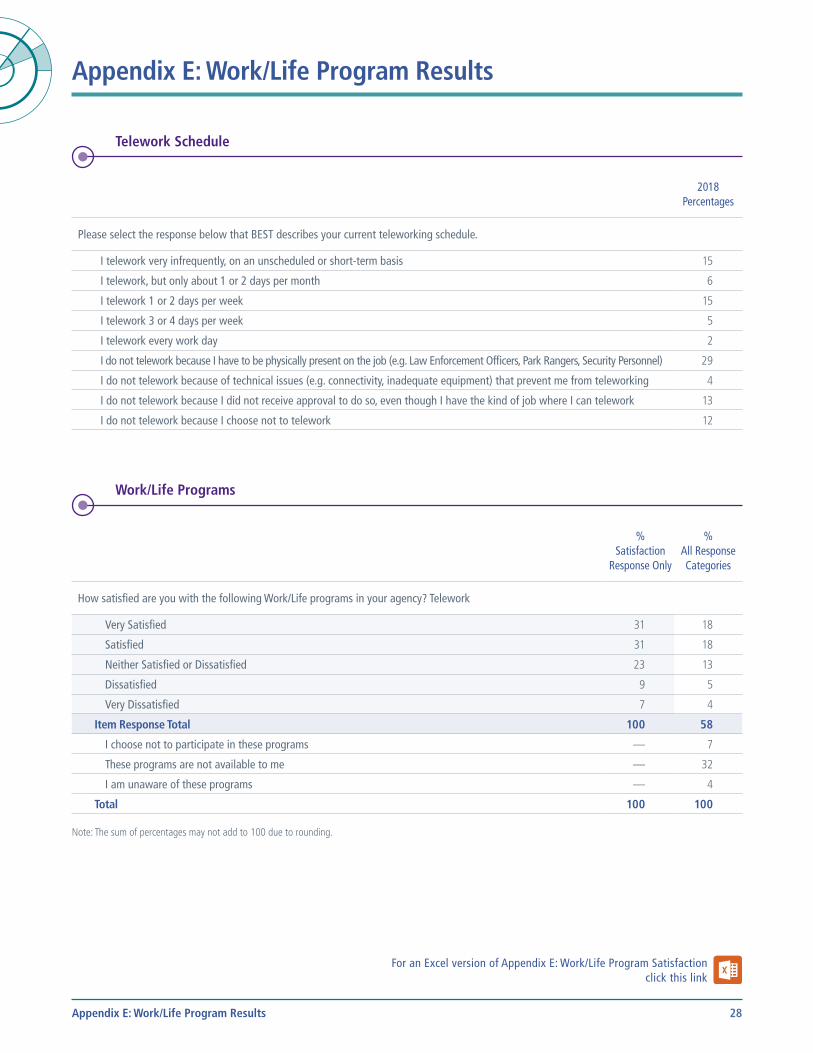
Telework Schedule
2018
Percentages
Please select the response below that BEST describes your current teleworking schedule.
I telework very infrequently, on an unscheduled or short-term basis 15
I telework, but only about 1 or 2 days per month 6
I telework 1 or 2 days per week 15
I telework 3 or 4 days per week 5
I telework every work day 2
I do not telework because I have to be physically present on the job (e.g. Law Enforcement Officers, Park Rangers, Security Personnel) 29
I do not telework because of technical issues (e.g. connectivity, inadequate equipment) that prevent me from teleworking 4
I do not telework because I did not receive approval to do so, even though I have the kind of job where I can telework 13
I do not telework because I choose not to telework 12
Work/Life Programs
% Satisfaction
Response Only
% All Response Categories
How satisfied are you with the following Work/Life programs in your agency? Telework
Very Satisfied 31 18
Satisfied 31 18
Neither Satisfied or Dissatisfied 23 13
Dissatisfied 9 5
Very Dissatisfied 7 4
Item Response Total 100 58
I choose not to participate in these programs — 7
These programs are not available to me — 32
I am unaware of these programs — 4
Total 100 100
Note: The sum of percentages may not add to 100 due to rounding.
For an Excel version of Appendix E: Work/Life Program Satisfactionclick this link
Appendix E: Work/Life Program Results
29
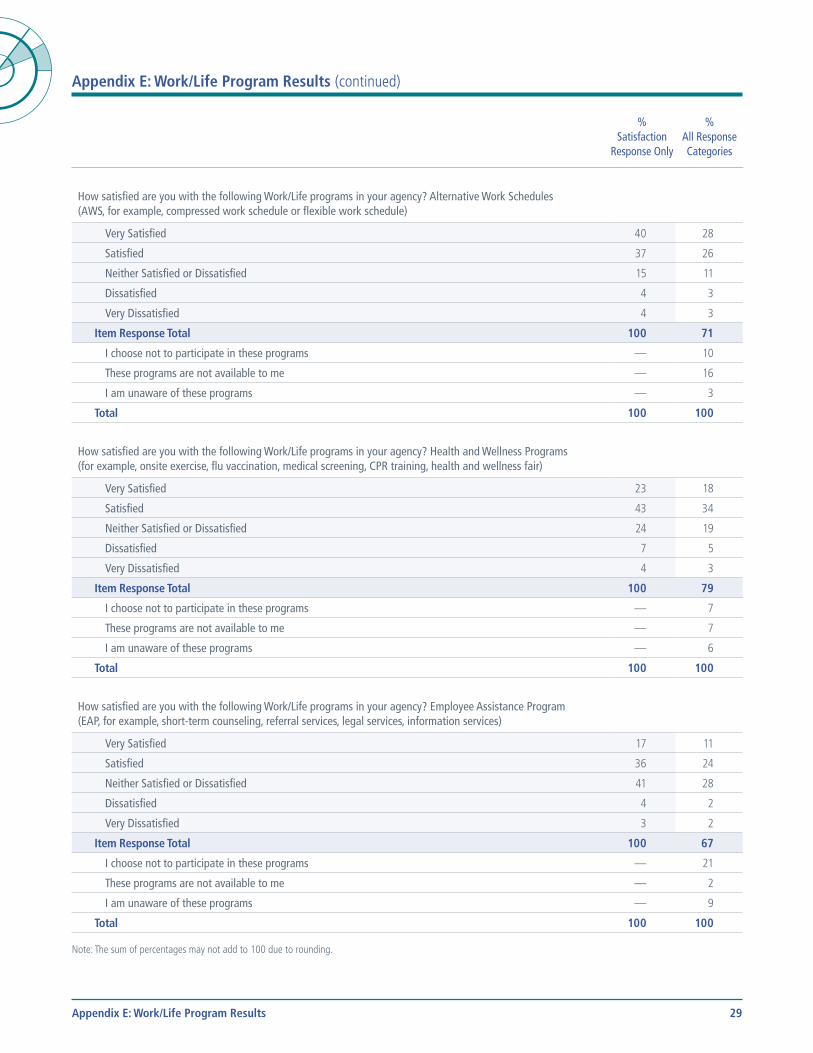
Appendix E: Work/Life Program Results (continued)
% Satisfaction
Response Only
% All Response Categories
How satisfied are you with the following Work/Life programs in your agency? Alternative Work Schedules (AWS, for example, compressed work schedule or flexible work schedule)
Very Satisfied 40 28
Satisfied 37 26
Neither Satisfied or Dissatisfied 15 11
Dissatisfied 4 3
Very Dissatisfied 4 3
Item Response Total 100 71
I choose not to participate in these programs — 10
These programs are not available to me — 16
I am unaware of these programs — 3
Total 100 100
How satisfied are you with the following Work/Life programs in your agency? Health and Wellness Programs (for example, onsite exercise, flu vaccination, medical screening, CPR training, health and wellness fair)
Very Satisfied 23 18
Satisfied 43 34
Neither Satisfied or Dissatisfied 24 19
Dissatisfied 7 5
Very Dissatisfied 4 3
Item Response Total 100 79
I choose not to participate in these programs — 7
These programs are not available to me — 7
I am unaware of these programs — 6
Total 100 100
How satisfied are you with the following Work/Life programs in your agency? Employee Assistance Program (EAP, for example, short-term counseling, referral services, legal services, information services)
Very Satisfied 17 11
Satisfied 36 24
Neither Satisfied or Dissatisfied 41 28
Dissatisfied 4 2
Very Dissatisfied 3 2
Item Response Total 100 67
I choose not to participate in these programs — 21
These programs are not available to me — 2
I am unaware of these programs — 9
Total 100 100
Note: The sum of percentages may not add to 100 due to rounding.
Appendix E: Work/Life Program Results
30
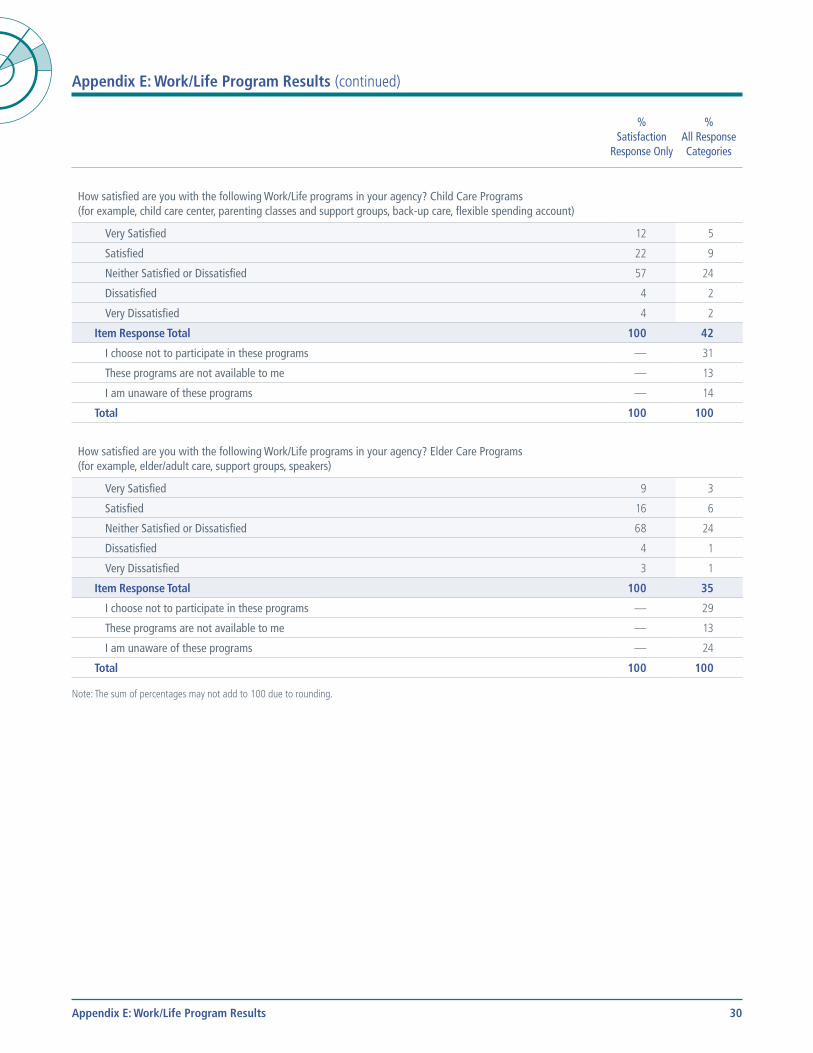
Appendix E: Work/Life Program Results (continued)
% Satisfaction
Response Only
% All Response Categories
How satisfied are you with the following Work/Life programs in your agency? Child Care Programs (for example, child care center, parenting classes and support groups, back-up care, flexible spending account)
Very Satisfied 12 5
Satisfied 22 9
Neither Satisfied or Dissatisfied 57 24
Dissatisfied 4 2
Very Dissatisfied 4 2
Item Response Total 100 42
I choose not to participate in these programs — 31
These programs are not available to me — 13
I am unaware of these programs — 14
Total 100 100
How satisfied are you with the following Work/Life programs in your agency? Elder Care Programs (for example, elder/adult care, support groups, speakers)
Very Satisfied 9 3
Satisfied 16 6
Neither Satisfied or Dissatisfied 68 24
Dissatisfied 4 1
Very Dissatisfied 3 1
Item Response Total 100 35
I choose not to participate in these programs — 29
These programs are not available to me — 13
I am unaware of these programs — 24
Total 100 100
Note: The sum of percentages may not add to 100 due to rounding.
Appendix E: Work/Life Program Results
31
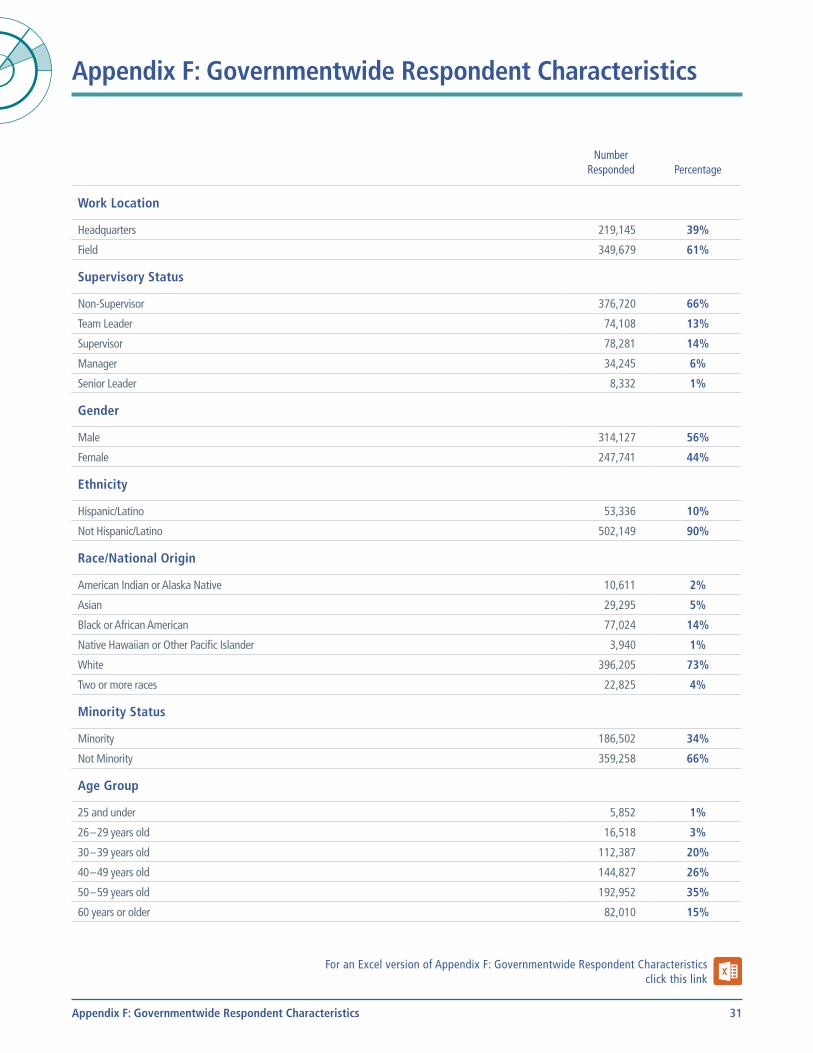
Appendix F: Governmentwide Respondent Characteristics
NumberResponded Percentage
Work Location
Headquarters 219,145 39%
Field 349,679 61%
Supervisory Status
Non-Supervisor 376,720 66%
Team Leader 74,108 13%
Supervisor 78,281 14%
Manager 34,245 6%
Senior Leader 8,332 1%
Gender
Male 314,127 56%
Female 247,741 44%
Ethnicity
Hispanic/Latino 53,336 10%
Not Hispanic/Latino 502,149 90%
Race/National Origin
American Indian or Alaska Native 10,611 2%
Asian 29,295 5%
Black or African American 77,024 14%
Native Hawaiian or Other Pacific Islander 3,940 1%
White 396,205 73%
Two or more races 22,825 4%
Minority Status
Minority 186,502 34%
Not Minority 359,258 66%
Age Group
25 and under 5,852 1%
26 – 29 years old 16,518 3%
30 – 39 years old 112,387 20%
40 – 49 years old 144,827 26%
50 – 59 years old 192,952 35%
60 years or older 82,010 15%
For an Excel version of Appendix F: Governmentwide Respondent Characteristicsclick this link
Appendix F: Governmentwide Respondent Characteristics
32
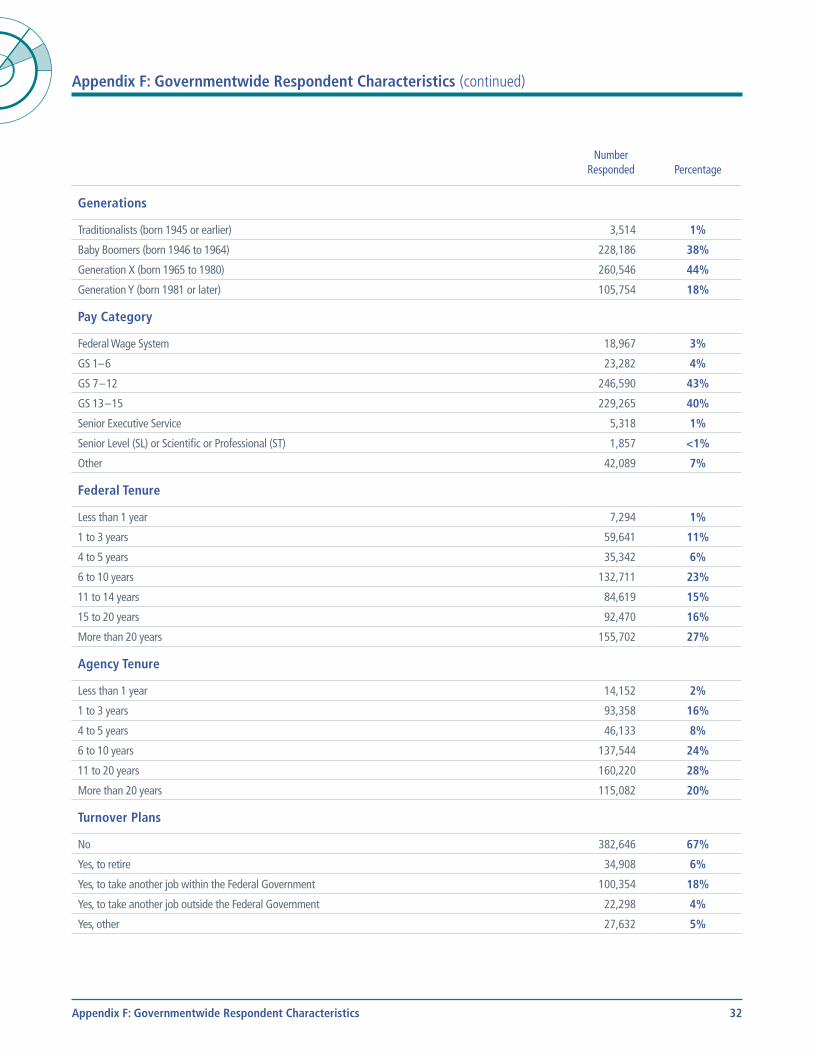
Appendix F: Governmentwide Respondent Characteristics (continued)
NumberResponded Percentage
Generations
Traditionalists (born 1945 or earlier) 3,514 1%
Baby Boomers (born 1946 to 1964) 228,186 38%
Generation X (born 1965 to 1980) 260,546 44%
Generation Y (born 1981 or later) 105,754 18%
Pay Category
Federal Wage System 18,967 3%
GS 1– 6 23,282 4%
GS 7 – 12 246,590 43%
GS 13 – 15 229,265 40%
Senior Executive Service 5,318 1%
Senior Level (SL) or Scientific or Professional (ST) 1,857 <1%
Other 42,089 7%
Federal Tenure
Less than 1 year 7,294 1%
1 to 3 years 59,641 11%
4 to 5 years 35,342 6%
6 to 10 years 132,711 23%
11 to 14 years 84,619 15%
15 to 20 years 92,470 16%
More than 20 years 155,702 27%
Agency Tenure
Less than 1 year 14,152 2%
1 to 3 years 93,358 16%
4 to 5 years 46,133 8%
6 to 10 years 137,544 24%
11 to 20 years 160,220 28%
More than 20 years 115,082 20%
Turnover Plans
No 382,646 67%
Yes, to retire 34,908 6%
Yes, to take another job within the Federal Government 100,354 18%
Yes, to take another job outside the Federal Government 22,298 4%
Yes, other 27,632 5%
Appendix F: Governmentwide Respondent Characteristics
33
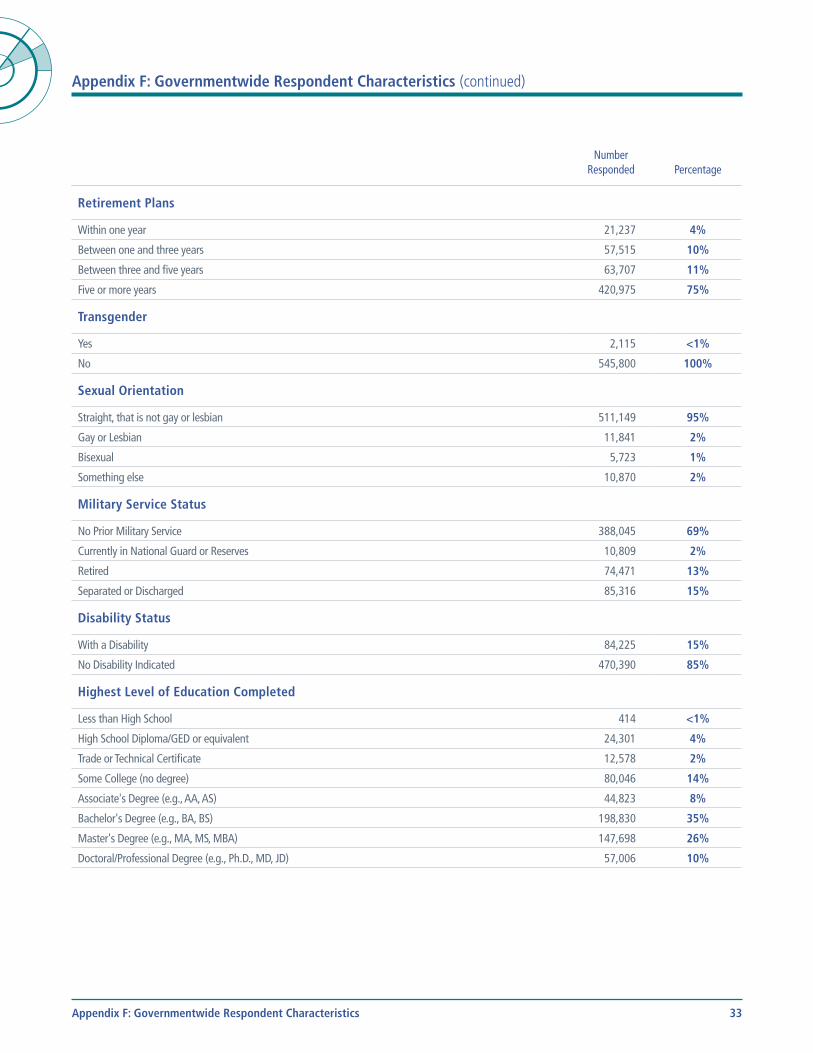
Appendix F: Governmentwide Respondent Characteristics (continued)
NumberResponded Percentage
Retirement Plans
Within one year 21,237 4%
Between one and three years 57,515 10%
Between three and five years 63,707 11%
Five or more years 420,975 75%
Transgender
Yes 2,115 <1%
No 545,800 100%
Sexual Orientation
Straight, that is not gay or lesbian 511,149 95%
Gay or Lesbian 11,841 2%
Bisexual 5,723 1%
Something else 10,870 2%
Military Service Status
No Prior Military Service 388,045 69%
Currently in National Guard or Reserves 10,809 2%
Retired 74,471 13%
Separated or Discharged 85,316 15%
Disability Status
With a Disability 84,225 15%
No Disability Indicated 470,390 85%
Highest Level of Education Completed
Less than High School 414 <1%
High School Diploma/GED or equivalent 24,301 4%
Trade or Technical Certificate 12,578 2%
Some College (no degree) 80,046 14%
Associate's Degree (e.g., AA, AS) 44,823 8%
Bachelor's Degree (e.g., BA, BS) 198,830 35%
Master's Degree (e.g., MA, MS, MBA) 147,698 26%
Doctoral/Professional Degree (e.g., Ph.D., MD, JD) 57,006 10%
Appendix F: Governmentwide Respondent Characteristics
34
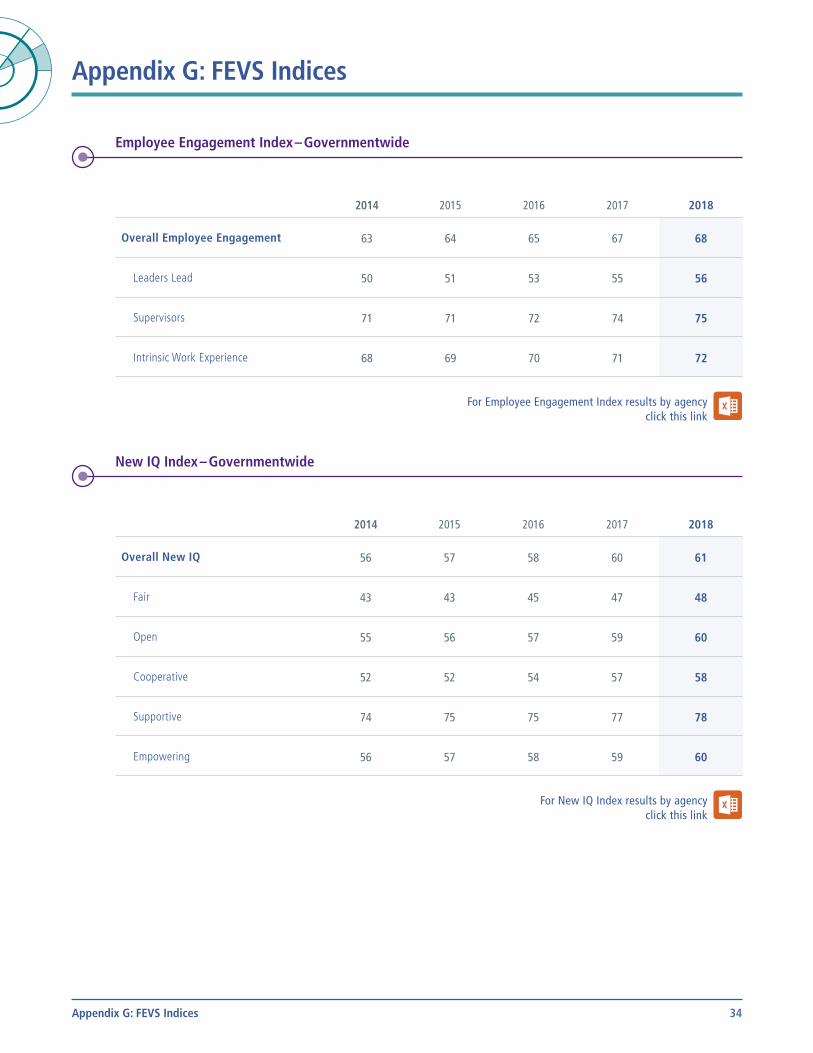
Appendix G: FEVS Indices
Employee Engagement Index – Governmentwide
2014 2015 2016 2017 2018
Overall Employee Engagement 63 64 65 67 68
Leaders Lead 50 51 53 55 56
Supervisors 71 71 72 74 75
Intrinsic Work Experience 68 69 70 71 72
For Employee Engagement Index results by agency click this link
New IQ Index – Governmentwide
2014 2015 2016 2017 2018
Overall New IQ 56 57 58 60 61
Fair 43 43 45 47 48
Open 55 56 57 59 60
Cooperative 52 52 54 57 58
Supportive 74 75 75 77 78
Empowering 56 57 58 59 60
For New IQ Index results by agency click this link
Appendix G: FEVS Indices
35
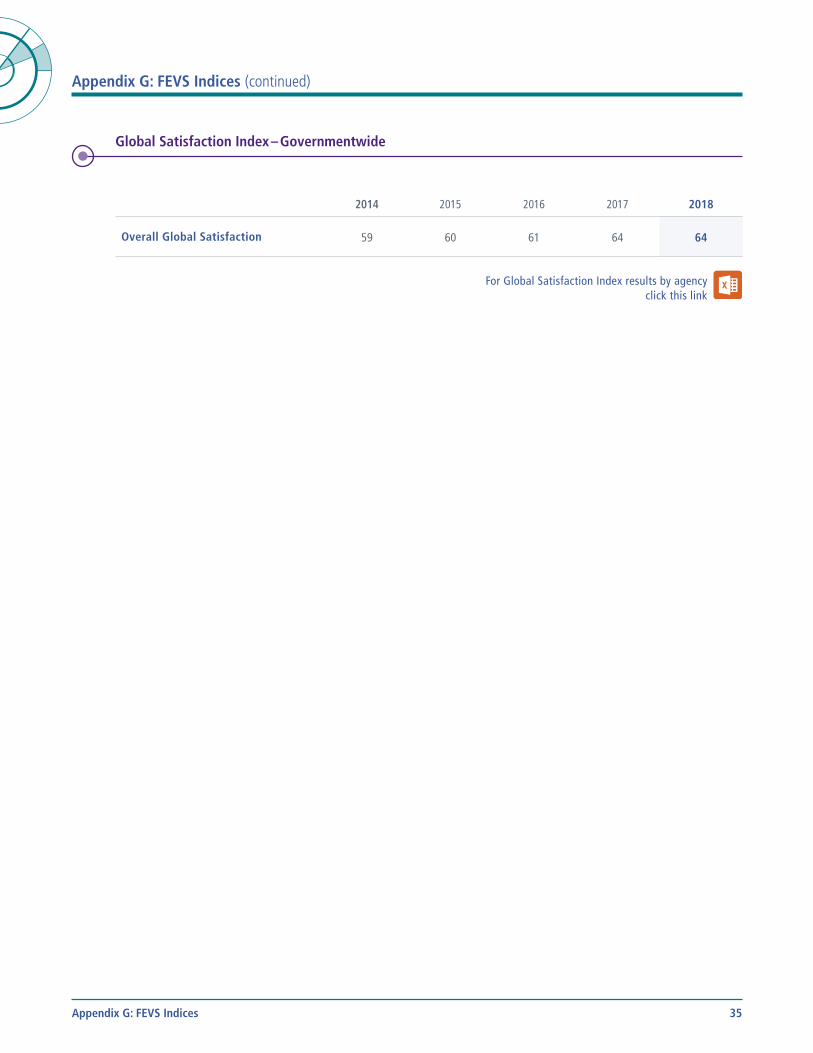
Appendix G: FEVS Indices (continued)
Global Satisfaction Index – Governmentwide
2014 2015 2016 2017 2018
Overall Global Satisfaction 59 60 61 64 64
For Global Satisfaction Index results by agency click this link
Appendix G: FEVS Indices
United States Office of Personnel Management Office of Strategy and Innovation
1900 E Street, NW Washington, DC 20415
www.opm.gov/FEVS
Recommended