Examiner’s use only
Team Leader’s use only
Surname Initial(s)
Signature
Turn over
Paper Reference
1 3 8 9 1 H Paper Reference(s)
1389/1HEdexcel GCSEStatisticsPaper 1H
Higher TierFriday 25 June 2010 – MorningTime: 2 hours 30 minutes
Materials required for examination Items included with question papersRuler graduated in centimetres and Nilmillimetres, protractor, compasses,pen, HB pencil, eraser, electronic calculator.
Instructions to CandidatesIn the boxes above, write your centre number, candidate number, your surname, initials and signature. Check that you have the correct question paper.Answer ALL the questions. Write your answers in the spaces provided in this question paper.You must NOT write on the formulae page or any blank pages. Anything you write on these pages will gain NO credit.If you need more space to complete your answer to any question, use additional answer sheets.
Information for CandidatesThe marks for individual questions and the parts of questions are shown in round brackets: e.g. (2).This question paper has 7 questions in Section A and 8 questions in Section B. The total mark for this paper is 100.There are 24 pages in this question paper. Any blank pages are indicated.
Advice to CandidatesShow all stages in any calculations.Work steadily through the paper. Do not spend too long on one question.If you cannot answer a question, leave it and attempt the next one.Return at the end to those you have left out.
Examiner’s use only
Team Leader’s use only
Surname Initial(s)
Signature
Centre No.
*H36632A0124*Turn over
Candidate No.
This publication may be reproduced only in accordance with Edexcel Limited copyright policy.©2010 Edexcel Limited.
Printer’s Log. No.
H36632AW850/R1389/57570 6/6/6/3
2
*H36632A0224*
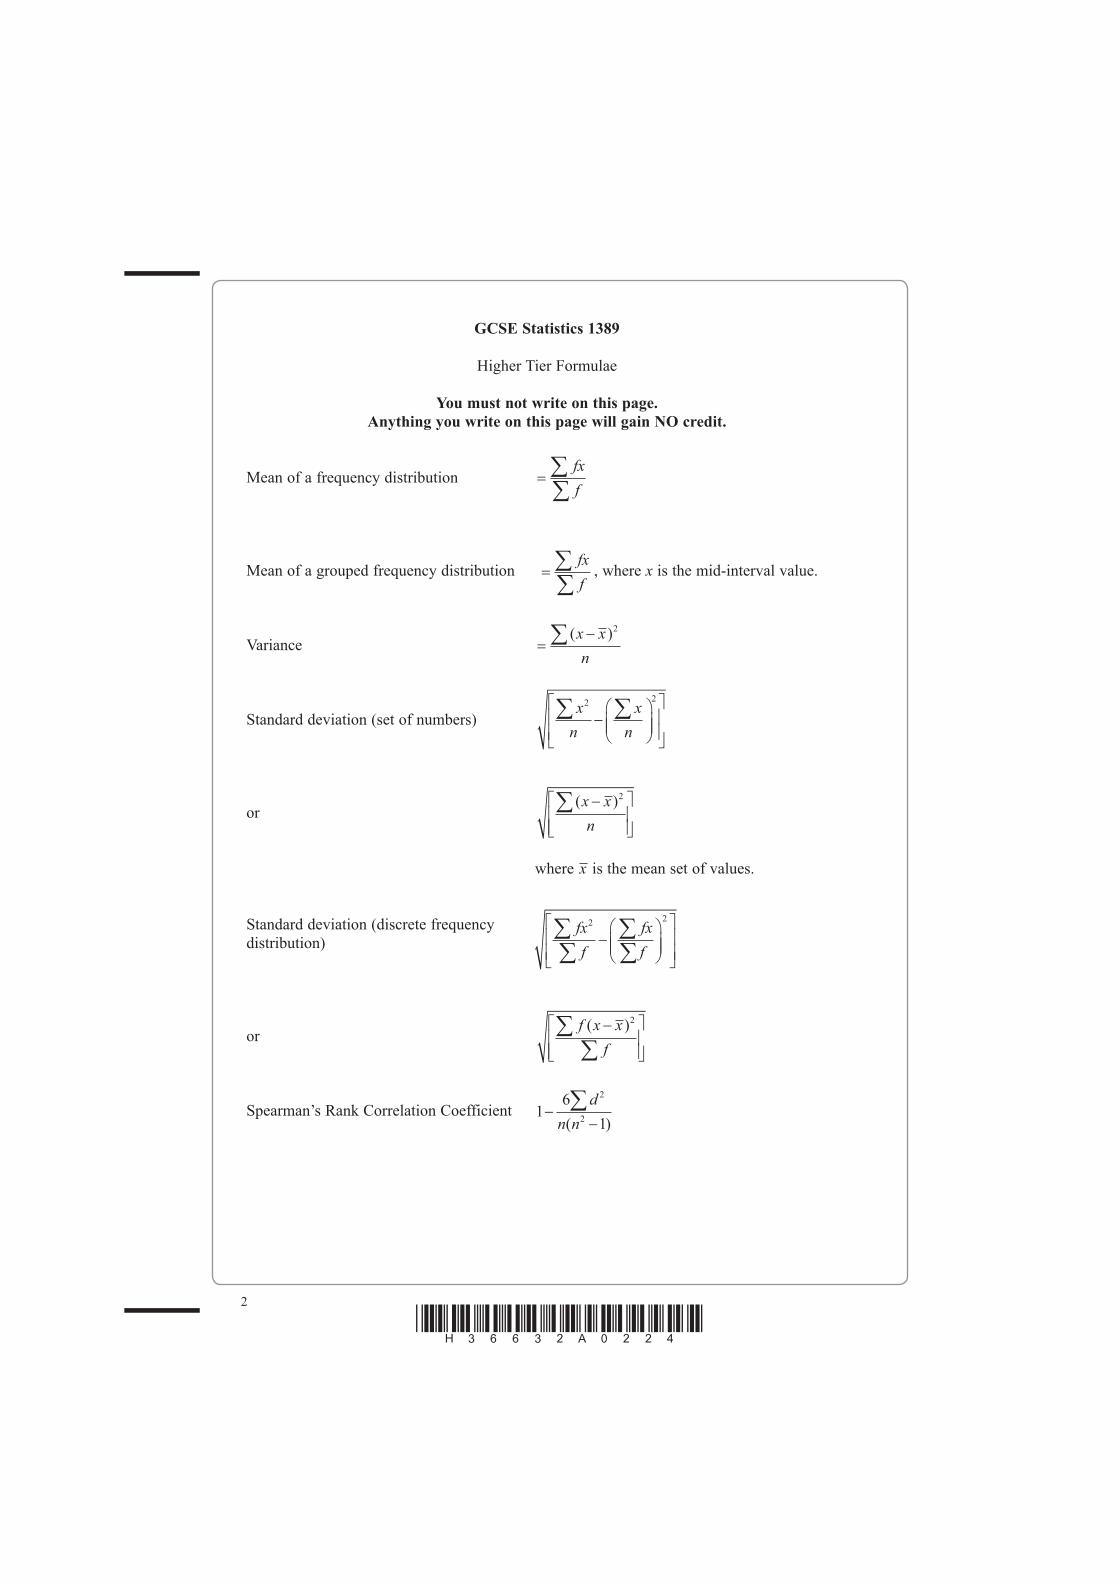
GCSE Statistics 1389
Higher Tier Formulae
You must not write on this page.Anything you write on this page will gain NO credit.
Mean of a frequency distribution fxf
Mean of a grouped frequency distribution fxf
, where x is the mid-interval value.
Variance ( )x x
n
2
Standard deviation (set of numbers) x
nx
n
2 2
or( )x x
n
2
where x is the mean set of values.
Standard deviation (discrete frequencydistribution)
fxf
fxf
2 2
∑∑ ∑
∑−⎛
⎝⎜⎜
⎞
⎠⎟⎟
⎡
⎣⎢⎢
⎤
⎦⎥⎥
orf x x
f( )2
Spearman’s Rank Correlation Coefficient 16
1
2
2
dn n( )
Leave blank
3
Turn over*H36632A0324*
Q1
(Total 6 marks)
SECTION A
Answer ALL the questions. Write your answers in the spaces provided.
You must write down all stages in your working.
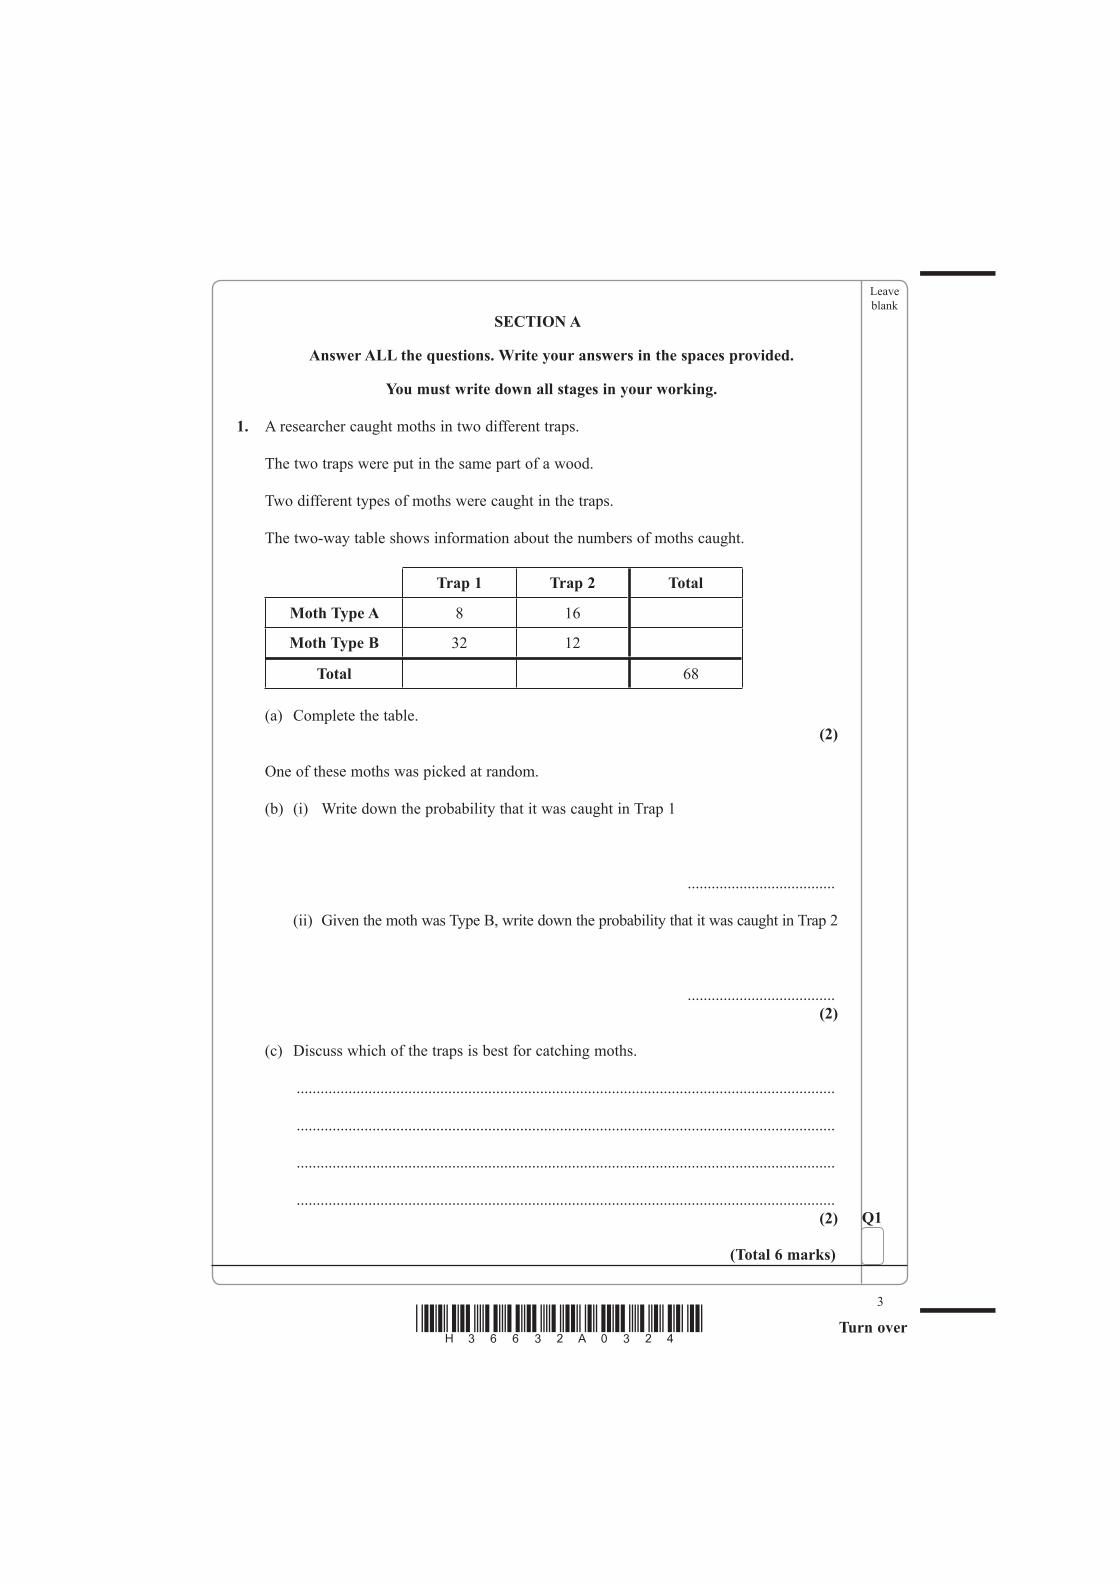
1. A researcher caught moths in two different traps.
The two traps were put in the same part of a wood.
Two different types of moths were caught in the traps.
The two-way table shows information about the numbers of moths caught.
Trap 1 Trap 2 Total
Moth Type A 8 16
Moth Type B 32 12
Total 68
(a) Complete the table.(2)
One of these moths was picked at random.
(b) (i) Write down the probability that it was caught in Trap 1
.....................................
(ii) Given the moth was Type B, write down the probability that it was caught in Trap 2
.....................................(2)
(c) Discuss which of the traps is best for catching moths.
.......................................................................................................................................
.......................................................................................................................................
.......................................................................................................................................
.......................................................................................................................................(2)
Leave blank
4
*H36632A0424*
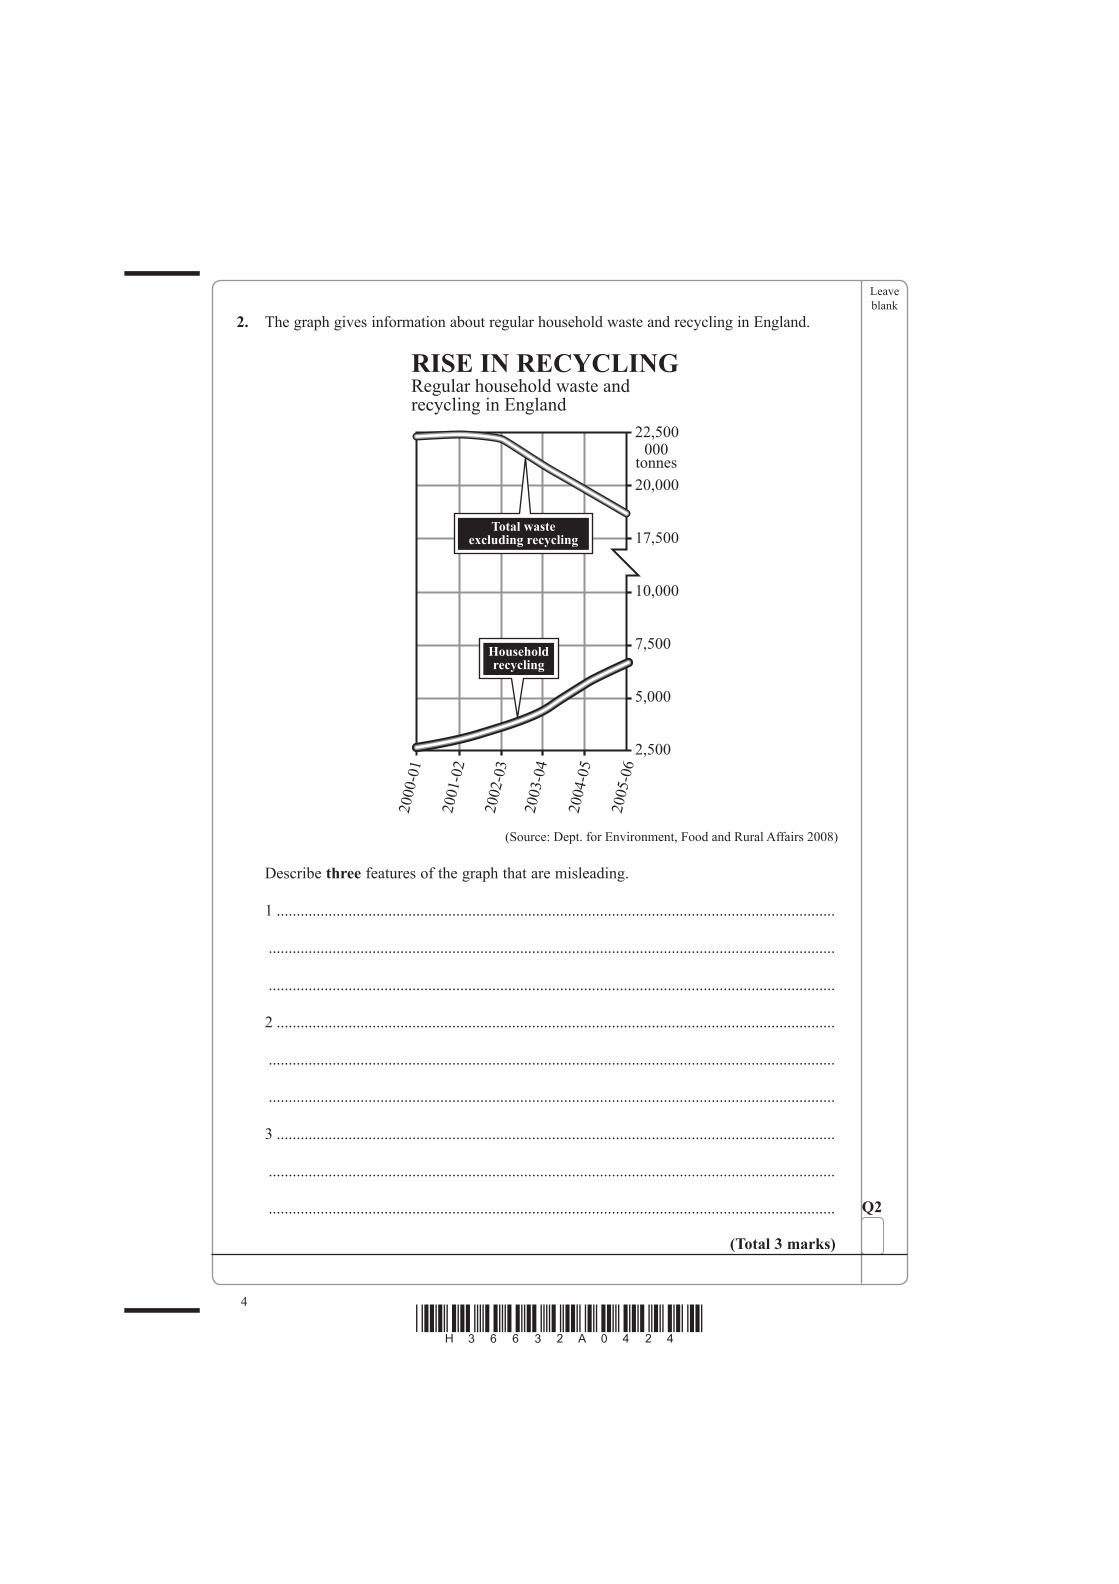
2. The graph gives information about regular household waste and recycling in England.
22,500000
tonnes
RISE IN RECYCLINGRegular household waste andrecycling in England
20,000
17,500
10,000
7,500
5,000
2,500
2000-0
1
2001-0
2
2002-0
3
2003-0
4
2004-0
5
2005-0
6
Householdrecycling
Total wasteexcluding recycling
(Source: Dept. for Environment, Food and Rural Affairs 2008)
Describe three features of the graph that are misleading.
1 ............................................................................................................................................
..............................................................................................................................................
..............................................................................................................................................
2 ............................................................................................................................................
..............................................................................................................................................
..............................................................................................................................................
3 ............................................................................................................................................
..............................................................................................................................................
.............................................................................................................................................. Q2
(Total 3 marks)

5
Turn over*H36632A0524*
BLANK PAGE
Leave blank
6
*H36632A0624*
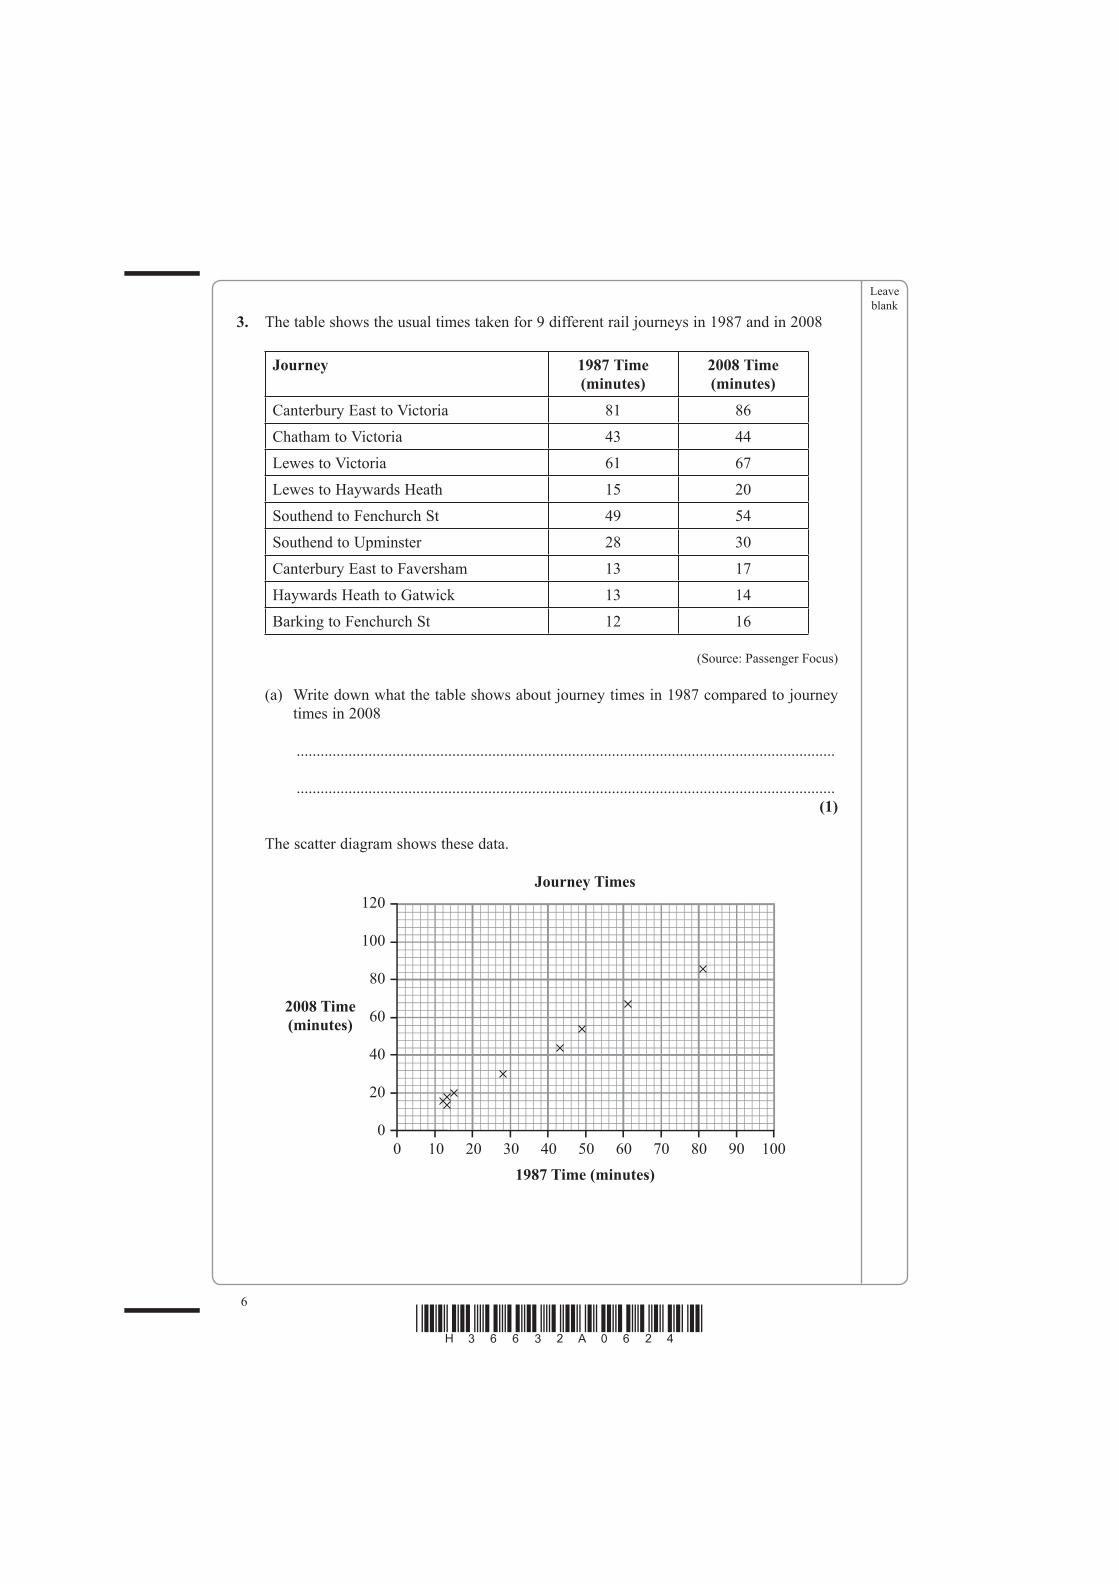
3. The table shows the usual times taken for 9 different rail journeys in 1987 and in 2008
Journey 1987 Time (minutes)
2008 Time (minutes)
Canterbury East to Victoria 81 86
Chatham to Victoria 43 44
Lewes to Victoria 61 67
Lewes to Haywards Heath 15 20
Southend to Fenchurch St 49 54
Southend to Upminster 28 30
Canterbury East to Faversham 13 17
Haywards Heath to Gatwick 13 14
Barking to Fenchurch St 12 16
(Source: Passenger Focus)
(a) Write down what the table shows about journey times in 1987 compared to journey times in 2008
.......................................................................................................................................
.......................................................................................................................................(1)
The scatter diagram shows these data.
120
100
80
60
40
20
0
0 10
Journey Times
1987 Time (minutes)
2008 Time(minutes)
20 30 40 50 60 70 80 90 100
Leave blank
7
Turn over*H36632A0724*
(b) Draw a line of best fit on the scatter diagram.(1)
In 1987 a train took 70 minutes to complete a journey.
(c) Estimate the time a train took to complete the same journey in 2008
..................................... minutes(1)
In 2008 a train took 40 minutes for a journey.
(d) Estimate the time a train took to complete the same journey in 1987
..................................... minutes(1)
In 1987 a train took 100 minutes for a journey from Doncaster to London.
The line of best fit could be used to find an estimate of the time for the journey in 2008
(e) Would this be a reliable estimate?
Give a reason for your answer.
.......................................................................................................................................
.......................................................................................................................................
.......................................................................................................................................
.......................................................................................................................................(1) Q3
(Total 5 marks)
Leave blank
8
*H36632A0824*
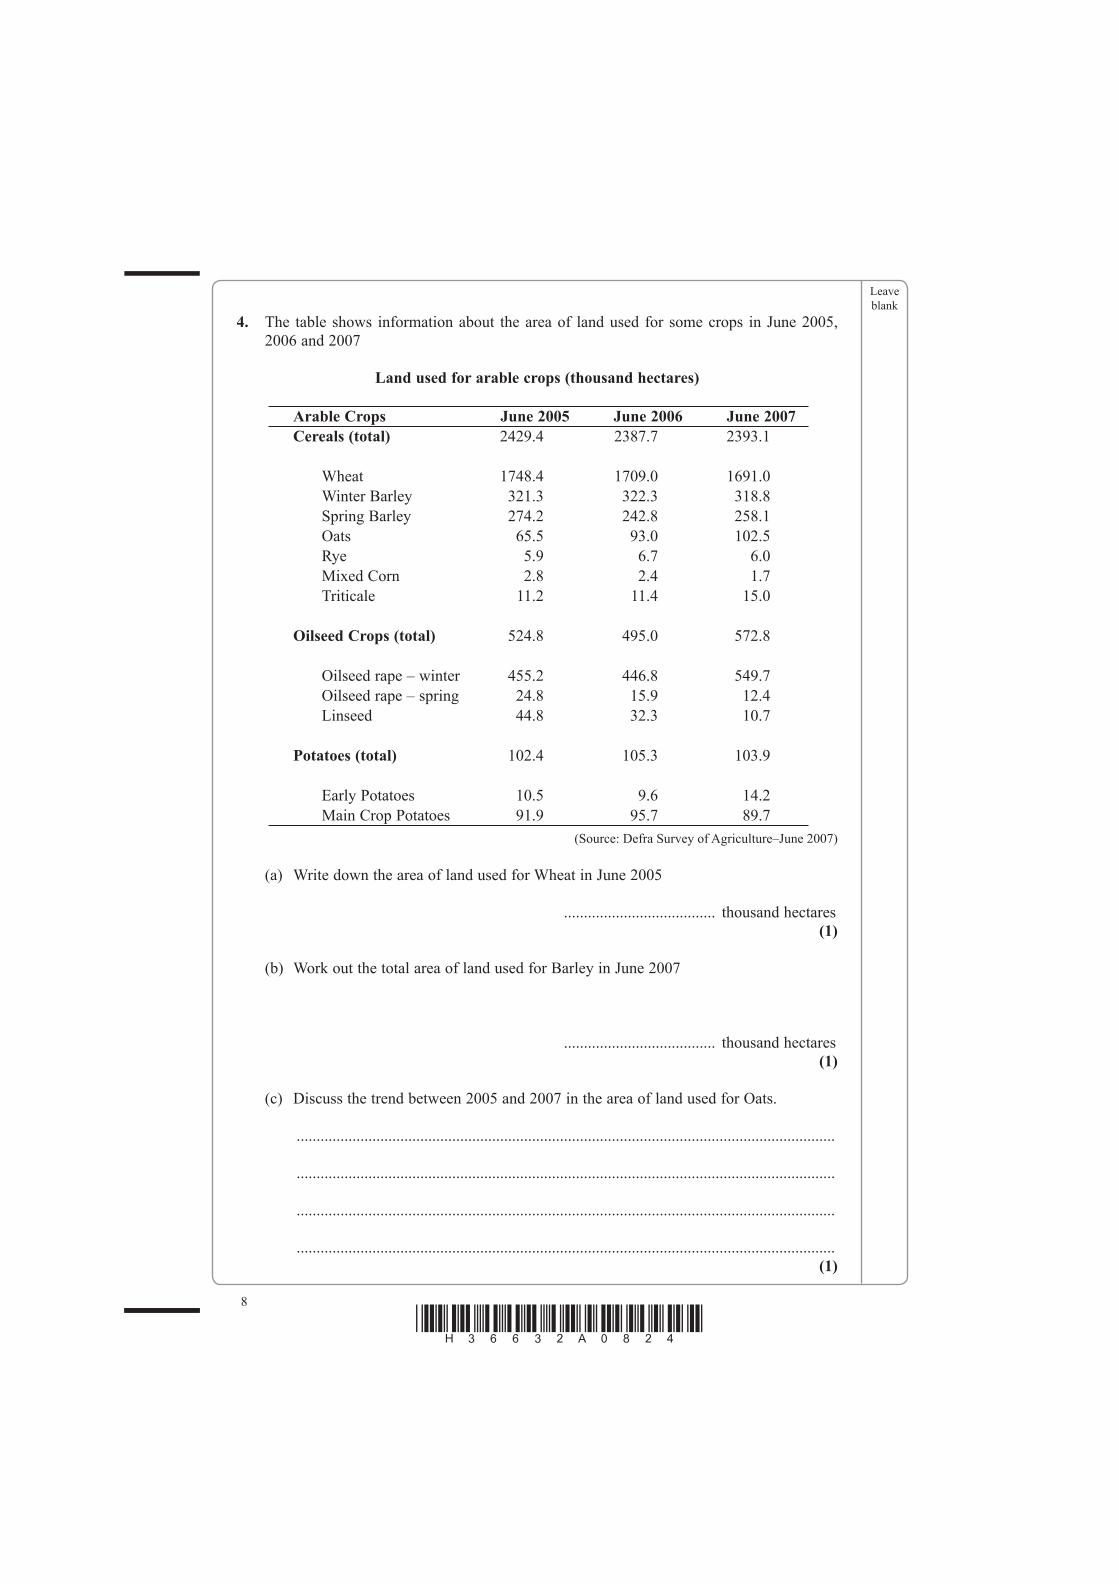
4. The table shows information about the area of land used for some crops in June 2005, 2006 and 2007
Land used for arable crops (thousand hectares)
Arable Crops June 2005 June 2006 June 2007Cereals (total) 2429.4 2387.7 2393.1
Wheat 1748.4 1709.0 1691.0 Winter Barley 321.3 322.3 318.8 Spring Barley 274.2 242.8 258.1 Oats 65.5 93.0 102.5 Rye 5.9 6.7 6.0 Mixed Corn 2.8 2.4 1.7 Triticale 11.2 11.4 15.0
Oilseed Crops (total) 524.8 495.0 572.8
Oilseed rape – winter 455.2 446.8 549.7 Oilseed rape – spring 24.8 15.9 12.4 Linseed 44.8 32.3 10.7
Potatoes (total) 102.4 105.3 103.9
Early Potatoes 10.5 9.6 14.2 Main Crop Potatoes 91.9 95.7 89.7
(Source: Defra Survey of Agriculture–June 2007)
(a) Write down the area of land used for Wheat in June 2005
...................................... thousand hectares(1)
(b) Work out the total area of land used for Barley in June 2007
...................................... thousand hectares(1)
(c) Discuss the trend between 2005 and 2007 in the area of land used for Oats.
.......................................................................................................................................
.......................................................................................................................................
.......................................................................................................................................
.......................................................................................................................................(1)
Leave blank
9
Turn over*H36632A0924*
In June 2005 the total area for Cereals is 2429.4 thousand hectares.
The areas of land used for the 7 types of Cereal add up to 2429.3 thousand hectares.
These two areas are not equal.
(d) Write down the reason why.
.......................................................................................................................................
.......................................................................................................................................
.......................................................................................................................................
.......................................................................................................................................(1)
(e) Work out the percentage decrease in the area of land used for Linseed between 2005 and 2007
................................. %(3) Q4
(Total 7 marks)

Leave blank
10
*H36632A01024*
5. At the start of an archery competition there are 50 competitors.
Each competitor shoots 3 arrows at the target.
Points are scored depending on where each arrow hits the target.
The points are added together to give a total score.
The frequency table gives information about the total scores.
Total Score 0 1 2 3 4 5 6 7 8 9
Frequency 0 1 3 9 12 8 7 5 4 1
(a) For these 50 competitors
(i) write down the total score that is the mode,
.....................................
(ii) work out the mean total score.
.....................................(3)
Two more competitors arrive for the competition.
They both get total scores of 4
(b) Write down in words the effect this has on the mean total score. Explain your answer.
.......................................................................................................................................
.......................................................................................................................................
.......................................................................................................................................
.......................................................................................................................................(2) Q5
(Total 5 marks)
3 2 1
Leave blank
11
Turn over*H36632A01124*
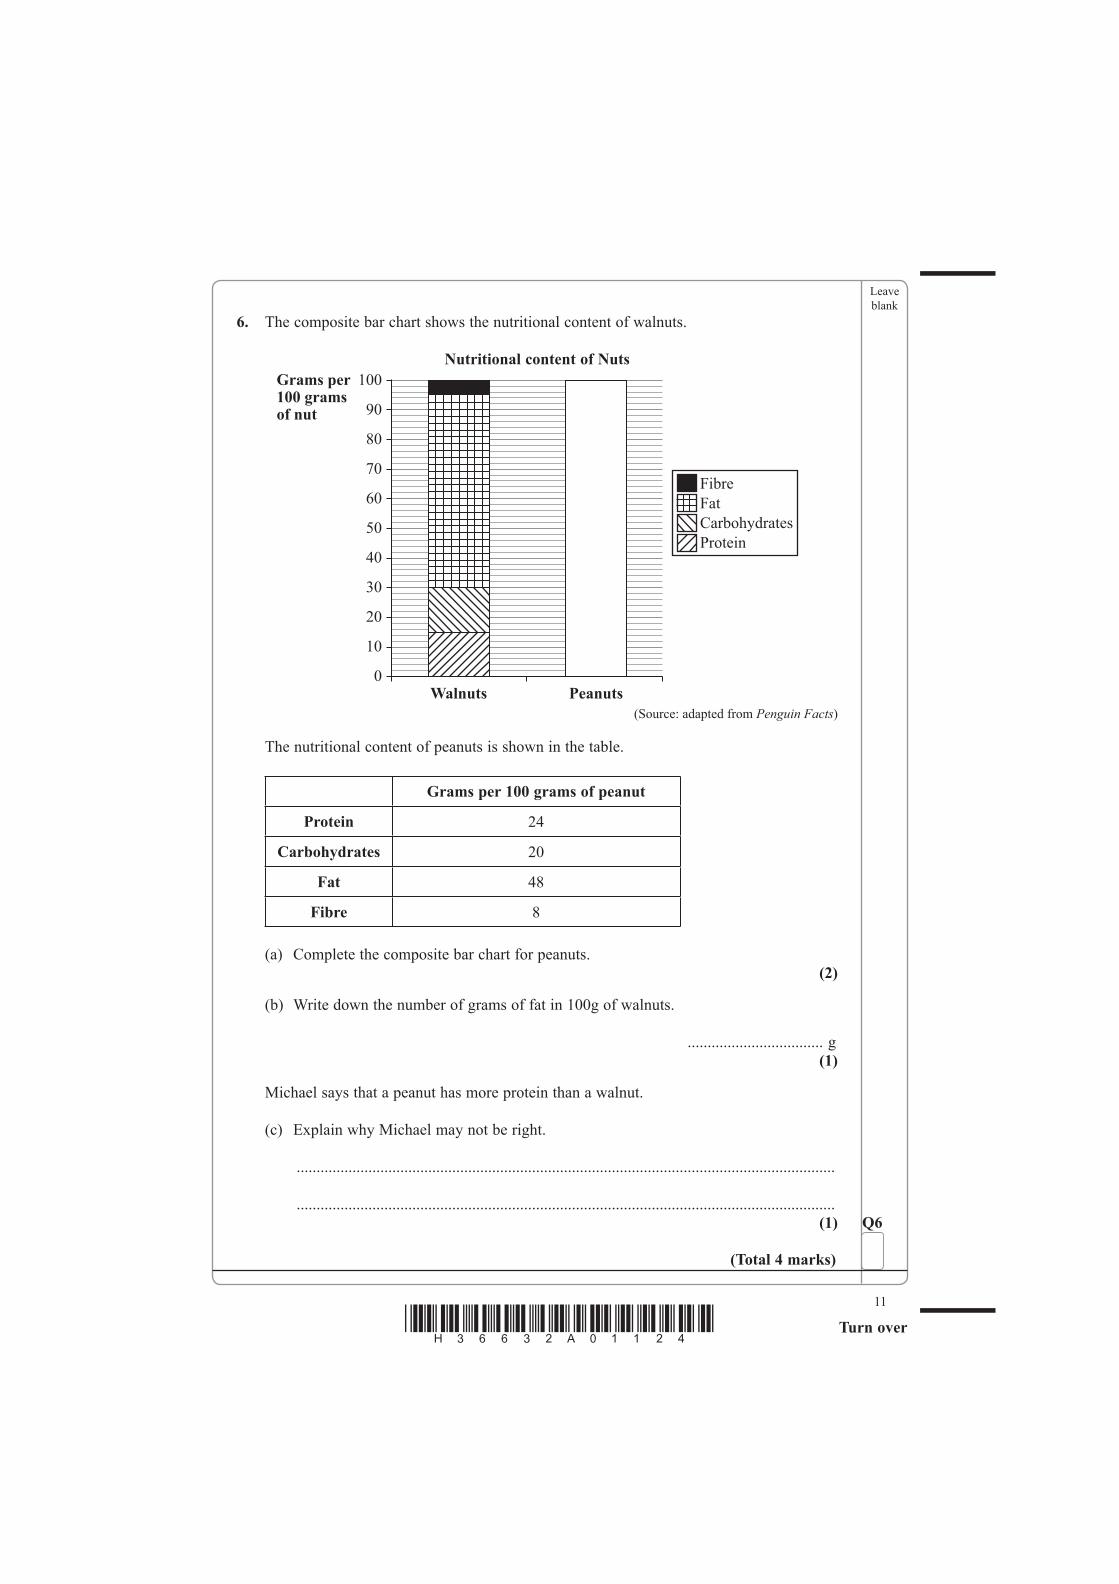
6. The composite bar chart shows the nutritional content of walnuts.
Nutritional content of Nuts100Grams per
100 gramsof nut 90
80
70
60
50
40
30
20
10
Walnuts Peanuts0
Fibre
Fat
Carbohydrates
Protein
(Source: adapted from Penguin Facts)
The nutritional content of peanuts is shown in the table.
Grams per 100 grams of peanut
Protein 24
Carbohydrates 20
Fat 48
Fibre 8
(a) Complete the composite bar chart for peanuts.(2)
(b) Write down the number of grams of fat in 100g of walnuts.
.................................. g(1)
Michael says that a peanut has more protein than a walnut.
(c) Explain why Michael may not be right.
.......................................................................................................................................
.......................................................................................................................................(1) Q6
(Total 4 marks)
Leave blank
12
*H36632A01224*
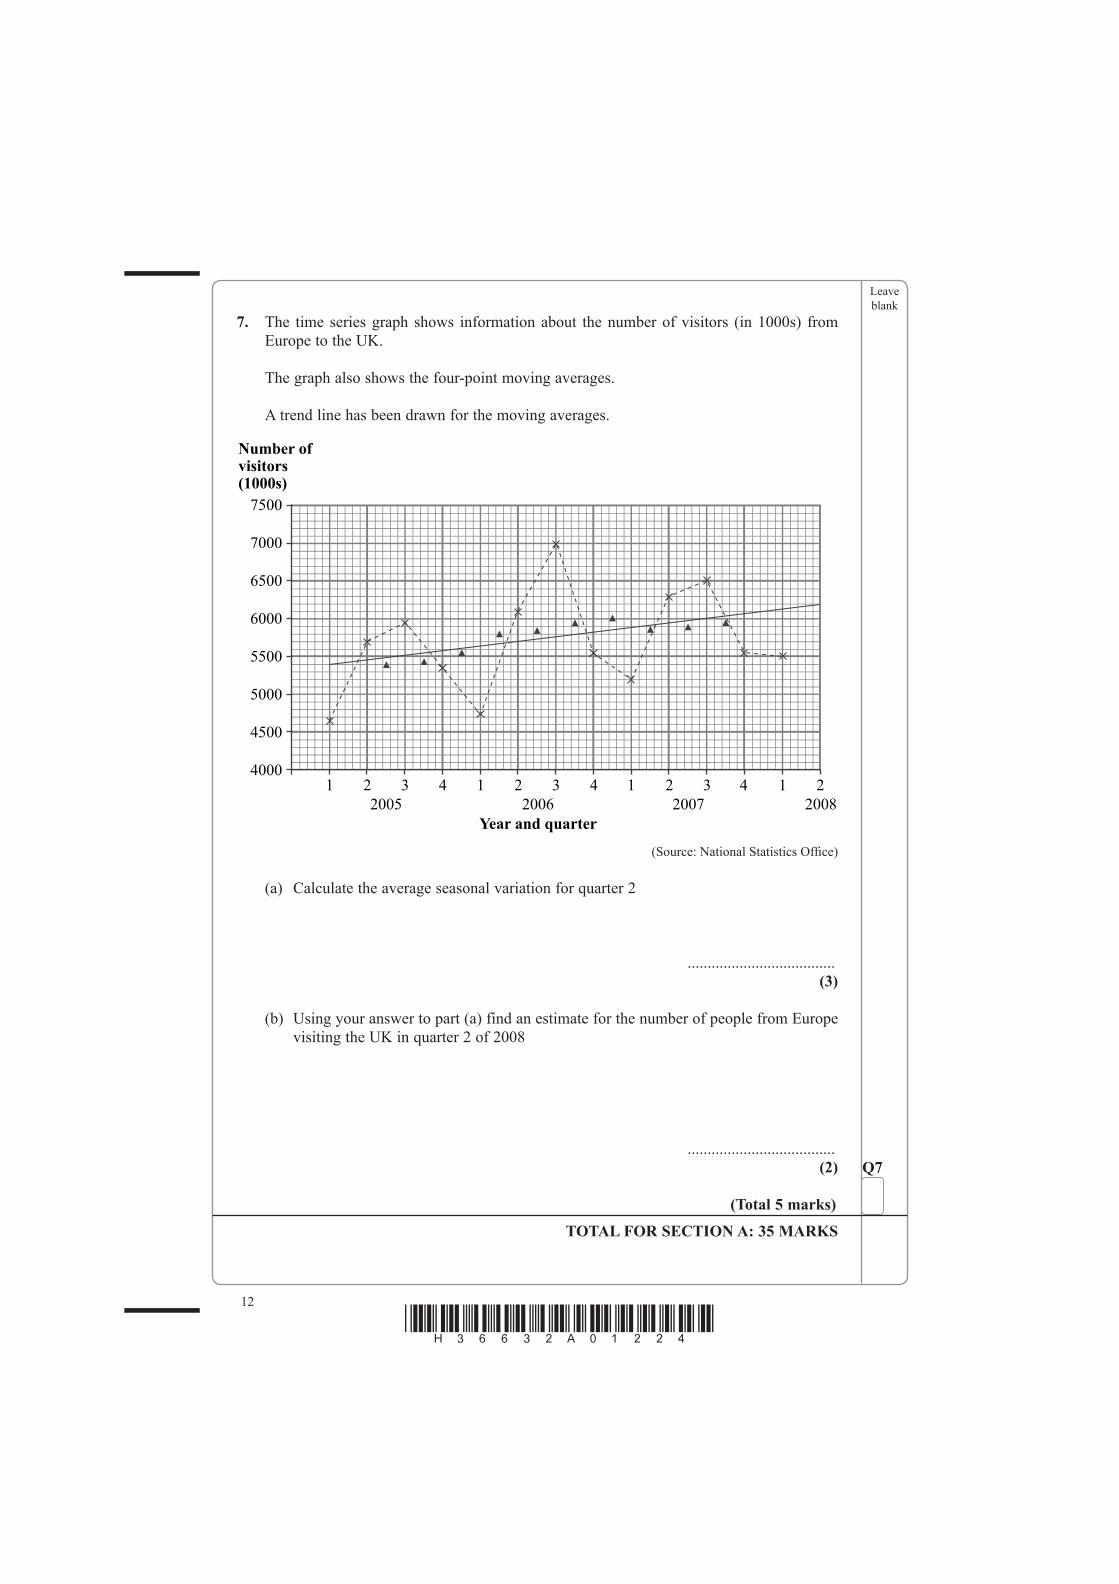
7. The time series graph shows information about the number of visitors (in 1000s) from Europe to the UK.
The graph also shows the four-point moving averages.
A trend line has been drawn for the moving averages.
7500
Number ofvisitors(1000s)
7000
6500
6000
5500
5000
4500
40001 2 3
2005 2006
Year and quarter2007 2008
4 1 2 3 4 1 2 3 4 1 2
(Source: National Statistics Offi ce)
(a) Calculate the average seasonal variation for quarter 2
.....................................(3)
(b) Using your answer to part (a) find an estimate for the number of people from Europe visiting the UK in quarter 2 of 2008
.....................................(2)
TOTAL FOR SECTION A: 35 MARKS
Q7
(Total 5 marks)
Leave blank
13
Turn over*H36632A01324*
SECTION B
Answer ALL the questions. Write your answers in the spaces provided.
You must write down all stages in your working.
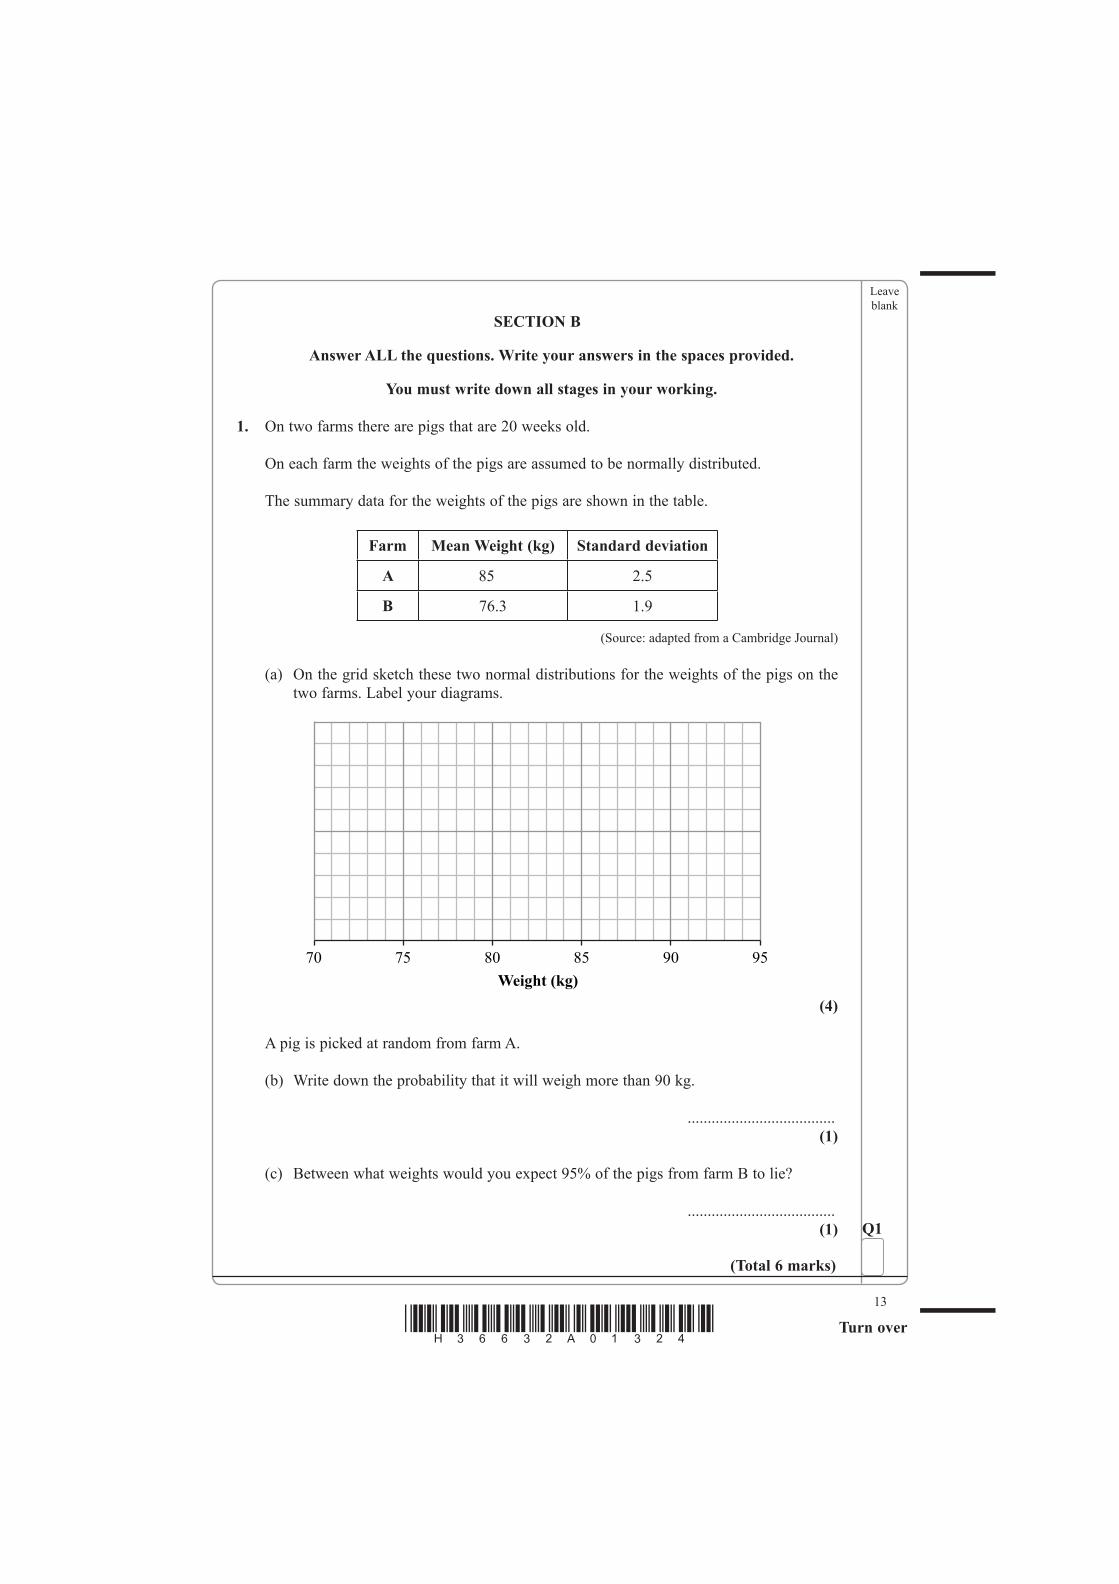
1. On two farms there are pigs that are 20 weeks old.
On each farm the weights of the pigs are assumed to be normally distributed.
The summary data for the weights of the pigs are shown in the table.
Farm Mean Weight (kg) Standard deviation
A 85 2.5
B 76.3 1.9
(Source: adapted from a Cambridge Journal)
(a) On the grid sketch these two normal distributions for the weights of the pigs on the two farms. Label your diagrams.
70 75 80
Weight (kg)85 90 95
(4)
A pig is picked at random from farm A.
(b) Write down the probability that it will weigh more than 90 kg.
.....................................(1)
(c) Between what weights would you expect 95% of the pigs from farm B to lie?
.....................................(1) Q1
(Total 6 marks)

Leave blank
14
*H36632A01424*
2. A researcher is going to investigate the age at which people in England get arthritis. He wants to find out if men get arthritis at a younger age than women.
(a) Suggest a hypothesis that the researcher could use.
.......................................................................................................................................
.......................................................................................................................................
.......................................................................................................................................(1)
It would be difficult for a researcher to use a census.
(b) Write down a reason why.
.......................................................................................................................................
.......................................................................................................................................
.......................................................................................................................................(1)
The researcher decides to use a sample.
(c) Describe the population he could use.
.......................................................................................................................................
.......................................................................................................................................(1)
(d) Write down one advantage and one disadvantage of using a sample.
Advantage .....................................................................................................................
.......................................................................................................................................
.......................................................................................................................................
Disadvantage ................................................................................................................
.......................................................................................................................................
.......................................................................................................................................(2)
Leave blank
15
Turn over*H36632A01524*
The researcher uses a questionnaire.
He does a pilot study first.
(e) Write down two reasons for doing a pilot study.
1 .....................................................................................................................................
.......................................................................................................................................
2 .....................................................................................................................................
.......................................................................................................................................(2)
One of the questions on the questionnaire for the pilot study was
‘How old were you when you started to have arthritis?’
This question did not work well.
(f) Suggest a reason why.
.......................................................................................................................................
.......................................................................................................................................
.......................................................................................................................................
.......................................................................................................................................(1)
(g) Design a better question for the researcher to use.
.......................................................................................................................................
.......................................................................................................................................
.......................................................................................................................................
.......................................................................................................................................(2) Q2
(Total 10 marks)
Leave blank
16
*H36632A01624*
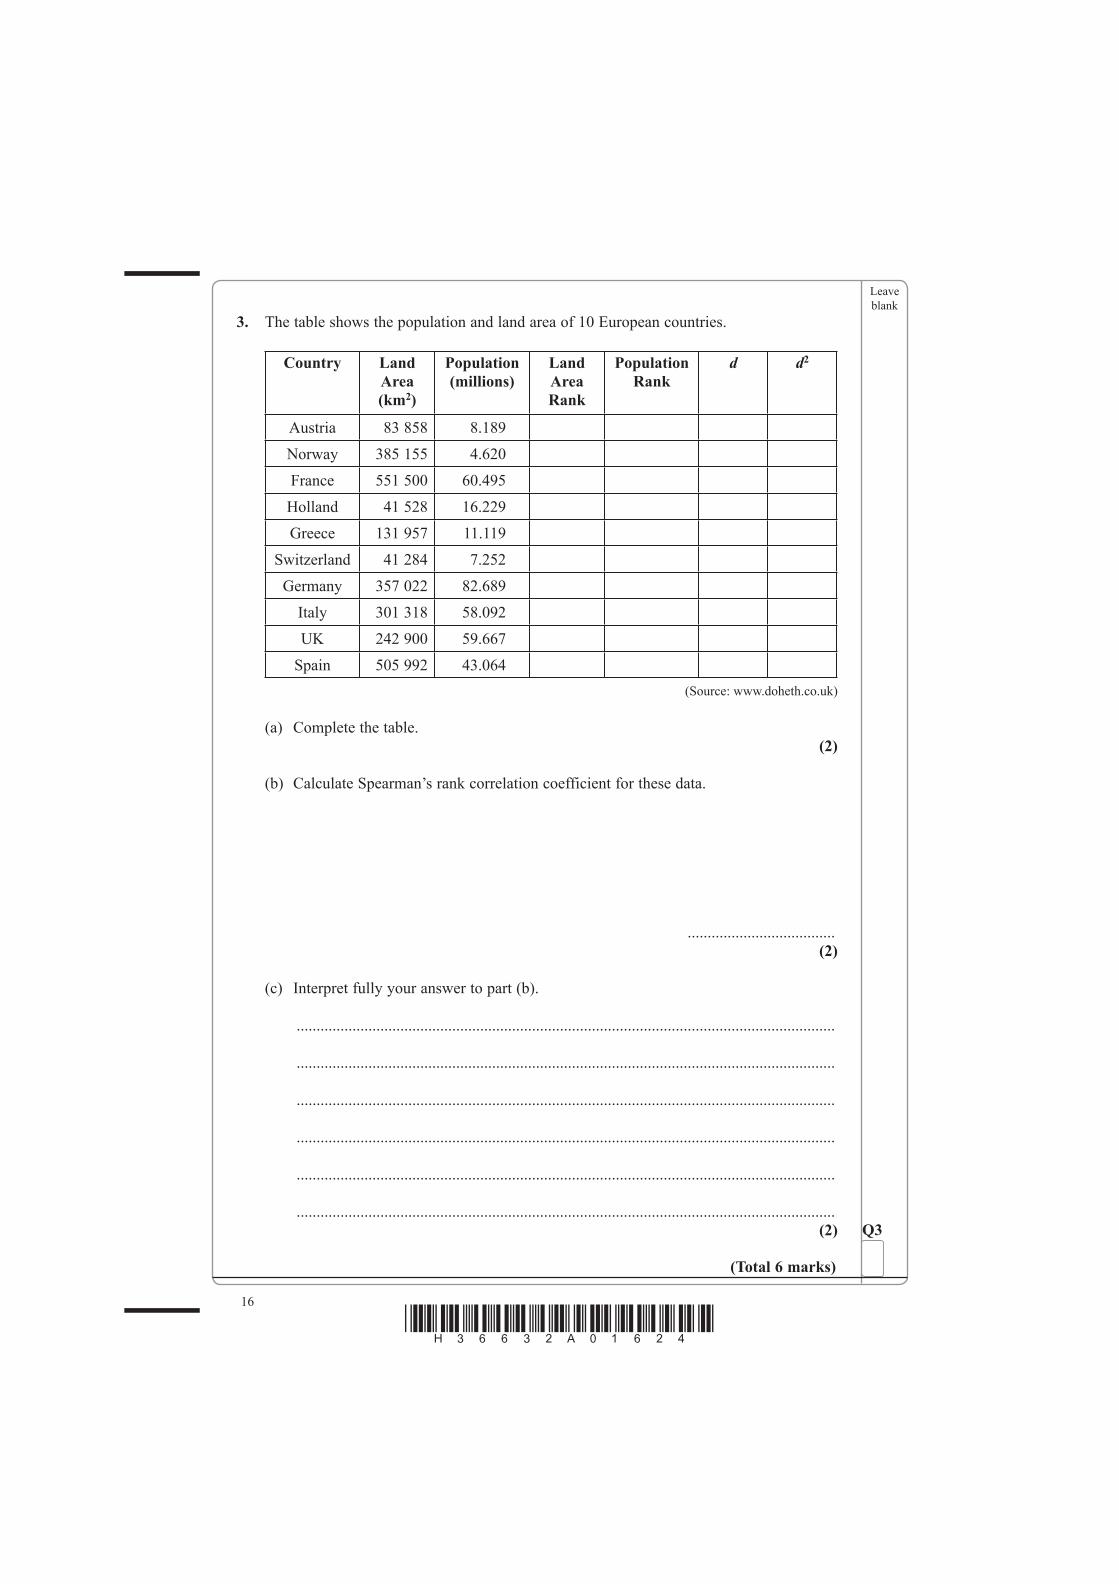
3. The table shows the population and land area of 10 European countries.
Country Land Area (km2)
Population (millions)
Land Area Rank
Population Rank
d d2
Austria 83 858 8.189
Norway 385 155 4.620
France 551 500 60.495
Holland 41 528 16.229
Greece 131 957 11.119
Switzerland 41 284 7.252
Germany 357 022 82.689
Italy 301 318 58.092
UK 242 900 59.667
Spain 505 992 43.064(Source: www.doheth.co.uk)
(a) Complete the table.(2)
(b) Calculate Spearman’s rank correlation coefficient for these data.
.....................................(2)
(c) Interpret fully your answer to part (b).
.......................................................................................................................................
.......................................................................................................................................
.......................................................................................................................................
.......................................................................................................................................
.......................................................................................................................................
.......................................................................................................................................(2) Q3
(Total 6 marks)
Leave blank
17
Turn over*H36632A01724*
4. A biologist is going to estimate the number of woodlice on a small patch of waste ground.
She uses the capture/recapture method.
She catches 200 woodlice and marks each one with a small spot of paint.
These woodlice are then set free on the patch of waste ground.
A few weeks later she catches 200 woodlice. 8 of them are marked with paint.
(a) Work out an estimate for the number of woodlice on the patch of waste ground.
.....................................(3)
(b) Write down two assumptions that the biologist made when working out this estimate.
Assumption 1 ................................................................................................................
.......................................................................................................................................
.......................................................................................................................................
.......................................................................................................................................
Assumption 2 ................................................................................................................
.......................................................................................................................................
.......................................................................................................................................
.......................................................................................................................................(2) Q4
(Total 5 marks)
Leave blank
18
*H36632A01824*
5. Two samples of top shells were collected on a sea shore.
Sample 1 was collected in 2005
Sample 2 was collected from the same sea shore in 2008
The width of the base of each shell was measured.
The measurements in mm for sample 1 were
12 17 18 19 19 20 20 21 22 22 23 23 24 26 26
(a) Write down
(i) the median shell base width,
.....................................
(ii) the lower quartile,
.....................................
(iii) the upper quartile.
.....................................(3)
(b) Identify any outliers for 2005You must show your working.
.......................................................(3)
Leave blank
19
Turn over*H36632A01924*
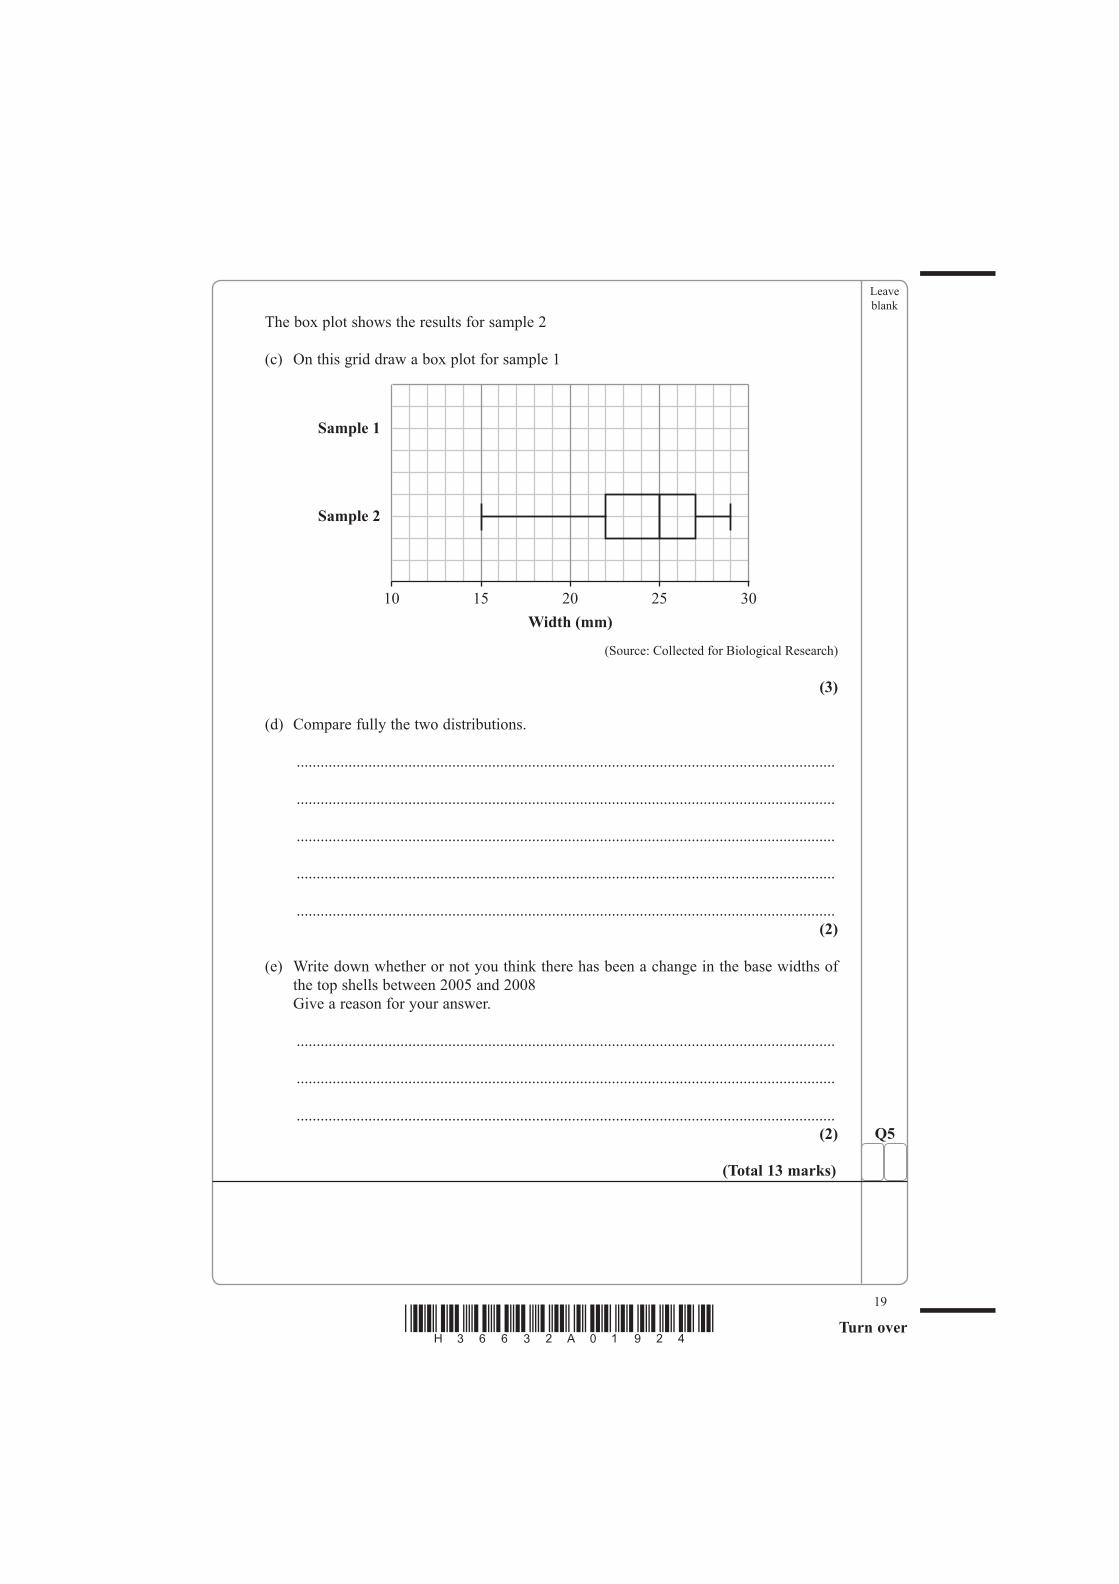
The box plot shows the results for sample 2
(c) On this grid draw a box plot for sample 1
Sample 1
Sample 2
10 15 20
Width (mm)25 30
(Source: Collected for Biological Research)
(3)
(d) Compare fully the two distributions.
.......................................................................................................................................
.......................................................................................................................................
.......................................................................................................................................
.......................................................................................................................................
.......................................................................................................................................(2)
(e) Write down whether or not you think there has been a change in the base widths of the top shells between 2005 and 2008
Give a reason for your answer.
.......................................................................................................................................
.......................................................................................................................................
.......................................................................................................................................(2) Q5
(Total 13 marks)

Leave blank
20
*H36632A02024*
6. The table shows the monthly house price indices for 2007/2008
The base month is July 1983
July2007
Aug2007
Sept2007
Oct2007
Nov2007
Dec2007
644.3 646.0 647.8 677.6 639.5 638.1
Jan2008
Feb2008
Mar2008
Apr2008
May2008
June2008
July2008
638.4 635.9 620.1 610.7 595.5 583.9 574.0
(Source: Halifax)
(a) Write down the percentage rise in house prices between July 1983 and July 2007
................................. %(1)
(b) Describe what happened to house prices between July 2007 and July 2008
.......................................................................................................................................
.......................................................................................................................................
.......................................................................................................................................(1)
In March 2008 the value of a house was £191 500
(c) Work out the value of this house in April 2008 based on the indices in the table.
£ ..................................(2)
(d) Work out the percentage change in prices between July 2007 and July 2008 inclusive.
................................. %(2)

Leave blank
21
Turn over*H36632A02124*
The indices in the table are given monthly.
(e) Write down the reason why it might be better to give quarterly or annual price indices if you are interested in long term changes.
.......................................................................................................................................
.......................................................................................................................................
.......................................................................................................................................
.......................................................................................................................................(1) Q6
(Total 7 marks)
Leave blank
22
*H36632A02224*
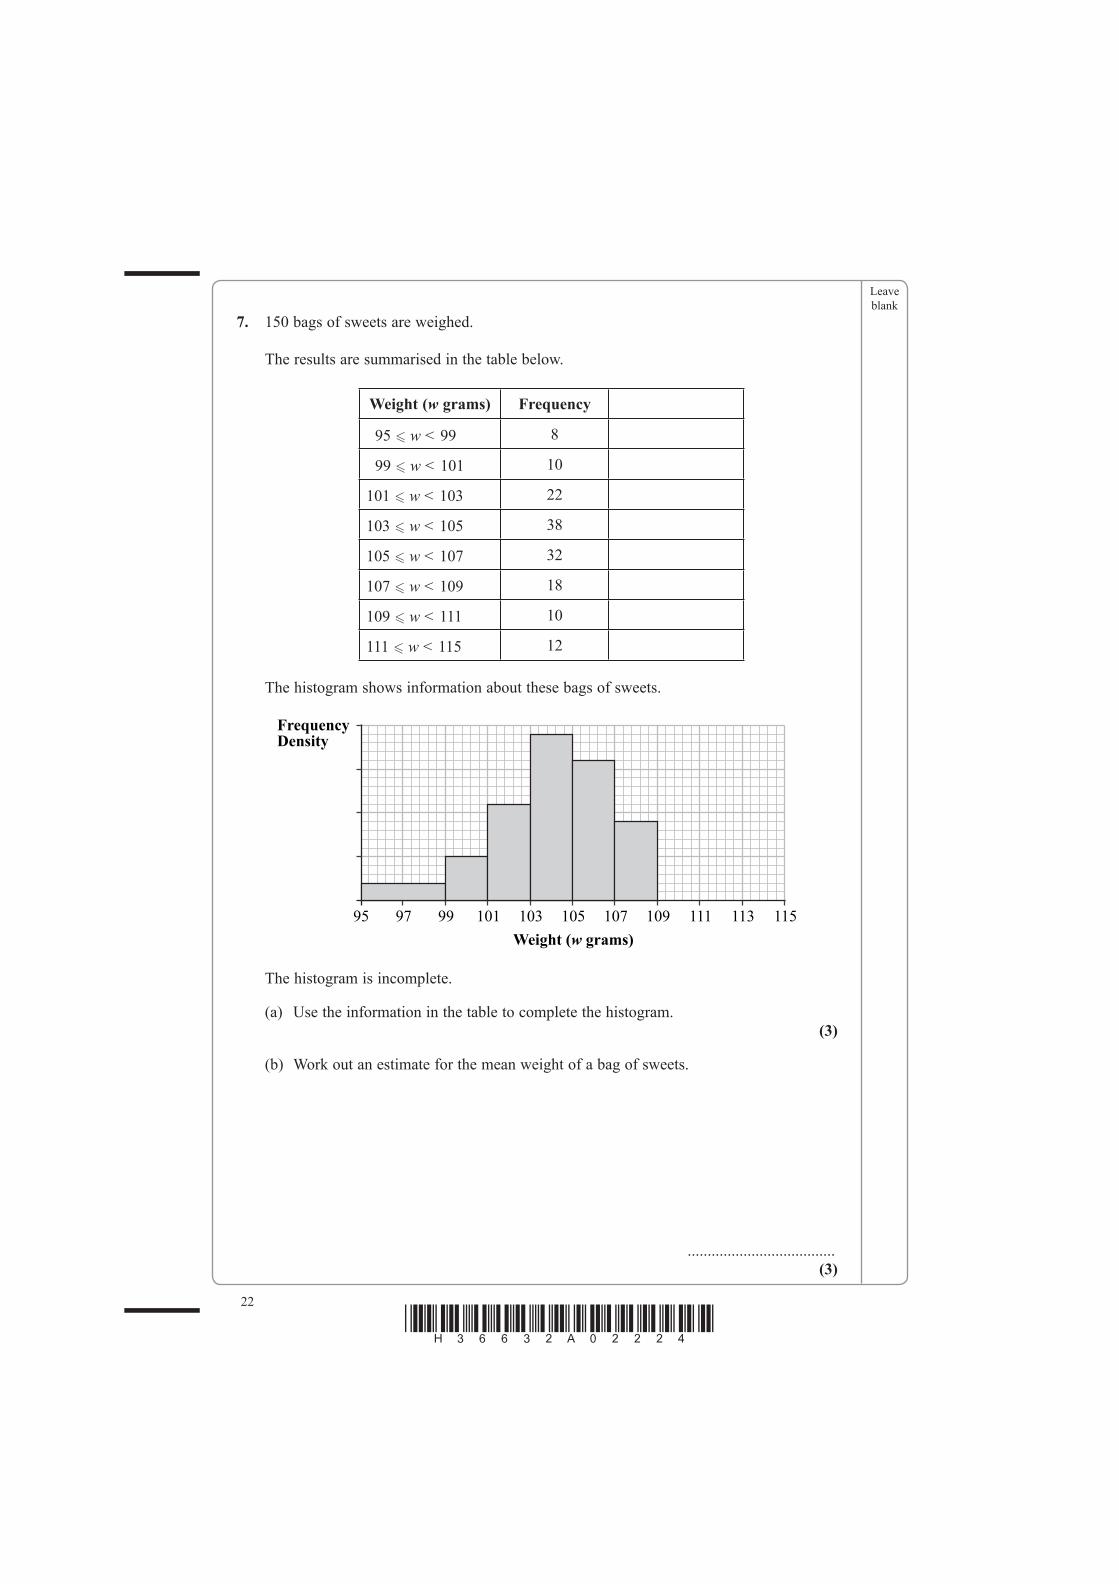
7. 150 bags of sweets are weighed.
The results are summarised in the table below.
Weight (w grams) Frequency
95 w < 99 8
99 w < 101 10
101 w < 103 22
103 w < 105 38
105 w < 107 32
107 w < 109 18
109 w < 111 10
111 w < 115 12
The histogram shows information about these bags of sweets.
95 97 99 101 103 105
Weight (w grams)
FrequencyDensity
107 109 111 113 115
The histogram is incomplete.
(a) Use the information in the table to complete the histogram.(3)
(b) Work out an estimate for the mean weight of a bag of sweets.
.....................................(3)
Leave blank
23
Turn over*H36632A02324*
(c) Calculate an estimate for the standard deviation of the weights of the 150 bags of sweets.
You may use ∑ f w 2 = 1 658 900
.....................................(3)
It is suggested that the weights of the 150 bags could be modelled by a normal distribution.
(d) Discuss whether or not a normal distribution is likely to be a good model.
.......................................................................................................................................
.......................................................................................................................................
.......................................................................................................................................
.......................................................................................................................................
.......................................................................................................................................(2) Q7
(Total 11 marks)
Leave blank
24
*H36632A02424*
8. The eggs in the nests of a certain type of seagull have a 20% chance of being infertile.
(a) Write down the probability that an egg is fertile.
.....................................(1)
A nest contains four eggs.
(b) (i) Write down the name of the distribution that can be used to model the number of infertile eggs.
...............................................
(ii) Calculate the probability that exactly one egg is infertile. (You may use (p + q)4 = p4 + 4p3q + 6p2q2 + 4pq3 + q4)
.....................................
(iii) Calculate the probability that more than two eggs are infertile.
.....................................(6)
TOTAL FOR SECTION B: 65 MARKSTOTAL FOR PAPER: 100 MARKS
END
Q8
(Total 7 marks)
Recommended