Embed Size (px)
Citation preview

Chemical Physics
ELSEVIER Chemical Physics 189 (1994) 139-148
Zero-phonon line as the foundation stone of high-resolution matrix spectroscopy, persistent spectral hole burning, single impurity
molecule spectroscopy
Karl K. Rebane Institute of Physics, Riia 142, EE2400 Tartu, Estonia
Received 9 June 1994
Abstract
The purely electronic zero-phonon line (ZPL) -the optical analog of the Mossbauer y-resonance line - is a remarkable feature of the low temperature impurity absorption and luminescence spectra of solids. The narrowness and high peak absorption cross section of ZPLs has opened new horizons for high resolution spectroscopy of impurity molecules (centers). The newest and most spectacular achievement is single impurity molecule spectroscopy. Persistent spectral hole burning (PSHB) , serving as a tool to control by means of illumination the absorption coefficient, and bound to it, via the Kramers-Kronig relations, the refraction index, turns inhomogeneous broadening of ZPLs into a useful feature and opens a variety of applications including PSHB optical data storage and processing. Space-frequency and space-time domain holographies are developed. The latter
comprises the causality relations between events subject to holography and opens new principal possibilities in optics.
1. Introduction
Purely electronic zero-phonon line (ZPL) , the opti-
cal analog of the MBssbauer y-resonance (see Refs.
[ 1,2] and references therein) is the foundation stone
of high resolution spectroscopy of impurity activated
solids, fluorescence line narrowing (FLN) (see Ref. [ 31 and references therein), persistent spectral hole burning (PSHB), and its applications (see Refs. [ 2,4,5,6] and references therein). The latter comprise optical data storage and processing, including the space- and frequency-domain and space- and time- domain PSHB holographies. The latest spectacular achievement is single impurity molecule spectroscopy (SMS), which actually is the spectroscopy of the ZPLs [7-91.
The remarkable achievements of the ZPL based spectroscopy have been reviewed in a recent feature
0301.0104/94/$07,00 0 1994 Elsevier Science B.V. All rights reserved I
ssD10301-0104(94)00298-3
article by Orrit et al. [ lo]. The objective of this paper is to give a review of the basic properties of the ZPLs in the context of their role in SMS. The other fields of ZPL applications will be mentioned briefly, basic ref- erences and a few examples are given.
2. Purely electronic zero-phonon line (ZPL)
Purely electronic zero-phonon line (ZPL) is a remarkable feature of the impurity centres in low tem- perature solids. ZPLs are narrow (linewidth r(T) - lo- ’ cm- ‘) and of high peak intensity (peak absorption cross-section (PACS) a(T) - lo- ” cm’). These figures hold for purely electronic transitions in impurity centres with weak electron-phonon interac- tion in single crystals and for temperatures around 2 K. For disordered solids (glassy and polymeric host matri-

K. K. Rebane / Chemical Physics 189 (1994) 139-148
T=O
(O-to’) = Purely electronic ZPL
r(z)>r(l)=+ =km-'
I-(l) "lbr r(o)=0
Fig. 1. Configuration coordinate model for impurity molecule at
T= 0. Doppler broadening and rotational structure are eliminated
because of the macroscopic mass of the host solid. Broadening
caused by lattice vibrations drops to zero at T+ 0. In absence of non-
radiative decay of the excited electronic state the ZPL’s width at
T= 0 is equal to the radiative one r,,.
ces) r (2 K) is broader by a factor of 10 or more. Rather well pronounced ZPLs may be present also in
the case of medium interaction, but the peak intensity is considerably lower and the lines are broader. Fig. 1
shows a simple diagram of potential curves explaining the essentials of the appearance of ZPL. Doppler broad- ening and rotational structure (broadening) of spectral lines of a molecule attached to a solid matrix host are eliminated because of the large mass of the latter. For the lowest vibrational levels, which are not broadened by the vibrational energy relaxation, this circumstance is very important, resulting in a very narrow linewidth of the O-O transition, which approaches the radiative oneat T-+0.
Broadening of ZPLs at liquid helium temperatures is controlled by the coupling to low frequency lattice modes or to the other elementary excitations (two-level systems - TLS, librations, pseudolocal vibrations) thermally excited at these temperatures. The peak intensity is the lower, the stronger the coupling is to local vibrations and to all the lattice modes, i.e. optical
and acoustical modes. With increasing temperature ZPLs lose their total (integrated) intensity and broaden, in most cases rather rapidly, e.g. in most organic systems at temperatures above about 20 K high spectral resolution spectroscopy of ZPLs becomes hardly possible (Fig. 2).
Narrow and intense ZPLs are present in low temper- ature spectra of hundreds of impurities in hundreds of
solid matrices, organic and inorganic. The large body of impurity activated solids with good ZPLs opens a prospective field of studies and applications in physics, chemistry, and biology.
The homogeneous linewidth (i.e. that for a single
impurity) r(T) is given by the formula
[cm-‘], (2.1)
where 71 is the excited electronic state lifetime, T* is the full dephasing time and 7; is the pure dephasing time. At the temperature T=O dephasing is absent (7: + m), r(O) is determined solely by TV, and (in the absence of the quenching of luminescence) is equal to the radiative linewidth of the electronic transition. For a temperature around 2 K, and for typical excited electronic state lifetimes of IO-’ s, we can estimate for a well pronounced ZPL r( 2 K) - 2r( 0) N 10p”-10-4 cm-‘.
The PACS of a ZPL, a(T) is a factor of a(T) smaller
than the universal value for the radiative peak absorp- tion cross section, a,, of a free atom (see Ref. [ 111 and references therein),
dT>=a(T)ar, A2
gr= G’ (2.2)
Here CT, is given for non-polarized excitation light [ 121. To take account of polarization, a factor /3( 0) has to be introduced. In the case of linear polarization and dipole transition p( 13) = 3 cos’0, where 0 is the
angle between the electric vector of the excitation light
T=O T,>O T,>T, T,>T, w
Fig. 2. Schematic of the purely electronic zero-phonon line (ZPL)
and phonon sideband in the impurity homogeneous absorption spec-
trum and its dependence on temperature [ 18 1; T3 = 40 K for organic
impurities in organic hosts.

K.K. Rebane/ Chemical Physics 189 (1994) 139-148 141
at the impurity site and the direction of the transition dipole moment of the molecule in solid environment. Note that the force caused by the first vector depends also on the local situation at the impurity site and thus, in principle, additionally on the angle f?. A is the exci- tation wavelength in vacuum at the maximum of absorption. A simple but reasonable consideration gives for ZPL absorbing non-polarized light [ 11,13 ] :
NT) =4xv(~)~(T)(%~~)*, (2.3)
where no and n are the refractive indices in vacuum and in solid, the last factor showing that h in (2.2) has to be substituted by the wavelength in the solids A, = Ano/ n. For polarized excitation
Here y(T) = T&J&,( T) , where r,, is the radiative and r,,,(T) = r,, + r,( 7) + r,,,,( r> the homoge- neous linewidth, r,(T) and r,,,,(T) N ( 7:) - ’ being the contributions from non-radiative and dephasing
processes. F,,,( T) is the Debye-Wallerfactor, defined as the ratio of the integrated intensity of the ZPL, S,,
and the sum of Se and the integrated intensity of the phonon sideband, S,, accompanying the ZPL [ 1,2],
(2.5)
Fbw shows how much of the oscillatory strength of the electron transition is located in ZPL and is the smaller
the stronger the electron-phonon interaction and the higher the temperature. F,,,(T) has strongly different values for different impurity systems, the common fea- ture being that it decreases rather rapidly with increas- ing temperature, and for most molecular systems drops
to very small values at temperatures above 20 K (Fig.
I). As a rough estimate for systems at T= 2 K with fine
ZPL and high yield of fluorescence the values F DW = 0.1 and y(T) = 0.5 may be taken. Then, for a( T= 2 K) - 0.05, /3( 0) = 1, and we have
a(T> =a(T)h2/2n,
o(2K)=0.5X10⁵d2=2X10~1’cm2, (2.6)
where d* is the geometrical size of the molecule, and for an estimate h = 2500d.
Let us point out that (2.3) and (2.4) are valid gen- erally if we understand F,,(T) and y(T) as experi- mental values [ 111.
One of the finest uses of this precious feature of low temperature ZPL is the recent development of the spec- troscopy of a single impurity molecule. It shows that the peak cross section is large enough and selective
enough to excitate a single molecule in a dense matter
environment, i.e. in a situation when about 10” mole- cules are under illumination (see Section 6).
In high resolution experiments we deal with ZPLs when the local vibrations of the impurity centre (mol- ecule) and optical branches of the host vibrations are not thermally excited. In this case it is practical to represent the Debye-Waller factor as the product F,,,(T) = FFc( 0) F&.,(T) , where the first factor is the product of Franck-Condon factors for O-O transitions of all the local vibrations (and optical branches), and
the second one is the Debye-Waller factor for acoustic lattice modes (i.e. actually the thermal average of Franck-Condon factors for zero-phonon transitions in
them). Note that the conclusion r(T) -+ r,, when T+ 0, holds if the density of the elementary excitations tends to zero with their energy approaching zero rapidly enough. That is the case with lattice vibrations, but is not obligatory for all possible excitations of a solid matrix. Linewidths of all the transitions in which at least one excited local or optical lattice vibrational level is involved, i.e. the phonon assisted lines, are broader
by about three orders of magnitude.
3. Inhomogeneous broadening of zero-phonon lines
Because of its narrowness, ZPL is extremely sensi- tive to the slightest fluctuations of electrical, deforma- tion, etc. fields at the sites of the impurity. Even a weak perturbation can shift the ZPL’s frequency out of its initial position and rather far away compared to its linewidth. An estimate for dipole point defects at con- centrations 10-“-10-4 mol/mol gives for the inhomo-
geneous bandwidth, pi = 1 cm- ‘, which exceeds the homogeneous linewidth r,,, (2 K) by a factor of 10’.
Thus, for a body of molecules, ZPL as a noble spec- tral feature is strongly distorted by large inhomoge- neous broadening: in the absorption and conventionally

142 K.K. Rebane/ Chemical Physics I89 (1994) 139-148
Frequency -
Fig. 3. Illustrating the inhomogeneous distribution function (1); the
homogeneous ZPL with its accompanying phonon sideband (2), and
the inhomogeneous absorption band (3) as the sum of two parts: a
really continuous spectral band (4) formed by the overlapping pho-
non sideband of spectrum (2) and a pseudocontinuous broad band
(between curves (3) and (4) ) of very narrow homogeneous ZPLs
distributed as shown by curve ( 1). The calculation is performed for
the Debye-Waller factor of spectrum (2) being Fow=O.5 [ 181.
measured luminescence spectra of an impurity doped medium ZPLs form a broad band.
The experimental inhomogeneous bandwidth, &, is about 1 cm- ’ for single crystal hosts, l-10 cm-’ for polycrystalline structures (e.g. Shpolsky systems), and lo*-lo3 cm-’ for disordered solids: glasses and poly- mers. Actually an inhomogeneity of the sample creates a distribution of the impurities over the frequencies g(r,
w j , which may depend on the site in the sample. The profile of the inhomogeneous distribution functiong(r, w) is often rather complicated, and depends on the way
the sample was prepared. In the presence of diffusion
and other relaxation processes in the sample, g(r, o)
may depend on time, but it does not depend directly on temperature.
We can see that 4 = ( 103-106)r(2 K), i.e. the
inhomogeneous ZPL band comprises thousands of dis- tinguishable very sharp resonances (Fig. 3). This fea- ture is a precious gift of nature, it enables us to perform
fine optics, spectroscopy and photochemistry. New
possibilities for applications open up, including various versions of data storage and processing. But an effec-
tive tool to address, control, modify and fix modifica- tions of these resonances is necessary.
4. Persistent spectral hole burning
Persistent spectral hole burning (PSHB) is a tool that enables one to control by illumination with high
spectral resolution the absorption coefficient and con- nected with it (via the Kramers-Kronig relations) the index of refraction of the impurity doped materials. The possibility of burning holes in a low temperature inho- mogeneous ZPL band is indicated in Ref. [ 11, p. 150. The additional essential feature is that in the case of ZPLs the holes can be persistent [ 2,4,14,15].
Illumination with a narrow laser line brings along
spectrally selective interaction with that subset of impu- rity molecules whose ZPLs are in resonance with the laser frequency. These impurities are, because of their very high absorption cross-section, (T(T), under “heavy bombardment” by photons, and they can undergo photostimulated changes, i.e. photochemical reaction in the molecule itself or any other process in the impurity center or in its surrounding matrix. These
changes shift the ZPL frequency to a new value, typi- cally rather far (thousands and millions of ZPL homo- geneous widths) away from the initial one. The number
of molecules able to absorb resonantly at the excitation laser frequency, decreases. This leads to the appearance of a hole (dip) in the inhomogeneous band of the impu- rity absorption. The holewidth in the inhomogeneous absorption band (more precisely in the inhomogeneous distribution function g(r, w)) is given by the convo- lution of the shapes of the laser line and ZPL’s homo-
geneous line; the hole area is determined by the dose of illumination. The holewidth detected in a spectrum is broader, since the read-out procedure brings along another convolution with the ZPL’s homogeneous line
shape function. Holes in g(r, w) may be studied by using various techniques, the most popular one being the measuring of the luminescence excitation spectrum which is closely correlated to the absorption. If the hole burning and the read-out laserwidth are negligibly small compared to the ZPL’s homogeneous width r( 7’)) the holewidth in the absorption (or luminescence excitation) spectrum is twice r(r).
Note that the spectral and the spatial resolution of a
PSHB material is, in principle, several orders of mag-

K. K. Rebane / Chemical Physics 189 (1994) 139-148 143
nitude higher than that of a photographic one (ten thou- sand different frequencies as “colors’ ’ ; one wavelength as the limit for spatial resolution in con- ventional optical addressing). The PSHB capability to feel and fix the action has a spatial resolution down to the distance between impurities, at which there is still no energy transfer between them. Thus utilizing the frequency as an additional coordinate in optical addressing brings the spatial resolution to the nano- meter scale. (For some other fine features of the hole
burning art, see e.g. Refs. [ 16-181.) The lifetimes rn of the holes depend on the rate of the reverse chemical reactions or on the time of reverse rearrangements of the constituents in the impurity center and its environ- mental host. rn is different for different systems and
shows a large variety of temperature dependencies. We
could accept to call persistent the holes, whose rn exceeds 100 s, considering the faster decaying ones to be transient. Actually for most of today’s popular PSHB systems ru exceeds this roughly put boundary value by several orders of magnitude and may reach quite a number of years, especially if the sample is stored at low temperatures. In parallel with the deteri- oration of the holes because of filling them (area of the holes decays) the broadening of the hole’s shape (area being approximately constant) is also present. PSHB materials mostly used today show no essential changes
of the hole structure during the experiments, i.e. during several hours until the liquid helium evaporates. In all PSHB applications the light-matter interaction may be, and actually mostly is, rather weak. The conventional linear description of this interaction holds well. No intense excitation light to create non-linear light-matter interaction is needed. The space-and-frequency- domain hole pattern is written in PSHB material in step- by-step accumulation of small changes of the coefficient of absorption and the index of refraction under modest illumination. Coherent time-domain
optical responses like photochemically accumulated stimulated photon echo (PASPE) [ 2,18,19,20], and other PSHB effects arise from the circumstance that after hole burning the piece of matter has its optical characteristics changed, a new frequency or space-and- frequency pattern of permittivity is formed. This pat- tern stores for long times (determined by the lifetime of the spectral holes) the information transmitted by the illumination. This difference between the optical properties of the material before and after PSHB is
caused by gradually collecting small changes of the number of impurity molecules, absorbing via their ZPLs, at a given frequency w, at a given spatial spot. In other words. the light-matter interaction is well described by the conventional linear Maxwell equa- tions, but the equation describing the properties of mat- ter is essentially different before and after hole burning. It should also be mentioned that in PSHB, because of the possibility to keep excitation intensities low, the power broadening of ZPLs and, consequently, power broadening of spectral holes caused by saturation effects can be avoided.
The hole broadening arising quite easily with the growing dose of illumination and also from spectral diffusion is always possible. Additional effects arise in optically dense samples. They include hole narrowing
[ 16,171 and dependence of the hole profiles on the geometry of burning (one- or two-way burning) and on temporal ordering of the irradiation at bichromatic
burning [ 171. Let us note a remarkable possibility: PSHB enables
one to create and study exotic photochemical reactions. It allows one to give a small fraction of impurity mol-
ecules areally high excitation load, initiate the reaction, and study its results with high spectral selectivity, with- out producing a prohibitive amount of heat in the sam-
ple.
5. PSHB applications
A broad absorption band with a sharp spectral hole in it is a narrow-band wide-aperture transparency filter. PSHB can be used to produce filters with various spatial and spectral transparency profiles. Spectrally broad
illumination produces a broad structure of transparency profile. An example of PSHB recording a broad spec- trum of stationary luminescence is given in Fig. 4. Here the PSHB sample acts as a spectrometer. Broad profiles are written in also by short time-dependent light pulses. It provides the possibility to store, play-back and design the shapes of nano-, pica- and femtosecond pulses [ 16- 191.
An interesting case is a filter as a bit-by-bit frequency domain optical memory - bits can be coded along the frequency axis, w, and by interpreting the presence of a hole at the frequency oi as a bit value 1, and the absence of a hole, as a bit value 0. An inhomogeneous
144 K. K. Rebane / Chemical Physics I89 (1994) 139-148
I 2
622 620 618 k/nm
Fig. 4. The fluorescence spectrum of octaetbylprophin molecules
embedded in n-hexane at T= 5 K measured in a conventional way
by means of a DFS-24 spectrometer (below) and the same spectrum
recorded by illuminating a persistent spectral hole burning material
(the same octaethylporphin doped n-hexane) directly with a pho-
toexcited fluorescence flux from the sample under study (J. Kikas,
in Ref. [2]).
band of a typical PSHB material, e.g. octaethylpor- phyrin molecules in polystyrene matrix (concentration about 10V4 mol/l), can comprise up to 10000 bits on the frequency axis at T=2 K. An example of fre-
quency-coded data is shown in Fig. 5 [21] (see also Ref. [ 41) . The smallest size of the spatial spot at which the frequency bits can be written in is limited by the diffraction, i.e. the area per focused laser spot can ulti-
mately be A2 (A3 for volume storage), where A is the hole-burning wavelength. Note that this limit is put by the conventional optical addressing and not by the spa- tial resolution capabilities of the PSHB material.
The theoretical upper limits for an optical PSHB storage density are high. Optimistic estimates place them at 10” bits per cm* (i.e. lo4 spectral holes per diffraction-limited spatial pixel of size h*- 1O-8 cm*) or lO”j bits per cm3 for volume storage memory (cell
size A3 - lo- ‘* cm3). If the impurity concentration is
too high, energy transfer between them may occur. This results not only in some broadening of homogeneous ZPLs because of the decreased lifetime, but, also, and
that is decisive, in addition to the direct and spectrally
selective hole burning, spreading the hole burning all over the inhomogeneous band of ZPL frequencies.
After an impurity is selectively excited and before the
act of burning out is fixed, the excitation energy may be transferred to a neighbor impurity and the burning-
out act is performed there. The neighbor’s ZPL fre-
quency may be quite different (the effective resonant
energy transfer can be provided by the overlap with
phonon sidebands) and thus the contribution to the hole
may go to a frequency quite different from the excita-
tion one. This is one of the large number of situations
when it is obligatory to remember about phonon side-
bands. Interactions between impurities can be sup-
pressed by taking lower concentrations; however, this
will result in a critical decrease of the average number
of impurity molecules available for burning a hole at a
fixed wavelength at a fixed spatial spot [ 221. Bit-by-bit (digital) storage is not a full-scale utili-
zation of the capabilities of PSHB materials - very high
spectral selectivity and very high spatial resolution. The
practical problem is the enormous amounts of bits
which make parallel processing a must. No effective
schemes for large scale bit-by-bit PSHB storage have
been realized experimentally today.
$3 - ,
Fig. 5. Words “HOLE” and .%&LK” (the Estonian equivalent of
“dip”) are recorded and played back by using two mutually per-
pendicular polarizations at the same 0.5 cm* spot of PSHB material
(polystyrene block doped with octaethylporphin molecules at T- 5
K, R. Jaaniso, 1989 [ 211).

K.K. Rebane / Chemical Physics 189 (1994) 139-148 145
Two versions of PSHB distributed data storage and distorted signals [ 3 1 ] , imaging through light scattering processing have been realized up to now, holography media [ 321, storage and study of femtosecond domain [ 19,231 and models on neural networks [ 241. light pulses [ 331).
New versions of holography are the most successful application of PSHB data storage and processing up to now. It utilizes both the distributed storage and parallel processing and demonstrates the advantages and poten- tials of PSHB in this field.
PSHB has enriched holography with the frequency domain and the time domain as additional “degrees of freedom’ ’ , which, owing to their physical dimension- alities, wand f, not only enlarge the number of available bits, but also open up principally new possibilities. Two main new fields of holography have been born: space-
and-frequency-domain stationary holography [ 23,251 and space-and-time-domain holography [ 19,26-291, see also Refs. [ 2,4-61. The former utilizes w directly as an additional coordinate to enlarge the storage capac-
ity by several thousand times. The latter one exploits the high-frequency selectivity of the PSHB materials to realize the holography of time-dependent pictures, i.e. events. It has been shown that PSHB holography can also include the polarization of light pulses [ 301. It means that all the features carried on by a classical light pulse - three-dimensional time dependent colour picture, including also polarization of light - can be
holographically stored and played back. A first attempt to store several picosecond events at different intervals of the frequency axis, i.e. to realize space-time-and- frequency-domain holography has been used in one of the versions of PSHB modeling of neural networks
1241.
The possibility of fully parallel optical access to the
stored data, even if the information is partially (or completely) coded in the frequency and/or time dimensions, makes the application of hole-burning
materials for associative memories [ 341 and the par- allel processing especially attractive.
6. Single impurity molecule spectroscopy (SMS)
SMS requires to isolate a single molecule and its
response, which is to be recorded, in such a way that the background from all the other molecules and noise
is well suppressed in comparison with the signal from the single molecule.
Introducing time and frequency brings PSHB holog- raphy under the reign of causality, the Kramers-Kronig relations between the coefficient of absorption and index of refraction are in power. This fundamental bound, which, naturally, is an obvious must for the time-sequence of the events (causality clearly pre- serves and plays back the sequence of events in time),
holds also for time-independent pictures stored in the frequency domain and the awareness of this connection helps one to minimize in stationary holography cross- talk between the holograms stored at different frequen- cies in the same PSHB sample [ 251. Causality enables one to perform spectacular experiments on the time arrow and its reversal (PSHB conjugation of wave- fronts) in time-and-space-domain holography, exploit- ing associative memory properties (e.g. correction of
In conventional optical addressing the diffraction limit A3 selects a body of about 10” molecules to be under illumination. Out of them lo4 are impurities, if their relative concentration is 10 ~ 6. Thus single impu- rity molecule spectroscopy (SMS) has to deal with one molecule at a background of 10” molecules, whose frequencies are out of resonance with the excitation by a few thousands of cm- ’ (the host molecules) and lo4 molecules in the inhomogeneous impurity band distrib- uted over about l-1000 cm-’ around the resonance. The single molecule subject to SMS (which is really a spectroscopy, not merely detection!) must have a sharp and intense absorption line towering well above the
spectral background created by the other 10” mole- cules under illumination. The ZPL is a proper candidate for that role.
ZPLs are narrow and their PSCSs at liquid helium temperatures are large (see Section 2). The up to now most popular SMS system, the pentacene molecule in p-terphenyl single crystal, has ZPL homogeneous width at liquid helium temperatures 7-10 MHz. The
commercially available single mode ring lasers provide for excitation tunable nearly monographic light with linewidth l-2 MHz. Thus the peak of the ZPL absorp- tion may be well matched and the lineshape around the peak also checked. The measurement of fluorescence excitation spectra, the well known from luminescence studies zero-background method, has proven its effi- ciency in SMS [ 7 1. A typical experiment, in which the signal to noise ratio 10 : 1 was achieved, will be consid-

136 K.K. Rebane/ Chemical Physics 189 (1994) 139-148
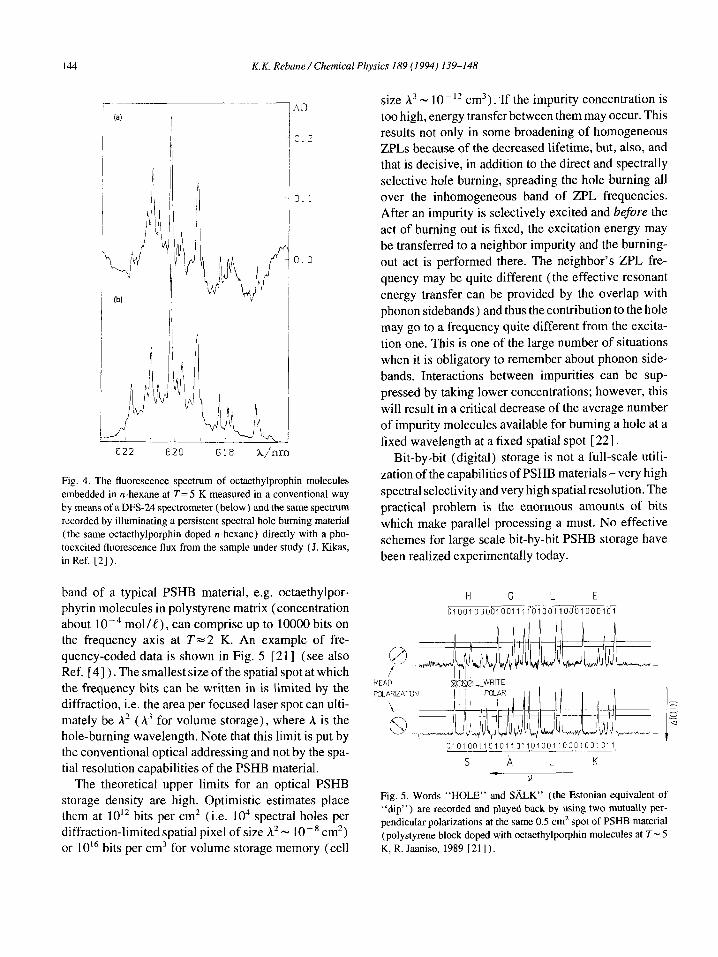
Excltatlon frequency relative to v,=16886.083 cm“
Fig. 6. Fluorescence excitation spectrum of single pentacene mole-
cules in a p-terphenyl single crystal at 1.85 K. (This spectrum is a
single scan of the laser frequency of I+.) The inset shows ZPL for
two pentacene impurity molecules A and B. (This spectrum is the
sum of three successive laser scans.) The solid curve represents a
two-Lorentzian fitting.
ered below [ 351. A single-mode dye laser has been used for tuning the laser frequency across the molecular ZPL absorption, and the Stokes-shifted fluorescence intensity has been monitored as a function of excitation
wavelength. For this purpose an optical setup with a numerical aperture of 0.6 has been designed [ 351.
Fluorescence excitation spectra of approximately 5 pm thick flakes of a p-terphenyl single crystal doped with pentacene at a concentration of lo-’ mol/mol are recorded at 1.85 K on a CR699-29 Autoscan single-
frequency dye laser spectrometer with frequency jitter of about 1 MHz.
A weak fluorescence signal detected in the photon counting mode is accumulated into a multichannel ana- lyzer LP4900 synchronously with the 1 MHz steps of the laser scan. The accumulation time (0.2 s per 1
MHz) for a data point was sufficiently short to avoid any distortion caused in the measured spectra by long-
term drift of the laser frequency ( 100 MHz per hour). Fig. 6 [ 351 shows a fluorescence excitation spectrum
consisting of about 20 absorption ZPLs of single pen- tacene impurity molecules in a spectral range of 3000 MHz (0.09 cm-‘). This spectrum was obtained from a single scan of the laser frequency near the maximum of the O2 site (laser sweep started at wavenumber of 16886.083 cm- ‘), The intensities of ZPLs differ because of the orientational distribution of pentacene molecules relative to the polarization of the excitation light and also because of the uneven spatial distribution
of excitation power in the probing volume selected by the pinhole. The fluorescence collection efficiencies of all excited pentacene molecules are practically equiv- alent. The average signal of 400 counts/s at a laser power of 3.6 mW/cm’ corresponds to an overall quan-
tum yield of O.l-0.2% for our SMS system. For the most intense ZPL a SNR of 10 : 1 has been reached.
The inset of Fig. 6 represents a fit to the fluorescence excitation spectrum with two Lorentzians in an
expanded scale for two pentacene molecules A and B. To determine the real homogeneous line widths $,,, the presence of the metastable triplet state has to be taken into account [7] : about one out of 100 excited molecules undergoes an S,-Tr transition, after which the molecule is not absorbing during the triplet lifetime
of some tenths of milliseconds. The number of “lost acts of excitation” during agiven photon counting time (0.2 s) is larger for higher counting rates and causes a deformation of the measured spectral line compared to the real ZPL shape. This effect of “triplet saturation” reveals excitation rates of 104-10’ s-‘, which are still
below that of power broadening of the S-S, transition, Several ZPLs of single molecules were measured at
different excitation densities in the range of l-5 mW/ cm2, and the corresponding line widths &,,, were deter- mined. The “zero-intensity” homogeneous width
Sg,, was obtained by extrapolation of &,,, according
to the formula [ 71
where Z and Z, are excitation and three-level saturation intensities, respectively. The extrapolated line widths
versus the measured ZPL intensities are depicted in Fig. 7. The distribution of line widths around the lifetime- limited value of 8 MHz shows remarkable dispersion ( from 5 to 15 MHz), which exceeds our measurement accuracy ( 1 MHz).
SMS is a rapidly growing novel prospective field of spectroscopy of matrix isolated molecules, atoms, and lattice defects. It provides single molecules (and other impurity centres in solids) as the probes of ultimate selectivity to study the properties of molecules and solids and processes in them [ 9,10,36]. SMS has opened new possibilities for experiments on funda- mental problems of quantum mechanics and quantum optics. As to the prospectives, to utilize SMS in optical data storage and processing, then today they are
opaque.

K.K. Rebane /Chemical Physics 189 (1994) 139-148 147
207
i
t-o,; o-o,
2 1 0
i ++oo
+ 0” + CC+
s + 0 0
i 0
LL + +to 4
5 To 0
+ +
1 PC-PTP T= 1.85K 01 ~,~,I ,I ,I I I,, I
0 80 100 120 140
Fig. 7. Plot of the measured ZPL parameters (line widths versus
amplitude) for single pentacene molecules in the 0, (crosses) and
Oa (circles) sites of ap-terphenyl crystal.
Today the first and main prerequisite for SMS is the presence of well pronounced ZPL in the spectrum of absorption. If the excited vibrational levels are involved in a transition, the corresponding linewidth is normally broader by a factor of about 1000 and it makes the SMS experiment much more difficult. The second condition is the absence or low efficiency of PSHB. If about 500 acts of excitation of the molecule have to be performed to get one count to fix the point of the spectral curve, the PSHB efficiency has to be considerably lower than
1 : 500 [ 71. Note that the latter is quite a high efficiency of PSHB.
Large F,,w are favourable. But, if the method is the measurement of absorption via the excitation spectrum of fluorescence, the excitation frequency and resonant with it ZPL in fluorescence must be carefully filtered out (to suppress the background of scattered excitation light), the F,,, ‘s too close to the maximum value F,,, = 1 become also unfavourable: the fluorescence not filtered out becomes very weak. Naturally, a suffi- cient optical quality of the sample is also necessary.
In conclusion of this section I would like to point out
that SMS does not require any exotic equipment or technology for the experiment.
7. Conclusion
Purely electronic zero-phonon line is a fine and use- ful feature of the low-temperature spectra of many
impurity activated solids. High and very high resolution spectroscopy has emerged and is developing. A new exciting chapter is the single impurity molecule spec- troscopy. Persistent spectral hole burning enables one to control by illumination with very high spectral and spatial resolution the absorption coefficient and related to it index refraction of the impurity activated solids,
whose spectra comprise the narrow and intense ZPLs. PSHB has turned the large inhomogeneous broadening of ZPLs into a useful property. Quite a number of PSHB applications in science and potential applications in practice have been established, among them space-and- frequency-domain holography, space-and-time-
domain holography, optical modeling of error- corrective neural networks. Prospectives for further development of PSHB studies and applications are promising.
Acknowledgement
The author is grateful to Inna Rebane for discussions and Liivia Juhansoo for help in preparing the manu- script. This work was supported, in part, by a Soros Foundation grant awarded by the American Physical Society and, in part, by the World Laboratory.
References
[ 1 ] K.K. Rebane, Impurity spectra of solids (Plenum Press, New
York, 1970).
[ 2 ] 0. Sild and K. Haller, eds., Zero-phonon lines and spectral hole
burning in spectroscopy and photochemistry (Springer, Berlin,
1988).
[ 3] R.I. Personov, in: Spectroscopy and excitation dynamics of
condensed molecular systems, eds. V.M. Agranovich and R.M.
Hochstrasser (North-Holland, Amsterdam, 1983) p. 555.
[4] W.E. Moemer, ed., Persistent spectral hole burning: science
and applications (Springer, Berlin, 1988).
[S] Technical Digest on Persistent Spectral Hole Burning: Science
and Applications, Conference 2628 September 199 1,
Monterey, CA, Optical Society of America, Washington DC,
Technical Digest Series, Vol. 16 ( 199 1).
]6] Technical Digest on Spectral Hole-Burning and Luminescence
Line Narrowing: Science and Applications, Conference 14-l 8
September 1992, Monte Verita, Ascona, Switzerland, Optical
Society of America, Washington DC, Technical Digest Series,
Vol. 22 ( 1992).
]7] W.E. Moemer and L. Kador, Phys. Rev. Letters 62 ( 1989)
2535;
W.P. Ambrose and W.E. Moerner, Nature 349 ( 199 1) 22.5;

148 K.K. Rebane/ Chemical Physics I89 (1994) 139-148
W.P. Ambrose, Th. Basche and W.E. Moemer, J. Chem. Phys.
95 (1991) 7150.
IX ] M. Orrit and J. Bernard, Rev. Letters 65 ( 1990) 2716;
M. Orrit, J. Bernard and A. Zumbusch, Chem. Phys. Letters
196 (1992) 595;
U. Wild, F. Giittler, M. Pirotta and A. Renn, Chem. Phys.
Letters 193 (1992) 451;
Chr. Brauchle, Angew. Chemie 104 ( 1992) 43 1; Th. Basche, W.P. Ambrose and W.E. Moerner, J. Opt. Sot.
Am. B 9 ( 1992) 829;
V. Palm, K. Rebane and A. Suisalu, J. Phys. Chem. 98 ( 1994)
2219;
I. Zschonke, ed., Optical spectroscopy of glasses (Reidel,
Dordrecht, 1986) p. 149.
19 I W.E. Moemer, J. Luminescence, to be published;
Th. Basche, S. Kummer and C. Brj_uchle, submitted to J. Chem.
Phys.;
W.E. Moerner, T. Plakhotnik, T. Imgartinger, M. Croci, V.
Palm and U.P. Wild, submitted to J. Phys. Chem.;
U.P. Wild, F. Giittler, V.V. Palm, T. Plakhotnik and K.K.
Rebane, submitted to Opt. i Spektroskopiya (in Russian)
[IO] M. Orrit, J. Bernard and R.I. Personov, J. Phys. Chem. 97
(1993) 10256.
[ 1 I I K. Rebane and I. Rebane, J. Luminescence 56 ( 1993) 36.
[ 12 I W. Heitler, The quantum theory of radiation (Oxford Univ.
Press, Oxford, 1954).
[ 13 ] V.V. Hizhnyakov, Proc. Estonian Acid. Sci. Phys. Math. 38
(1989) 113.
[ 141 A.A. Gorokhovskii, R.K. Kaarli and L.A. Rebane, Pis’ma Zh.
Eksp. Teor. Fiz. 20 (1974) 16.
1151 B.M. Kharlamov, R.I. Personov and L.A. Bykovskaya, Opt.
Commun. 12 (1974) 191.
[ 161 J. Kika? and J. Malkin, Proc. Estonian SSR Acad. Sci. Phys.
Math. 36 (1987) 62;
E. Malkin and J. Kikas, Opt. Commun. 73 ( 1989) 295.
[ I71 R. Jaaniso, J. Kikas, E. Malkin and P. Truusalu, Opt. Commun.
75 ( 1990) 397;
J. Kikas and J. Malkin, Proc. Estonian Acad. Sci. Phys. Math.
39 (1990) 163.
[ I 8 ] K.K. Rebane and L.A. Rebane, in: Ref. [ 4 1, p. 17.
I IS] A.K. Rebane, R.K. Kaarli and P.M. Saari, Opt. Spectry.
(USSR), 55, No. 3 (1983) 238;
A. Rebane, R. Kaarli, P. Saari, A. Anijalg and K. Timpmann,
Opt. Commun. 47 (1983) 173;
A. Rebane and R. Kaarli, Chem. Phys. Letters 101 (1983) 317;
P.M. Saari, R.K. Kaarli and A.K. Rebane, Kvantovaya
Elektron. 12 ( 1985) 672 [Sov. J. Quantum Electron. 15
(1985) 4431.
I?0 1 W. Hesselink and D.A. Wiersma, J. Chem. Phys. 75 (1981)
4192;
D.A. Wiersma, in: Advances in chemical physics, Vol. 47, eds.
J. Jortner,R.D.LevineandS.A. Rice (Wiley,New York, 1981)
p. 421.
[ 211 K. Rebane, Useful properties and problems of spectral hole burning memories (in Estonian), Estonian Physical Society,
Annual Report, ( 199 1) p. 32;
K.K. Rebane and R.V. Jaaniso, Means to manufacture optical
persistent spectral hole burning memories (in Russian), USSR
Patent Application No. 4836210/10 (030409) (1989).
[ 22 ] K.K. Rebane, Mol. Cryst. Liq. Cryst. 236 ( 1993) 13.
[23] A. Renn. A.J. Meixner, U.P. Wild and F.A. Burkhalter, Chem.
Phys. 93 (1985) 157;
U. Wild, A. Renn, C. Caro and S. Bernet, Appl. Opt. 24 ( 1986)
1526;
A.J. Meixner, A. Renn, U.P. Wild, A. Renn and U.P. Wild,
Appl. Opt. 26 ( 1987) 4040; J. Chem. Phys. 93 (1989) 6728;
U.P. Wild and A. Renn, J. Mol. Electron. 7 (1991) 1;
S. Bernet, A. Renn, B. Kohler and U. Wild, in: Ref. 161, p.
218.
[24] 0. Ollikainen, A. Rebane and K. Rebane, Opt. Quantum Electron. 25 ( 1993) S569;
A. Rebane and 0. Ollikainen, Opt. Commun. 83 ( 199 I ) 246.
1251 S. Bernet, B. Kohler, A. Rebane, A. Renn and U. Wild, J.
Luminescence 53 (1992) 215; J. Opt. Sot. Am. B 9 (1992)
9x7;
A. Rebane, S. Bernet, A. Renn and U. Wild, Opt. Commun. 86
(1991) 7.
[ 281 A. Rebane, Time Domain Holography, in: Ref. [ 61, p. 196;
M. Mitsunaga, Opt. Quantum Electron. 24 (1992) 1137.
[ 291 H. Gygax, E. Gi%lach, A. Rebane and U. Wild, J. Luminescence
53 (1992) 59;
[26] T.W. Mossberg, Opt. Letters 7 ( 1982) 77.
[27] A. Rebaneand R. Kaarli, Chem. Phys. Letters 101 (1983) 317; P. Saari, R. Kaarli and A. Rebane, J. Opt. Sot. Am. B 3 (1986)
527.
H. Gygax, A. Rebane and U.P. Wild, J. Opt. Sot. Am. B 10
(1993) 1149.
[ 301 P. Saari, in: Ref. [5 J, p. 123;
K.K. Rebane and P.M. Saari, Physica Scripta T19B (1987)
604;
P.M. Saari, R.K. Kaarli, R.V. Sarapuu and H.R. SBnajalg, IEEE
J. Quantum Electron. 25 ( 1989) 339;
R.K. Kaarli, P.M. Saari and H.R. Scnajalg, Opt. Commun. 65
(1988) 170.
[31] A. Rebane, Proc. Estonian Acad. Sci. Phys. Math. 37 (1988)
89 (in Russian); Opt. Commun. 67 (1988) 301.
[ 321 A. Rebane and J. Feinberg, Nature 35 1 ( 1991) 378.
[33] A. Rebane, J. Aaviksoo and J. Kuhl, Appl. Phys. Letters 54
(1989) 93;
A. Rebane, H. Schwoerer, D. Erni and U.P. Wild,
Subpicosecond pulse shaping via spectral hole-burning, Opt.
Commun., in press.
[ 341 T. Kohonen, Self-organization and associative memory
(Springer, Berlin, 1987).
[351 V. Palm, K.K. Rebane and A. Suisalu, J. Phys. Chem. 98
(1994) 2219.