Embed Size (px)
Citation preview
Vol.:(0123456789)
Annals of Data Science (2021) 8(4):683–708https://doi.org/10.1007/s40745-021-00328-x
1 3
Zero‑Inflated Models for Count Data: An Application to Number of Antenatal Care Service Visits
Daniel Biftu Bekalo1 · Dufera Tejjeba Kebede1
Received: 5 October 2018 / Revised: 19 January 2021 / Accepted: 26 March 2021 / Published online: 23 May 2021 © The Author(s) 2021
AbstractThe risk of maternal death in developing countries is projected to be one in 61, while for developed countries it is estimated to be one in 2800. Antenatal care is a protec-tive obstetric health care system aimed at improving the outcome of the pregnant fetus by routine pregnancy monitoring. One of the most important functions of ante-natal care is to offer health information and services that can significantly improve the health of women and their infants. 6450 pregnant women from Ethiopian Demo-graphic and Health Survey of 2016 were used to analyze the determinants of the barriers in number of antenatal care service visits among pregnant women in Ethio-pia. The data were found to have excess zeros (35%); thus several count data models such as Poisson, Negative Binomial, Zero Inflated Poisson, Zero Inflated Negative Binomial and Hurdle regression models were modeled and fitted. From the explora-tory analysis the results showed that among those eligible pregnant women, it was seen that 2240 (34.7%) of them did not visit antenatal care service during their peri-ods of pregnancy months. The visualization of data using scatter plot depicts that all of the variables selected for modeling have an influence on the event of not visit-ing antenatal care cervices while each of these variables had opposite slope in non-zero number of such events in their respective categories. To select the model which best fits the data, models were compared based on their Akaike information criterion value by using the simulation study. The simulation experiment revealed that models for zero-inflated data such as; Zero Inflated Poisson, Zero Inflated Negative Bino-mial and Hurdle were models that fitted the data better than the classical models Poisson and Negative Binomial. Each of these zero-inflated models was compared using Voung test and Hurdle model was better fitted the data which was character-ized by excess zeros and high variability in the non-zero outcome than any other zero-inflated models. In this study, maternal education, partner education level, age of mothers, religion of mothers and wealth index are major predictors of antena-tal care service utilization. Through simulation experiment, it was found that Zero Inflated Poisson, Zero Inflated Negative Binomial and Hurdle models were better fit-ted zero-inflated data than Poisson and Negative Binomial. Voung test suggests that
Extended author information available on the last page of the article

684 Annals of Data Science (2021) 8(4):683–708
1 3
Hurdle model was better fitted zero-inflated (ZI) data than any other zero inflated models and therefore, it was selected as the best parsimonious model.
Keywords Antenatal care · Zero-inflated · Hurdle · Poisson · Negative binomial
AbbreviationsANC Antenatal careNB Negative binomialZIGP Zero inflated generalized poissonZIP Zero inflated poissonZINB Zero inflated negative binomialZI Zero-inflatedAIC Akaike information criterionBIC Bayesian information criterionCSA Central statistical agencyEDHS Ethiopia demographic and health survey
1 Introduction
Antenatal care is a preventive obstetric health care program aimed at improving the outcome of the maternal fetus by routine pregnancy monitoring [1]. The risk of maternal death in developing countries is projected to be one in 61, while for devel-oped countries it is estimated to be one in 2800 [2]. Complications during pregnancy and childbirth are the leading cause of death and disability among women of repro-ductive age in developing countries. There are an estimated 529,000 maternal deaths each year, of which 99% occur in developing countries [3]. Millions of women lack access to adequate care during pregnancy in these countries. ANC is actually pro-vided by 71 percent of women worldwide; more than 95 percent of pregnant women in industrialized countries have access to ANC. 69% of pregnant women in sub-Saharan Africa have at least one ANC visit [4].
Although various studies have examined various risk factors for antenatal care (ANC) and the country’s use of delivery services, the Ethiopian Ministry of Health stated in 2014 that substantially 45 percent of Ethiopian women received one or more ANC visits, less than 11 percent received professional care and 19 percent received postnatal care [5]. Inadequate coverage and under-use of modern health care services in developing countries are major reasons for poor health [6].
A rising problem is this imbalance in women’s health and well-being in the developing and developed world. Essential determinant of safe delivery is ante-natal care (ANC) [7]. Although it is not possible to predict such obstetric emer-gencies via antenatal screening, women may be trained to identify and respond on signs that lead to potentially serious conditions [8]; this is one solution to maternal mortality reduction [9]. One of ANC’s most important functions is to provide health information and services that can boost women’s and their infants ’ health significantly [10]. Additionally, ANC seems to have a positive impact on

685
1 3
Annals of Data Science (2021) 8(4):683–708
the use of postnatal health care services during pregnancy [11]. Empirical evi-dence suggests that four visits are adequate for uncomplicated pregnancies and more are needed only in complications [12]; thus, the World Health Organiza-tion is currently recommending at least four ANC visits throughout pregnancy.
This study, will provide a valuable information about count data models when the assumption of the standard Poisson regression is violated (when there is greater variability in the response counts than one would expect if the response distribution truly were Poisson). Counting data in many studies may have an excess of zeros. In the same process as other positive counts, zero counts may not occur. Lambert [13] discussed this issue and suggested a zero-inflated Pois-son (ZIP) model, which Greene [14] also proposed to apply defects in manufac-turing. There may be no equality of mean and variance between zero-inflated count results. In such situations, it is necessary to take into account over-dis-persion (or under-dispersion). Several researchers have proposed a variety of mixture and compound distribution of Poisson, such as double Poisson, Poisson log-normal, Poisson-geometric, Poisson-negative binomial, Poisson-modified, Poisson-Pascal, Quasi-Poisson, mixed-Poisson, Poisson-binomial, and so on, to tackle the mean inequality and variance of the Poisson distribution.
However, it is suggested that a generalized Poisson distribution could take into account Poisson distribution over-dispersion [15]. It contains two param-eters 1 and2 where2 can be positive, zero, or negative. If 2 is zero then it becomes the standard Poisson. Still there is a mean variance relationship but equality assumption becomes flexible. Later Consul and Famoye [16] improved the model for regression analysis. An extension of the generalized Poisson dis-tribution proposed by Famoye and Singh [17] is zero-inflated generalized Pois-son (ZIGP). In the presence of over-dispersion in the results, if Poisson mean has a gamma distribution, negative binomial model can be preferred. The zero-inflated negative binomial (ZINB) model discussed by Mwalili [18] is a natu-ral extension of the negative binomial model to accommodate excess zeros in the results. Using truncated models is another popular approach to modeling the excess zeros in count data. Hurdle model, which is developed by Cragg [19] is an example of truncated models for count data.
In this study, three zero-inflated models, ZIP, ZINB and Hurdle model were considered, to observe whether there is any effect of proportion of zeros in the performance of the models with given overall rate of the counts. Two classi-cal data count models were also considered for comparison, Poisson and nega-tive binomial. This study’s main motivation was that the real life data was often skewed with zero counts and may or may not be over-dispersed (or under-dis-persed). In this study, data generating processes were used from Poisson inflated at zero by excessively varying zero counts (from 30% to 80%). The study tried to investigate how the model fit changes for different rate of counts with different proportion of zeros in the simulation experiment. The literature contains numer-ous applications of ZI models. In this research, these models were designed and fitted on the number of antenatal care visits to Ethiopia.

686 Annals of Data Science (2021) 8(4):683–708
1 3
2 Methods
2.1 Sources of Data and Variables in the Model
The data used for this study was taken from the 2016 EDHS, a nationally repre-sentative survey of fertile age women (15–49 years of age) groups taken from Ethi-opia’s Central Statistical Agency (CSA). This survey was the fourth compressive survey designed to provide estimates for the health and demographic variables of interest for the whole urban and rural areas of Ethiopia as a domain. Women who had 9 months pregnancy during the survey interview were included in the analysis. The study includes 15,684 women of fertile age group in the country, who had at least 9 months of pregnancy period during survey in 2016 EDHS. There were cases in which information on the relevant variables was missing and these cases were excluded from the analysis. Thus, the analysis presented in this study on the factors affecting ANC visit was based on the 6,450 women in the fertile age (15-49). The study’s response variable was the number of pregnant women’s antenatal care visits from early pregnancy to their 9-month pregnancy period. Thus, this paper attempted to include socioeconomic, demographic and environmental related factors that are assumed as a potential determinants for the barriers in the number of antenatal care service visits, adopted from literature reviews and their theoretical justification. Detailed descriptions of these factors are presented in Table 1.
2.2 Statistical Models
In this section, a non-exhaustive list of commonly used regression models for count and zero-inflated count data were briefly outlined. The following five regression models, Poisson regression, Negative Binomial regression, zero-inflated Poisson
Table 1 Coding and variable description for the analyzed ANC visits
Dependent variable Description
ANC Number of ANC visits
Independent variables Catagories
Age 1 = 15–24, 2 = 25–34, 3 = 35–49Wealth Index 1 = Poor, 2 = Middle, 3 = RichResidence 0 = Urban, 1 = RuralExposure to media 0 = No, 1 = YesMarital Status 0 = Married, 1 = SingleEmployment status 0 = No, 1 = YesReligion 1 = Orthodox, 2 = Catholic, 3 = Protestant, 4 = Muslim, 5
= TraditionalMother education 1 = No education, 2 = Primary, 3 = Secondary, 4 = HigherPartner education 1 = No education, 2 = Primary, 3 = Secondary, 4 = Higher

687
1 3
Annals of Data Science (2021) 8(4):683–708
(ZIP) regression, zero-inflated negative binomial (ZINB) regression, hurdle regres-sion are used to model count and zero-inflated count data.
2.2.1 Poisson Regression Model
Given that the dependent variable (number of ANC visits) is a non-negative integer, most of the recent thinking in the field is the use of Poisson regression model as a starting point. In a standard Poisson regression model, the probability of pregnant women i having yi antenatal care service visits until her nine (9) months of preg-nancy period (where yi is a non-negative integer) is given by:
where p(yi) is the probability of (9) month pregnant women entity i having yi ante-natal care service visits in nine (9) months of pregnancy period and �i is the Pois-son parameter for pregnant women i, which is equal to pregnant women entity i′s expected number of antenatal care service visits in nine (9) months, E(yi).
2.2.2 Negative Binomial Regression Model
The negative binomial (or Poisson-gamma) model is a Poisson model extension to address possible data over-dispersion. This model assumes that the Poisson parame-ter follows a gamma probability distribution. The negative binomial model is derived by rewriting the Poisson parameter for each observation i where �i = exp(�Xi + �i) where exp(�i) is a gamma-distributed error term with mean 1 and variance K. The addition of this term allows the variance to differ from the mean as:
The probability mass function for the negative binomial distribution is:
The parameter p is the probability of success in each trial and it is calculated as: p =
r
�i+r where, �i = exp(y) is mean of the observations and r is inverse of the dis-
persion parameter (i.e r = 1
k).
The Poisson regression model is a limiting model of the negative binomial regres-sion model as k approaches zero, which means that the selection between these two models is dependent upon the value of k. The parameter k is often referred to as the overdispersion parameter. Although the negative binomial model can solve an over dispersion problem, it may not be enough flexible to handle when there are excess zeros. In such cases, one can use the zero-inflated models as well as hurdle models to solve the problem.
p(yi) =exp(−𝜇i)𝜇
yii
yi!, yi = 0, 1, 2,…(𝜇i > 0) [19],
(1)Var[yi] = E[yi][1 + K[yi]] + E[yi] + KE[yi]
(2)p(yi) =
(
yi + r − 1
yi
)
pr(1 − p)yi , r = 0, 1, 2, 3,…[20]

688 Annals of Data Science (2021) 8(4):683–708
1 3
2.2.3 Zero‑Inflated Models
There are cases where the predominance of zero counts is a major source of over-dispersion and the resulting over-dispersion can not be adequately modeled with negative binomial model. In such cases, it is possible to fit the data with zero-inflated Poisson or zero-inflated negative binomial model [21]. According to Lord [22], Zero-inflated techniques permit the researcher to answer two questions that pertain to low base rate-dependent variables: (a) what predicts whether or not the event occurs, and (b) if the event occurs, what predicts frequency of occur-rence? In other words, two regression equations are created: one predicting the occurrence of the count and the other predicting the occurrence of the count [22]. Moreover, zero-inflated models have statistical advantage to standard Poisson and negative binomial models in such a way that they model the preponderance of zeros as well as the distribution of positive counts simultaneously [23].
2.2.4 Zero‑Inflated Poisson (ZIP) Regression Model
ZIP model operates on the principle that the excess zero density that cannot be accommodated by a traditional count structure. A splitting regime that models a woman who is not visited for ANC versus a woman who visited for ANC during her pregnancy time determined by a binary logit or probit model that account for the likelihood of an ANC visitation entity being in zero or non-zero states [24, 25]. In one regime (R1) the outcome is always a zero count, while in the other regime (R2) the counts follow a standard Poisson process. Suppose that: p[yi�R1] = �i ; p[yi�R2] = (1 − �i);i = 1, 2,… , n.Where �i is inflation probability. Thus, the occurrence of Yi follows the following distributions:
𝜇i > 0 and 0 ≤ 𝜔i < 1.
The mean and variance of ZIP distribution are exp(yi) = (1 − �i)�i = �i and var(yi) = �i + (
�i
1+�i
)�2
i= (1 + �i)(�i + �i�
2
i) indicating that the marginal distribu-
tion of yi exhibits over-dispersion of the data if (𝜔i > 0) . It is clear that this reduces to the standard Poisson model when �i = 0.
2.2.5 Zero‑Inflated Negative Binomial (ZINB) Regression Model
Zero-Inflated Negative Binomial (ZINB) regression model also assumes two dis-tinct data generation processes. The ZINB distribution is a mixture distribution, similar to ZIP distribution, where the probability �i for excess zeros and with probability (1 − �i) the rest of the counts followed negative binomial distribution. Note that the negative binomial distribution is a mixture of Poisson distributions,
(3)(Y = yi) =
{
(1 − 𝜔i)e−𝜇i𝜇
yii
yi!when yi > 0
𝜔i + (1 − 𝜔i)e−𝜇i when yi = 0

689
1 3
Annals of Data Science (2021) 8(4):683–708
which allows the Poisson mean � to be distributed as Gamma, and in this way over dispersion is modelled. The ZINB distribution is given by:
The mean and variance of the ZINB distribution are E(Yi) = (1 − �i)�i and Var(Yi) = (1 − �i)�i(1 − �i�i + �i∕�) , respectively. It is to be noted that this dis-tribution approaches the ZIP distribution and the negative binomial distribution as � → ∞ and �i → 0 , respectively. If both 1∕� and �i ≈ 0 then ZINB distribution reduces to Poisson distribution [18, 26].
2.2.6 Hurdle Regression Models
Hurdle regression is also known as two-part model which is originally developed by Mullahy [23]. Mullahy says, “The idea behind the hurdle formulations is that a model of binomial probability controls the binary outcome of whether a variable count has a zero or a positive outcome. If the realization is non- zero (positive), the “hurdle is crossed”, and the conditional distribution of the positives is governed by a truncated-at-zero count data model.” The attraction of Hurdle regression is that it reflects a two-stage decision-making process in most human behaviors and therefore has an appealing interpretation [27].
For instance, it is pregnant mother’s decision whether to contact the doctor’s office and to make the initial visit. However, after the pregnant mother’s first visit, doctor plays a more important role in determining if the pregnant mother needs to make fol-low-up visits. Therefore, in a regression setting, a Logit or Probit regression may repre-sent the first decision, while a truncated Poisson or Negative binomial regression may evaluate the second. In addition, in each decision process, different explanatory vari-ables are allowed to have different impacts.
2.2.7 Hurdle Poisson (HP) Regression Model
The most popular formulation of a Hurdle regression is called Logit-Poisson model, which is the combination of a Logit regression modeling zero versus non-zero out-comes and a truncated Poisson regression modeling positive counts conditional on non-zero outcomes.Its probability density function is given as:
where; �i = p(yi = 0),�i = exp(B�), log(�i
1−�i
) = Ψ� [23].
(4)
p(Yi = yi) =
{
(1 − �i)Γ(yi+�)
yi!Γ(�)(1 +
�i
�)−�(1 +
�i
�);when yi = 1, 2,… ,
�i + (1 − �i)(1 +�i
�)−� when yi = 0
(5)p(yi∕xi) =
{
(1−𝜔i)exp(𝜇i)𝜇yii
(1−exp(−𝜇i))yiwhen yi > 0
𝜔i when yi = 0
690 Annals of Data Science (2021) 8(4):683–708
1 3
2.2.8 Hurdle NB Regressions Model
We consider a hurdle negative binomial (HNB) regression model in which the response variable yi has the distribution:
where (𝜏 > 0) is a dispersion parameter that is assumed not to depend on covariates [23]. In addition, we suppose 0 < 𝜇i < 1 and �i = (Ψj) satisfy log(
�i
1−�i
) =∑q
i=1Ψi� , log(�i) =
∑p
i=1Bi� Where Ψi and Bi are ith row of covariate
matrix Ψ and B and as well as � and � are the independent variables in the regression model [27].
2.2.9 Voung Test
The Vuong test is a non-nested test based on a contrast between the expected prob-abilities of two non-nested models [28]. For example, using Voung test comparisons can be made with ordinary Poisson between Zero-inflated count models, or Zero-inflated negative binomial against ordinary negative binomial model. This test is used for model comparison.
3 Results
3.1 Exploratory Analysis of ANC Visits
Only those women who were in their reproductive Age (15–49) have been consid-ered. Table 2 presents the descriptive statistics of the variables.
3.1.1 Why it is Important to Model Zero Counts and Positive Counts Separately
From the policy making view point, it is important to investigate why some moth-ers never visit antenatal care while some mothers experienced such events. These causes of not attending ANC may be influenced by socioeconomic characteristics in individual level and household level, such as, mother’s health seeking behavior, partner level of education, accessibility of health services, and strength of the health system of that region. In this study we were considered the socioeconomic charac-teristics in individual level and household level to find the causal association with ANC visit.
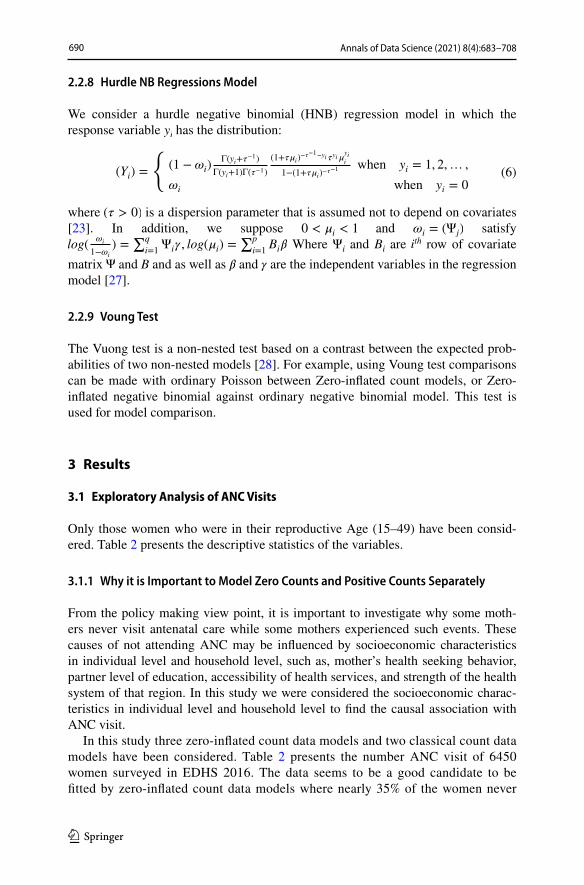
In this study three zero-inflated count data models and two classical count data models have been considered. Table 2 presents the number ANC visit of 6450 women surveyed in EDHS 2016. The data seems to be a good candidate to be fitted by zero-inflated count data models where nearly 35% of the women never
(6)(Yi) =
{
(1 − �i)Γ(yi+�
−1)
Γ(yi+1)Γ(�−1)
(1+��i)−�−1−yi �yi�
yii
1−(1+��i)−�−1
when yi = 1, 2,… ,
�i when yi = 0
691
1 3
Annals of Data Science (2021) 8(4):683–708
experienced ANC visit. The descriptive statistics given in Table 2 below shows the number and percentage of ANC visits that the pregnant mothers in the sample have encountered in their nine months of pregnancy period. It can be seen that 2240 (34.7%) of the pregnant mothers have not visited ANC service during their periods of pregnancy months, whereas 313 (4.9%) of them visited only once, 522 (8.1%) of them visited twice, 1073 (16.6%) visited three times, 1014 (15.7%) vis-ited four times and the proportion of the rest counts can be expressed in a similar ways.
Table 3 below presents summary statistics of the variables that are assumed to affect the number of ANC visits and its distributions for each levels of the variables. Accordingly, 3971 (61.6%) of the mothers are not educated, 1713 (26.6%) of moth-ers are in primary education, 495 (7.7%) of mothers are in secondary education and 271 (4.2%) of mothers are in higher education.
From Fig. 1, age of mothers may have effect on the degree of not experiencing ANC visits. Women with higher age are less likely to experience ANC visits com-pared to the other age groups. Also not visiting antenatal care may be influenced by exposure to media. The proportion of mothers attending antenatal care for those who do not exposed to media (36%) is slightly higher than those mothers exposed to media (24%). However, both variables, mothers age and exposure to media, may have influence on experiencing ANC visits with opposite slope for both variables.
Figure 2 shows women from developing region (Afar and Somali) accounts for higher proportion (60% and 65% respectively) of not attending antenatal care ser-vice, whereas percentage of not visiting antenatal care for women residing in the
Table 2 Number of mothers that experienced ANC visits
Number of visits Frequency Percentage
0 2240 34.71 313 4.92 522 8.13 1073 16.64 1014 15.75 551 8.56 353 5.57 171 2.78 89 1.49 51 0.810 35 0.511 8 0.112 8 0.113 6 0.114 2 0.015 4 0.116 1 0.020 9 0.1Total 6450 100

692 Annals of Data Science (2021) 8(4):683–708
1 3
capital city Addis Abeba is significantly minimum (1%) compared to women from other regions.
Mother’s place of residence may have effects on the degree of not experiencing ANC visits. In EDHS 2016 survey, we have found that around 40% of rural mothers did not attend antenatal care at all while only 10% of mothers from urban area did not visit antenatal care. Also mother’s employment status may have effect on the proportion of not attending ANC visit. Unemployed mothers have higher propor-tion (37.5%) of not attending antenatal care compared to employed mothers. Also,
Table 3 Descriptive statistics of ANC services utilization among pregnant women in Ethiopia
Variables Categories Number Percentage
Mothers age15–24 1622 15.125–34 3203 49.735–49 1625 25.2
Mothers religionOrthodox 2062 32.0Catholic 45 0.7Protestant 1225 19.0Muslim 3055 47.4Traditional 63 1.0
Wealth IndexPoor 3270 50.7Middle 932 14.4Rich 2248 34.9
Mothers education levelNo education 3971 61.6Primary 1713 26.6Secondary 495 7.7Higher 271 4.2
Employment statusNo 1426 71.8Yes 1822 28.2
Partner education levelNo education 3062 47.5Primary 2126 33.0Secondary 723 11.2Higher 539 8.4
Marital statusMarried 6369 98.7Single 81 1.3
Exposure to mediaNo 4658 72.2Yes 1792 27.8

693
1 3
Annals of Data Science (2021) 8(4):683–708
Fig. 1 Percentage of women not visiting antenatal care by age and exposure to media: how zero counts differ than the rests
Fig. 2 Percentage of mother’s not visiting antenatal care by region: how zero counts differ than the rests

694 Annals of Data Science (2021) 8(4):683–708
1 3
the proportion of mothers who attended ANC visit showed similar trend with oppo-site slope (Fig. 3). This finding was motivational to employ zero-inflated count data models where factors affecting zero counts can be modeled separately.
Figure 4 shows that women whom their religion is Orthodox have experienced lower proportion (20%) of not visiting antenatal care compared to women that followed traditional religion which have substantially higher proportion (76%) of not visiting antenatal care. Also, the slope for the percentage of women who experienced ANC visits are showing a trend with opposite slope.
Mother’s level of education may have effects on the degree of not experiencing ANC visits. In EDHS 2016 survey, we have found that 50% of mothers who have no education did not attend antenatal care at all while only 1% of mothers with higher education did not visit antenatal care. Similar pattern is found for partner education level. Also, mothers who attended ANC showed similar trend with opposite slope (Fig. 5). This finding was also motivational to employ zero-inflated count data mod-els where factors affecting zero counts can be modeled separately.
Wealth index (also known as asset quintile) is another factor which have sub-stantial effect on ANC visits. Women who are from those households that belongs
Fig. 3 Percentage of Mother’s not visiting antenatal care by residence and employment status: how zero counts differ than the rests

695
1 3
Annals of Data Science (2021) 8(4):683–708
to the poor 50% according to the wealth index had higher experience of not visit-ing antenatal care than the women who are from those households that belongs to the rich quintile (13%). Again, the slope for the percentage of women who experienced ANC visits, are showing a trend with opposite slope of women who had at least one experience of visiting antenatal care (Fig. 6). There is also slight proportional difference of not attending antenatal care between married and sin-gle women. Married women had a bit higher proportion (36.5%) of not attending antenatal care compared to single women. Similar trend follow for marital status as that of wealth index for women who had at least one experience of visiting antenatal care which shows an opposite slope.
3.2 Simulation Study
3.2.1 The Simulation Experiment on Zero‑Inflated Count Data Generated from Zero‑Inflated Poisson Model
In this study, zero-inflated count data which accounted three covariates with random values for � and � was simulated. The underlying interest of doing this was to see the performance of different count data models for different parameter values. Three
Fig. 4 Percentage of Mother’s not visiting antenatal care by religion: how zero counts differ than the rests

696 Annals of Data Science (2021) 8(4):683–708
1 3
Fig. 5 Percentage of women not visiting antenatal care by mother’s and partner level of education: how zero counts differ than the rests
Fig. 6 Percentage of women not visiting antenatal care by wealth index and marital status: how zero counts differ than the rests
697
1 3
Annals of Data Science (2021) 8(4):683–708
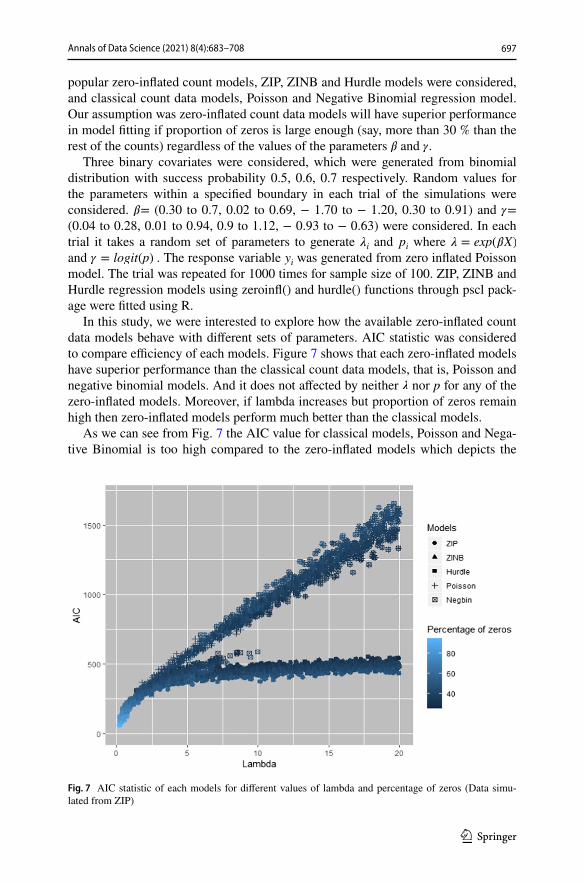
popular zero-inflated count models, ZIP, ZINB and Hurdle models were considered, and classical count data models, Poisson and Negative Binomial regression model. Our assumption was zero-inflated count data models will have superior performance in model fitting if proportion of zeros is large enough (say, more than 30 % than the rest of the counts) regardless of the values of the parameters � and �.
Three binary covariates were considered, which were generated from binomial distribution with success probability 0.5, 0.6, 0.7 respectively. Random values for the parameters within a specified boundary in each trial of the simulations were considered. � = (0.30 to 0.7, 0.02 to 0.69, − 1.70 to − 1.20, 0.30 to 0.91) and � = (0.04 to 0.28, 0.01 to 0.94, 0.9 to 1.12, − 0.93 to − 0.63) were considered. In each trial it takes a random set of parameters to generate �i and pi where � = exp(�X) and � = logit(p) . The response variable yi was generated from zero inflated Poisson model. The trial was repeated for 1000 times for sample size of 100. ZIP, ZINB and Hurdle regression models using zeroinfl() and hurdle() functions through pscl pack-age were fitted using R.
In this study, we were interested to explore how the available zero-inflated count data models behave with different sets of parameters. AIC statistic was considered to compare efficiency of each models. Figure 7 shows that each zero-inflated models have superior performance than the classical count data models, that is, Poisson and negative binomial models. And it does not affected by neither � nor p for any of the zero-inflated models. Moreover, if lambda increases but proportion of zeros remain high then zero-inflated models perform much better than the classical models.
As we can see from Fig. 7 the AIC value for classical models, Poisson and Nega-tive Binomial is too high compared to the zero-inflated models which depicts the
Fig. 7 AIC statistic of each models for different values of lambda and percentage of zeros (Data simu-lated from ZIP)

698 Annals of Data Science (2021) 8(4):683–708
1 3
appropriateness of zero-inflated models for ZI data. Among the three zero-inflated models, their performance are indistinguishable. In fact, ZIP and ZINB have iden-tical performance as the dispersion was one for data generated from Poisson with inflated zeros. But ZINB is sensitive to convergence issue. However, Hurdle models also perform along with the rest of the two zero-inflated models. Also, from Fig. 8, two histogram of ZI count data generated from Poisson and negative binomial for sample size 1000 with same mean 7, dispersion 1 and 8, respectively, and proportion of excess zeros 35% have shown. It is hard to differentiate between two graphs. This motivated us to check model efficiency of zero-inflated models using Voung test.
3.3 Parameter Estimates and Interpretation
We have fitted ZIP, ZINB and Hurdle regression models on the number of ANC visit data as around 35% of the mothers in EDHS 2016 survey have never experienced antenatal care visit. The data seems to be a good candidate for the ZI models. All the three ZI models also can be modeled with different link functions, namely logit, probit, cloglog (complementary log log), and Cauchy to account the zero counts. For this study we have considered logit link. The link functions neither improved the model nor have practical inclination with this kind of study. For positive counts we have considered Poisson and negative binomial distribution for ZIP and ZINB models, respectively.
Hurdle model has a bit more flexibility. We have discussed it earlier that it is a two component model and zero counts can be modeled separately with the mentioned link functions while the positive counts can be modeled using Poisson, negative binomial or geometric distribution. To determine which distribution works better for Hurdle model, we performed Wald test (also log-likelihood ratio test, though both produce same
Fig. 8 Histogram of 1000 variates generated from Poisson and negative binomial distribution inflated at zero

699
1 3
Annals of Data Science (2021) 8(4):683–708
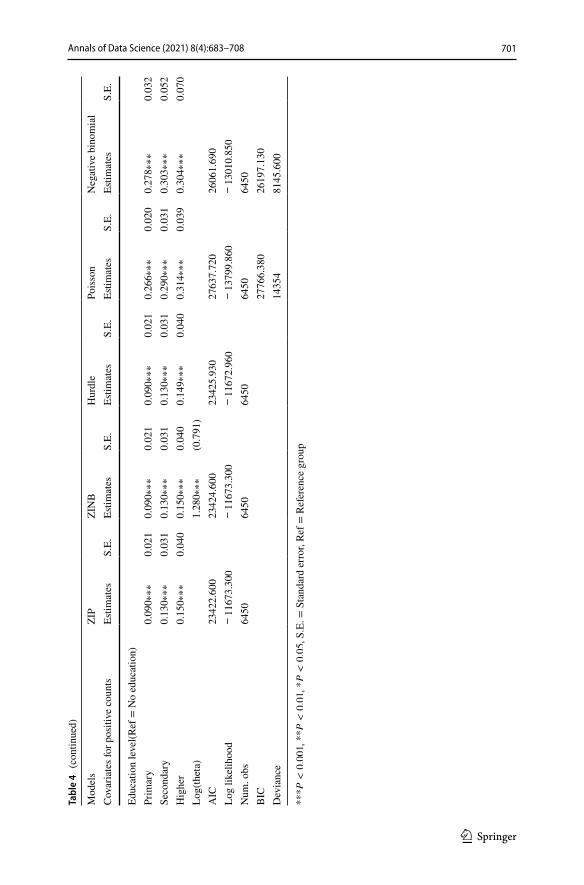
conclusion) with different distribution for positive counts and zero counts in Hurdle model. We also had to determine which variables can take account of excess zeros. As we have shown in pervious section all of the variables selected for modeling have influ-ence on the event of antenatal care visit of a mother while each of these variables have opposite slope in number of such events of a mother. Such exploration motivated us to consider all variables for excess zeros and also for positive counts. We also fitted classi-cal count data models, Poisson and Negative Binomial to compare our results. Table 4 shows the parameter estimates of each models with associated standard error.
Table 4 shows that mother’s level of education, partner level of education, age of mothers, exposure to media and wealth index are those factors that motivate mothers to follow antenatal care visit compared to their respective reference group. Age of moth-ers, mother’s religion and place of residence are factors that hinder mothers to attend antenatal care. All the ZI models showed a consensus on that with slightly different estimate of the coefficients but with same directions. Notice that ZIP and ZINB with logit link have almost similar estimates of the parameters. It might be due to the fact that there is nearly unit dispersion in the data. On the other hand, based on the Voung test, the Hurdle model with negative binomial distribution for positive counts and logit link for the zero counts is the best model that fitted ZI data very well. Estimates of the parameters for zero counts is only available for ZI models. Mother’s level of education, partner level of education, and wealth index (the lower the better), are the significant covariates for a mother not to have zero antenatal care visit.
While age of mothers, mother’s religion and place of residence are the responsible covariates for a mother not attending antenatal care. Marital status is not significant in both zero and positive counts while exposure to media is only significant for posi-tive counts and employment status is insignificant for positive counts for zero-inflated models. Notice that, Hurdle model have different sign for the estimates parameters for zero counts than the ZIP and ZINB. This is because of the way the models are defined. The zero hurdle component represents the likelihood of a positive count for the hurdle model, whereas the zero-inflation component estimates the likelihood of experiencing a negative count from the point mass element for the ZIP and ZINB models (Table 5).
3.4 Model Comparison
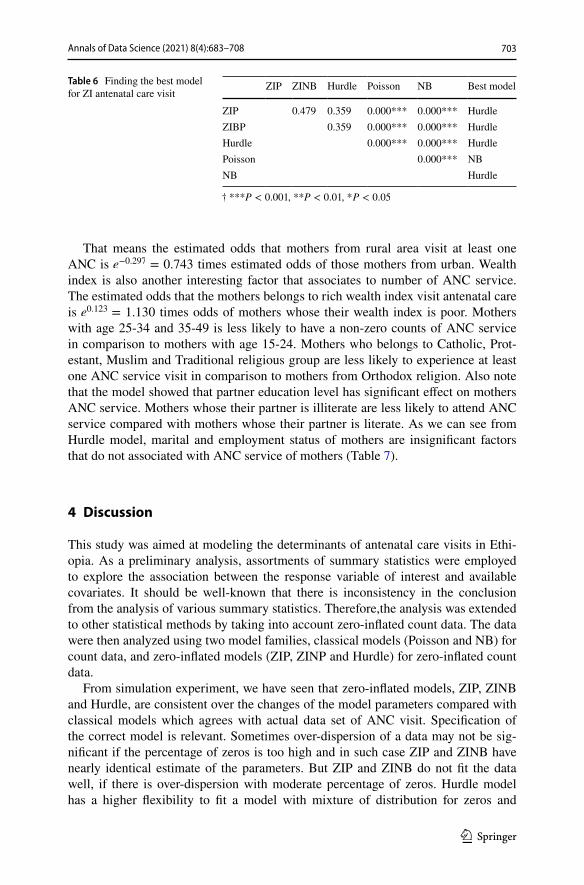
To compare the performance of each models, we may use Voung test as the models are non-nested [28]. Table 6 shows that Hurdle model is the superior one than the rests. Also ZIP and ZINB has almost similar performance and Voung test inferred that these two models does not have significant difference. It might be a reason of statistical insig-nificance of the estimate of dispersion parameter, log (theta).
3.5 Hurdle Model Parameter Estimate
To find the best model, we have considered the Voung test and hurdle regression model was chosen as the most parsimonious model which fits the data better than the other possible candidate models. The hurdle model suggested that educated pregnant mothers have a higher probability of visiting ANC service and a higher

700 Annals of Data Science (2021) 8(4):683–708
1 3
Tabl
e 4
Esti
mat
ion
of c
oeffi
cien
ts fo
r pos
itive
cou
nts u
sing
diff
eren
t cou
nt d
ata
mod
els f
or n
umbe
r of A
NC
vis
it
Mod
els
ZIP
ZIN
BH
urdl
ePo
isso
nN
egat
ive
bino
mia
lC
ovar
iate
s for
pos
itive
cou
nts
Estim
ates
S.E.
Estim
ates
S.E.
Estim
ates
S.E.
Estim
ates
S.E.
Estim
ates
S.E.
Inte
rcep
t1.
269 ∗∗∗
0.03
61.
269 ∗∗∗
0.03
61.
269 ∗∗∗
0.03
60.
793 ∗∗∗
0.03
50.
792 ∗∗∗
0.05
5M
arita
l sta
tus (
Ref =
Mar
ried)
Sing
le0.
085
0.06
40.
085
0.06
40.
085
0.06
4−
0.0
04∗∗∗
0.06
30.
009
0.10
4Ex
pose
r to
med
ia(R
ef =
No)
Yes
0.05
2 ∗∗
0.01
70.
052 ∗∗
0.01
70.
052 ∗∗
0.01
70.
045 ∗∗
0.01
70.
042
0.02
8Em
ploy
men
t sta
tus(
Ref =
No)
Yes
− 0
.002
0.01
8−
0.0
020.
018
− 0
.001
0.01
80.
023
0.01
70.
041
0.02
7A
ge(R
ef =
15−
24)
25−
34
0.07
6 ∗∗∗
0.02
00.
076 ∗∗∗
0.02
00.
077 ∗∗∗
0.02
00.
068 ∗∗∗
0.01
90.
075 ∗
0.03
035−
49
0.08
9 ∗∗∗
0.02
50.
089 ∗∗∗
0.02
50.
090 ∗∗∗
0.02
5−
0.0
010.
023
− 0
.025
0.03
6Re
side
nce(
Ref =
Urb
an)
Rura
l−
0.1
74∗∗∗
0.02
3−
0.1
74∗∗∗
0.02
3−
0.1
75∗∗∗
0.02
3−
0.2
96∗∗∗
0.02
2−
0.2
96∗∗∗
0.03
7W
ealth
inde
x(Re
f = P
oor)
Mid
dle
0.07
0 ∗∗
0.02
60.
070 ∗∗
0.02
60.
072 ∗∗
0.02
60.
285 ∗∗∗
0.02
50.
294 ∗∗∗
0.03
7R
ich
0.12
3 ∗∗∗
0.02
30.
123 ∗∗∗
0.02
30.
123 ∗∗∗
0.02
30.
350 ∗∗∗
0.02
30.
360 ∗∗∗
0.03
5Pa
rtner
edu
catio
n(Re
f = N
o ed
ucat
ion)
Prim
ary
0.06
9 ∗∗
0.02
10.
069 ∗∗
0.02
10.
069 ∗∗
0.02
10.
236 ∗∗∗
0.02
00.
238 ∗∗∗
0.03
0Se
cond
ary
0.11
1 ∗∗∗
0.02
90.
111 ∗∗∗
0.02
90.
110 ∗∗∗
0.02
90.
284 ∗∗∗
0.02
80.
288 ∗∗∗
0.04
5H
ighe
r0.
142 ∗∗∗
0.03
40.
142 ∗∗∗
0.03
40.
141 ∗∗∗
0.03
40.
292 ∗∗∗
0.03
30.
288 ∗∗∗
0.05
5Re
ligio
n(Re
f = O
rthod
ox)
Cat
holic
− 0
.172
0.10
3−
0.1
720.
103
− 0
.173
0.10
4−
0.4
51∗∗∗
0.09
9−
0.5
21∗∗∗
0.15
1pr
otes
tant
− 0
.110∗∗∗
0.02
3−
0.1
10∗∗∗
0.02
3−
0.1
09∗∗∗
0.02
3−
0.2
73∗∗∗
0.02
2−
0.2
92∗∗∗
0.03
5M
uslim
− 0
.096∗∗∗
0.01
8−
0.0
96∗∗∗
0.01
8−
0.0
96∗∗∗
0.01
8−
0.2
26∗∗∗
0.01
8−
0.2
45∗∗∗
0.02
8Tr
aditi
onal
− 0
.215
0.16
6−
0.2
150.
166
− 0
.214
0.16
5−
1.0
38∗∗∗
0.15
0−
1.0
79∗∗∗
0.17
9
701
1 3
Annals of Data Science (2021) 8(4):683–708
*** P
<0.001 , *
* P<0.01 , *
P<0.05 , S
.E. =
Sta
ndar
d er
ror,
Ref =
Ref
eren
ce g
roup
Tabl
e 4
(con
tinue
d)
Mod
els
ZIP
ZIN
BH
urdl
ePo
isso
nN
egat
ive
bino
mia
lC
ovar
iate
s for
pos
itive
cou
nts
Estim
ates
S.E.
Estim
ates
S.E.
Estim
ates
S.E.
Estim
ates
S.E.
Estim
ates
S.E.
Educ
atio
n le
vel(R
ef =
No
educ
atio
n)Pr
imar
y0.
090 ∗∗∗
0.02
10.
090 ∗∗∗
0.02
10.
090 ∗∗∗
0.02
10.
266 ∗∗∗
0.02
00.
278 ∗∗∗
0.03
2Se
cond
ary
0.13
0 ∗∗∗
0.03
10.
130 ∗∗∗
0.03
10.
130 ∗∗∗
0.03
10.
290 ∗∗∗
0.03
10.
303 ∗∗∗
0.05
2H
ighe
r0.
150 ∗∗∗
0.04
00.
150 ∗∗∗
0.04
00.
149 ∗∗∗
0.04
00.
314 ∗∗∗
0.03
90.
304 ∗∗∗
0.07
0Lo
g(th
eta)
1.28
0 ∗∗∗
(0.7
91)
AIC
2342
2.60
023
424.
600
2342
5.93
027
637.
720
2606
1.69
0Lo
g lik
elih
ood
− 1
1673
.300
− 1
1673
.300
− 1
1672
.960
− 1
3799
.860
− 1
3010
.850
Num
. obs
6450
6450
6450
6450
6450
BIC
2776
6.38
026
197.
130
Dev
ianc
e14
354
8145
.600

702 Annals of Data Science (2021) 8(4):683–708
1 3
expected number of non-zero visits than uneducated pregnant mothers. The esti-mated odds that the number of ANC visits become non-zero with educated (mothers with higher education level) is e0.149 = 1.160 times the estimated odds for unedu-cated mothers. Place of residence is significantly associated with decreased odds of at least one ANC visits.
Table 5 Estimation of coefficients for zero counts using different count data models for number of ANC visit
***P < 0.001 , **P < 0.01 , * P < 0.05 , S.E. = Standard error, Ref = Reference group
Models ZIP ZINB HurdleCovariates for zero count Categories Estimates S.E. Estimates S.E. Estimates S.E.
Intercept − 1.450∗ ∗ ∗ 0.175 − 1.450∗ ∗ ∗ 0.175 1.836∗ 0.814Marital status(Ref = Mar-
ried)Single 0.398 0.293 0.398 0.293 − 0.398 0.337
Exposer to media(Ref = No)
Yes − 0.045 0.079 − 0.045 0.079 0.084 0.096Employment status(Ref
= No)Yes − 0.157∗ 0.074 − 0.157∗ 0.074 0.180 0.098
Age(Ref = 15− 24)25− 34 − 0.016 0.082 − 0.016∗ ∗ ∗ 0.082 0.056 0.09235− 49 0.302∗ ∗ 0.092 0.302∗ ∗ 0.092 − 0.297∗ 0.118
Residence(Ref = Urban)Rural 1.105∗ ∗ ∗ 0.141 1.105∗ ∗ ∗ 0.141 − 1.394∗ ∗ 0.493
Wealth index(Poor)Middle − 0.564∗ ∗ ∗ 0.090 − 0.564∗ ∗ ∗ 0.090 0.653∗ ∗ ∗ 0.184Rich − 0.712∗ ∗ ∗ 0.092 − 0.712∗ ∗ ∗ 0.092 0.854∗ ∗ ∗ 0.240
Partner education(Ref = No education)
Primary − 0.513∗ ∗ ∗ 0.074 − 0.513∗ ∗ ∗ 0.074 0.592∗ ∗ ∗ 0.148Secondary − 0.751∗ ∗ ∗ 0.145 − 0.751∗ ∗ ∗ 0.145 0.888∗ ∗ ∗ 0.268Higher − 0.314 0.183 − 0.314 0.183 0.392 0.219
Religion(Ref = Orthodox)Catholic 1.416∗ ∗ ∗ 0.363 1.416∗ ∗ ∗ 0.363 − 1.669∗ ∗ 0.575Protestant 0.876∗ ∗ ∗ 0.096 0.876∗ ∗ ∗ 0.096 − 1.025∗ ∗ ∗ 0.261Muslim 0.642∗ ∗ ∗ 0.076 0.642∗ ∗ ∗ 0.076 − 0.759∗ ∗ ∗ 0.199Traditional 1.760∗ ∗ ∗ 0.327 1.760∗ ∗ ∗ 0.327 − 1.967∗ ∗ ∗ 0.462
Education level(Ref = No education)
Primary − 0.722∗ ∗ ∗ 0.086 − 0.722∗ ∗ ∗ 0.086 0.856∗ ∗ ∗ 0.247Secondary − 1.048∗ ∗ ∗ 0.204 − 1.048∗ ∗ ∗ 0.204 1.281∗ ∗ 0.458Higher − 2.384∗ ∗ ∗ 0.622 − 2.384∗ ∗ ∗ 0.622 2.949∗ 1.334
Log(theta) 6.542 5.234 − 3.369∗ ∗ ∗ 0.444
703
1 3
Annals of Data Science (2021) 8(4):683–708
That means the estimated odds that mothers from rural area visit at least one ANC is e−0.297 = 0.743 times estimated odds of those mothers from urban. Wealth index is also another interesting factor that associates to number of ANC service. The estimated odds that the mothers belongs to rich wealth index visit antenatal care is e0.123 = 1.130 times odds of mothers whose their wealth index is poor. Mothers with age 25-34 and 35-49 is less likely to have a non-zero counts of ANC service in comparison to mothers with age 15-24. Mothers who belongs to Catholic, Prot-estant, Muslim and Traditional religious group are less likely to experience at least one ANC service visit in comparison to mothers from Orthodox religion. Also note that the model showed that partner education level has significant effect on mothers ANC service. Mothers whose their partner is illiterate are less likely to attend ANC service compared with mothers whose their partner is literate. As we can see from Hurdle model, marital and employment status of mothers are insignificant factors that do not associated with ANC service of mothers (Table 7).
4 Discussion
This study was aimed at modeling the determinants of antenatal care visits in Ethi-opia. As a preliminary analysis, assortments of summary statistics were employed to explore the association between the response variable of interest and available covariates. It should be well-known that there is inconsistency in the conclusion from the analysis of various summary statistics. Therefore,the analysis was extended to other statistical methods by taking into account zero-inflated count data. The data were then analyzed using two model families, classical models (Poisson and NB) for count data, and zero-inflated models (ZIP, ZINP and Hurdle) for zero-inflated count data.
From simulation experiment, we have seen that zero-inflated models, ZIP, ZINB and Hurdle, are consistent over the changes of the model parameters compared with classical models which agrees with actual data set of ANC visit. Specification of the correct model is relevant. Sometimes over-dispersion of a data may not be sig-nificant if the percentage of zeros is too high and in such case ZIP and ZINB have nearly identical estimate of the parameters. But ZIP and ZINB do not fit the data well, if there is over-dispersion with moderate percentage of zeros. Hurdle model has a higher flexibility to fit a model with mixture of distribution for zeros and
Table 6 Finding the best model for ZI antenatal care visit
† ***P < 0.001 , **P < 0.01 , * P < 0.05
ZIP ZINB Hurdle Poisson NB Best model
ZIP 0.479 0.359 0.000*** 0.000*** HurdleZIBP 0.359 0.000*** 0.000*** HurdleHurdle 0.000*** 0.000*** HurdlePoisson 0.000*** NBNB Hurdle

704 Annals of Data Science (2021) 8(4):683–708
1 3
Table 7 Estimate of parameters of Hurdle model for antenatal care visit
Estimate S.E. z value Pr(> |z|)
Count model coefficients (truncated negbin with log link)Intercept 1.269 0.036 34.545 < 2e-16 ∗∗∗
Residence (Ref = Urban)Rural − 0.175 0.023 − 7.542 4.63e-14 ∗∗∗
Marital status (Ref = Married)Single 0.085 0.064 1.324 0.185Exposer to media (Ref = No)Yes 0.052 0.017 2.900 0.003 ∗∗
Employment status (Ref = No)Yes − 0.001 0.018 − 0.090 0.927Age (Ref = 15− 24)25− 34 0.077 0.020 3.776 0.000 ∗∗∗
35− 49 0.090 0.025 3.604 0.000 ∗∗∗
Wealth index (Ref = Poor)Middle 0.072 0.026 2.731 0.006 ∗∗
Rich 0.123 0.023 5.191 2.10e-07 ∗∗∗
Partner education (Ref = No education)Primary 0.069 0.021 3.209 0.001 ∗∗
Secondary 0.110 0.029 3.790 0.000 ∗∗∗
Higher 0.141 0.034 4.113 3.90e-05 ∗∗∗
Religion (Ref = Orthodox)Catholic − 0.173 0.104 − 1.669 0.095protestant − 0.109 0.023 − 4.647 3.37e-06 ∗∗∗
Muslim − 0.096 0.018 − 5.157 2.51e-07 ∗∗∗
Traditional − 0.214 0.165 − 1.296 0.194Education level (Ref = No education)Primary 0.091 0.021 4.212 2.53e-05 ∗∗∗
Secondary 0.130 0.031 4.096 4.21e-05 ∗∗∗
Higher 0.149 0.040 3.712 0.000 ∗∗∗
Log(theta) 1.280 0.791 6.670 0.000 ∗∗∗
Zero hurdle model coefficient (censored negative binomial with log link)Intercept 1.836 0.814 2.254 0.024 ∗
Residence (Ref = Urban)Rural − 1.394 0.493 − 2.825 0.004 ∗∗
Marital status (Ref = Married)Single − 0.398 0.337 − 1.181 0.237Exposer to media (Ref = No)Yes 0.084 0.096 0.879 0.379Employment status (Ref = No)Yes 0.180 0.098 1.826 0.067Age (Ref = 15− 24)25− 34 0.056 0.092 0.609 0.542

705
1 3
Annals of Data Science (2021) 8(4):683–708
positive counts. And it performs in a competitive way with ZIP and ZINB. Based on the Voung test, the Hurdle model with negative binomial distribution for positive counts and logit link for the zero counts is the best model that fitted ZI data very well which agrees with study conducted by Afolabi et al. [29].
Number of ANC service of a mother was a good candidate to apply zero-inflated count data models. From simulation study, we have found that the ZI models have better performance than the Poisson and Negative Binomial models in terms of AIC statistic. Although ANC shows increasing trend over time in Ethiopia, still it is low compared to developed countries. Finding from this study revealed women educa-tion was significant predictor of ANC visit in which educated pregnant mothers have a higher odds of visiting ANC service and a higher expected number of non-zero visits than uneducated pregnant mothers. This finding agrees with study con-ducted by Nisar and White [30]. Place of residence is significantly associated with decreased odds of ANC visits for rural women. That means women in urban areas were more likely to visit ANC than rural women.
This finding consistently agrees with study conducted by Kwast and Liff [31].This is because, health facilities are more accessible in urban than rural areas. Findings from this study showed that age was a significant predictor of ANC visit in which older women visited ANC more than younger ones. This finding agrees with study carried out by Dairo and Owoyokun [32]. In line with a similar study by Dairo and Owoyokun [32], we found wealth index and religion to be associ-ated with ANC visit such that women in the richest category and with Orthodox
∗∗∗P < 0.001 , ∗∗P < 0.01 , ∗P < 0.05 , S.E. = Standard error, Ref = Reference group
Table 7 (continued)
Estimate S.E. z value Pr(> |z|)
35−49 − 0.297 0.118 − 2.515 0.011 ∗
Wealth index (Ref = Poor)Middle 0.653 0.184 3.540 0.000 ∗∗∗
Rich 0.854 0.240 3.545 0.000 ∗∗∗
Partner education (Ref = No education)Primary 0.592 0.148 3.980 6.89e-05 ∗∗∗
Secondary 0.888 0.268 3.316 0.000 ∗∗∗
Higher 0.392 0.219 1.791 0.073Religion (Ref = Orthodox)Catholic − 1.669 0.575 − 2.900 0.003 ∗∗
Protestant − 1.025 0.261 − 3.918 8.93e-05 ∗∗∗
Muslim − 0.759 0.199 − 3.813 0.000 ∗∗∗
Traditional − 1.967 0.462 − 4.250 2.14e-05 ∗∗∗
Education level (Ref = No education)Primary 0.856 0.247 3.466 0.000 ∗∗∗
Secondary 1.281 0.458 2.796 0.005 ∗∗
Higher 2.949 1.334 2.210 0.027 ∗
Log(theta) − 3.369 0.4442 − 12.831 0.000 ∗∗∗
706 Annals of Data Science (2021) 8(4):683–708
1 3
religion were the highest ANC visitors. In this study, It might be interesting to notice that marital status, exposure to media and employment status are not a sig-nificant covariates to determine the number of ANC service utilization.
5 Conclusions
In conclusion, the ANC service utilization rate in Ethiopia was lower than the national figures available to date. It was worth nothing that majority of the moth-ers who attend ANC did not receive adequate number of visits recommended by the World Health Organization. Furthermore, maternal education, partner edu-cation level, age of mothers, religion of mothers and wealth index were major predictors of ANC service utilization. Therefore, efforts to bring about changes in these major predictors at individual and community level through behavio-ral change communication are recommended. In this study, through simulation experiment, it was found that ZIP, ZINB and Hurdle models were better fitted the data than Poisson and negative binomial. Voung test shows that Hurdle model was better fitted the data which is characterized by excess zeros and high vari-ability in the non-zero outcome than any other ZI models and therefore it was selected as the best parsimonious model.
Acknowledgements We acknowledge the Ethiopian central statistical agency for providing me the data.
Funding No funding was received for this study.
Availability of data and materials We can provide the dataset that has been used during the current study on reasonable request.
Declarations
Conflict of interest The authors declare that they have no conflict of interest.
Ethical approval This article does’t contain any studies with human participants performed by any of the authors.
Informed consent Not applicable.
Open Access This article is licensed under a Creative Commons Attribution 4.0 International License, which permits use, sharing, adaptation, distribution and reproduction in any medium or format, as long as you give appropriate credit to the original author(s) and the source, provide a link to the Creative Com-mons licence, and indicate if changes were made. The images or other third party material in this article are included in the article’s Creative Commons licence, unless indicated otherwise in a credit line to the material. If material is not included in the article’s Creative Commons licence and your intended use is not permitted by statutory regulation or exceeds the permitted use, you will need to obtain permission directly from the copyright holder. To view a copy of this licence, visit http:// creat iveco mmons. org/ licen ses/ by/4. 0/.

707
1 3
Annals of Data Science (2021) 8(4):683–708
References
1. WHO, UNICEF, and UNFPA (2003) Maternal Mortality in 2000: Estimates Developed by WHO, UNICEF, and UNFPA. Geneva
2. WHO, Unicef and UNFPA (2012) Maternal Mortality in 2008: Estimates Developed by WHO and UNICEF. UNFPA, Department of Reproductive Health and Research, World Health Organization, Geneva
3. WHO (2014) The World Health Report: Make Every Mother and Child Count. World Health Organ-ization, Geneva
4. Fatema Nishat (2010) Importance of antenatal care. MO, CMH, Chittagong 5. Ministry of Health (2006) AIDS in Ethiopia. Sixth Report, Addis- Ababa, Ethiopia 6. Amin R, Chowdhury SA, Kamal GM, Chowdhury J (1989) Community health services and health
care utilisation in rural Bangladesh. Soc Sci Med 29(12):1343–1349 7. Bloom S, Lippeveld T, Wypij D (1999) Does antenatal care make a difference to safe delivery? A
study in urban Uttar Pradesh, India. Health Policy Plan 14(1):38–48 8. Bhattia JC, Cleland J (1995) Determinant of maternal care in a region of south India. Health Transit
Rev 5:127–142 9. Nuraini E, Parker E (2005) Improving knowledge of antenatal care (ANC) among pregnant women:
a field trial in central Java, Indonesia. Asia Pac J Public Health 17(1):3–8 10. WHO and UNICEF (2003) Antenatal Care in Developing Countries: Promises, Achievements and
Missed Opportunities: An Analysis of Trends, Levels, and Differentials: 1990–2001. WHO and UNICEF, Geneva, New York
11. Chakraborty N, Islam MA, Chowdhury RI, Bari W (2002) Utilisation of postnatal care in Bangla-desh: evidence from a longitudinal study. Health Soc Care Commun 10(6):492–502
12. Villar J et al (2001) WHO antenatal care randomized trial for the evaluation of a new model of rou-tine antenatal care. The Lancet 357(9268):1551–1564
13. Lambert D (1992) Zero-inflated poisson regression, with an application to defects in manufacturing. Technometrics 34(1):1–14
14. Greene WH (1994) Accounting for excess zeros and sample selection in poisson and negative bino-mial regression models
15. Consul PC (1989) Generalized poisson distributions: properties and applications. Marcel Dekker Inc, New York
16. Consul PC, Famoye Felix (1992) Generalized poisson regression model. Commun Stat Theory Methods 21(1):89109
17. Famoye Felix, Singh Karan P (2006) Zero-inflated generalized poisson regression model with an application to domestic violence data. J Data Sci 4(1):117–130
18. Mwalili SM, Lesaffre E, Declerck D (2008) The zero-inflated negative binomial regression model with correction for misclassification: an example in caries research. Stat Methods Med Res 17(2):123–139
19. Cragg JG (1971) Some statistical models for limited dependent variables with application to the demand for durable goods. Econometrica 829–844
20. Paternoster R, Brame R, Bachman R, Sherman L (1997) Do fair procedures matter? The effect of procedural justice on spouse assault. Law Soc Rev 31:163–204
21. Ridout MS, Demetrio CGB, Hinde JP (1998) Models for counts data with many zeroes. In: Proceed-ings of the xixth international biometric conference, Cape Town, Invited Papers, pp 179-192. Paper retrieved March 13, 2006 from http:// www. kent. ac. uk/ ims/ perso nal/ msr/ zip1. html
22. Lord D (2006) Modeling motor vehicle crashes using Poisson-gamma models: examining the effects of low sample mean values and small sample size on the estimation of the fixed dispersion param-eter. Accid Anal Prev 38(4):751–766
23. Mullahy J (1986) Specification and testing of some modified count data models. J Econ 33:341–365 24. Lambert D (1992) Zero-inflated Poisson regression, with an application to defects in manufacturing.
Technimetrics 34:1–14 25. Washington SP, Karlaftis M, Mannering FL (2003) Statistical and econometric methods for trans-
portation data analysis. Chapman and Hall, Boca Raton 26. Hilbe Joseph M (2011) Negative binomial regression. Cambridge University Press, Cambridge 27. Cameron AC, Trivedi PK (1998) Regression analysis of count data. Cambridge University Press,
Cambridge

708 Annals of Data Science (2021) 8(4):683–708
1 3
28. Vuong QH (1989) Likelihood ratio tests for model selection and non-nested hypotheses. Econ J Econ Soc 57:307–333
29. Afolabi OBYRF, Agbaje AS (2018) Modelling Excess Zeros in Count Data with Application to Antenatal Care Utilisation. International Journal of Statistics and Probability 7(3)
30. Kwast BE, Liff JM (1988) Factors associated with maternal mortality in Addis Ababa, Ethiopia. Int J Epidemioll 17(1):115–121
31. Dairo MD, Owoyokun KE (2010) Factors affecting the utilisationof antenatal care services in Ibadan, Nigeria. Benin J Postgrad Med 12(1):3–13. https:// doi. org/ 10. 4314/ bjpm. v12i1. 63387
32. Nisar N, White F (2003) Factors affecting utilization of antenatal care among reproductive age group women (15–49 years) in an urban squatter settlement of Karachi. J Pak Med Assoc 53(2):47–53
Publisher’s Note Springer Nature remains neutral with regard to jurisdictional claims in published maps and institutional affiliations.
Authors and Affiliations
Daniel Biftu Bekalo1 · Dufera Tejjeba Kebede1
* Daniel Biftu Bekalo [email protected]
1 Department of Statistics, Haramaya University, Dire Dawa, Ethiopia


![BAYESIAN INFERENCE FOR ZERO-INFLATED …scientificadvances.co.in/admin/img_data/562/images/[2] JSATA... · Keywords and phrases: Bayes, zero-inflated Poisson, regression analysis,](https://img.dokumen.tips/doc/110x75/5a78eb487f8b9ae6228ef3c1/bayesian-inference-for-zero-inflated-2-jsatakeywords-and-phrases-bayes.jpg)