Embed Size (px)
Citation preview
THE YOUNG& THE BRANDLESSCONNECTING MILLLENNIAL BRAND RECOGNITION TO DIGITAL DATAA BUSINESS INTELLIGENCE REPORT FOR MEDIA BRANDS
JUNE 2017
ANATOMY MEDIA, INC.56 WEST 45TH STREET, SUITE 1602
NEW YORK, NY 10036(212) 944-5510
ANATOMYMEDIA.COM
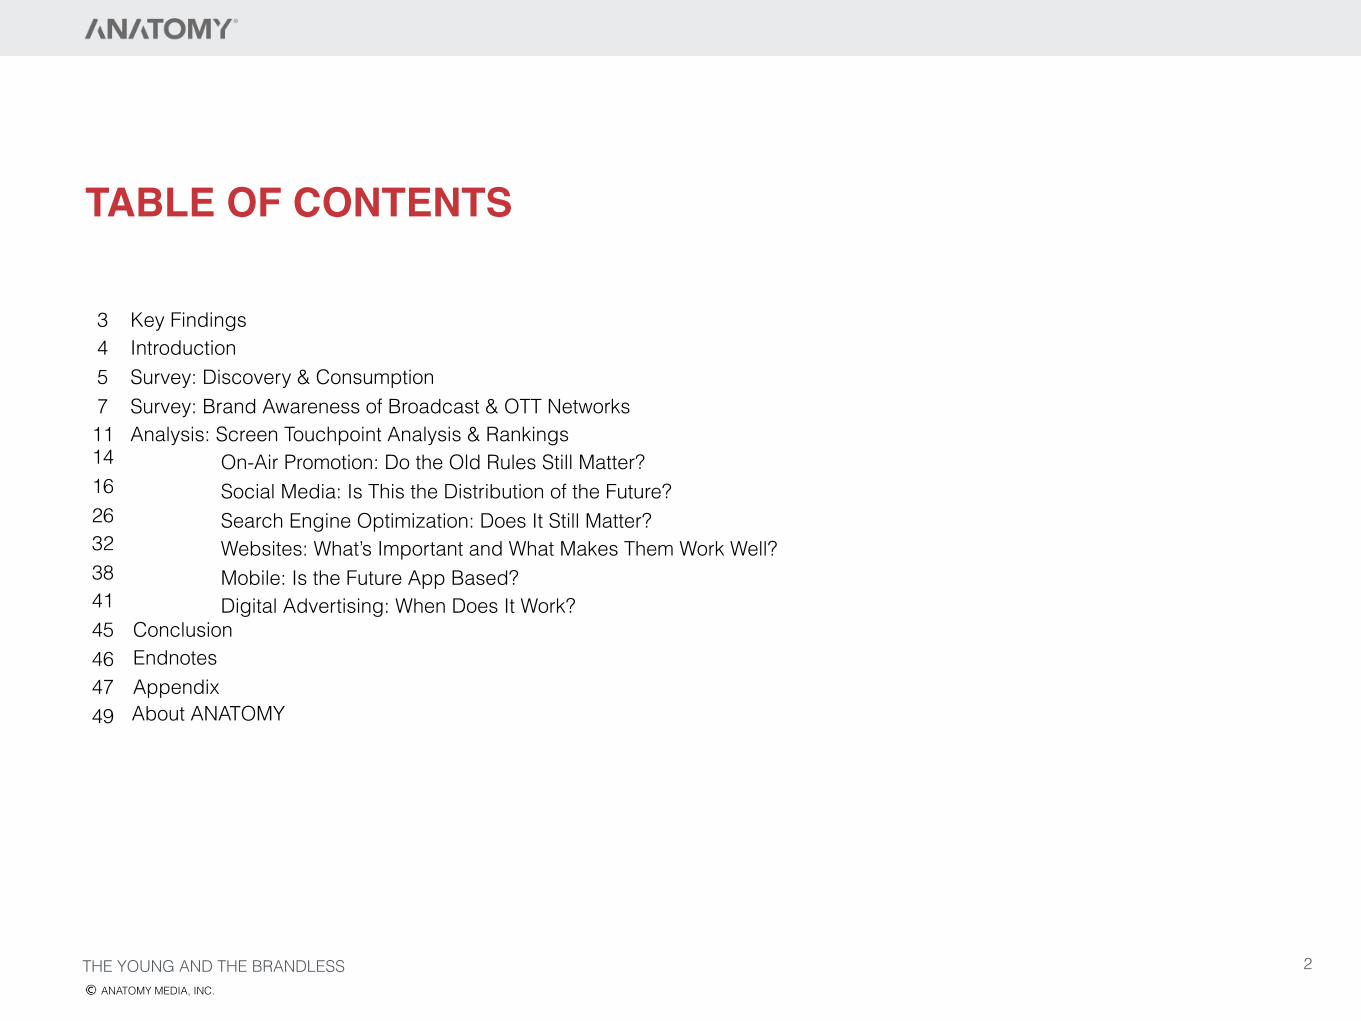
Key Findings Introduction Survey: Discovery & Consumption Survey: Brand Awareness of Broadcast & OTT Networks Analysis: Screen Touchpoint Analysis & Rankings
TABLE OF CONTENTS
2THE YOUNG AND THE BRANDLESSANATOMY MEDIA, INC.
On-Air Promotion: Do the Old Rules Still Matter? Social Media: Is This the Distribution of the Future? Search Engine Optimization: Does It Still Matter? Websites: What’s Important and What Makes Them Work Well? Mobile: Is the Future App Based? Digital Advertising: When Does It Work?
About ANATOMY
Conclusion Endnotes Appendix
3 4 5 7 1114 16 26 32 38 4145 46 47 49
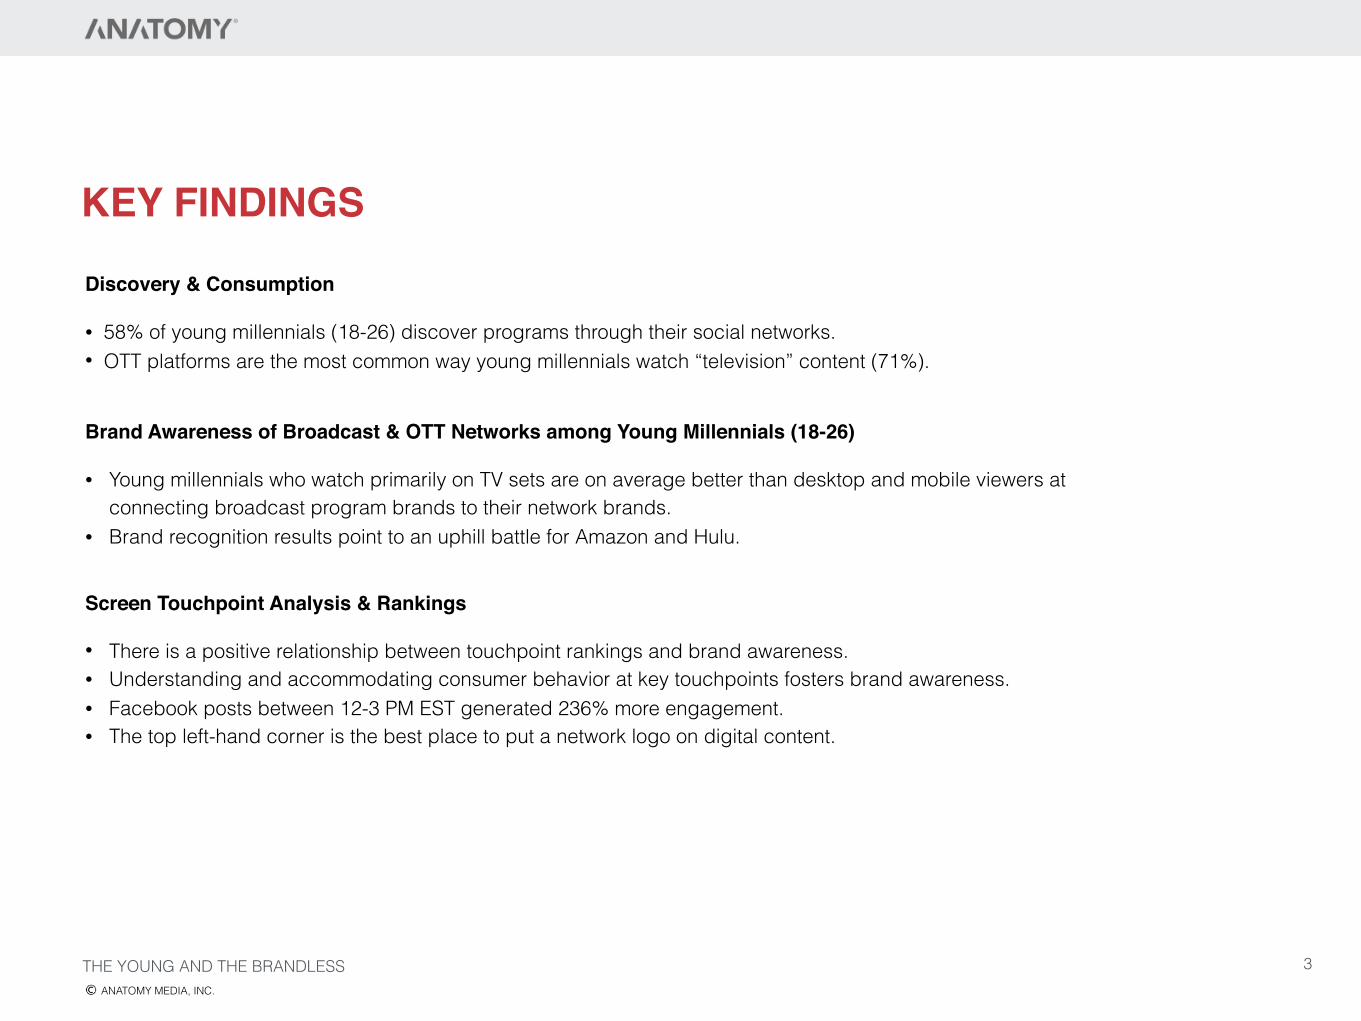
KEY FINDINGS
Discovery & Consumption
• 58% of young millennials (18-26) discover programs through their social networks. • OTT platforms are the most common way young millennials watch “television” content (71%).
Brand Awareness of Broadcast & OTT Networks among Young Millennials (18-26)
• Young millennials who watch primarily on TV sets are on average better than desktop and mobile viewers at connecting broadcast program brands to their network brands.
• Brand recognition results point to an uphill battle for Amazon and Hulu.
Screen Touchpoint Analysis & Rankings
• There is a positive relationship between touchpoint rankings and brand awareness. • Understanding and accommodating consumer behavior at key touchpoints fosters brand awareness. • Facebook posts between 12-3 PM EST generated 236% more engagement. • The top left-hand corner is the best place to put a network logo on digital content.
THE YOUNG AND THE BRANDLESSANATOMY MEDIA, INC.
3
INTRODUCTIONAcross the entertainment industry networks are endeavoring to put the consumer at the center of their strategy. At ANATOMY we think that’s a good idea, because as far as the young millennial consumer is concerned, they are already at the center of things and entertainment exists on their terms–or it doesn’t exist at all.
We decided to take a look at how these young millennials (18-26) were discovering content, how they were consuming content and how well they recognized (or didn’t recognize) network brands. Following this analysis, we took a look at six key screen-based touchpoints that networks can use to build brand awareness. We brought both a quantitative and qualitative approach to our review.
THE YOUNG AND THE BRANDLESSANATOMY MEDIA, INC.
4
DISCOVERY & CONSUMPTION
Between December 2016 and April 2017, we surveyed 3,100 young millennials between the ages of 18 and 26 to better understand how they discovered content, how they consumed content and how well they were able to identify network brands.1
DISCOVERY & CONSUMPTION
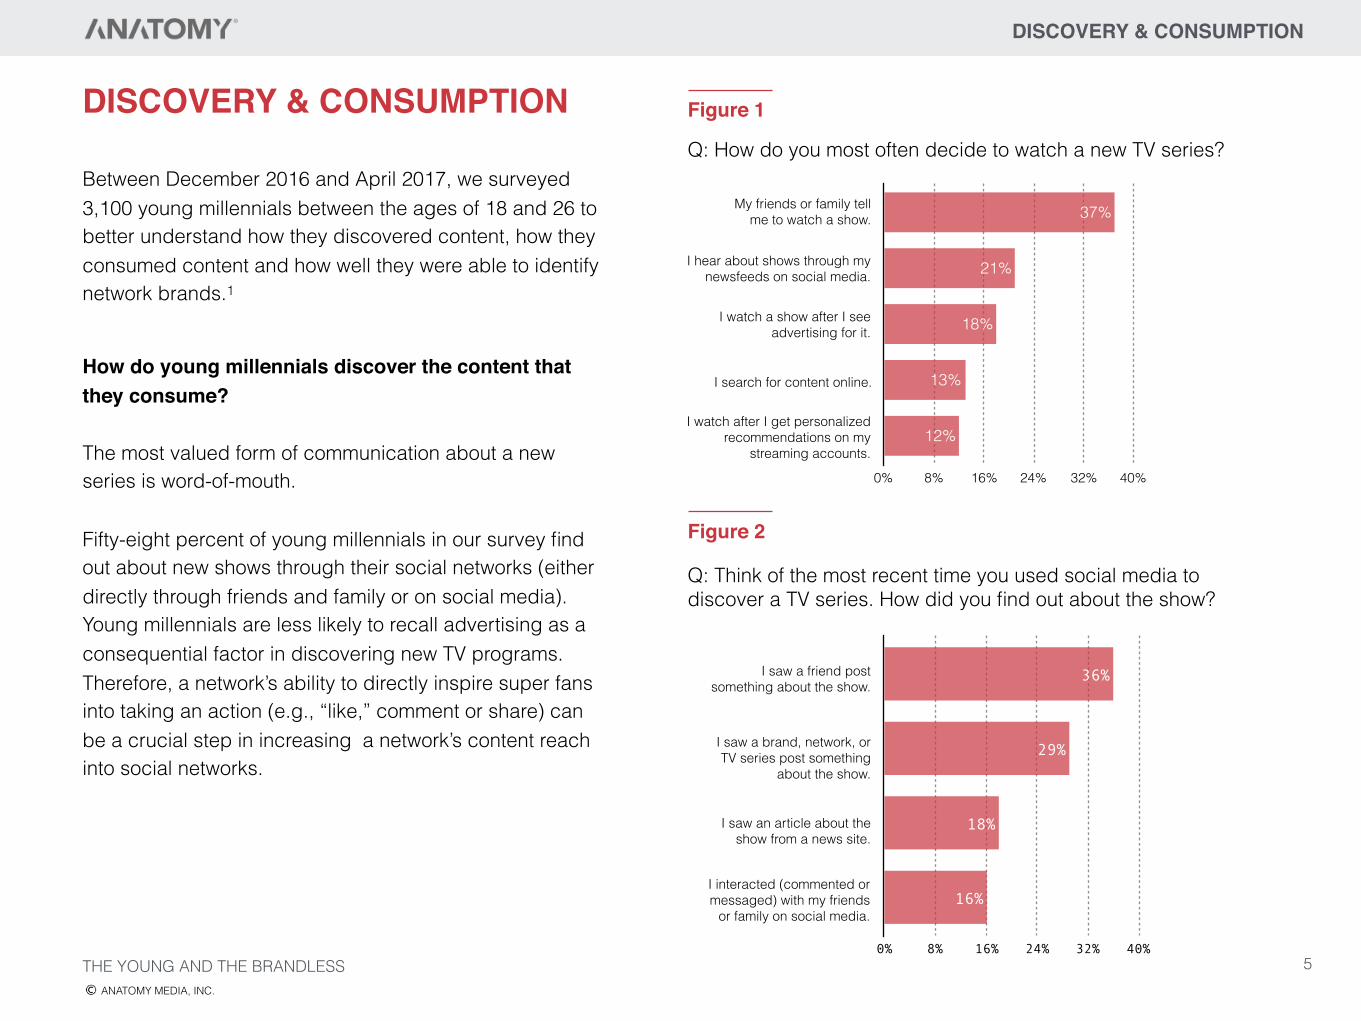
How do young millennials discover the content that they consume?
The most valued form of communication about a new series is word-of-mouth.
Fifty-eight percent of young millennials in our survey find out about new shows through their social networks (either directly through friends and family or on social media). Young millennials are less likely to recall advertising as a consequential factor in discovering new TV programs. Therefore, a network’s ability to directly inspire super fans into taking an action (e.g., “like,” comment or share) can be a crucial step in increasing a network’s content reach into social networks.
0% 8% 16% 24% 32% 40%
12%
13%
18%
21%
37%My friends or family tell me to watch a show.
I hear about shows through my newsfeeds on social media.
I watch a show after I see advertising for it.
I watch after I get personalized recommendations on my
streaming accounts.
I search for content online.
Figure 1
Q: How do you most often decide to watch a new TV series?
0% 8% 16% 24% 32% 40%
16%
18%
29%
36%I saw a friend post something about the show.
I saw a brand, network, or TV series post something
about the show.
I saw an article about the show from a news site.
I interacted (commented or messaged) with my friends
or family on social media.
Figure 2
Q: Think of the most recent time you used social media to discover a TV series. How did you find out about the show?
THE YOUNG AND THE BRANDLESSANATOMY MEDIA, INC.
5
DISCOVERY & CONSUMPTION
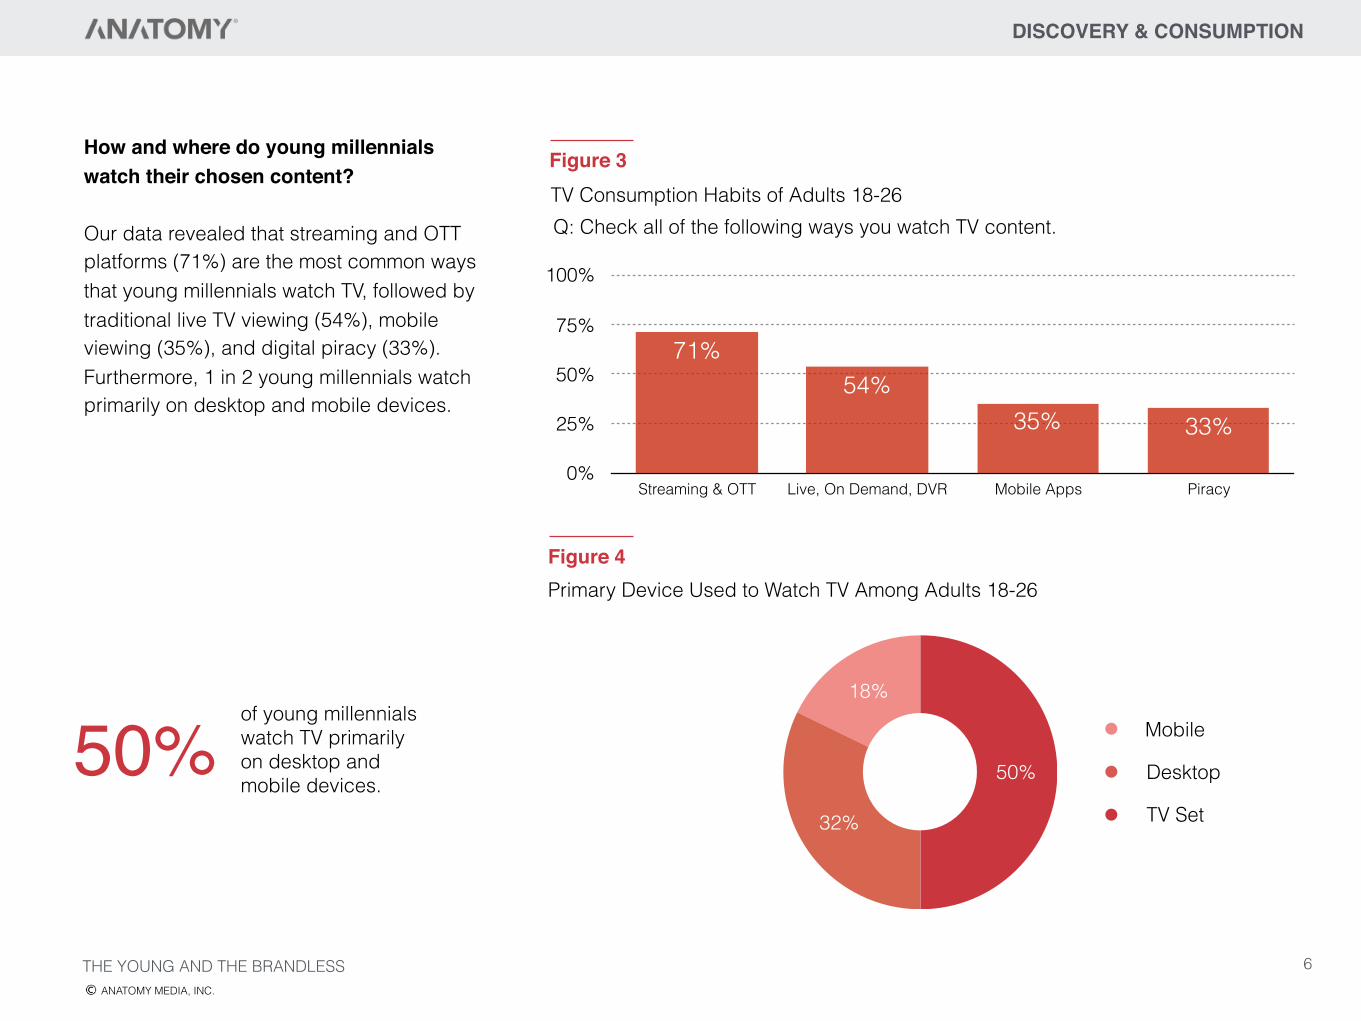
How and where do young millennials watch their chosen content?
Our data revealed that streaming and OTT platforms (71%) are the most common ways that young millennials watch TV, followed by traditional live TV viewing (54%), mobile viewing (35%), and digital piracy (33%). Furthermore, 1 in 2 young millennials watch primarily on desktop and mobile devices.
0%
25%
50%
75%
100%
Streaming & OTT Live, On Demand, DVR Mobile Apps Piracy
33%35%54%
71%
18%
32%
50%
Mobile
Desktop
TV Set
TV Consumption Habits of Adults 18-26Figure 3
Primary Device Used to Watch TV Among Adults 18-26Figure 4
of young millennials watch TV primarily on desktop and mobile devices.
50%
THE YOUNG AND THE BRANDLESSANATOMY MEDIA, INC.
Q: Check all of the following ways you watch TV content.
6
BRAND RECOGNITION
Traditionally, television network brands were important because they created a sufficiently identifiable sense of place for viewers without being so specific as to limit the breadth of viewer appeal that advertisers sought. In linear television, networks were the single location viewers went to find and watch programs, but in a non-linear multiplatform world, awareness of network brands is not essential for viewers to discover and access new content. For young millennials—or any modern viewer for that matter—the access point to a program (e.g., Empire on FOX) is not just the broadcast time and network (e.g., “Sunday at 9 PM on FOX”). The access point to a program is every conceivable place the program exists (e.g., FOXNOW, Netflix, Hulu, Xfinity, On Demand, Sling TV, Google, a free piracy site, etc.).
Do network brands still serve a useful function?
We feel network brands still have an important role to play. Brands balance hits and misses for networks and act as a curatorial short cut and time saving filter for consumers coping with excessive choice.
BRAND AWARENESS OF BROADCAST & OVER THE TOP (OTT) NETWORKS
The complexity of the entertainment landscape, however, means it isn’t as easy to build a network brand as it was in the past. AMC Networks CEO Josh Sapan put it this way: “Shows have become more dominant in people’s minds than channels. People want their show, and they’re accessible more rapidly with interfaces on cable systems and other platforms, so I think the place that houses them becomes essentially at risk.”2
In a non-linear, multiplatform world, network brands are only as relevant as their perceived value to viewers.
According to FX Networks, 455 original scripted series were produced in 2016.3 As a result, building awareness of programming is increasingly challenging for networks. A strong network brand that acts as a curatorial tool for viewers also helps build awareness of new programs and facilitates critical program discovery.
THE YOUNG AND THE BRANDLESSANATOMY MEDIA, INC.
7
BRAND RECOGNITION
31%
NETWORK BRAND RECOGNITION
31%
31%
40%
20%
15%
65%
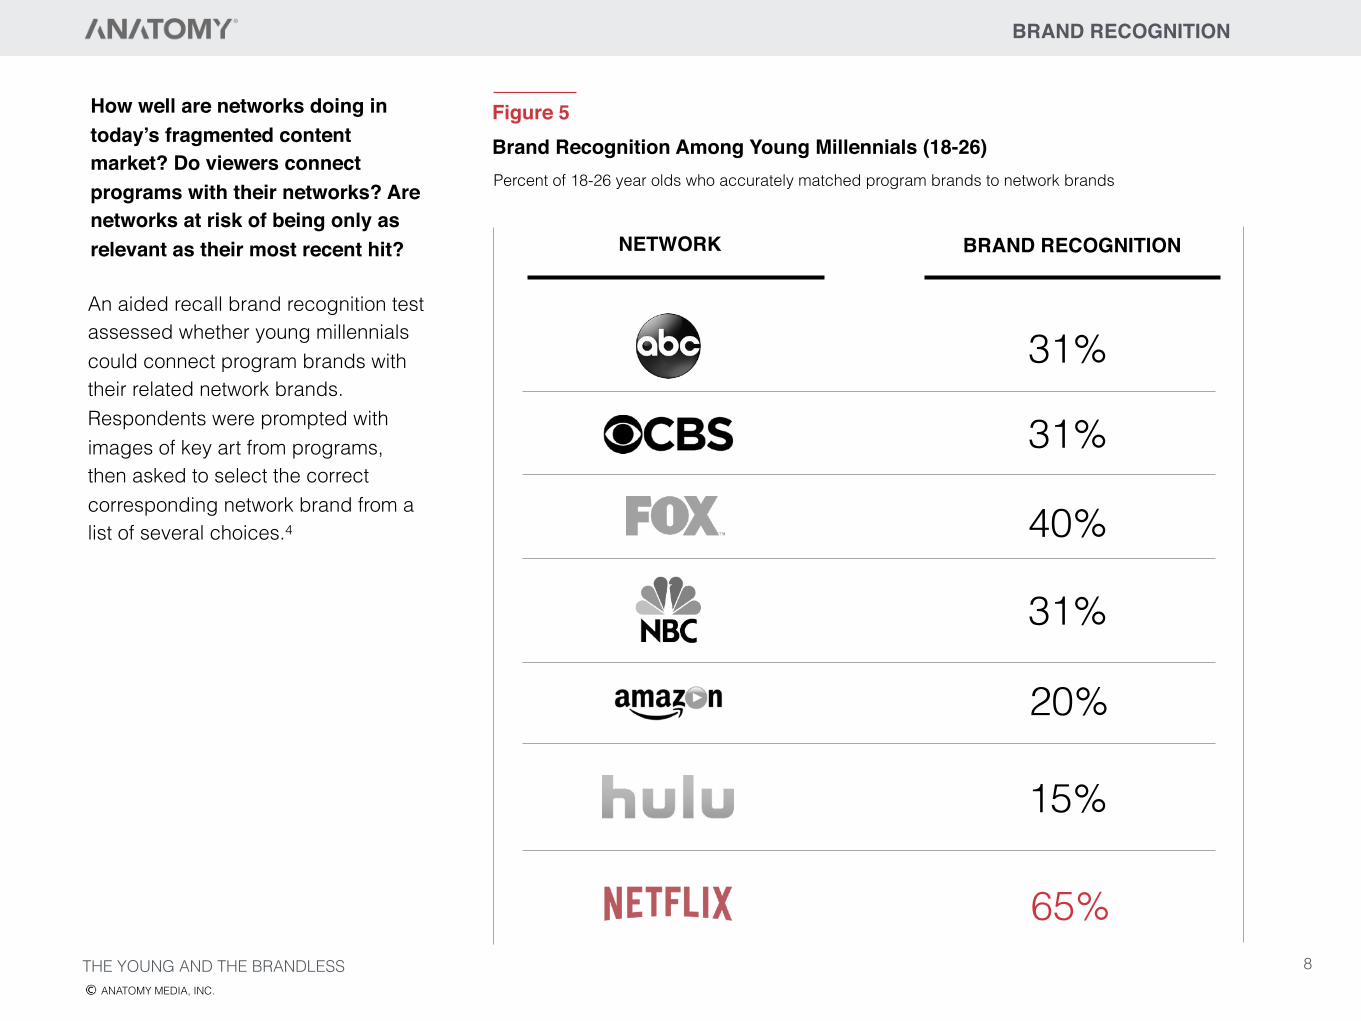
An aided recall brand recognition test assessed whether young millennials could connect program brands with their related network brands. Respondents were prompted with images of key art from programs, then asked to select the correct corresponding network brand from a list of several choices.4
Brand Recognition Among Young Millennials (18-26)Figure 5
Percent of 18-26 year olds who accurately matched program brands to network brands
THE YOUNG AND THE BRANDLESSANATOMY MEDIA, INC.
How well are networks doing in today’s fragmented content market? Do viewers connect programs with their networks? Are networks at risk of being only as relevant as their most recent hit?
8
BRAND RECOGNITION
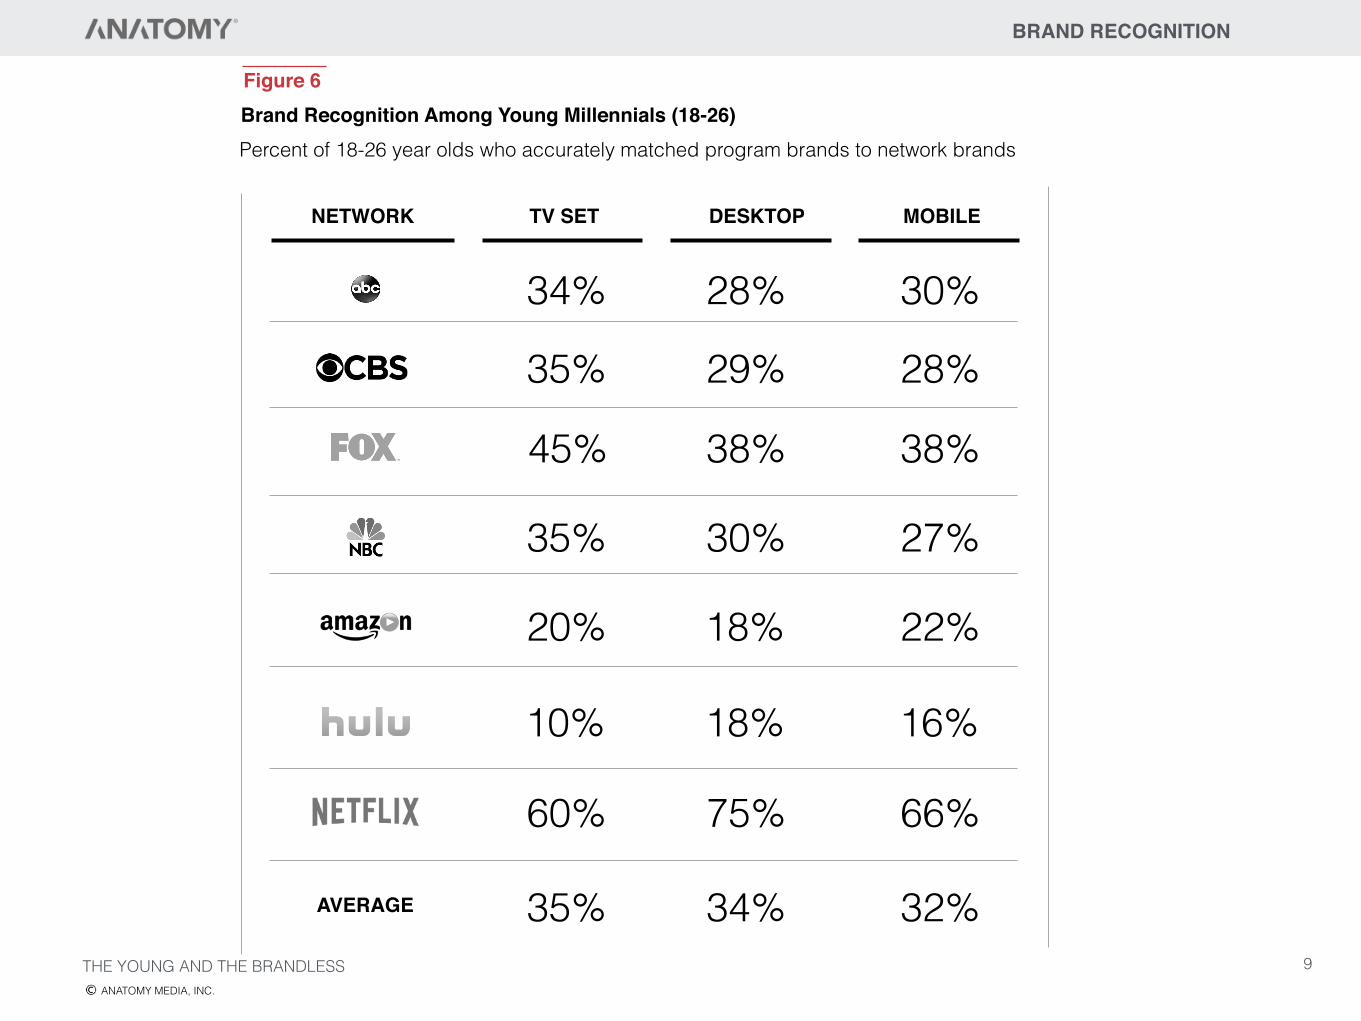
Brand Recognition Among Young Millennials (18-26)Figure 6
Percent of 18-26 year olds who accurately matched program brands to network brands
NETWORK TV SET DESKTOP MOBILE
34% 28% 30%
35% 29% 28%
45% 38% 38%
35% 30% 27%
20% 18% 22%
10% 18% 16%
60% 75% 66%
35% 34% 32%AVERAGE
THE YOUNG AND THE BRANDLESSANATOMY MEDIA, INC.
9
BRAND RECOGNITION
THE YOUNG AND THE BRANDLESSANATOMY MEDIA, INC.
Young millennials who watch primarily on TV sets are on average better than desktop and mobile viewers at connecting broadcast program brands to their network brands. This was not true of services that cater to a digital consumer (i.e., OTT platforms — Amazon, Hulu, Netflix).
This is cause for concern for broadcast networks because 50% of young millennials watch exclusively on desktop or mobile devices. Furthermore, linear viewership is declining year over year, while desktop and mobile viewing is growing year over year. In order to “future proof” a network brand, it is critical for networks to improve their promotion in non-linear digital spaces.
Our brand recognition results point to an uphill battle for Amazon and Hulu.
Not surprisingly, our brand recognition test indicates that young millennials who watch primarily on desktop and mobile platforms are on average better than TV viewers at connecting OTT program brands to their related network brands. However, without the benefit of an on-air touchpoint, OTT services have less room for error in their non-linear digital promotion efforts. Without a strong foundation of brand relevance among young millennials, Amazon and Hulu are going to find it challenging to achieve their ambitions.
10
SCREEN TOUCHPOINT RANKINGS
In our research, we identified and examined what we believe are the six key pillars of content promotion and the factors that contribute to overall brand awareness and recognition. They are:
1. On-Air Promotion 2. Social Media 3. Search-Engine Optimization 4. Website Performance 5. Mobile Site and App Performance 6. Digital Advertisements
These six pillars are vital touchpoints for networks to connect with consumers across screens, be it on a TV, on a smartphone, or on a laptop. Networks know that the entertainment ecosystem is undergoing a fundamental transformation. Too often, however, screen-based consumer touchpoints are analyzed in disconnected silos. In reality, a combination of touchpoints across platforms affect consumers on their path to content.
SCREEN TOUCHPOINT ANALYSIS & RANKINGS
Our analysis leverages the power of small data to identify actionable insights for networks to increase the effectiveness of their promotion across platforms. We conducted a competitive benchmarking assessment that quantifies the promotion efforts of media brands across these six dimensions and ranked each brand on a scale that assesses its performance relative to its industry competitors. Ultimately, our analysis yielded a predictive model that uses data mining to forecast brand recognition of media brands.
THE YOUNG AND THE BRANDLESSANATOMY MEDIA, INC.
11
SCREEN TOUCHPOINT RANKINGS
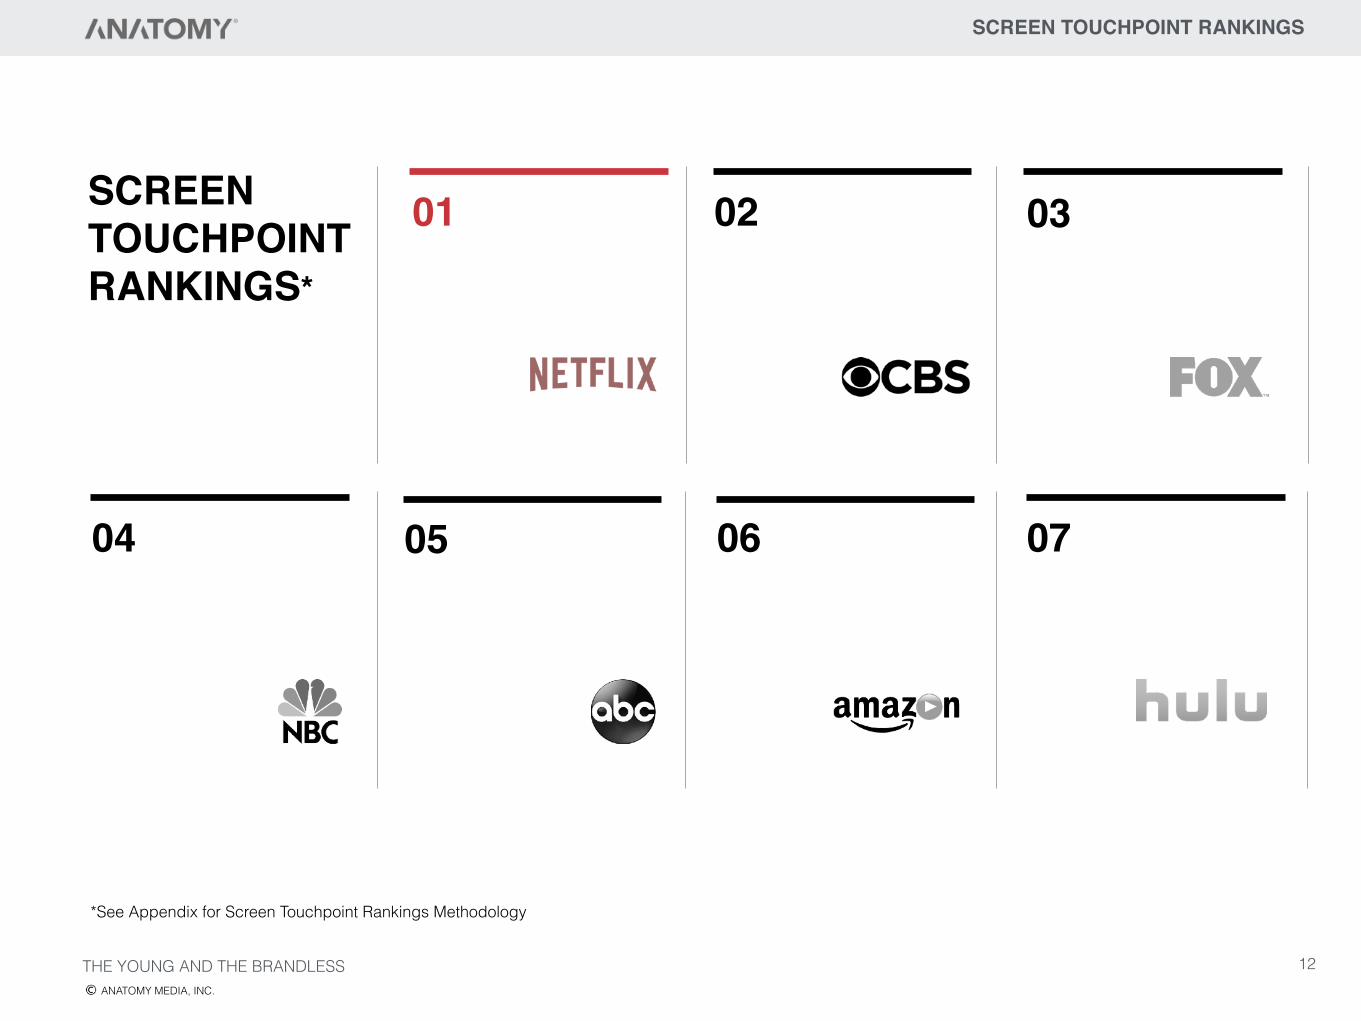
SCREEN TOUCHPOINT RANKINGS*
01 02 03
04 05 06 07
*See Appendix for Screen Touchpoint Rankings Methodology
THE YOUNG AND THE BRANDLESSANATOMY MEDIA, INC.
12
SCREEN TOUCHPOINT RANKINGS
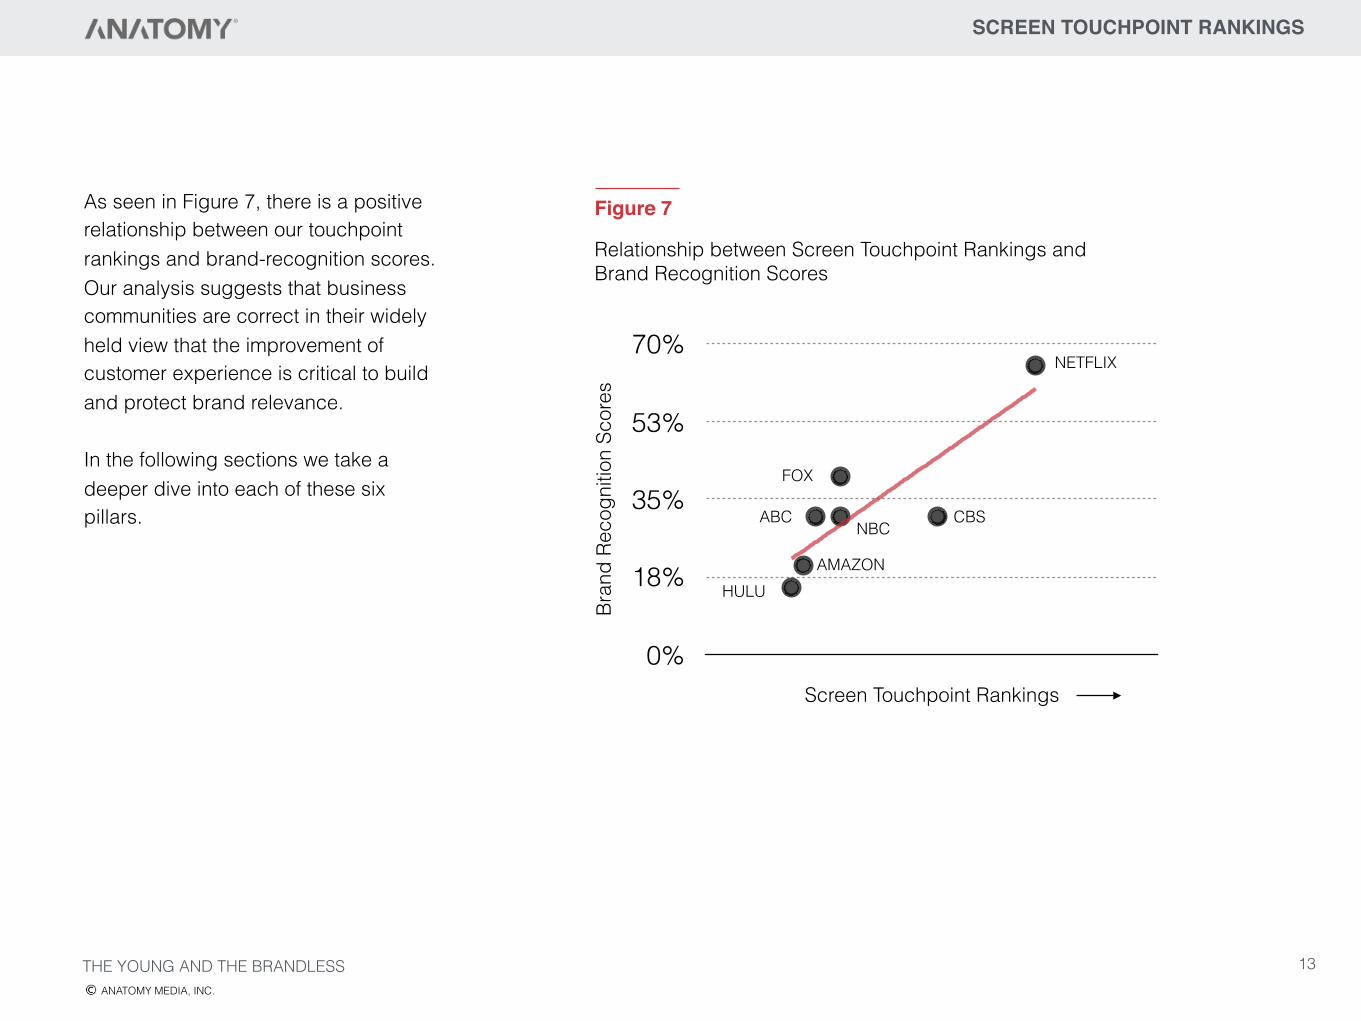
As seen in Figure 7, there is a positive relationship between our touchpoint rankings and brand-recognition scores. Our analysis suggests that business communities are correct in their widely held view that the improvement of customer experience is critical to build and protect brand relevance.
In the following sections we take a deeper dive into each of these six pillars.
Bran
d Re
cogn
ition
Sco
res
0%
18%
35%
53%
70%
Screen Touchpoint Rankings
NETFLIX
ABC CBS
FOX
NBC
AMAZONHULU
Relationship between Screen Touchpoint Rankings and Brand Recognition Scores
Figure 7
THE YOUNG AND THE BRANDLESSANATOMY MEDIA, INC.
13
ON-AIR PROMOTION
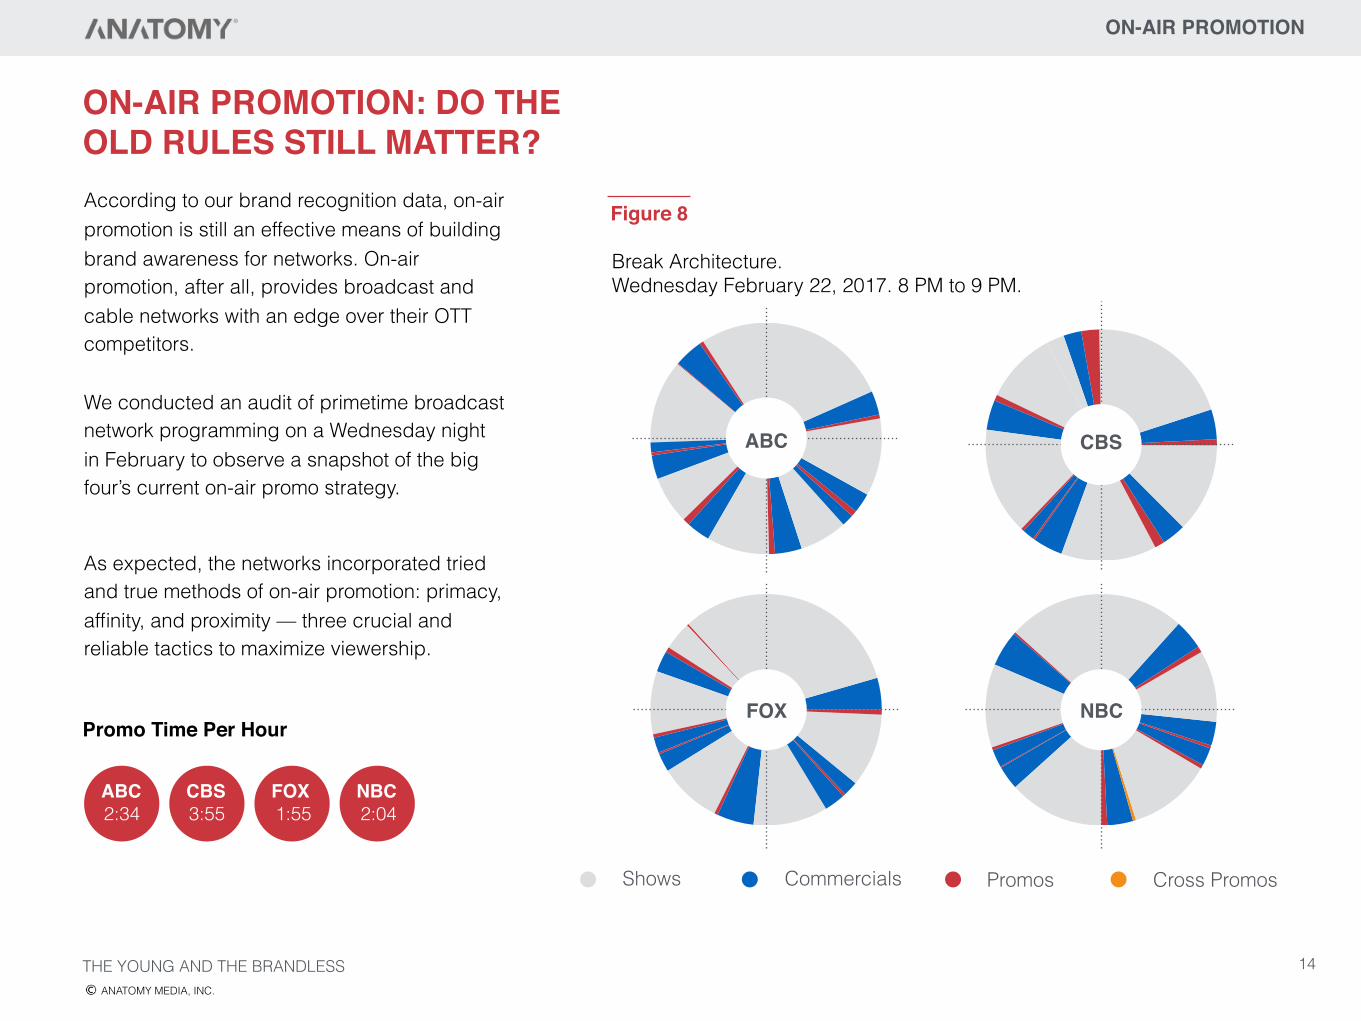
According to our brand recognition data, on-air promotion is still an effective means of building brand awareness for networks. On-air promotion, after all, provides broadcast and cable networks with an edge over their OTT competitors.
We conducted an audit of primetime broadcast network programming on a Wednesday night in February to observe a snapshot of the big four’s current on-air promo strategy.
ON-AIR PROMOTION: DO THE OLD RULES STILL MATTER?
Shows Commercials Promos Cross Promos
Break Architecture. Wednesday February 22, 2017. 8 PM to 9 PM.
Figure 8
Promo Time Per Hour
As expected, the networks incorporated tried and true methods of on-air promotion: primacy, affinity, and proximity — three crucial and reliable tactics to maximize viewership.
NBCFOX
CBSABC
1:55FOX
2:04NBC
2:34 3:55ABC CBS
THE YOUNG AND THE BRANDLESSANATOMY MEDIA, INC.
14
ON-AIR PROMOTION
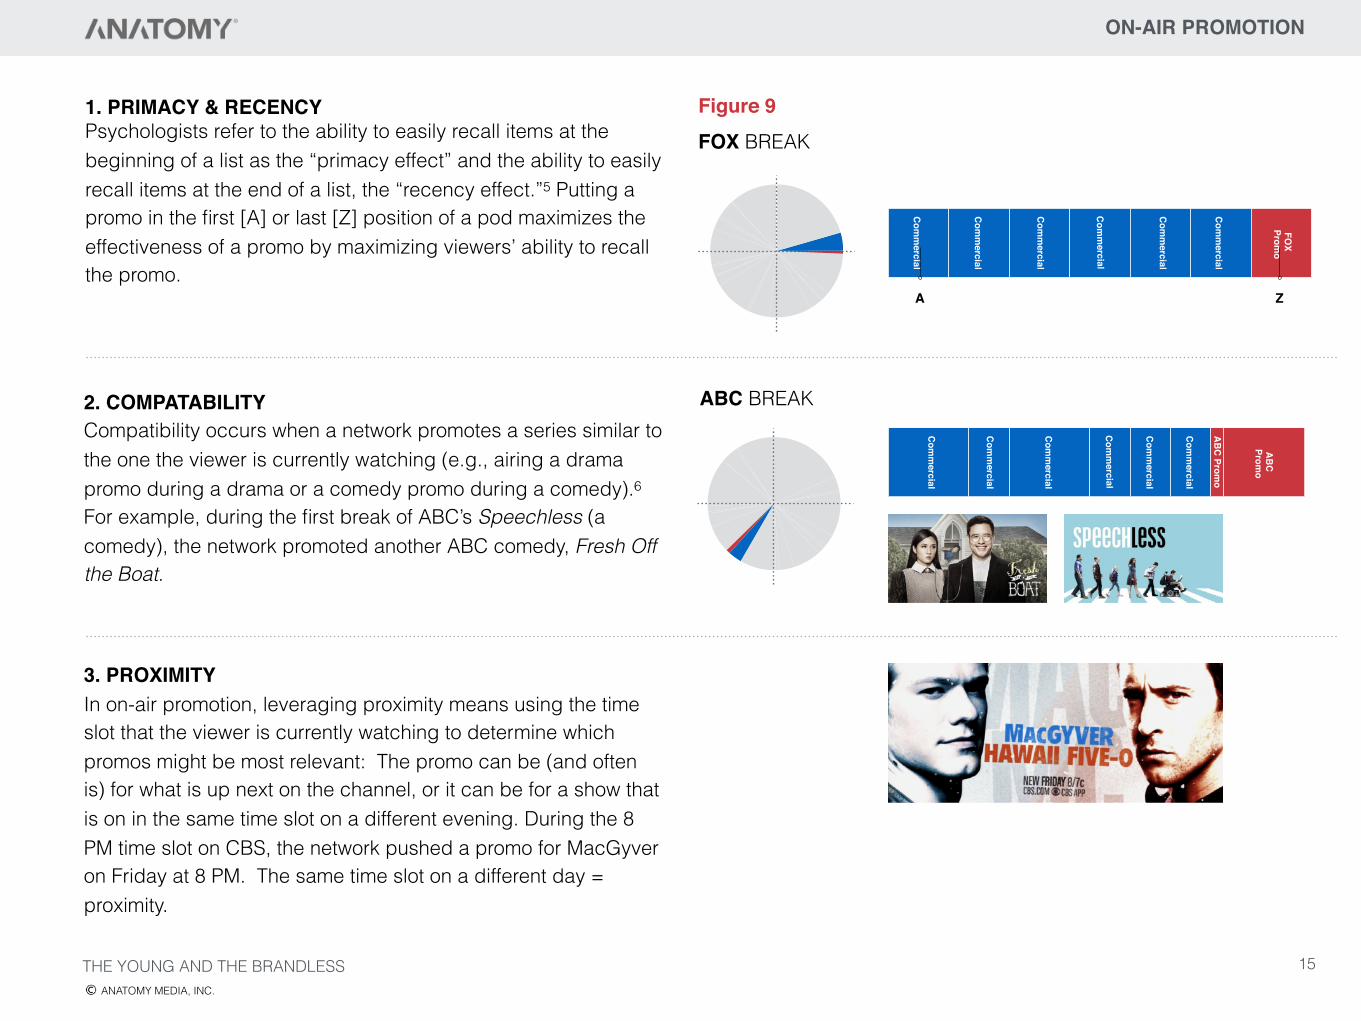
1. PRIMACY & RECENCYPsychologists refer to the ability to easily recall items at the beginning of a list as the “primacy effect” and the ability to easily recall items at the end of a list, the “recency effect.”5 Putting a promo in the first [A] or last [Z] position of a pod maximizes the effectiveness of a promo by maximizing viewers’ ability to recall the promo.
Com
mercial
Com
mercial
Com
mercial
Com
mercial
Com
mercial
Com
mercial
FOX
Promo
FOX BREAK
A Z
2. COMPATABILITY Compatibility occurs when a network promotes a series similar to the one the viewer is currently watching (e.g., airing a drama promo during a drama or a comedy promo during a comedy).6 For example, during the first break of ABC’s Speechless (a comedy), the network promoted another ABC comedy, Fresh Off the Boat.
Com
mercial
Com
mercial
Com
mercial
AB
C Prom
o
Com
mercial
Com
mercial
AB
C Prom
o
Com
mercial
ABC BREAK
3. PROXIMITY In on-air promotion, leveraging proximity means using the time slot that the viewer is currently watching to determine which promos might be most relevant: The promo can be (and often is) for what is up next on the channel, or it can be for a show that is on in the same time slot on a different evening. During the 8 PM time slot on CBS, the network pushed a promo for MacGyver on Friday at 8 PM. The same time slot on a different day = proximity.
THE YOUNG AND THE BRANDLESSANATOMY MEDIA, INC.
15
Figure 9
SOCIAL MEDIA
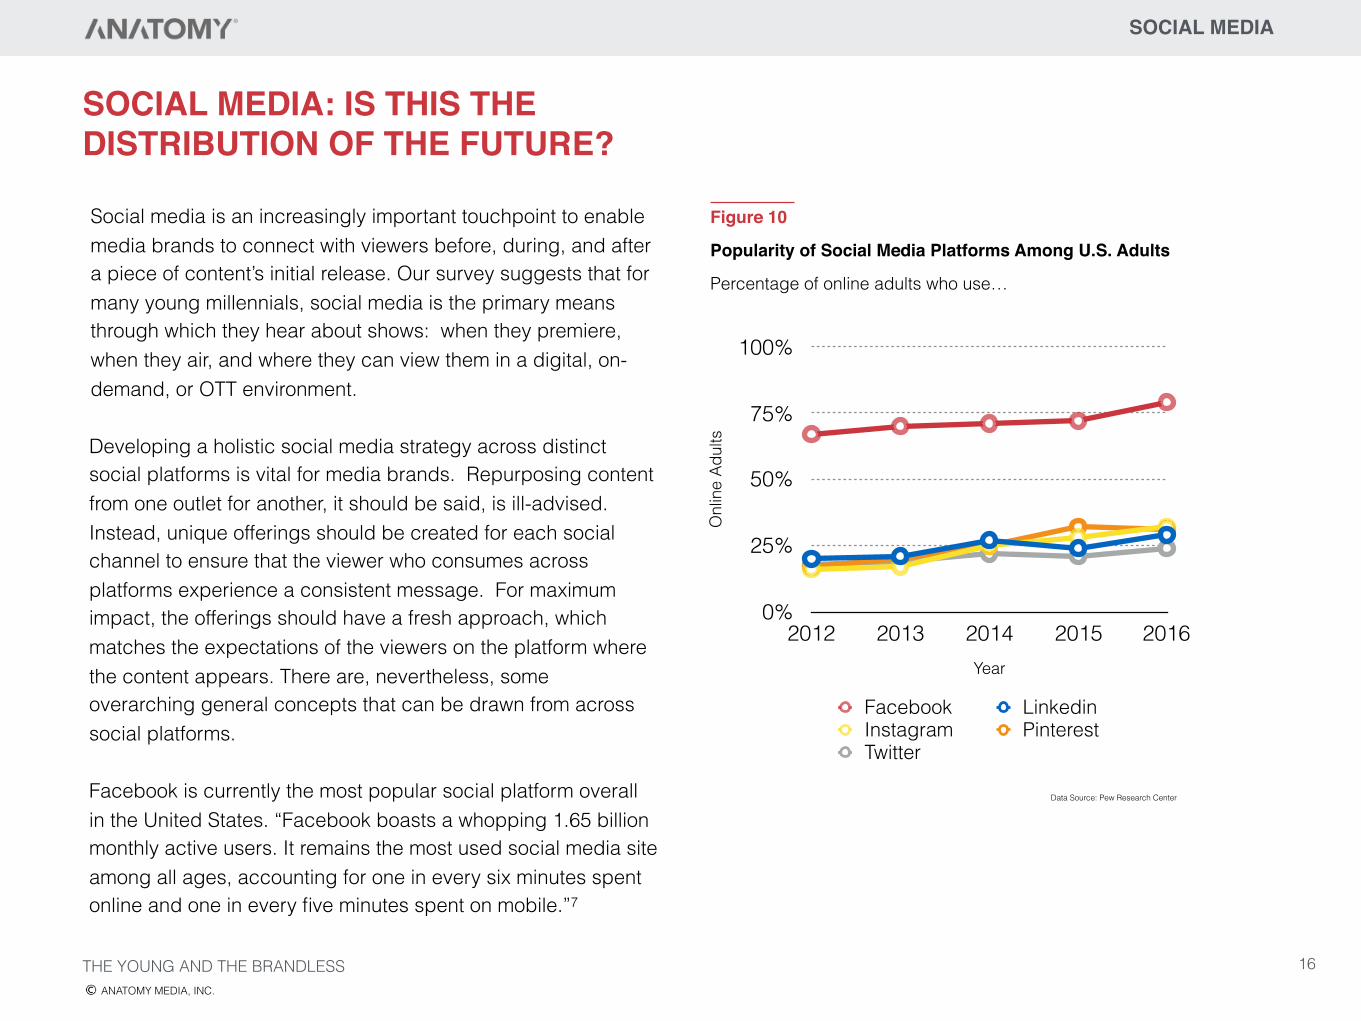
Social media is an increasingly important touchpoint to enable media brands to connect with viewers before, during, and after a piece of content’s initial release. Our survey suggests that for many young millennials, social media is the primary means through which they hear about shows: when they premiere, when they air, and where they can view them in a digital, on-demand, or OTT environment.
Developing a holistic social media strategy across distinct social platforms is vital for media brands. Repurposing content from one outlet for another, it should be said, is ill-advised. Instead, unique offerings should be created for each social channel to ensure that the viewer who consumes across platforms experience a consistent message. For maximum impact, the offerings should have a fresh approach, which matches the expectations of the viewers on the platform where the content appears. There are, nevertheless, some overarching general concepts that can be drawn from across social platforms.
Facebook is currently the most popular social platform overall in the United States. “Facebook boasts a whopping 1.65 billion monthly active users. It remains the most used social media site among all ages, accounting for one in every six minutes spent online and one in every five minutes spent on mobile.”7
SOCIAL MEDIA: IS THIS THE DISTRIBUTION OF THE FUTURE?
Onl
ine
Adul
ts
0%
25%
50%
75%
100%
Year
2012 2013 2014 2015 2016
Facebook LinkedinInstagram PinterestTwitter
Percentage of online adults who use…
Popularity of Social Media Platforms Among U.S. Adults
Figure 10
Data Source: Pew Research Center
THE YOUNG AND THE BRANDLESSANATOMY MEDIA, INC.
16
Given its importance in the social landscape, we focused our analysis on Facebook data.
We conducted an audit of promotion on Facebook across seven brand Facebook pages: ABC, CBS, FOX, NBC, Amazon, Hulu, and Netflix.8 From each Facebook page, we extracted the hundred most recent posts so that we could identify patterns that ultimately contribute toward building brand awareness and increasing engagement.
With our Facebook audits, we wanted to answer four key questions about social media promotion:
1. How often should media brands post? 2. When is the most effective time for media brands to
post? 3. What types of posts are most effective for media
brands? 4. What types of engagement are most important for
media brands?
SOCIAL MEDIA
THE YOUNG AND THE BRANDLESSANATOMY MEDIA, INC.
How often should media brands post? Determining the optimum number of posts to publish on Facebook per month, week, day, or even per hour is a tricky task. This is because a higher frequency of posts doesn’t necessarily mean higher engagement or viewership. There are a couple of explanations for this. First, the Facebook newsfeed algorithm devalues “spammy” accounts.9 And second, Facebook limits the organic reach of posts from business pages. (The degree to which businesses are throttled is linked to how unappealing Facebook believes the industry content is.) However, entertainment has better reach than, say, a personal injury attorney. And even though only 1 to 5% of Facebook visitors who have “liked” an entertainment page will see what is posted on that page unless the network pays additional fees, even this small degree of reach should not be forgotten or ignored.
17
SOCIAL MEDIA
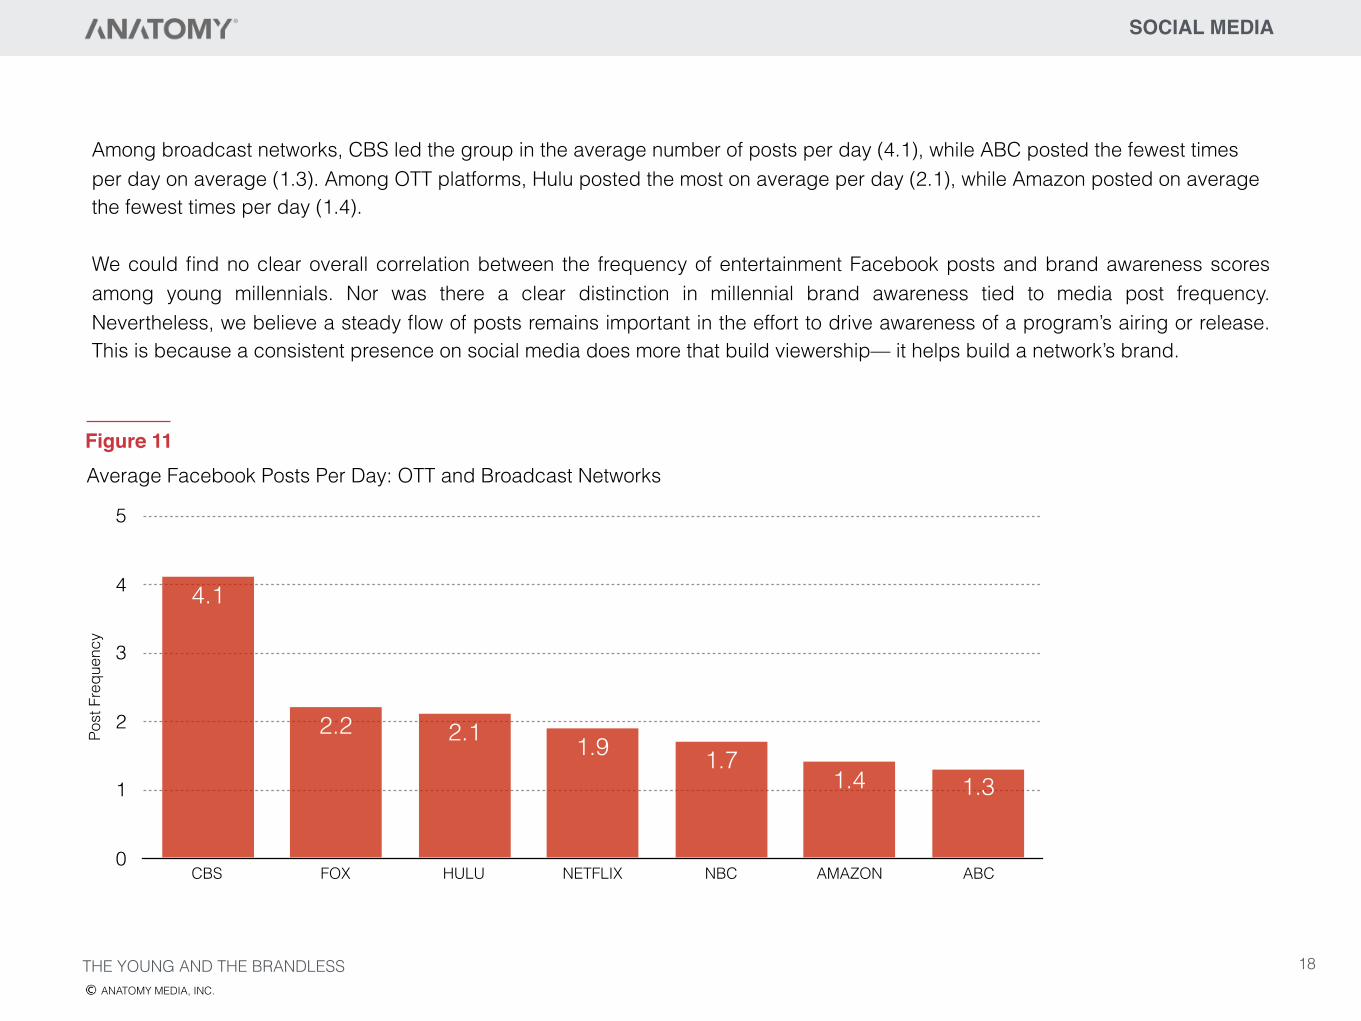
Among broadcast networks, CBS led the group in the average number of posts per day (4.1), while ABC posted the fewest times per day on average (1.3). Among OTT platforms, Hulu posted the most on average per day (2.1), while Amazon posted on average the fewest times per day (1.4).
We could find no clear overall correlation between the frequency of entertainment Facebook posts and brand awareness scores among young millennials. Nor was there a clear distinction in millennial brand awareness tied to media post frequency. Nevertheless, we believe a steady flow of posts remains important in the effort to drive awareness of a program’s airing or release. This is because a consistent presence on social media does more that build viewership— it helps build a network’s brand.
Average Facebook Posts Per Day: OTT and Broadcast NetworksFigure 11
Post
Fre
quen
cy
0
1
2
3
4
5
CBS FOX HULU NETFLIX NBC AMAZON ABC
1.31.41.71.92.12.2
4.1
THE YOUNG AND THE BRANDLESSANATOMY MEDIA, INC.
18
SOCIAL MEDIA
When is the most effective time to post for media brands?
Social media operates in real time. Users across the globe see posts when they are made regardless of local time zones. Because, for example, a post published at 10 PM in California will appear at 1 AM in New York, planning social media posting times is a significant challenge for media brands wanting to optimize engagement.
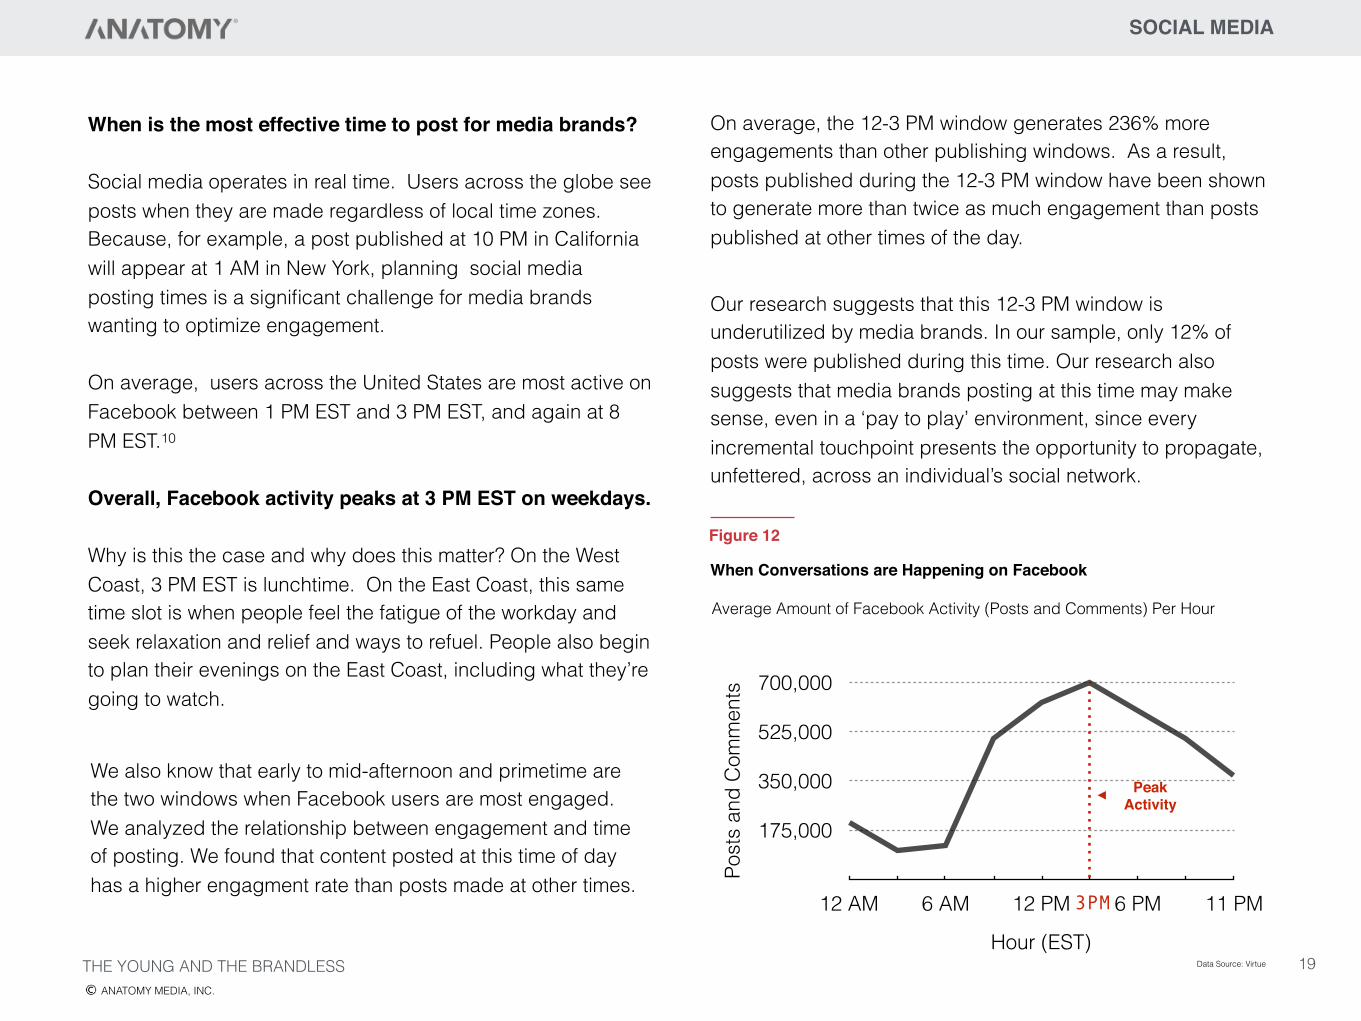
On average, users across the United States are most active on Facebook between 1 PM EST and 3 PM EST, and again at 8 PM EST.10
Overall, Facebook activity peaks at 3 PM EST on weekdays.
Why is this the case and why does this matter? On the West Coast, 3 PM EST is lunchtime. On the East Coast, this same time slot is when people feel the fatigue of the workday and seek relaxation and relief and ways to refuel. People also begin to plan their evenings on the East Coast, including what they’re going to watch.
Data Source: Virtue
Post
s an
d C
omm
ents
175,000
350,000
525,000
700,000
Hour (EST)
12 AM 6 AM 12 PM 6 PM 11 PM3PM
Peak Activity
Average Amount of Facebook Activity (Posts and Comments) Per Hour
When Conversations are Happening on Facebook
Figure 12
On average, the 12-3 PM window generates 236% more engagements than other publishing windows. As a result, posts published during the 12-3 PM window have been shown to generate more than twice as much engagement than posts published at other times of the day.
Our research suggests that this 12-3 PM window is underutilized by media brands. In our sample, only 12% of posts were published during this time. Our research also suggests that media brands posting at this time may make sense, even in a ‘pay to play’ environment, since every incremental touchpoint presents the opportunity to propagate, unfettered, across an individual’s social network.
THE YOUNG AND THE BRANDLESSANATOMY MEDIA, INC.
We also know that early to mid-afternoon and primetime are the two windows when Facebook users are most engaged. We analyzed the relationship between engagement and time of posting. We found that content posted at this time of day has a higher engagment rate than posts made at other times.
19
Com
men
ts0
2,4004,8007,2009,600
12,000
Hour
9:00 AM 7:00 PM
SOCIAL MEDIA
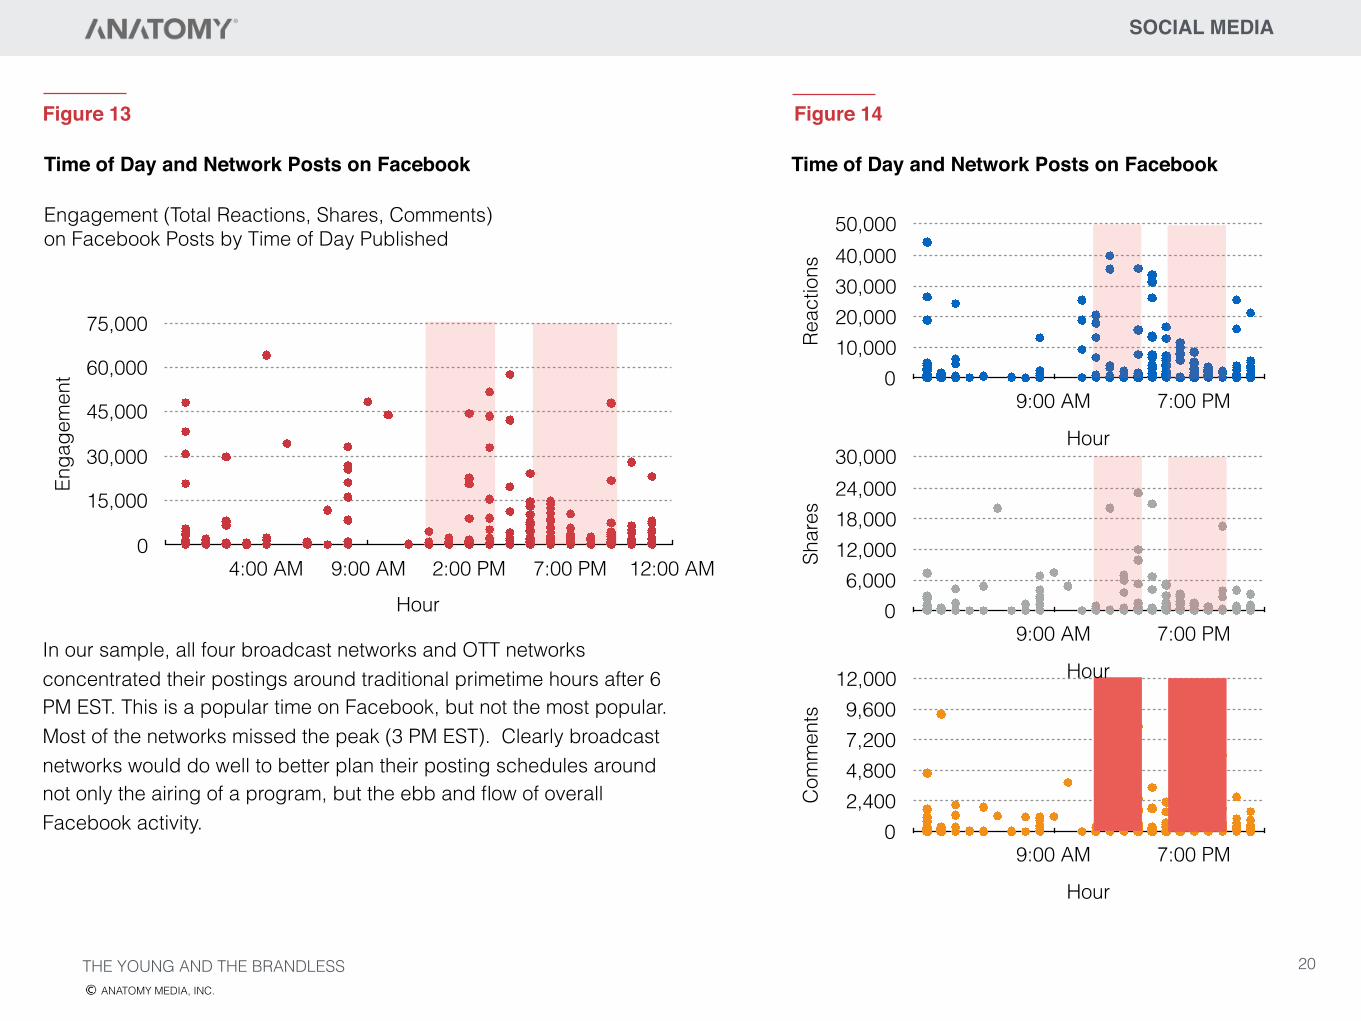
In our sample, all four broadcast networks and OTT networks concentrated their postings around traditional primetime hours after 6 PM EST. This is a popular time on Facebook, but not the most popular. Most of the networks missed the peak (3 PM EST). Clearly broadcast networks would do well to better plan their posting schedules around not only the airing of a program, but the ebb and flow of overall Facebook activity.
Enga
gem
ent
0
15,000
30,000
45,000
60,000
75,000
Hour4:00 AM 9:00 AM 2:00 PM 7:00 PM 12:00 AM
Time of Day and Network Posts on Facebook
Engagement (Total Reactions, Shares, Comments) on Facebook Posts by Time of Day Published
Figure 13
Shar
es
06,000
12,00018,00024,00030,000
Hour
9:00 AM 7:00 PM
Reac
tions
010,00020,00030,00040,00050,000
Hour
9:00 AM 7:00 PM
Time of Day and Network Posts on Facebook
Figure 14
THE YOUNG AND THE BRANDLESSANATOMY MEDIA, INC.
20
SOCIAL MEDIA
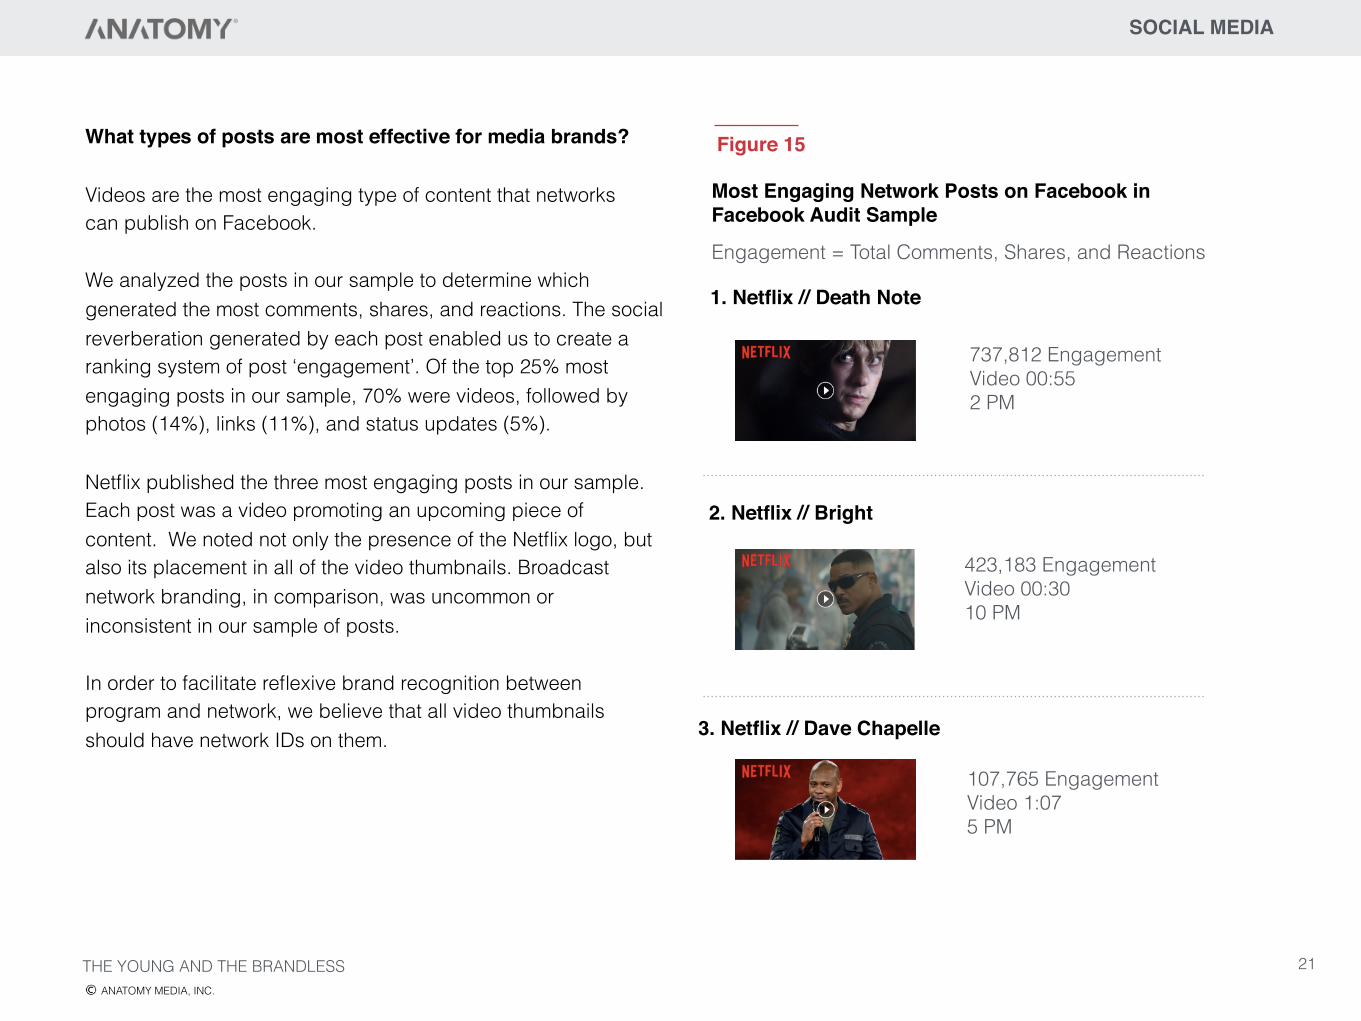
What types of posts are most effective for media brands?
Videos are the most engaging type of content that networks can publish on Facebook.
We analyzed the posts in our sample to determine which generated the most comments, shares, and reactions. The social reverberation generated by each post enabled us to create a ranking system of post ‘engagement’. Of the top 25% most engaging posts in our sample, 70% were videos, followed by photos (14%), links (11%), and status updates (5%).
Netflix published the three most engaging posts in our sample. Each post was a video promoting an upcoming piece of content. We noted not only the presence of the Netflix logo, but also its placement in all of the video thumbnails. Broadcast network branding, in comparison, was uncommon or inconsistent in our sample of posts.
In order to facilitate reflexive brand recognition between program and network, we believe that all video thumbnails should have network IDs on them.
Most Engaging Network Posts on Facebook inFacebook Audit Sample
1. Netflix // Death Note
2. Netflix // Bright
3. Netflix // Dave Chapelle
737,812 Engagement Video 00:55 2 PM
423,183 Engagement Video 00:30 10 PM
107,765 Engagement Video 1:07 5 PM
Engagement = Total Comments, Shares, and Reactions
THE YOUNG AND THE BRANDLESSANATOMY MEDIA, INC.
Figure 15
21
Embedding IDs in the top left corner of videos and thumbnails is an easy brand investment strategy for networks.
Additionally, according to Digiday, 85% of Facebook videos are viewed without sound, which suggests networks should test if their content is compelling when silent and if necessary consider adding captions so viewers can engage with content without sound.16
SOCIAL MEDIA
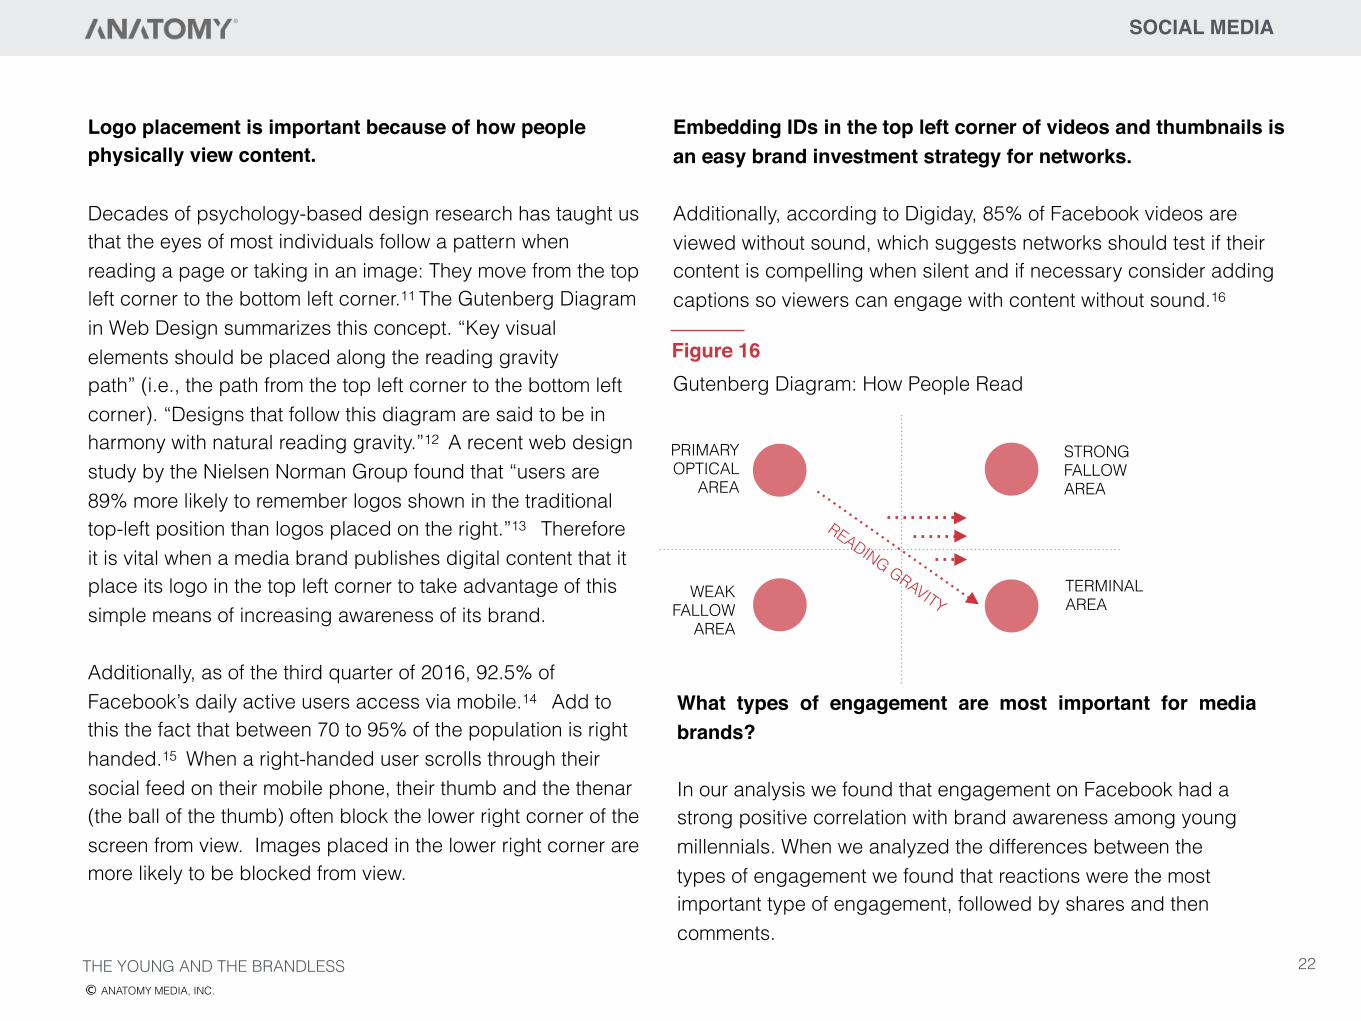
Logo placement is important because of how people physically view content.
Decades of psychology-based design research has taught us that the eyes of most individuals follow a pattern when reading a page or taking in an image: They move from the top left corner to the bottom left corner.11 The Gutenberg Diagram in Web Design summarizes this concept. “Key visual elements should be placed along the reading gravity path” (i.e., the path from the top left corner to the bottom left corner). “Designs that follow this diagram are said to be in harmony with natural reading gravity.”12 A recent web design study by the Nielsen Norman Group found that “users are 89% more likely to remember logos shown in the traditional top-left position than logos placed on the right.”13 Therefore it is vital when a media brand publishes digital content that it place its logo in the top left corner to take advantage of this simple means of increasing awareness of its brand.
Additionally, as of the third quarter of 2016, 92.5% of Facebook’s daily active users access via mobile.14 Add to this the fact that between 70 to 95% of the population is right handed.15 When a right-handed user scrolls through their social feed on their mobile phone, their thumb and the thenar (the ball of the thumb) often block the lower right corner of the screen from view. Images placed in the lower right corner are more likely to be blocked from view.
What types of engagement are most important for media brands?
In our analysis we found that engagement on Facebook had a strong positive correlation with brand awareness among young millennials. When we analyzed the differences between the types of engagement we found that reactions were the most important type of engagement, followed by shares and then comments.
PRIMARY OPTICAL
AREA
STRONG FALLOW AREA
WEAK FALLOW
AREA
TERMINAL AREA
READING GRAVITY
Gutenberg Diagram: How People ReadFigure 16
THE YOUNG AND THE BRANDLESSANATOMY MEDIA, INC.
22
Coordination between on-air and social promotional efforts is a critical strategy for broadcast networks to master, particularly as this strategic promotional lever is not available to their OTT counterparts. A recent study by The Advertising Research Foundation found that coordinating campaigns across platforms “produces a kicker effect”—“adding digital to TV” ad campaigns generates “60% higher ROI.”17
Coordinating campaigns successfully across platforms means consistent positioning across platforms. To do this, networks must create distinctive “brand assets” that are memorable, emotional and “provide sensory and semantic cues” that placed in multiple platforms will reinforce distinct brand position for shows and for networks.18
How well do broadcast networks tie together their on-air and social media promotion?
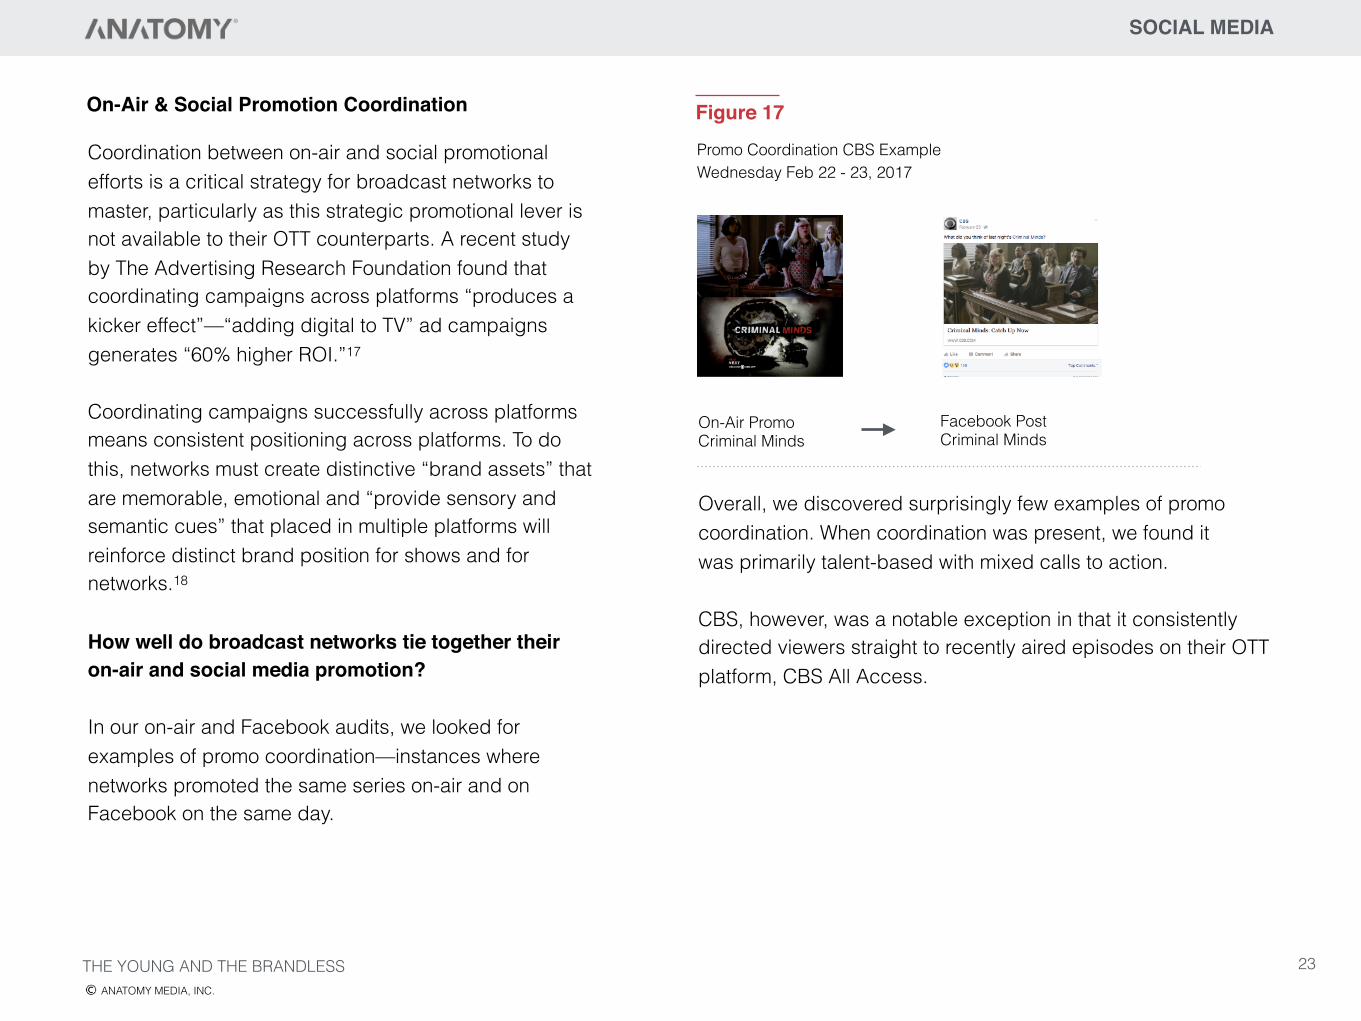
In our on-air and Facebook audits, we looked for examples of promo coordination—instances where networks promoted the same series on-air and on Facebook on the same day.
On-Air & Social Promotion Coordination
On-Air Promo Criminal Minds
Facebook Post Criminal Minds
Promo Coordination CBS Example Wednesday Feb 22 - 23, 2017
Figure 17
THE YOUNG AND THE BRANDLESSANATOMY MEDIA, INC.
Overall, we discovered surprisingly few examples of promo coordination. When coordination was present, we found it was primarily talent-based with mixed calls to action.
CBS, however, was a notable exception in that it consistently directed viewers straight to recently aired episodes on their OTT platform, CBS All Access.
SOCIAL MEDIA
23
SOCIAL MEDIA
• Concentrate posts around the 3 PM EST peak and the smaller 8 PM EST peak.
• Embed network logo IDs in all videos and thumbnails posted to social platforms.
• Place logos in the top left corner of the image. • Prioritize video posts on Facebook. • Test if videos are compelling when silent. • Build awareness the day before a program airs or
releases. • Continue to build awareness during the day that a
program airs or is released and remind viewers before a live airing.
• Provide navigation to OTT and on-demand viewing options the day after a program airs or is released.
• Coordinate on-air and social promotion to yield a “kicker effect” that increases the effectiveness of marketing messages.
THE YOUNG AND THE BRANDLESSANATOMY MEDIA, INC.
This brings us back to proximity in on-air promotion discussed earlier. Through proximity in on-air promotion, information is provided to viewers about airings that will happen imminently or in the near future in the same time slot.
But time is irrelevant in the on-demand digital environment, so rather than refer to time, proximity here refers to platform and the ease with which a viewer can digitally migrate from one location to another. Proximity in digital spaces is all about clarity and seamless navigation. For example, CBS leveraged digital proximity, making it easy for the viewer to move from watching a promo to accessing the content. Similarly, the growing demand for networks will be to provide viewers on laptops and mobile devices with clear navigation from promo to content. In a digital viewer-centric world, networks must find a way to make navigation to their platform as simple as possible.
Key Takeaways from Facebook Analysis:
24
SOCIAL MEDIA
SOCIAL MEDIA RANKINGS
01 02 03
04 05 06 07
THE YOUNG AND THE BRANDLESSANATOMY MEDIA, INC.
25
SEO
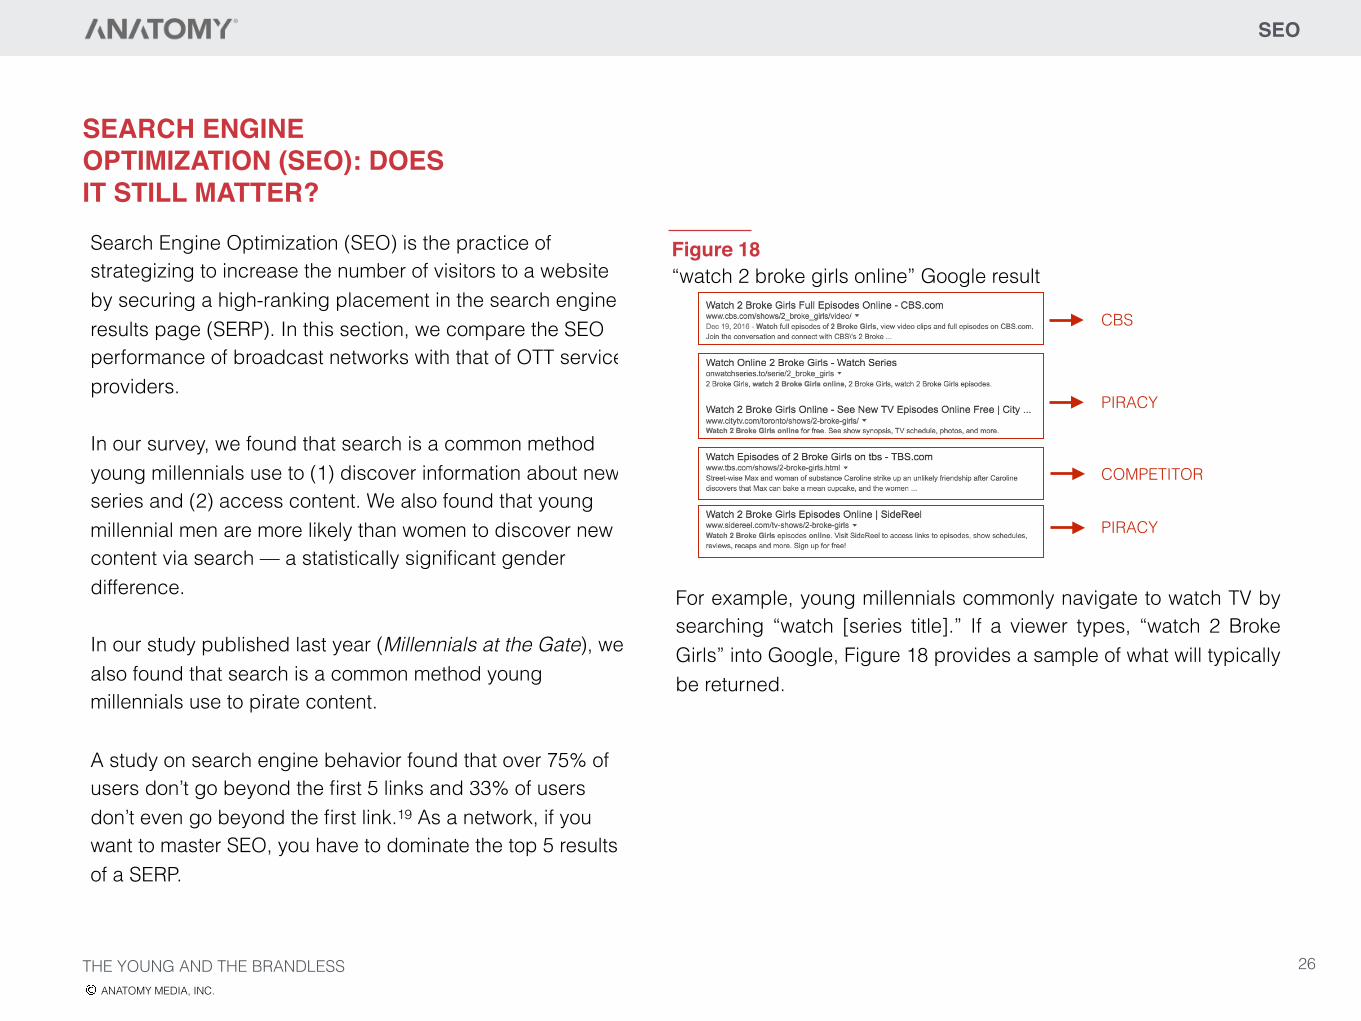
SEARCH ENGINE OPTIMIZATION (SEO): DOES IT STILL MATTER?Search Engine Optimization (SEO) is the practice of strategizing to increase the number of visitors to a website by securing a high-ranking placement in the search engine results page (SERP). In this section, we compare the SEO performance of broadcast networks with that of OTT service providers.
In our survey, we found that search is a common method young millennials use to (1) discover information about new series and (2) access content. We also found that young millennial men are more likely than women to discover new content via search — a statistically significant gender difference.
In our study published last year (Millennials at the Gate), we also found that search is a common method young millennials use to pirate content.
A study on search engine behavior found that over 75% of users don’t go beyond the first 5 links and 33% of users don’t even go beyond the first link.19 As a network, if you want to master SEO, you have to dominate the top 5 results of a SERP.
“watch 2 broke girls online” Google resultFigure 18
THE YOUNG AND THE BRANDLESSANATOMY MEDIA, INC.
For example, young millennials commonly navigate to watch TV by searching “watch [series title].” If a viewer types, “watch 2 Broke Girls” into Google, Figure 18 provides a sample of what will typically be returned.
CBS
PIRACY
COMPETITOR
PIRACY
26
SEO
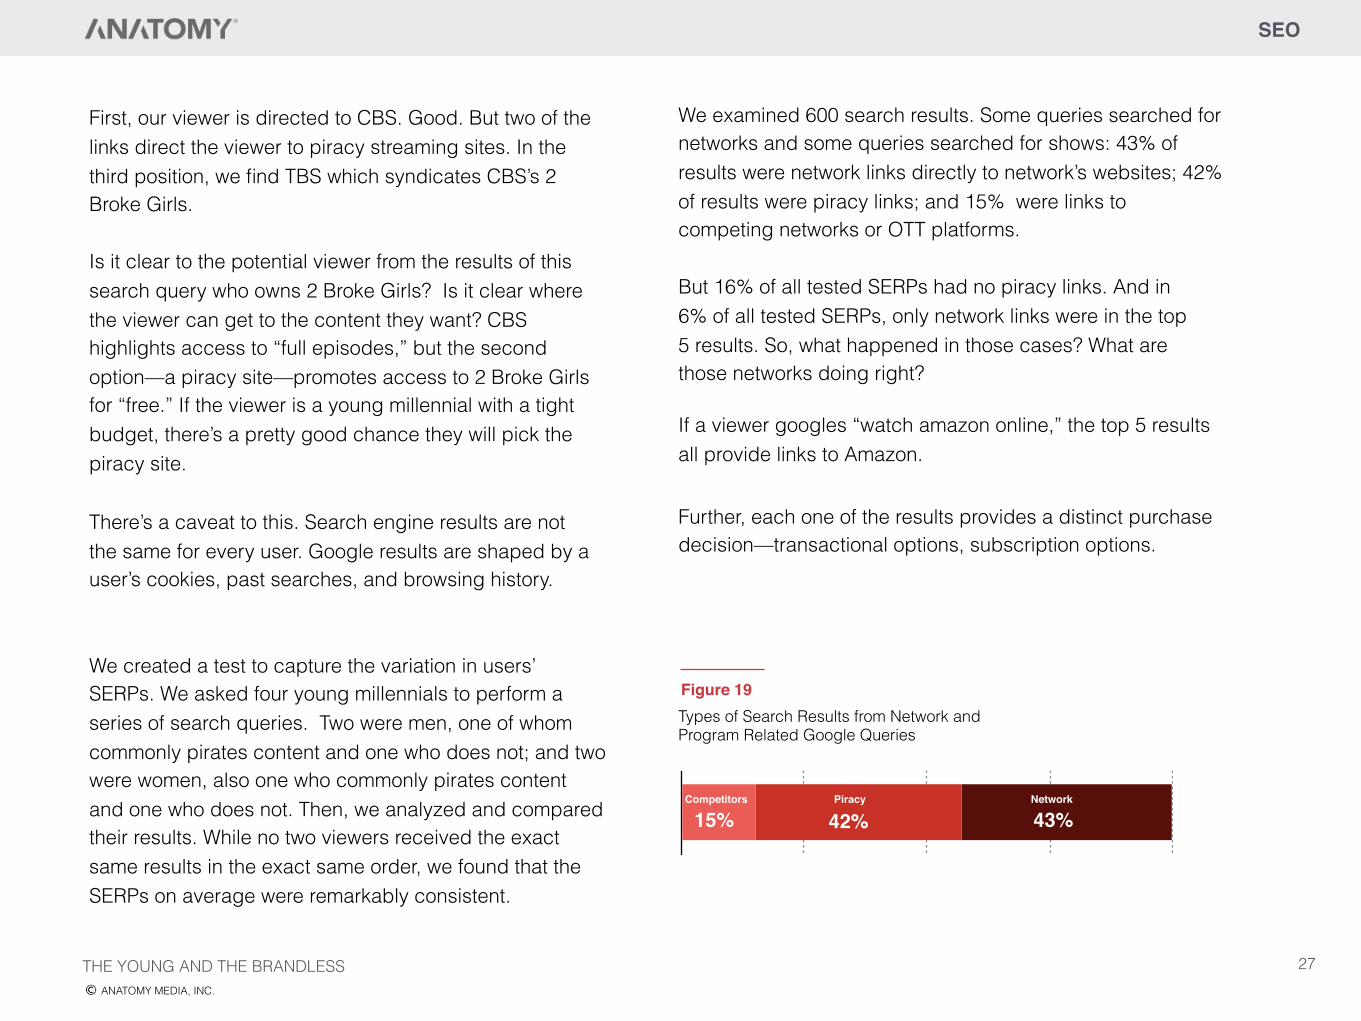
We created a test to capture the variation in users’ SERPs. We asked four young millennials to perform a series of search queries. Two were men, one of whom commonly pirates content and one who does not; and two were women, also one who commonly pirates content and one who does not. Then, we analyzed and compared their results. While no two viewers received the exact same results in the exact same order, we found that the SERPs on average were remarkably consistent. 15%
Competitors
43%
Types of Search Results from Network and Program Related Google Queries
Network
Figure 19
15%Competitors
42%Piracy
THE YOUNG AND THE BRANDLESSANATOMY MEDIA, INC.
There’s a caveat to this. Search engine results are not the same for every user. Google results are shaped by a user’s cookies, past searches, and browsing history.
If a viewer googles “watch amazon online,” the top 5 results all provide links to Amazon.
Further, each one of the results provides a distinct purchase decision—transactional options, subscription options.
First, our viewer is directed to CBS. Good. But two of the links direct the viewer to piracy streaming sites. In the third position, we find TBS which syndicates CBS’s 2 Broke Girls.
Is it clear to the potential viewer from the results of this search query who owns 2 Broke Girls? Is it clear where the viewer can get to the content they want? CBS highlights access to “full episodes,” but the second option—a piracy site—promotes access to 2 Broke Girls for “free.” If the viewer is a young millennial with a tight budget, there’s a pretty good chance they will pick the piracy site.
We examined 600 search results. Some queries searched for networks and some queries searched for shows: 43% of results were network links directly to network’s websites; 42% of results were piracy links; and 15% were links to competing networks or OTT platforms.
But 16% of all tested SERPs had no piracy links. And in 6% of all tested SERPs, only network links were in the top 5 results. So, what happened in those cases? What are those networks doing right?
27
In our survey data, however, we found that young millennials have a greater affinity for shows, rather than networks. So, what happens when a viewer searches for a show rather than a network? Generally, searches by program title yielded more piracy and competing OTT platform results and fewer network results than those returned by searches conducted for a network name.
SEO
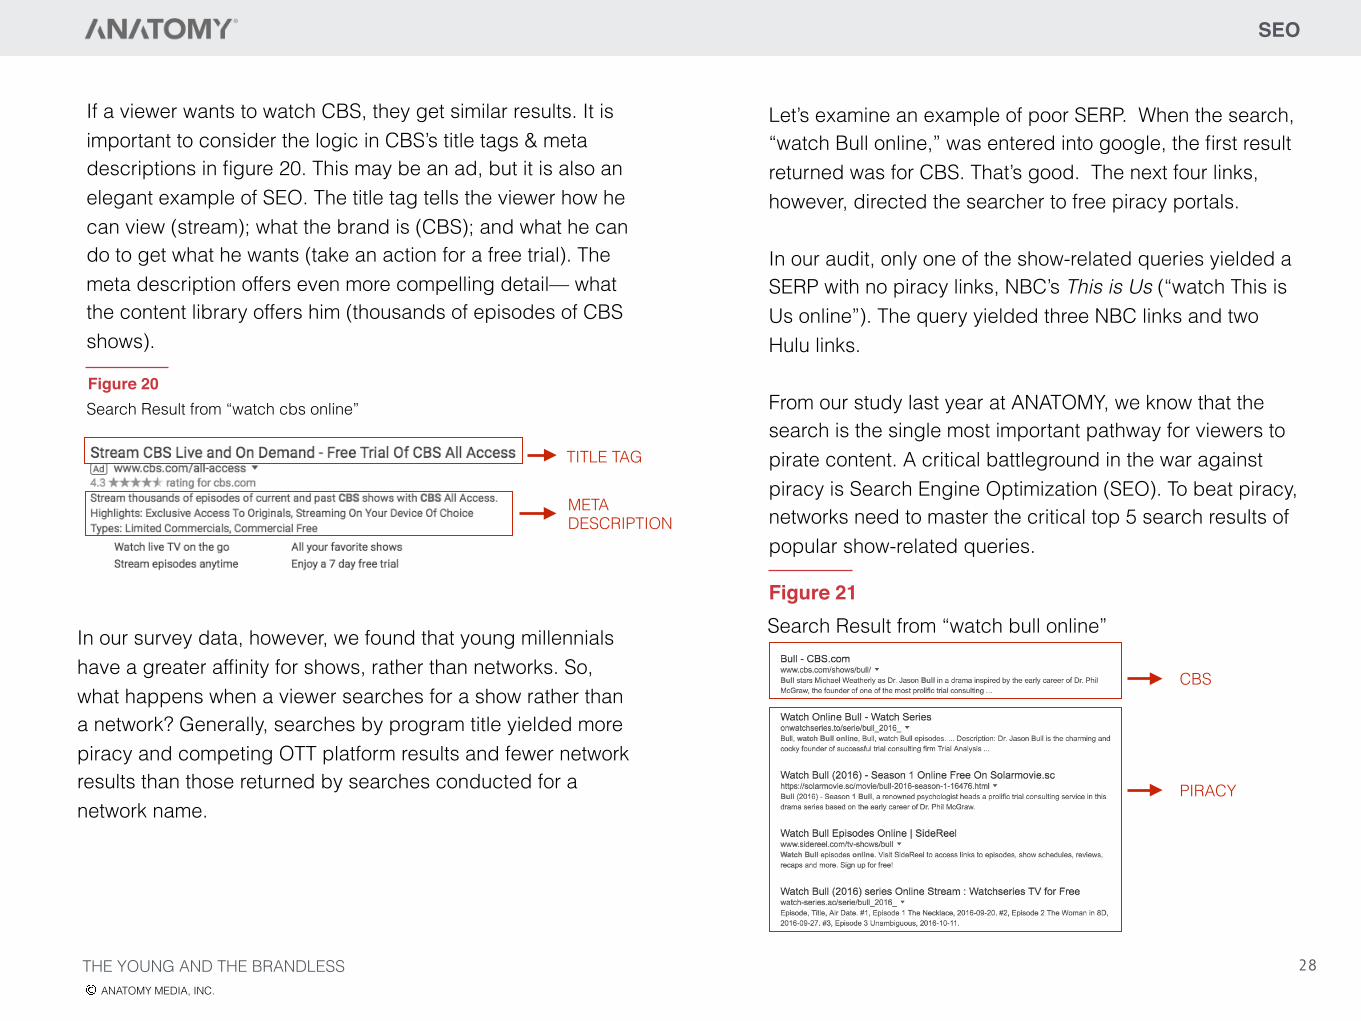
Figure 21Search Result from “watch bull online”
28THE YOUNG AND THE BRANDLESSANATOMY MEDIA, INC.
Figure 20Search Result from “watch cbs online”
TITLE TAG
META DESCRIPTION
If a viewer wants to watch CBS, they get similar results. It is important to consider the logic in CBS’s title tags & meta descriptions in figure 20. This may be an ad, but it is also an elegant example of SEO. The title tag tells the viewer how he can view (stream); what the brand is (CBS); and what he can do to get what he wants (take an action for a free trial). The meta description offers even more compelling detail— what the content library offers him (thousands of episodes of CBS shows).
Let’s examine an example of poor SERP. When the search, “watch Bull online,” was entered into google, the first result returned was for CBS. That’s good. The next four links, however, directed the searcher to free piracy portals.
In our audit, only one of the show-related queries yielded a SERP with no piracy links, NBC’s This is Us (“watch This is Us online”). The query yielded three NBC links and two Hulu links.
From our study last year at ANATOMY, we know that the search is the single most important pathway for viewers to pirate content. A critical battleground in the war against piracy is Search Engine Optimization (SEO). To beat piracy, networks need to master the critical top 5 search results of popular show-related queries.
CBS
PIRACY
SEO
The factors that determine how Google serves up results are a black box by design. Businesses are not meant to be able to game the system—or if they do—they can’t do so for very long. The algorithm is always being tinkered with. It becomes necessary for networks to always be evaluating, updating and tweaking their web presence and presentation. The job is never done.
Regardless of the changes to their algorithm, Google places the consumer at the center of its search strategy. Consequently, networks that provide links that successfully fulfill consumers’ needs and thereby close the search loop will achieve better placement in the search results.
THE YOUNG AND THE BRANDLESSANATOMY MEDIA, INC.
Thus SEO isn’t just about the structure of a network’s title tags, back links, meta descriptions, and URLs. It’s also about the network’s website and its ability to deliver on the viewer’s query. The structure of a site must reward the user for opting to go there. As part of a network’s SEO strategy, a network must ask the important question: Do we reward people who choose our links? Is a piracy site easier to use than our site?
29
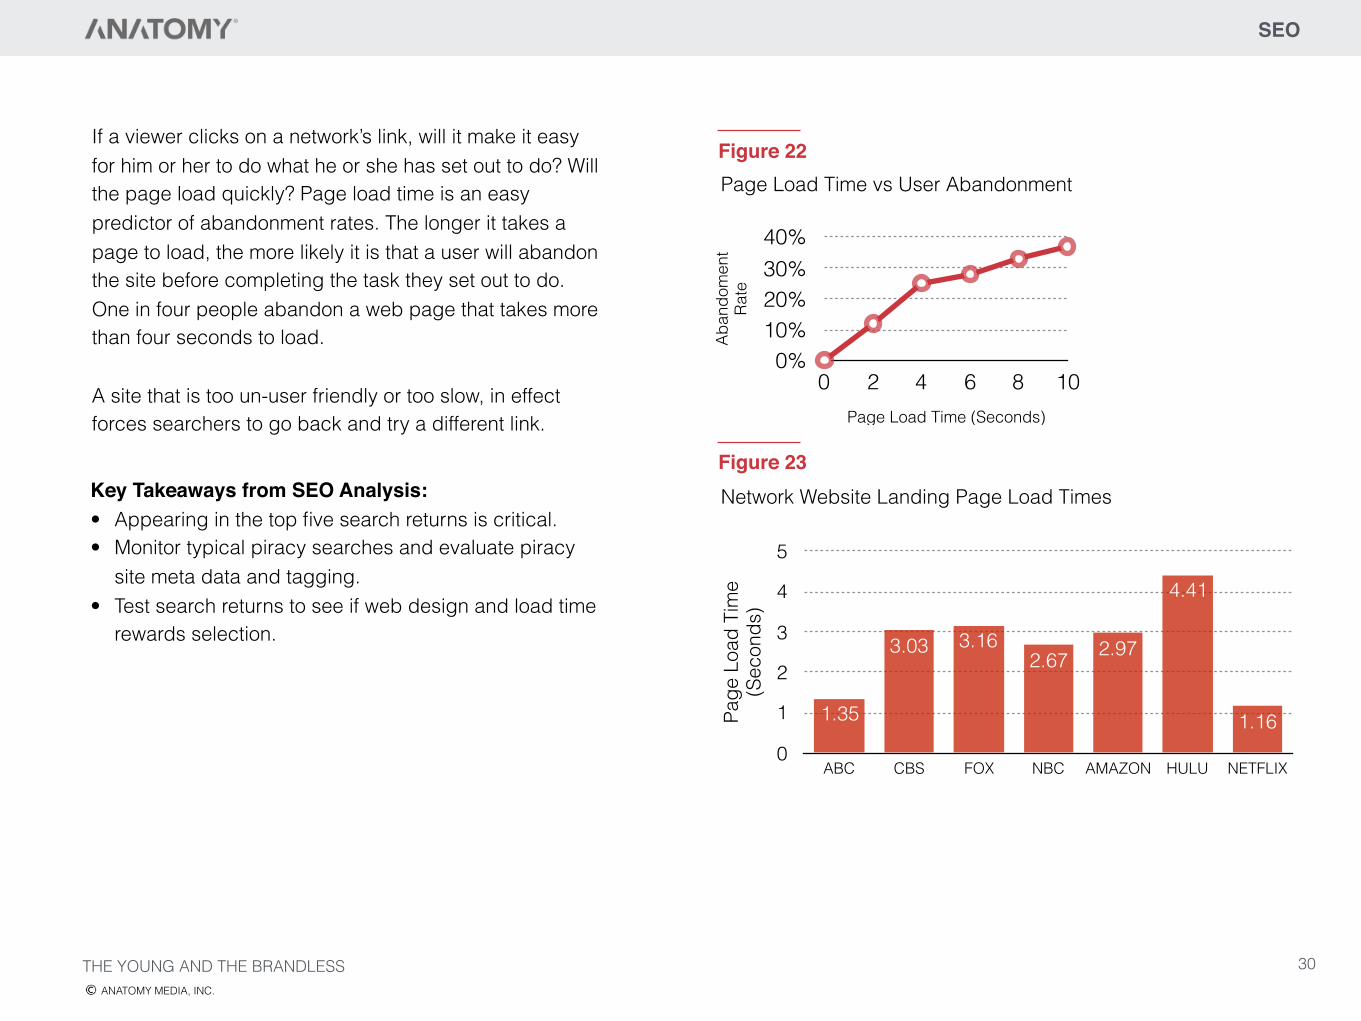
If a viewer clicks on a network’s link, will it make it easy for him or her to do what he or she has set out to do? Will the page load quickly? Page load time is an easy predictor of abandonment rates. The longer it takes a page to load, the more likely it is that a user will abandon the site before completing the task they set out to do. One in four people abandon a web page that takes more than four seconds to load.
A site that is too un-user friendly or too slow, in effect forces searchers to go back and try a different link.
Key Takeaways from SEO Analysis:• Appearing in the top five search returns is critical. • Monitor typical piracy searches and evaluate piracy
site meta data and tagging. • Test search returns to see if web design and load time
rewards selection.
Page Load Time vs User AbandonmentFigure 22
Aban
dom
ent
Rate
0%10%20%30%40%
Page Load Time (Seconds)
0 2 4 6 8 10
Network Website Landing Page Load TimesFigure 23
Page
Loa
d Ti
me
(Sec
onds
)0
1
2
3
4
5
ABC CBS FOX NBC AMAZON HULU NETFLIX
1.16
4.41
2.972.673.163.03
1.35
SEO
THE YOUNG AND THE BRANDLESSANATOMY MEDIA, INC.
30
SEO
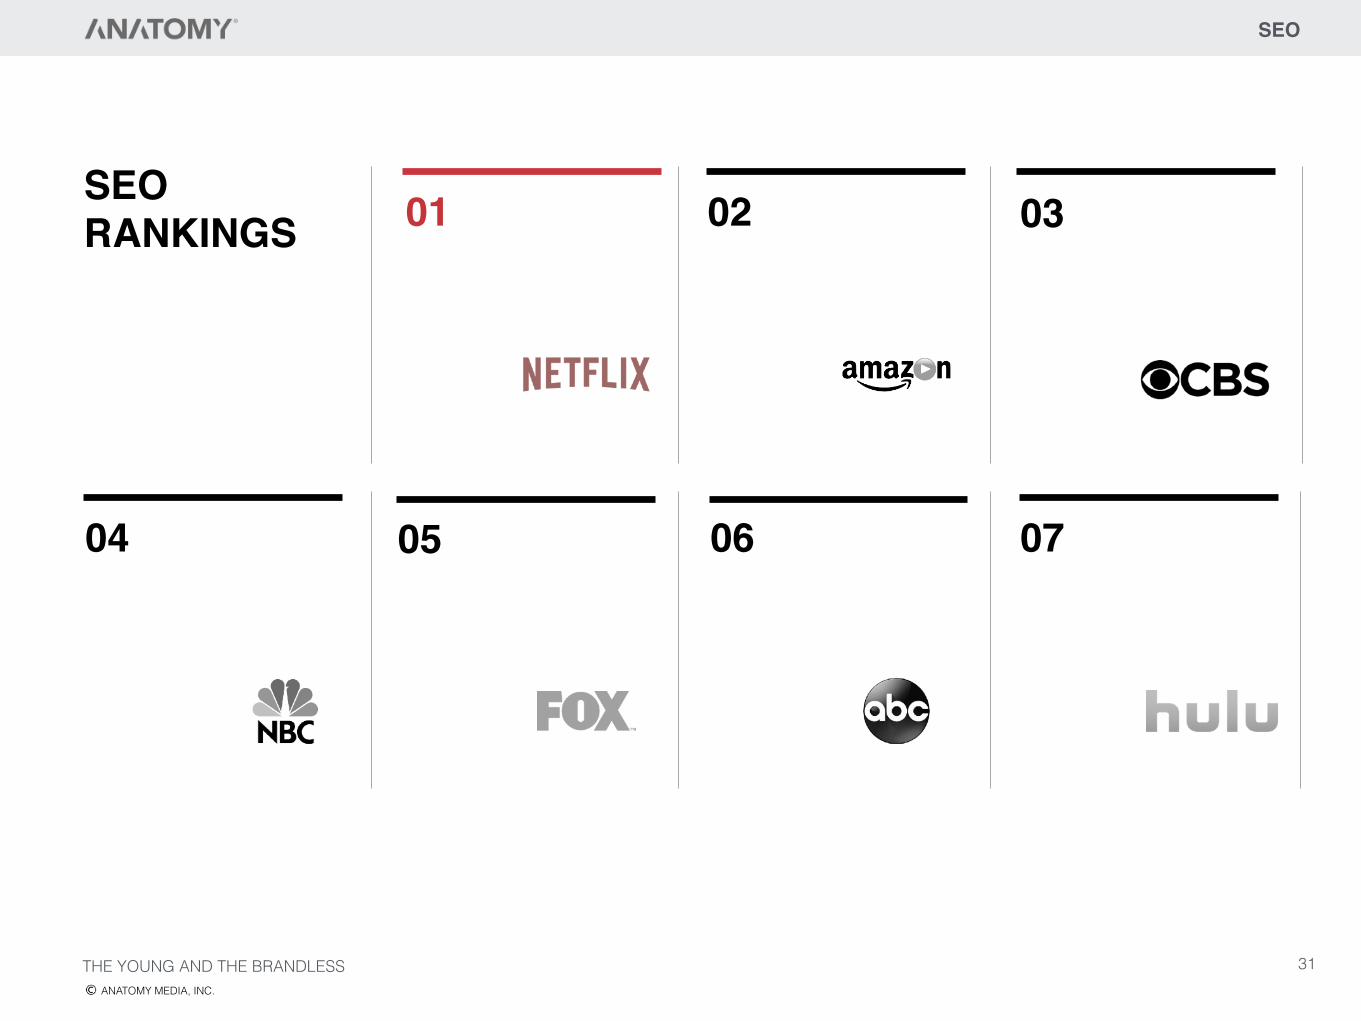
SEORANKINGS 01 02 03
04 05 06 07
THE YOUNG AND THE BRANDLESSANATOMY MEDIA, INC.
31
WEBSITES
As noted in our discussion of SEO, a website is a significant digital touchpoint for media brands, but poor user interface (UI) and user experience (UX) will deter users from a site. A user’s first impression of a site is critical and often based on surface level characteristics — usability, aesthetics, appearance, etc. Recent academic studies have shown that initial judgments of a site are “75% based on a website’s overall aesthetics, and these judgments are immediate as they occur as fast as 3.42 seconds.”20
We conducted a qualitative website audit of broadcast and OTT networks to assess trends in UI and UX design. Our analysis suggests that even as broadcast network websites have robust content offerings, their UI does not easily facilitate sampling of new series. All of the OTT networks require a log-in in order to access most content online. You may sample for free, but in order to do so, a user must set up a login and password as well as provide credit card information. For a site with low user adoption, these additional tasks may be enough to stop someone from sampling the service and limit growth.
WEBSITES: WHAT’S IMPORTANT AND WHAT MAKES THEM WORK WELL?
THE YOUNG AND THE BRANDLESSANATOMY MEDIA, INC.
Our audit focused primarily on the landing pages of network websites and analyzed the sites from a user perspective.
What are the key tasks users perform on network sites? 1. Catch up on recent episodes 2. Sample programming 3. Find out more information about programs
32
WEBSITES
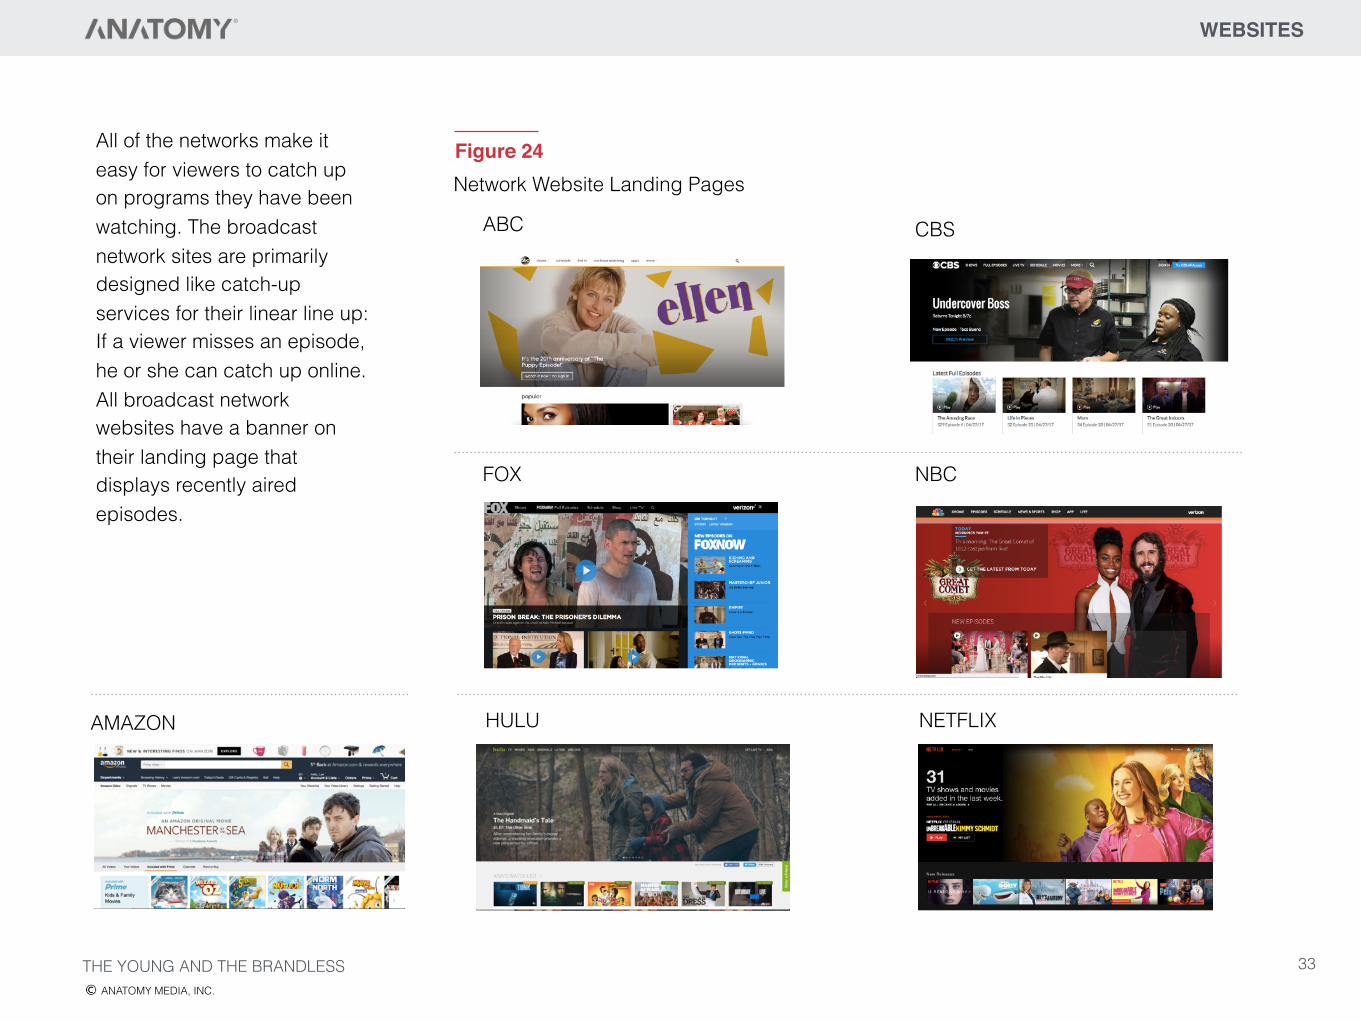
All of the networks make it easy for viewers to catch up on programs they have been watching. The broadcast network sites are primarily designed like catch-up services for their linear line up: If a viewer misses an episode, he or she can catch up online. All broadcast network websites have a banner on their landing page that displays recently aired episodes.
Network Website Landing Pages Figure 24
ABC CBS
FOX
HULU
NBC
NETFLIXAMAZON
THE YOUNG AND THE BRANDLESSANATOMY MEDIA, INC.
33
WEBSITES
On OTT network sites, viewers generally find the discovery of new programming easier and more inviting. More often than not, broadcast network websites make such discoveries a more difficult task.
This raises the “compatibility” concept we discussed earlier in on-air promotion. Networks frequently cluster promotion that is similar to the content being aired (i.e., a drama promo during a drama, and a comedy promo during a comedy). The audience exposed to promotion for a show compatible with their taste is more likely to tune into that show. But compatibility can also be applied to web strategy. If a viewer navigates to a program’s page on a network site, it should be easy for the viewer to find similar programming. All of the OTT networks allow the user to peruse programming by genre, but of the four broadcast network sites, only CBS.com offers a menu option to view programs by genre.
Users also discover and decide to sample programming by learning more about it. Thus it is imperative that network websites make it easy for web site visitors to figure out what a show is about. We have seen how how successful video content is on Facebook. Networks need to step up and allow viewers to see a trailer for any program they’re curious about. They can do so this on ABC, Amazon and Netflix–but not on other network websites.
THE YOUNG AND THE BRANDLESSANATOMY MEDIA, INC.
Implementing a recommender system on a network site is another way to facilitate content discovery. Recommender systems are an important tool in converting users online. “On the Internet, where the number of choices is overwhelming, there is need to filter, prioritize and efficiently deliver relevant information in order to alleviate the problem of information overload…Recommender systems solve this problem by searching through large volumes of dynamically generated information to provide users with personalized content and services.”21 Think of Amazon’s “Customers who viewed this item also bought” function, or YouTube’s “recommended” videos in the sidebar, or Netflix’s personalized recommendation categories.
Users also navigate to network websites in order to get more information about a program. All sites have an “about” section that contains program information, but the broadcast sites tend to have long text-heavy descriptions.
34
WEBSITES
Lastly, all networks should be ramping up their social integration. If most young millennials discover content through their social network, it is essential that they are able to easily slide from social network to network website. It should be pointed out that currently network websites derive the greatest percentage of their inbound traffic from Google searches and not social pages.
THE YOUNG AND THE BRANDLESSANATOMY MEDIA, INC.
Netflix has set what should be considered an industry standard when it comes to displaying show information. They have a designated “enhanced content team” that writes “tags and descriptions of every title.”22 These descriptions are succinct—no longer than two sentences—yet informative. The descriptions are integrated with show images, so that when a user hovers over a show image, show information is displayed. Building a hover function that displays text over show images is a simple solution that allows interested users to learn more without overwhelming those web visitors who aren’t looking for that level of detail.
Netflix’s enhanced content team offers another valuable lesson: They track down the best possible frames from content to display as the thumbnails that users can click on. Netflix is known to rigorously A/B test their thumbnails and other small details to determine what combinations make users click on content most frequently. Other digital connoisseurs practice this strategy, as well. For example, YouTubers have been extremely diligent about creating compelling thumbnails to maximize viewership. It is no surprise to anyone that great thumbnails are one of the best means of building Internet engagement.
Network branding within the network’s own site is also something for networks to consider. Netflix is once again a leader. All of their original content is consistently bugged with the Netflix logo in the top left corner.
Like Netflix, both Hulu and Amazon are networks that provide both their own original programming as well as licensed content produced by others. Unlike Netflix, neither Amazon nor Hulu has established a consistent design with regard to how the ownership of their programming is reflected in thumbnails.
And on broadcast networks, the branding on websites is even less evident. This may be because the network logo appears at the top of the network webpage. It is notable, however, that only the CBS website has a floating menu bar. If a user scrolls down on a ABC or NBC webpage, the menu bar–and the network branding are lost. Nevertheless, CBS, along with NBC does not bug its program thumbnails on its website. The ABC logo is applied inconsistently.
35
Key Takeaways from Website Analysis:
• Put the user at the center of website design and functionality.
• Use consistent terminology and branding throughout the website.
• Create a cohesive design with a high level of consistency among pages.
• Provide easy intuitive navigation. • Fully optimize for mobile and integrate social.
WEBSITES
THE YOUNG AND THE BRANDLESSANATOMY MEDIA, INC.
36
WEBSITES
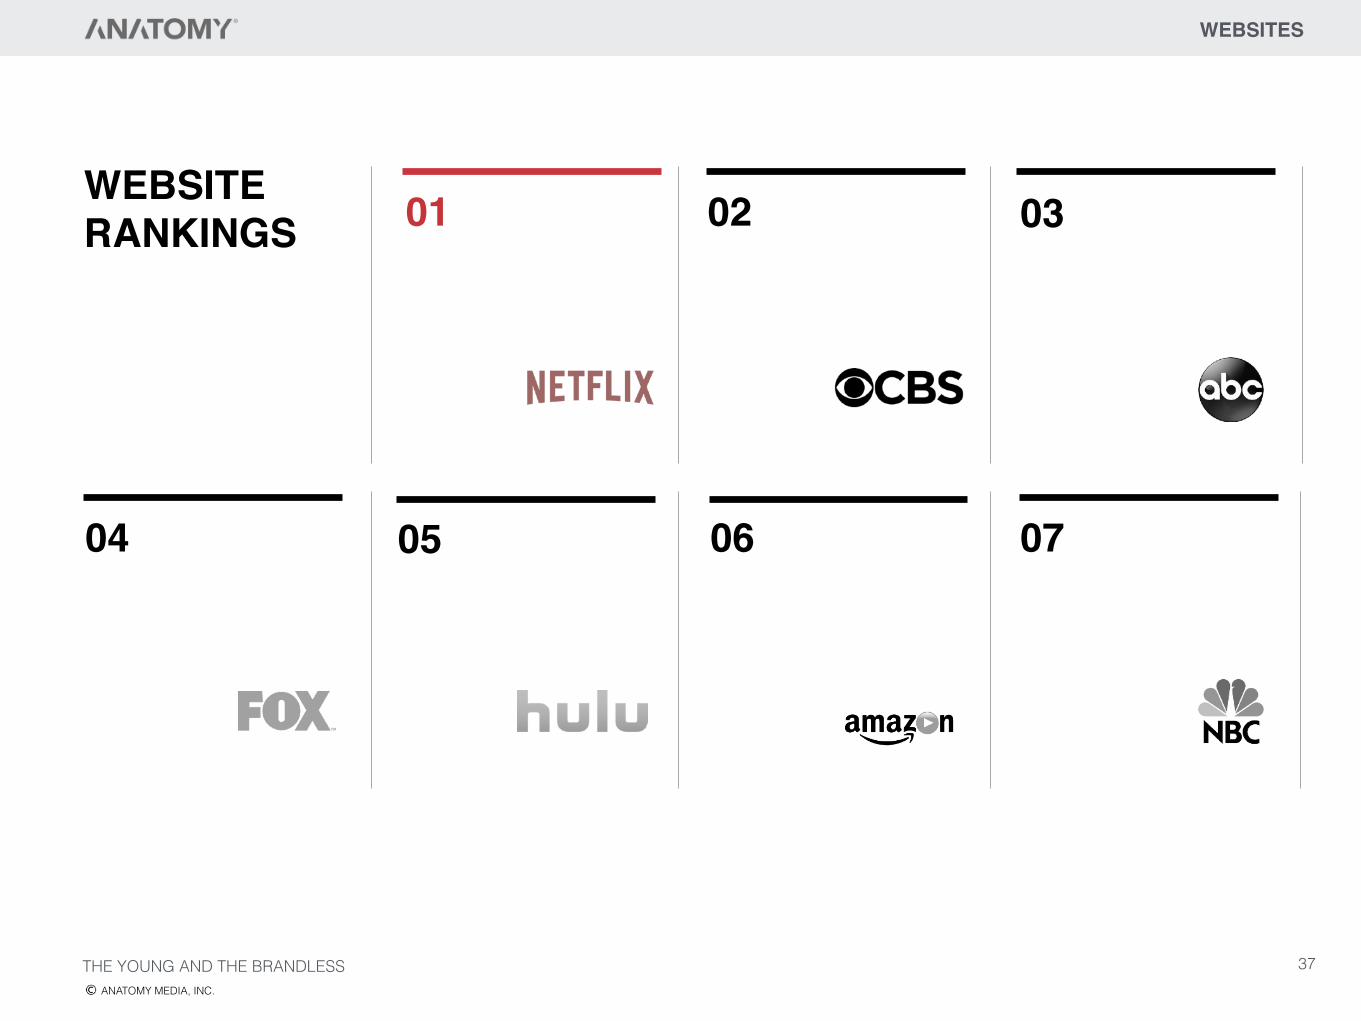
WEBSITERANKINGS 01 02 03
04 05 06 07
THE YOUNG AND THE BRANDLESSANATOMY MEDIA, INC.
37
MOBILE
Mobile growth is explosive. In 2016, the average time users spent in all mobile apps grew by 69%.23 We conducted a qualitative mobile audit of broadcast networks and OTT platforms to assess trends in mobile UI and UX.
In our audit, we examined each network’s mobile app. We found that each app hosts robust content libraries, provided that users have a cable log-on.
ABC is one network that has optimized its UX design within its app. The homepage allows users to scroll through ABC programming by genre. Overall, the app is light on text, so users’ focus is drawn to the key art to drive more sampling.
Here as well we recommend that networks create compelling thumbnails for each piece of content and write succinct descriptions for each program.
The question remains: are apps the optimum solution for networks to maximize viewership on mobile devices? While mobile app usage is growing, most of that growth can be attributed to a handful of high engagement apps owned by a few companies (e.g., Facebook, Netflix, Amazon).24
“Browsers, not apps, are the future of mobile. ”25
The traditional browsers with which everyone is familiar (e.g., Firefox, Safari, Google Chrome, etc.) are no longer the only (or even primary) portal through which people access their Internet content. In much the same way that people sat on couches and channel surfed, people now stare at their phones, accessing their social apps and surf their feed. Ensconced in their social networks, they are comfortable being served up pieces of Internet content curated and contextualized for them by their social circle and the social networks’ algorithm. They don’t need to search out anything. This means media brands must meet viewers where they are — journey to their social network and make it easy for viewers to slide from their feed into network content.
MOBILE: IS THE FUTURE APP BASED?
THE YOUNG AND THE BRANDLESSANATOMY MEDIA, INC.
Additionally, mobile users don’t download many apps—the average mobile user downloads zero apps per month. This presents a paradox for media brands: mobile usage is growing, but user engagement is increasingly concentrated among a handful of apps.
38
MOBILE
THE YOUNG AND THE BRANDLESSANATOMY MEDIA, INC.
While apps are still important, a website can actually provide the same functions as an app, but without requiring the user to expend additional effort to download it. It is in fact easier to direct users to websites from social media than it is to direct them to apps from those same platforms.
To maximize viewership on mobile, networks should meet users where they currently spend most of their time on mobile — social and messaging apps — and direct them to a single location, i.e, the network website.
39
MOBILE
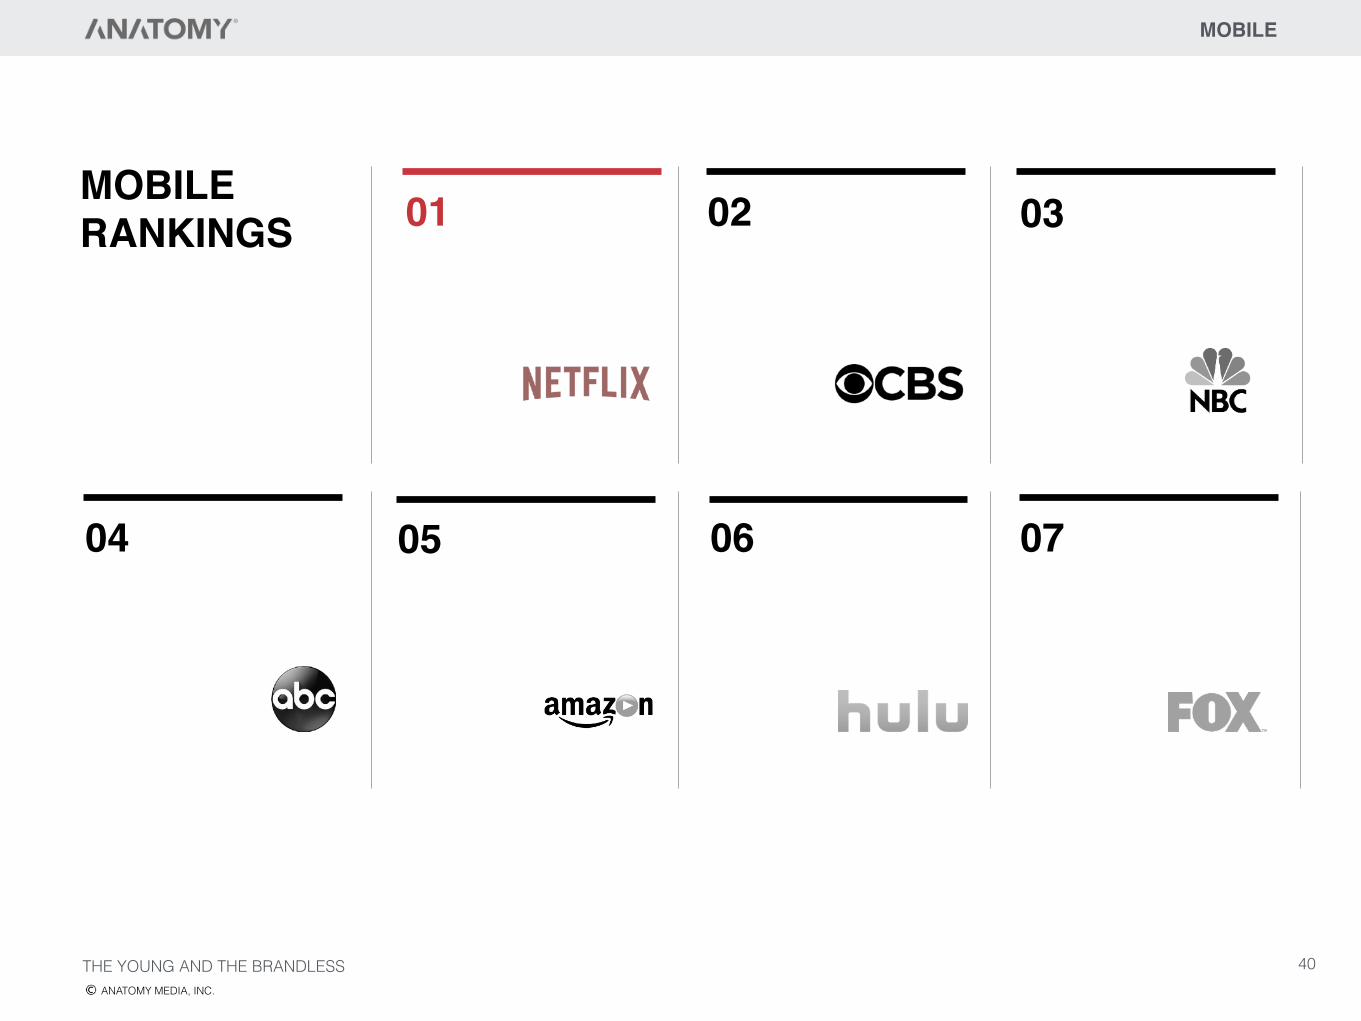
MOBILERANKINGS 01 02 03
04 05 06 07
THE YOUNG AND THE BRANDLESSANATOMY MEDIA, INC.
40
DIGITAL ADS
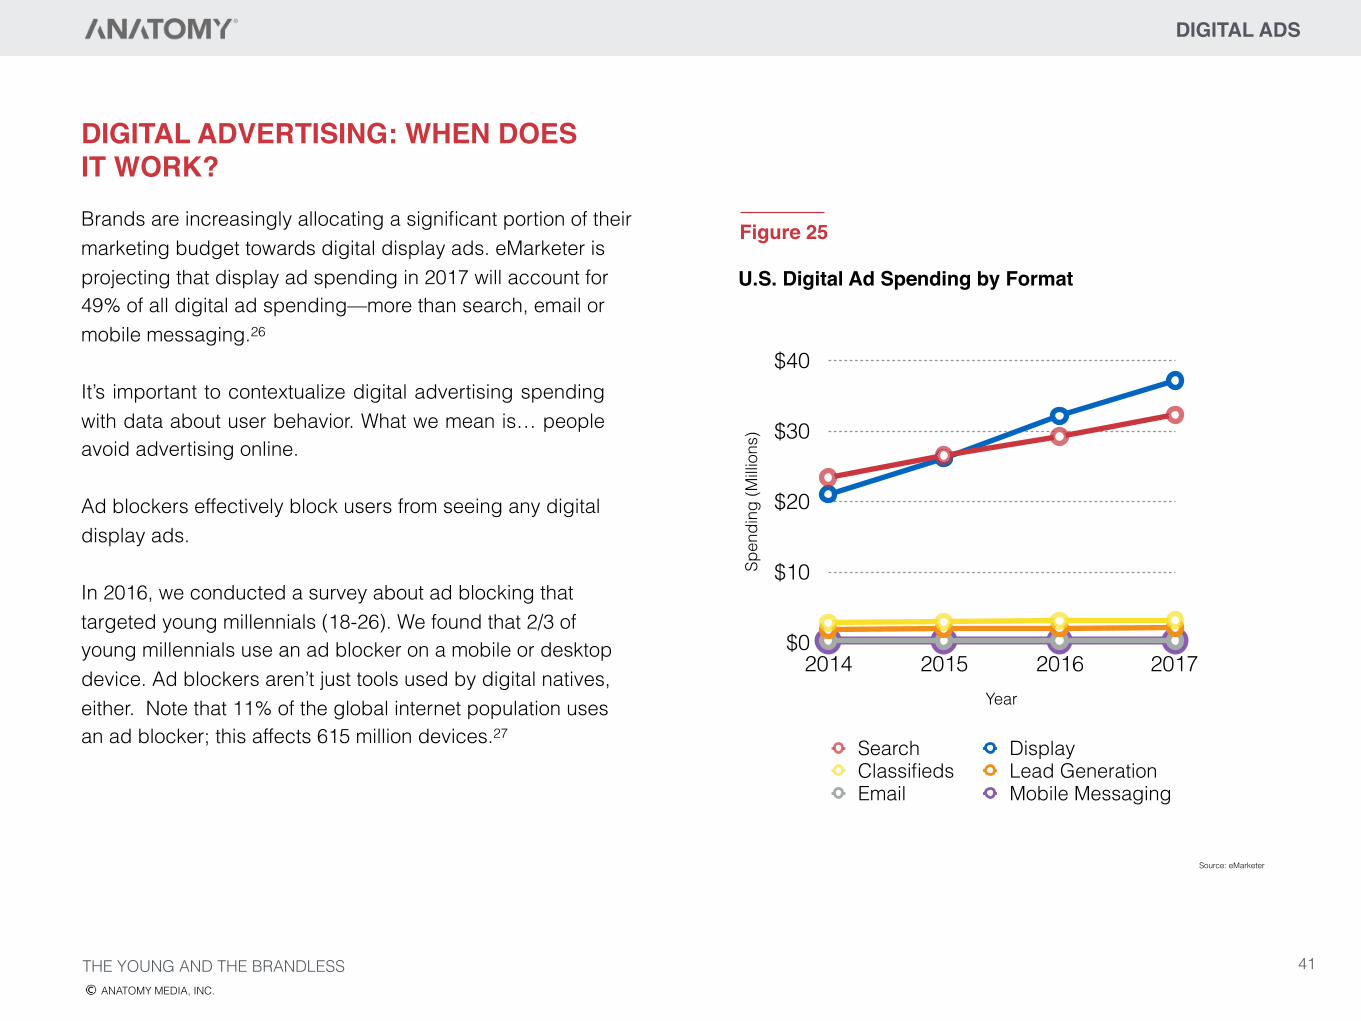
Brands are increasingly allocating a significant portion of their marketing budget towards digital display ads. eMarketer is projecting that display ad spending in 2017 will account for 49% of all digital ad spending—more than search, email or mobile messaging.26
It’s important to contextualize digital advertising spending with data about user behavior. What we mean is… people avoid advertising online.
Ad blockers effectively block users from seeing any digital display ads.
In 2016, we conducted a survey about ad blocking that targeted young millennials (18-26). We found that 2/3 of young millennials use an ad blocker on a mobile or desktop device. Ad blockers aren’t just tools used by digital natives, either. Note that 11% of the global internet population uses an ad blocker; this affects 615 million devices.27
DIGITAL ADVERTISING: WHEN DOES IT WORK?
Spen
ding
(Milli
ons)
$0
$10
$20
$30
$40
Year
2014 2015 2016 2017
Search DisplayClassifieds Lead GenerationEmail Mobile Messaging
U.S. Digital Ad Spending by Format
Source: eMarketer
Figure 25
THE YOUNG AND THE BRANDLESSANATOMY MEDIA, INC.
41
DIGITAL ADS
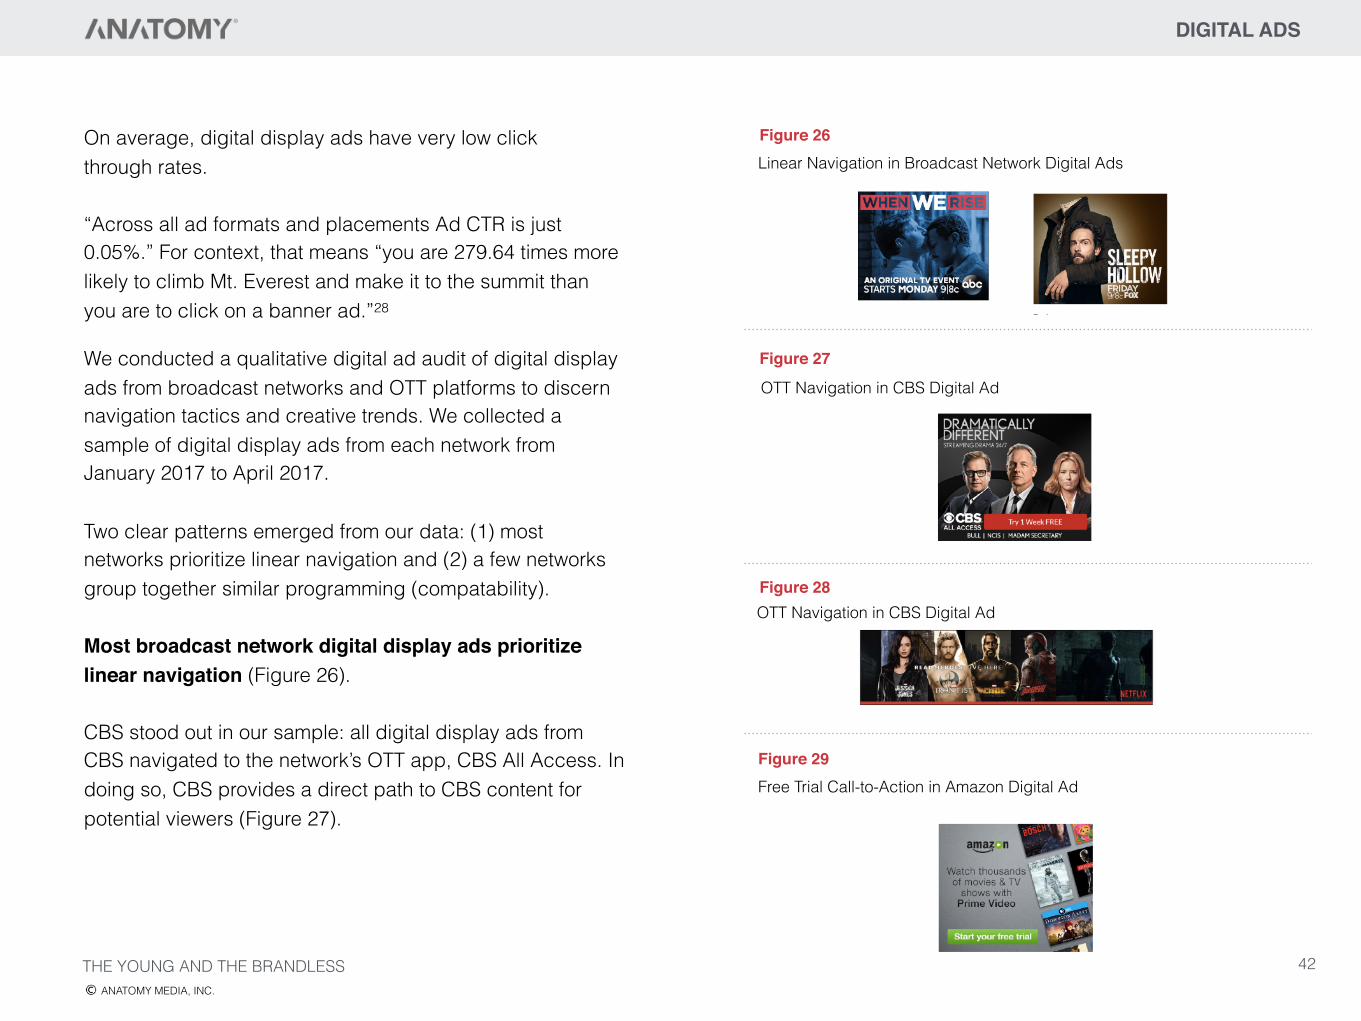
We conducted a qualitative digital ad audit of digital display ads from broadcast networks and OTT platforms to discern navigation tactics and creative trends. We collected a sample of digital display ads from each network from January 2017 to April 2017.
Two clear patterns emerged from our data: (1) most networks prioritize linear navigation and (2) a few networks group together similar programming (compatability).
Most broadcast network digital display ads prioritize linear navigation (Figure 26).
CBS stood out in our sample: all digital display ads from CBS navigated to the network’s OTT app, CBS All Access. In doing so, CBS provides a direct path to CBS content for potential viewers (Figure 27).
Figure 26
Figure 27
Figure 28
Figure 29
Linear Navigation in Broadcast Network Digital Ads
OTT Navigation in CBS Digital Ad
OTT Navigation in CBS Digital Ad
Free Trial Call-to-Action in Amazon Digital Ad
THE YOUNG AND THE BRANDLESSANATOMY MEDIA, INC.
On average, digital display ads have very low click through rates.
“Across all ad formats and placements Ad CTR is just 0.05%.” For context, that means “you are 279.64 times more likely to climb Mt. Everest and make it to the summit than you are to click on a banner ad.”28
42
Some networks group together similar programming (Figure 28).
Pushing ads with talent from multiple programs is not only an economical solution (i.e., 2,3,4 programming ads for the price of one), it’s also a brand-first strategy. Creating ads with multiple programs can reinforce the value of a network brand as a curatorial tool.
OTT platforms and CBS excel at providing calls to action.
OTT platforms (Netflix, Amazon, and Hulu) and CBS consistently provide a call to action to try a free trial of their subscription services (Figure 29). Clear calls to action were less frequent within our sample of ads from ABC, FOX, and NBC.
DIGITAL ADS
THE YOUNG AND THE BRANDLESSANATOMY MEDIA, INC.
Key Takeaways from Digital Advertising Analysis:• Provide clear consistent navigation to digital platforms • Always provide clear calls to action • Always include network branding • Consider creating ads grouping similar programs together
43
DIGITAL ADS
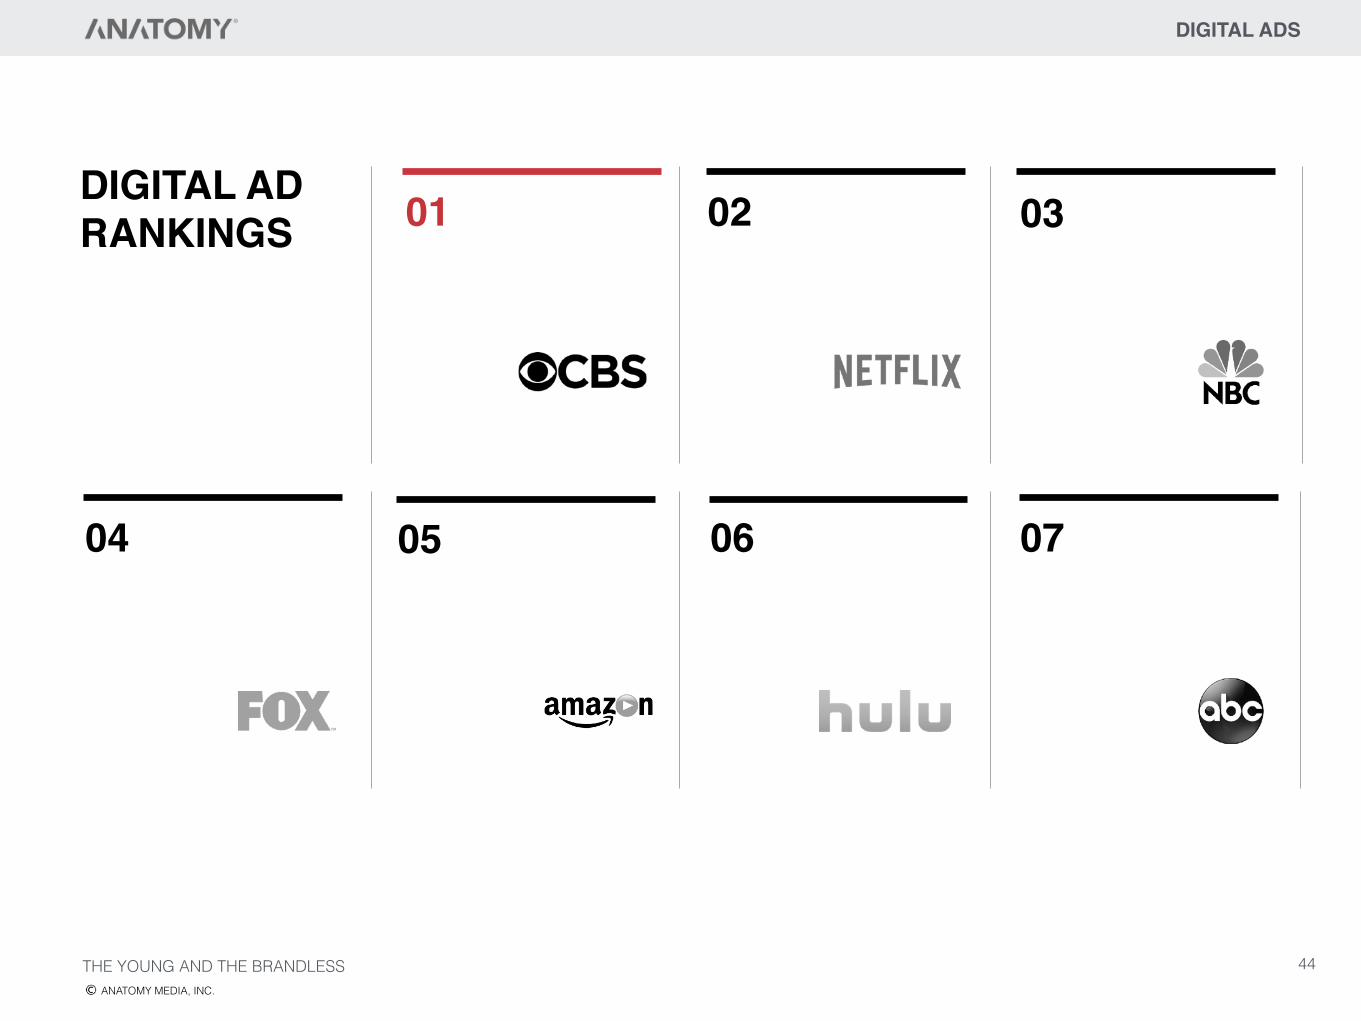
DIGITAL ADRANKINGS 01 02 03
04 05 06 07
THE YOUNG AND THE BRANDLESSANATOMY MEDIA, INC.
44
CONCLUSION
User experience determines the success of media brands in a non-linear multiplatform world. Our research demonstrates that putting the customer experience at the center of promotion strategy maximizes media brands’ ability to communicate their brand value. There are innumerable opportunities for media brands to improve their user experience by fine-tuning promotion strategy, marketing messaging and user interface.
THE YOUNG AND THE BRANDLESSANATOMY MEDIA, INC.
45
THE YOUNG AND THE BRANDLESS
ENDNOTES
1. See Appendix for survey methodology. 2. February 3, 2016 interview at Paley Center for Media;
https://www.youtube.com/watch?v=9QBCoPYm4jg 3. Goldberg, Lesley. “Scripted Originals Hit Record 455 in
2016, FX Study Finds.” The Hollywood Reporter. 2016. http://www.hollywoodreporter.com/live-feed/scripted-originals-hit- record-455- 2016-fx- study-finds- 958337
4. See Appendix for full brand recognition survey methodology.
5. Terry, W. Scott. “Serial position effects in recall of television commercials.” The Journal of general psychology 132.2 (2005): 151-164.
6. Eastman, Susan Tyler and Gregory D. Newton. “The impact of structural salience within on‐air promotion.” Journal of Broadcasting & Electronic Media 42.1 (1998): 50-79.
7. Walters, Kendall. “The Facebook Algorithm: What You Need to Know to Boost Organic Reach.” Hootsuite, 2016.
8. Because each individual network page is likely to have more “likes” than any individual show page, we focused on network pages in our audit. For example, ABC’s Facebook page has 2.5 million likes, while ABC’s American Housewife Facebook page has 350k likes. Reach is much greater on network brand social accounts—affirming the necessity of maintaining network brand equity in an OTT environment.
9. Shah, Saqib. “Facebook is updating the news feed algorithm to get rid of spam and click-bait.” Business Insider. 2017. http://www.businessinsider.com/facebook-updates-news-feed-algorithm- spam-click- bait-2017- 2
10. Warren, Christina. “When are users most active on Facebook?” Mashable. Web. 2010.
11. Wheildon, Collin. Type & Layout: How Typography and Design Can Get Your Message Across or Get in the Way. Strathmoor Press. 1995.
12. Shane. “Chinese User Experience - How We Read on the Web.” Dao Insights. 2015. http://daoinsights.com/chinese-user- experience-how- we-read- on-the- web/
13. Whitenton, Kathryn. “Website Logo Placement for Maximum Brand Recall.” Nielsen Norman Group. 2016. https://www.nngroup.com/articles/logo-placement- brand-recall/
14. Facebook Q3 2016 Results report. https://s21.q4cdn.com/399680738/files/doc_presentations/FB-Q316- Earnings-Slides.pdf
15. https://www.scientificamerican.com/article/why-are- more-people- right/
16. Patel, Sahil. “85% of Facebook video is viewed without sound.” Digiday. 17 May 2016. https://digiday.com/media/silent-world- facebook-video/
17. “How Advertising Works.” The Advertising Research Foundation. 2016. https://thearf.org/tag/how-advertising- works/
18. Sharp, Byron. How Brands Grow. Oxford University Press. 2010.
19. Kagan, Marta. “100 Awesome Marketing Stats, Charts, & Graphs [Data].” Hubspot. 2011. https://blog.hubspot.com/blog/tabid/6307/bid/14416/100-Awesome- Marketing-Stats- Charts-Graphs- Data.aspx#sm.0000hzvpj7dczez3u1x2bplf2eo9a
20. Alsudani, Farah, and Matthew Casey. "The effect of aesthetics on web credibility." Proceedings of the 23rd British HCI Group Annual Conference on People and Computers: Celebrating People and Technology. British Computer Society, 2009.
21. Isinkaye, F. O., Y. O. Folajimi, and B. A. Ojokoh. “Recommendation systems: Principles, methods and evaluation.” Egyptian Informatics Journal 16.3 (2015): 261-273.
22. Roettgers, Janko. “A look behind the curtain: how Netflix redesigned and rebuilt its television experience.” Gigaom. 2014. http://gigaom.com/2014/24/a-look- behind-the-curtain-how- netflix-redesigned-and-rebuilt- its-television- experience/
23. Khalaf, Simon. “On their tenth anniversary, mobile apps start eating their own” Flurry. Yahoo. 2017. http://flurrymobile.tumblr.com/post/155761509355/on-their-tenth-anniversary-mobile- apps-start
24. “The 2016 U.S. Mobile App Report.” ComScore. 2016. 25. Durkin, Hugh. “Browsers, not apps, are the future of
mobile.” Intercom. 2017. https://medium.com/swlh/browsers-not- apps-are- the-future- of-mobile- c552752ff75
26. “Mobile Will Account for 72% of US Digital Ad Spend by 2019.” emarketer. 2015. https://www.emarketer.com/Article/Mobile-Will- Account-72- of-US- Digital-Ad- Spend-by-2019/1012258
27. Cortland, Matthew. “2017 Adblocker Report.” PageFair. 2017.
28. Carlson, Nicholas. “It’s more likely you will survive a plane crash or win the lottery than click on a banner ad.” Business Insider. 2011. http://www.businessinsider.com/its-more-likely-you-will- survive-a- plane-crash- or-win- the-lottery- than-click- a-banner- ad-2011- 6?op=1
29. The brand recognition test methodology was based on scholarly assessments of brand awareness (e.g., Fischer, Paul M., et al. “Brand logo recognition by children aged 3 to 6 years: Mickey Mouse and Old Joe the Camel.”JAMA 266.22 (1991): 3145-3148.; Aaker, David A. Managing brand equity. Simon and Schuster, 2009.)
ANATOMY MEDIA, INC.
46
APPENDIX
Brand Recognition Methodology
The ANATOMY Brand Recognition analysis is based on survey data obtained between December 2016 and April 2017. 3,100 U.S. young millennials (18-26) were surveyed in targeted surveys drawn from nationally representative samples through SurveyMonkey and Google Consumer Surveys.
An aided brand recognition test prompted respondents with an image of an original scripted program’s key art (with no network logo), then respondents were asked to select the correct corresponding network brand from a list of seven choices.29 Brand awareness of seven networks with original scripted programming were evaluated: ABC, CBS, FOX, NBC, AMAZON, HULU, and NETFLIX. Several programs from an array of scripted genres from each network were tested: at least one new program from the 2016-2017 season, at least one well-established highly viewed program, and at least one moderately viewed program.
Discovery Survey Methodology
The ANATOMY Discovery Survey was conducted from December 15 to 28, 2016. We surveyed 1,100 U.S. young millennials (18-26) in a targeted SurveyMonkey survey drawn from a nationally representative sample.
THE YOUNG AND THE BRANDLESSANATOMY MEDIA, INC.
47
Screen Touchpoint Rankings Methodology
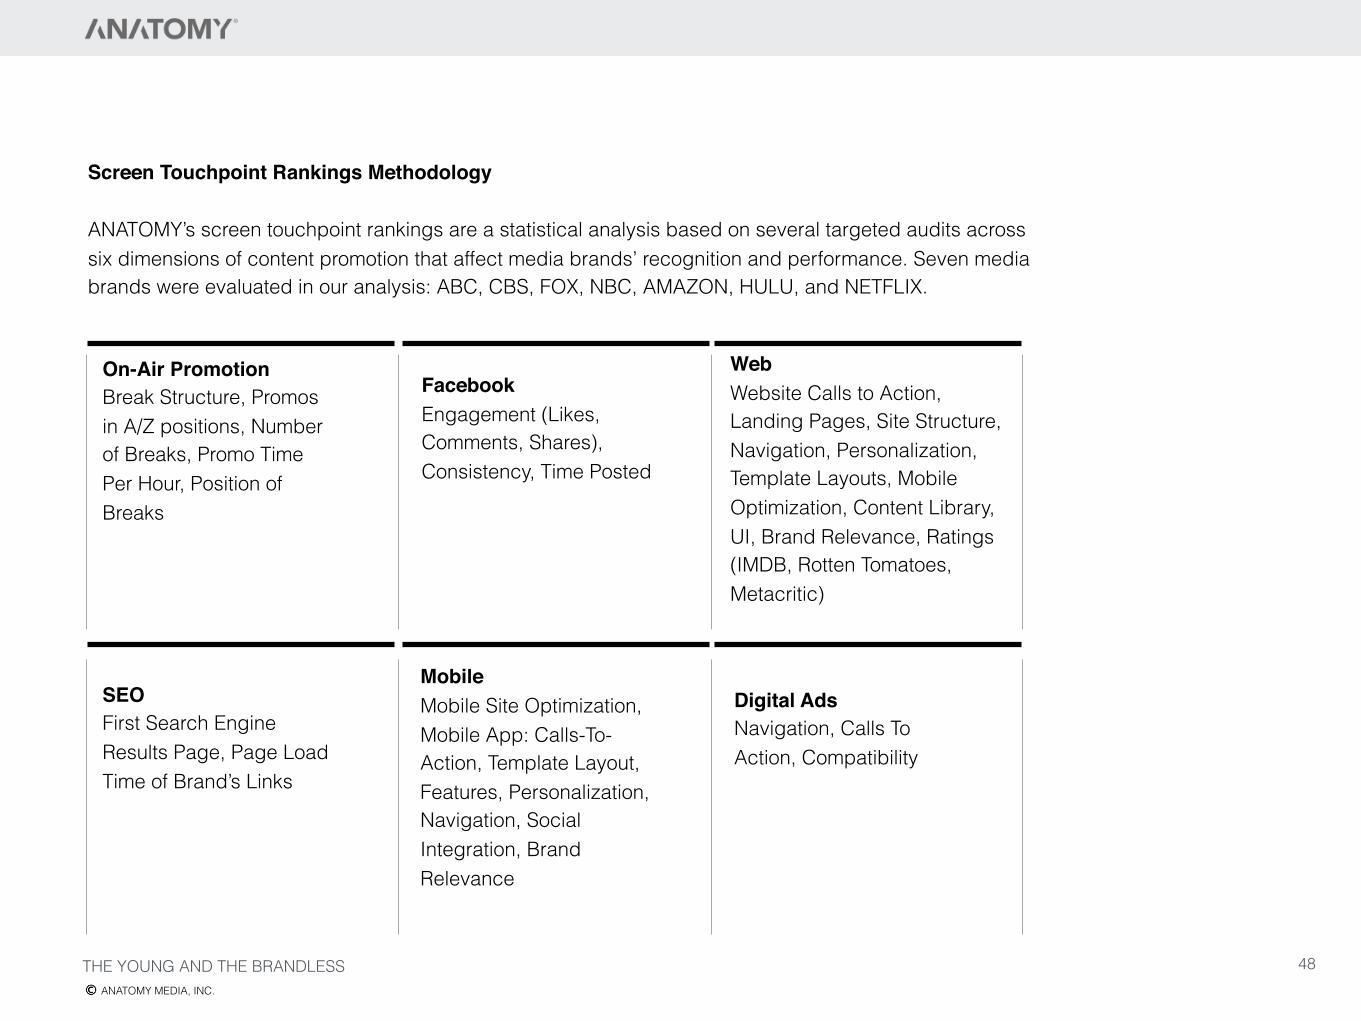
ANATOMY’s screen touchpoint rankings are a statistical analysis based on several targeted audits across six dimensions of content promotion that affect media brands’ recognition and performance. Seven media brands were evaluated in our analysis: ABC, CBS, FOX, NBC, AMAZON, HULU, and NETFLIX.
On-Air Promotion Break Structure, Promos in A/Z positions, Number of Breaks, Promo Time Per Hour, Position of Breaks
FacebookEngagement (Likes, Comments, Shares), Consistency, Time Posted
Web Website Calls to Action, Landing Pages, Site Structure, Navigation, Personalization, Template Layouts, Mobile Optimization, Content Library, UI, Brand Relevance, Ratings (IMDB, Rotten Tomatoes, Metacritic)
Mobile Mobile Site Optimization, Mobile App: Calls-To-Action, Template Layout, Features, Personalization, Navigation, Social Integration, Brand Relevance
SEOFirst Search Engine Results Page, Page Load Time of Brand’s Links
Digital AdsNavigation, Calls To Action, Compatibility
THE YOUNG AND THE BRANDLESSANATOMY MEDIA, INC.
48
THE YOUNG AND THE BRANDLESSANATOMY MEDIA, INC.
ANATOMY is a creative advertising agency and strategic consultancy specializing in entertainment marketing and promotion. ANATOMY activates brands with strategically-minded and thoughtfully-crafted video content, commercials, trailers and brand films. ANATOMY is the recipient of numerous industry awards.
56 West 45th Street, Suite 1602 New York, NY 10036 (212) 944-5510 anatomymedia.com
For more information and media inquiries, please contact: Gabriella Mirabelli [email protected] (212) 944-5510
Gabriella Mirabelli CEO, ANATOMY
Laura DiVergilio Data Analyst
49