Embed Size (px)
Citation preview
You Can Run, but You Can’t Hide: Exposing Network Location forTargeted DoS Attacks in Cellular Networks
Zhiyun Qian1 Zhaoguang Wang1 Qiang Xu1 Z. Morley Mao1 Ming Zhang2 Yi-Min Wang2
1 University of Michigan 2 Microsoft Research
Abstract
An important class of attacks against cellularnetwork infrastructures, i.e., signaling DoS attack,paging channel overload, and channel exhaustionattack, operates by sending low rate data traffic to alarge number of mobile devices at a particular location toexhaust bottleneck resources such as radio resource andradio resource controller. We term this class of attacktargeted DoS attack on cellular networks, given thefocus on a specific location. The success of such attacksdepends on an important but unvalidated assumptionthat it is possible to create a relatively accurate hit listof mobile devices associated with the target networklocation to which attackers can direct traffic. In thisstudy, we take an important first step to validate thisassumption by performing a large-scale study on thefeasibility of these attacks. In addition, we proposeaccurate and efficient techniques for generating IPaddress to network location association in real time forexisting commercial UMTS networks.
Our technique relies on developing and measuringnetwork signatures consisting of both static and dynamicfeatures of key network elements such as Radio NetworkControllers (RNCs) that are stable within the samelocation but distinct across locations. We find that asingle feature in some cases is unique enough to locatea city such as NYC. With as little as 800kbps probe rate,we can identify a sufficient number of IPs to accuratelytarget a network location, after scanning millions of IPswithin 1.2 hours to effectively impose 2.5 to 3.5 times thenormal load on the network.
1 Introduction
Data cellular networks are perennially constrainedby limited radio resources due to ever-increasing userdemand. To enable efficient resource reuse, thereexists built-in support for intelligently allocating radioresources among multiple users and releasing themwhen they are perceived no longer actively in use.
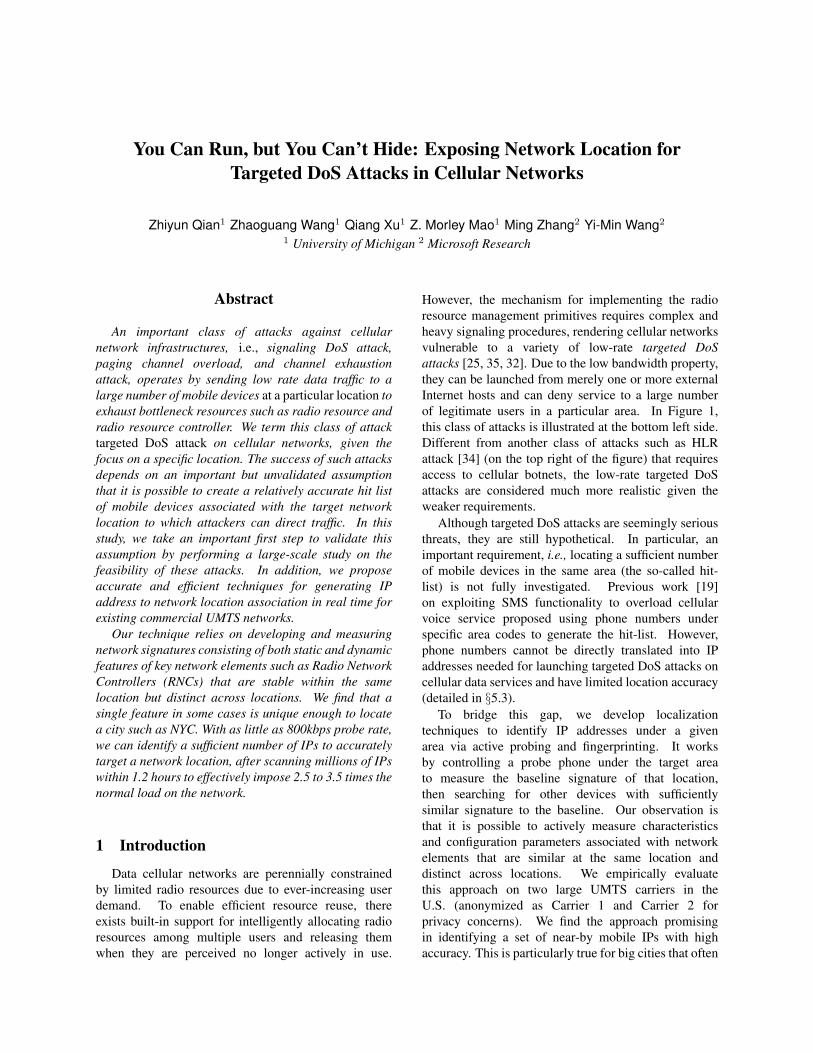
However, the mechanism for implementing the radioresource management primitives requires complex andheavy signaling procedures, rendering cellular networksvulnerable to a variety of low-rate targeted DoSattacks [25, 35, 32]. Due to the low bandwidth property,they can be launched from merely one or more externalInternet hosts and can deny service to a large numberof legitimate users in a particular area. In Figure 1,this class of attacks is illustrated at the bottom left side.Different from another class of attacks such as HLRattack [34] (on the top right of the figure) that requiresaccess to cellular botnets, the low-rate targeted DoSattacks are considered much more realistic given theweaker requirements.
Although targeted DoS attacks are seemingly seriousthreats, they are still hypothetical. In particular, animportant requirement, i.e., locating a sufficient numberof mobile devices in the same area (the so-called hit-list) is not fully investigated. Previous work [19]on exploiting SMS functionality to overload cellularvoice service proposed using phone numbers underspecific area codes to generate the hit-list. However,phone numbers cannot be directly translated into IPaddresses needed for launching targeted DoS attacks oncellular data services and have limited location accuracy(detailed in §5.3).
To bridge this gap, we develop localizationtechniques to identify IP addresses under a givenarea via active probing and fingerprinting. It worksby controlling a probe phone under the target areato measure the baseline signature of that location,then searching for other devices with sufficientlysimilar signature to the baseline. Our observation isthat it is possible to actively measure characteristicsand configuration parameters associated with networkelements that are similar at the same location anddistinct across locations. We empirically evaluatethis approach on two large UMTS carriers in theU.S. (anonymized as Carrier 1 and Carrier 2 forprivacy concerns). We find the approach promisingin identifying a set of near-by mobile IPs with highaccuracy. This is particularly true for big cities that often
have unique configurations or features to satisfy theirload requirement. In certain cases, it is even possibleto uniquely identify a big city such as NYC with onlya single feature. Thus, our work demonstrates that thethreat of targeted DoS attacks is real.
Besides exposing the potential abuse of networkinformation to enable this class of targeted attackagainst cellular networks, our technique can alsosupport legitimate privacy-preserving applications thatrely to the knowledge of the number of nearbyusers to determine whether a user should sendhis location information while ensuring k-anonymousproperties [21]. More generally, our techniqueopens up a new direction in understanding howcritical infrastructures like cellular networks can leakinformation about their networks which leads to privacyimplications, e.g., in the form of location exposure.
In this work, we make the following contributions:• We conduct the first large-scale empirical study onthe feasibility of targeted DoS attack against commercialcellular data networks (with overview shown in Table 1),using data collected through our deployed mobile appon major smartphone platforms (with details of the appcovered in §3). We show that 80% of the devices keeptheir device IPs for more than 4 hours, leaving ampletime for attack reconnaissance.• We develop novel techniques to map IP addressesof mobile devices to a geographic area, usinga combination of network features including staticconfiguration settings, topological properties, anddynamic features.• Using the proposed network signatures, weempirically validate the evidence of diverse networksignatures across Radio Network Controllers (RNCs).We show that in big cities, the signature is typicallyunique enough to allow an attacker to locate enoughIPs to impose 2.5 to 3.5 times the normal load on thenetwork.
The rest of the paper is organized as follows. §2presents the background on UMTS network as wellas the attack overview, followed by the IP-relatedfeasibility analysis in §3. §4 describes the methodologyfor localization, and §5 discusses the evaluation results.Possible defense solutions are described in §6. Finallywe cover the related work in §7 and conclude in §8.
2 Background and Overview
In this section, we first describe the UMTSbackground with a focus on the measurable parameterswhich can be configured differently across networklocations. We then discuss the intuition of the techniqueand the detailed steps of the attack.
2.1 UMTS Background
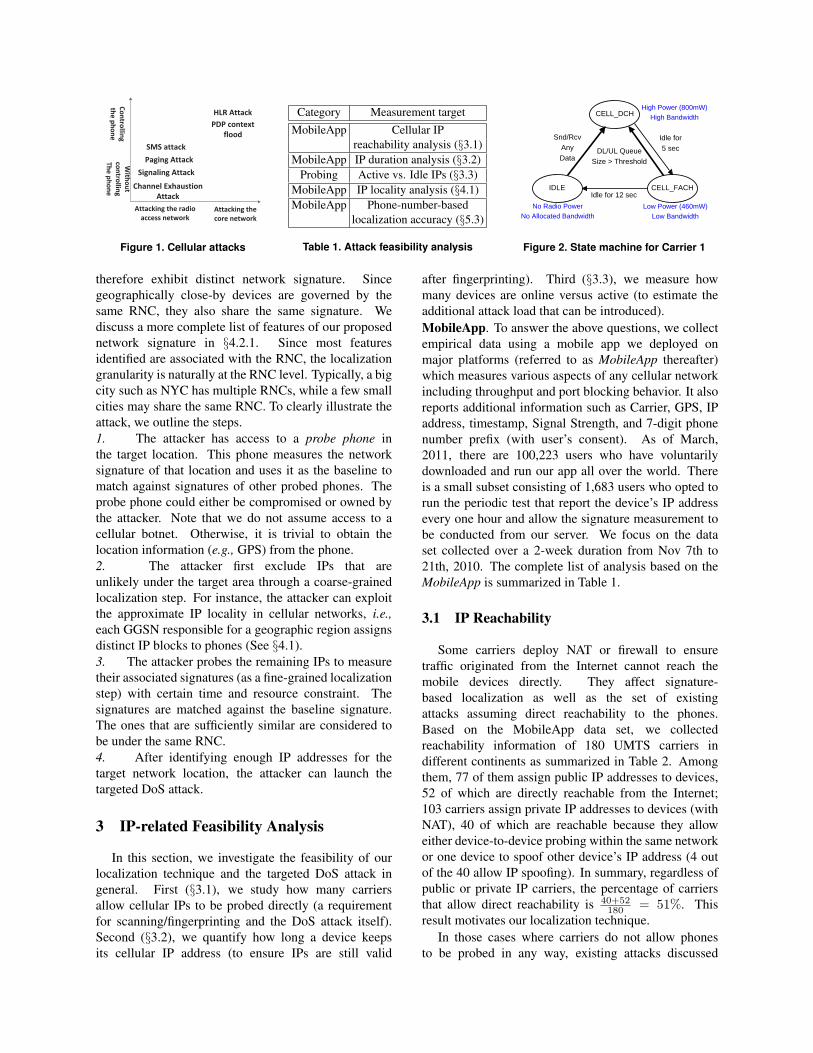
UMTS architecture. A UMTS network consists ofthree subsystems: Devices, Radio Access Network andCore Network [24]. They form a hierarchical structurewhere the lowest layer is the device, followed by radioaccess network consisting of base-stations and RadioNetwork Controllers (RNCs). At the highest level is theCore Network which has Serving GPRS Support Node(SGSN) and Gateway GPRS Support Node (GGSN).The latter connects to the Internet. Our focus is on theradio access network—the DoS target.Radio Resource Control and State Machine. InUMTS, to efficiently utilize the limited radio resources(i.e., physical communication channels), the radioresource control (RRC) protocol uses a state machine(shown in Figure 2) associated with each devicetypically with three RRC states—IDLE, CELL DCH(or DCH) and CELL FACH (or FACH). Different stateshave different amount of radio resource assigned. IDLEhas no radio resource allocated. To send or receive anytraffic, it has to promote to DCH where a dedicatedchannel is assigned to the device. In FACH, devicesare assigned a shared channel which only provideslimited throughput (less than 20kbps). It is designedfor applications requiring a very low data rate. Thereare several configurable static parameters associatedwith state transitions. For example, Downlink/Uplink(DL/UL) Radio Link Controller (RLC) buffer size isused to determine when the FACH → DCH transitionoccurs (we refer to it as queue size thresholdthereafter). If the number of bytes sent or receivedexceeds the threshold, the state transition will betriggered. Another example is the inactivity timerwhich determines when the DCH → FACH transitionoccurs. They are all configured at the RNC and maydiffer across RNCs in different locations, making themgood candidates to construct the network signatures.Note that different RNC implementations may alsoemploy slightly different state machines due to vendordifferences. For instance, there could be a IDLE →FACH transition instead of IDLE → DCH. In somecases, new states (e.g., CELL PCH) are introduced tofurther optimize radio resource. These differences canalso be part of the signatures.
It is worth mentioning that in the next generationLTE networks, similar resource control mechanism andcontrol parameters also exist [5].
2.2 Attack Outline
RNC-level Localization. At a high level, ourintuition is that network elements (e.g., RNC) indifferent locations may be configured differently,
Signaling Attack
HLR Attack
Paging Attack
Channel Exhaustion
Attack
With
ou
t
con
trollin
g
Th
e p
ho
ne
Co
ntro
lling
the
ph
on
e
Attacking the radio
access network
Attacking the
core network
PDP context
flood
SMS attack
Figure 1. Cellular attacks
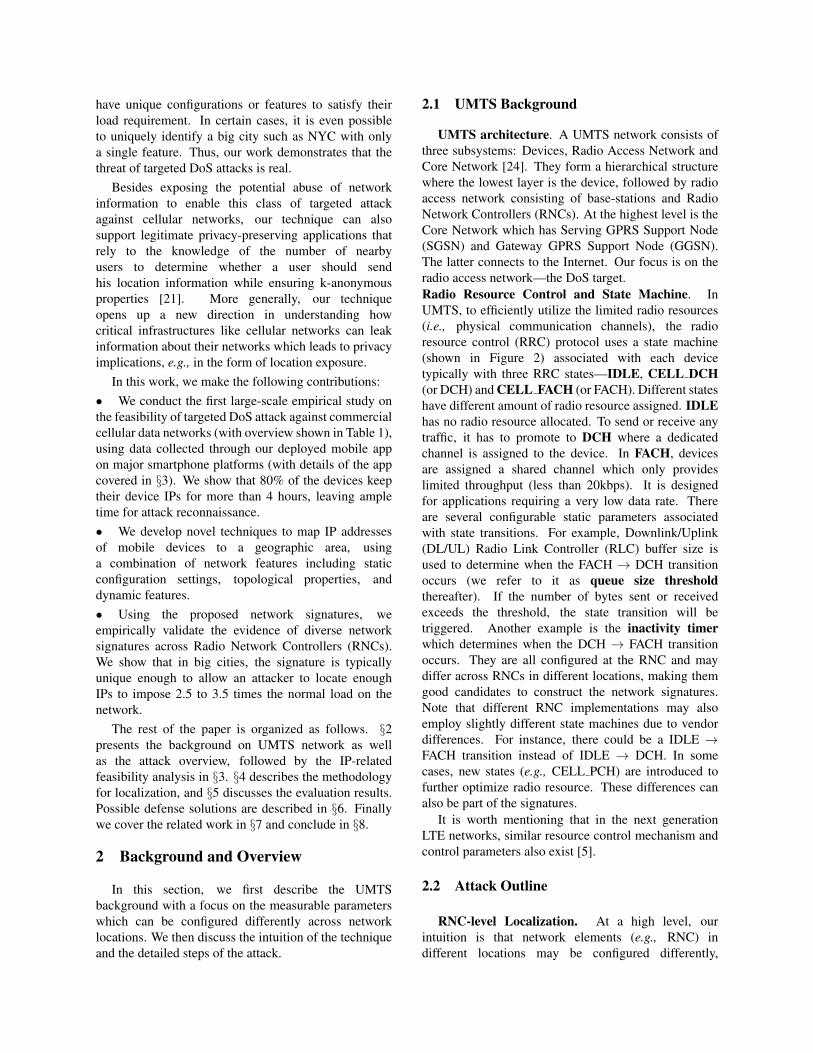
Category Measurement targetMobileApp Cellular IP
reachability analysis (§3.1)MobileApp IP duration analysis (§3.2)
Probing Active vs. Idle IPs (§3.3)MobileApp IP locality analysis (§4.1)MobileApp Phone-number-based
localization accuracy (§5.3)
Table 1. Attack feasibility analysis
CELL_DCH
CELL_FACHIDLEIdle for 12 sec
Idle for5 secDL/UL Queue
Size > Threshold
Snd/RcvAnyData
High Power (800mW)High Bandwidth
Low Power (460mW)Low Bandwidth
No Radio PowerNo Allocated Bandwidth
Figure 2. State machine for Carrier 1
therefore exhibit distinct network signature. Sincegeographically close-by devices are governed by thesame RNC, they also share the same signature. Wediscuss a more complete list of features of our proposednetwork signature in §4.2.1. Since most featuresidentified are associated with the RNC, the localizationgranularity is naturally at the RNC level. Typically, a bigcity such as NYC has multiple RNCs, while a few smallcities may share the same RNC. To clearly illustrate theattack, we outline the steps.1. The attacker has access to a probe phone inthe target location. This phone measures the networksignature of that location and uses it as the baseline tomatch against signatures of other probed phones. Theprobe phone could either be compromised or owned bythe attacker. Note that we do not assume access to acellular botnet. Otherwise, it is trivial to obtain thelocation information (e.g., GPS) from the phone.2. The attacker first exclude IPs that areunlikely under the target area through a coarse-grainedlocalization step. For instance, the attacker can exploitthe approximate IP locality in cellular networks, i.e.,each GGSN responsible for a geographic region assignsdistinct IP blocks to phones (See §4.1).3. The attacker probes the remaining IPs to measuretheir associated signatures (as a fine-grained localizationstep) with certain time and resource constraint. Thesignatures are matched against the baseline signature.The ones that are sufficiently similar are considered tobe under the same RNC.4. After identifying enough IP addresses for thetarget network location, the attacker can launch thetargeted DoS attack.
3 IP-related Feasibility Analysis
In this section, we investigate the feasibility of ourlocalization technique and the targeted DoS attack ingeneral. First (§3.1), we study how many carriersallow cellular IPs to be probed directly (a requirementfor scanning/fingerprinting and the DoS attack itself).Second (§3.2), we quantify how long a device keepsits cellular IP address (to ensure IPs are still valid
after fingerprinting). Third (§3.3), we measure howmany devices are online versus active (to estimate theadditional attack load that can be introduced).MobileApp. To answer the above questions, we collectempirical data using a mobile app we deployed onmajor platforms (referred to as MobileApp thereafter)which measures various aspects of any cellular networkincluding throughput and port blocking behavior. It alsoreports additional information such as Carrier, GPS, IPaddress, timestamp, Signal Strength, and 7-digit phonenumber prefix (with user’s consent). As of March,2011, there are 100,223 users who have voluntarilydownloaded and run our app all over the world. Thereis a small subset consisting of 1,683 users who opted torun the periodic test that report the device’s IP addressevery one hour and allow the signature measurement tobe conducted from our server. We focus on the dataset collected over a 2-week duration from Nov 7th to21th, 2010. The complete list of analysis based on theMobileApp is summarized in Table 1.
3.1 IP Reachability
Some carriers deploy NAT or firewall to ensuretraffic originated from the Internet cannot reach themobile devices directly. They affect signature-based localization as well as the set of existingattacks assuming direct reachability to the phones.Based on the MobileApp data set, we collectedreachability information of 180 UMTS carriers indifferent continents as summarized in Table 2. Amongthem, 77 of them assign public IP addresses to devices,52 of which are directly reachable from the Internet;103 carriers assign private IP addresses to devices (withNAT), 40 of which are reachable because they alloweither device-to-device probing within the same networkor one device to spoof other device’s IP address (4 outof the 40 allow IP spoofing). In summary, regardless ofpublic or private IP carriers, the percentage of carriersthat allow direct reachability is 40+52
180 = 51%. Thisresult motivates our localization technique.
In those cases where carriers do not allow phonesto be probed in any way, existing attacks discussed
Carrier Private IP Public IPcount Reachable1 Not Reachable Not180 40 63 52 25
1 In-NAT device-to-device probe allowed
Table 2. Reachability for 180 UMTScarriers.
0 0.1 0.2 0.3 0.4 0.5 0.6 0.7 0.8 0.9
1
0 10 20 30 40 50 60 70 80 90
CD
F
IP duration (hour)
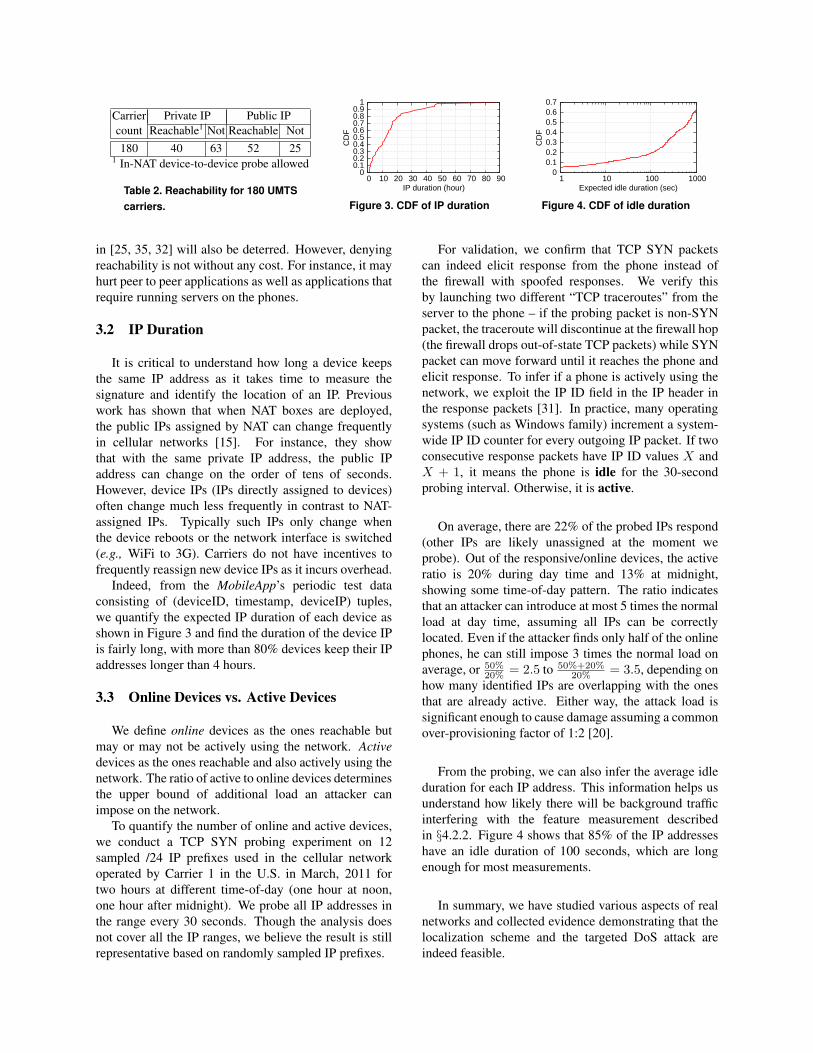
Figure 3. CDF of IP duration
0 0.1 0.2 0.3 0.4 0.5 0.6 0.7
1 10 100 1000
CD
F
Expected idle duration (sec)
Figure 4. CDF of idle duration
in [25, 35, 32] will also be deterred. However, denyingreachability is not without any cost. For instance, it mayhurt peer to peer applications as well as applications thatrequire running servers on the phones.
3.2 IP Duration
It is critical to understand how long a device keepsthe same IP address as it takes time to measure thesignature and identify the location of an IP. Previouswork has shown that when NAT boxes are deployed,the public IPs assigned by NAT can change frequentlyin cellular networks [15]. For instance, they showthat with the same private IP address, the public IPaddress can change on the order of tens of seconds.However, device IPs (IPs directly assigned to devices)often change much less frequently in contrast to NAT-assigned IPs. Typically such IPs only change whenthe device reboots or the network interface is switched(e.g., WiFi to 3G). Carriers do not have incentives tofrequently reassign new device IPs as it incurs overhead.
Indeed, from the MobileApp’s periodic test dataconsisting of (deviceID, timestamp, deviceIP) tuples,we quantify the expected IP duration of each device asshown in Figure 3 and find the duration of the device IPis fairly long, with more than 80% devices keep their IPaddresses longer than 4 hours.
3.3 Online Devices vs. Active Devices
We define online devices as the ones reachable butmay or may not be actively using the network. Activedevices as the ones reachable and also actively using thenetwork. The ratio of active to online devices determinesthe upper bound of additional load an attacker canimpose on the network.
To quantify the number of online and active devices,we conduct a TCP SYN probing experiment on 12sampled /24 IP prefixes used in the cellular networkoperated by Carrier 1 in the U.S. in March, 2011 fortwo hours at different time-of-day (one hour at noon,one hour after midnight). We probe all IP addresses inthe range every 30 seconds. Though the analysis doesnot cover all the IP ranges, we believe the result is stillrepresentative based on randomly sampled IP prefixes.
For validation, we confirm that TCP SYN packetscan indeed elicit response from the phone instead ofthe firewall with spoofed responses. We verify thisby launching two different “TCP traceroutes” from theserver to the phone – if the probing packet is non-SYNpacket, the traceroute will discontinue at the firewall hop(the firewall drops out-of-state TCP packets) while SYNpacket can move forward until it reaches the phone andelicit response. To infer if a phone is actively using thenetwork, we exploit the IP ID field in the IP header inthe response packets [31]. In practice, many operatingsystems (such as Windows family) increment a system-wide IP ID counter for every outgoing IP packet. If twoconsecutive response packets have IP ID values X andX + 1, it means the phone is idle for the 30-secondprobing interval. Otherwise, it is active.
On average, there are 22% of the probed IPs respond(other IPs are likely unassigned at the moment weprobe). Out of the responsive/online devices, the activeratio is 20% during day time and 13% at midnight,showing some time-of-day pattern. The ratio indicatesthat an attacker can introduce at most 5 times the normalload at day time, assuming all IPs can be correctlylocated. Even if the attacker finds only half of the onlinephones, he can still impose 3 times the normal load onaverage, or 50%
20% = 2.5 to 50%+20%20% = 3.5, depending on
how many identified IPs are overlapping with the onesthat are already active. Either way, the attack load issignificant enough to cause damage assuming a commonover-provisioning factor of 1:2 [20].
From the probing, we can also infer the average idleduration for each IP address. This information helps usunderstand how likely there will be background trafficinterfering with the feature measurement describedin §4.2.2. Figure 4 shows that 85% of the IP addresseshave an idle duration of 100 seconds, which are longenough for most measurements.
In summary, we have studied various aspects of realnetworks and collected evidence demonstrating that thelocalization scheme and the targeted DoS attack areindeed feasible.
25
30
35
40
45
50
-120 -110 -100 -90 -80 -70
Latit
ude
Longitude
X.[64-82].X.XX.[10-31].X.X
X.[128-147].X.X
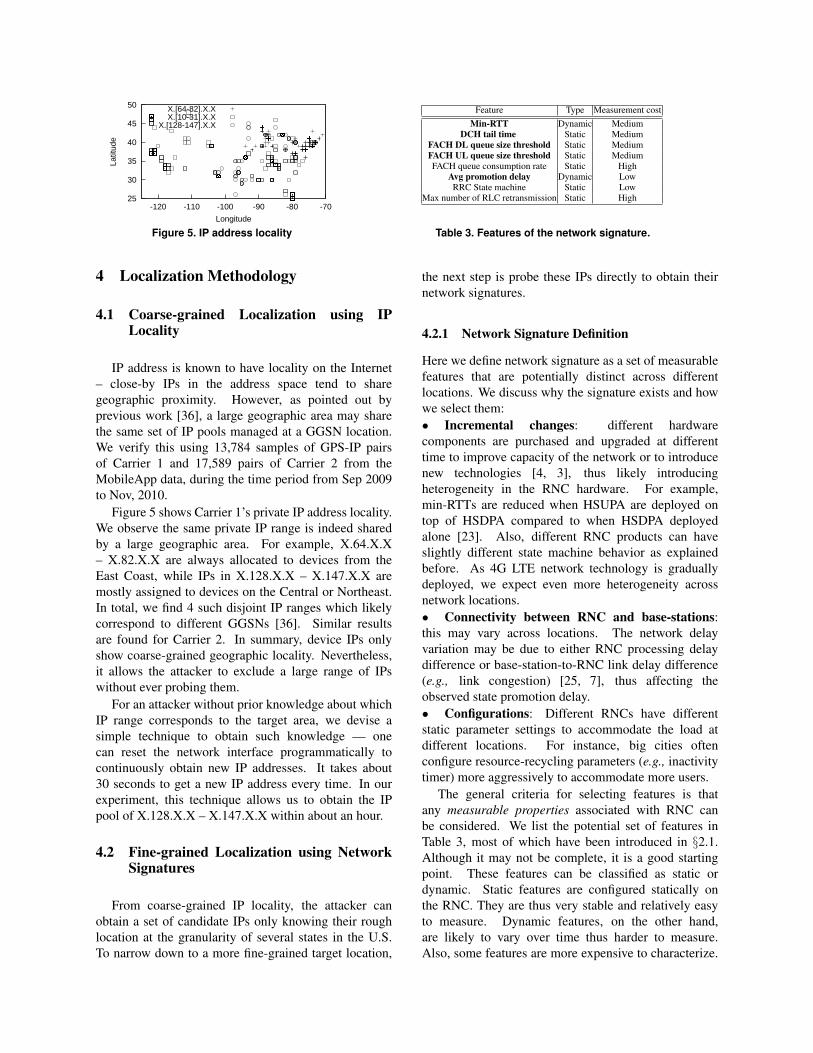
Figure 5. IP address locality
Feature Type Measurement costMin-RTT Dynamic Medium
DCH tail time Static MediumFACH DL queue size threshold Static MediumFACH UL queue size threshold Static MediumFACH queue consumption rate Static High
Avg promotion delay Dynamic LowRRC State machine Static Low
Max number of RLC retransmission Static High
Table 3. Features of the network signature.
4 Localization Methodology
4.1 Coarsegrained Localization using IPLocality
IP address is known to have locality on the Internet– close-by IPs in the address space tend to sharegeographic proximity. However, as pointed out byprevious work [36], a large geographic area may sharethe same set of IP pools managed at a GGSN location.We verify this using 13,784 samples of GPS-IP pairsof Carrier 1 and 17,589 pairs of Carrier 2 from theMobileApp data, during the time period from Sep 2009to Nov, 2010.
Figure 5 shows Carrier 1’s private IP address locality.We observe the same private IP range is indeed sharedby a large geographic area. For example, X.64.X.X– X.82.X.X are always allocated to devices from theEast Coast, while IPs in X.128.X.X – X.147.X.X aremostly assigned to devices on the Central or Northeast.In total, we find 4 such disjoint IP ranges which likelycorrespond to different GGSNs [36]. Similar resultsare found for Carrier 2. In summary, device IPs onlyshow coarse-grained geographic locality. Nevertheless,it allows the attacker to exclude a large range of IPswithout ever probing them.
For an attacker without prior knowledge about whichIP range corresponds to the target area, we devise asimple technique to obtain such knowledge — onecan reset the network interface programmatically tocontinuously obtain new IP addresses. It takes about30 seconds to get a new IP address every time. In ourexperiment, this technique allows us to obtain the IPpool of X.128.X.X – X.147.X.X within about an hour.
4.2 Finegrained Localization using NetworkSignatures
From coarse-grained IP locality, the attacker canobtain a set of candidate IPs only knowing their roughlocation at the granularity of several states in the U.S.To narrow down to a more fine-grained target location,
the next step is probe these IPs directly to obtain theirnetwork signatures.
4.2.1 Network Signature Definition
Here we define network signature as a set of measurablefeatures that are potentially distinct across differentlocations. We discuss why the signature exists and howwe select them:• Incremental changes: different hardwarecomponents are purchased and upgraded at differenttime to improve capacity of the network or to introducenew technologies [4, 3], thus likely introducingheterogeneity in the RNC hardware. For example,min-RTTs are reduced when HSUPA are deployed ontop of HSDPA compared to when HSDPA deployedalone [23]. Also, different RNC products can haveslightly different state machine behavior as explainedbefore. As 4G LTE network technology is graduallydeployed, we expect even more heterogeneity acrossnetwork locations.• Connectivity between RNC and base-stations:this may vary across locations. The network delayvariation may be due to either RNC processing delaydifference or base-station-to-RNC link delay difference(e.g., link congestion) [25, 7], thus affecting theobserved state promotion delay.• Configurations: Different RNCs have differentstatic parameter settings to accommodate the load atdifferent locations. For instance, big cities oftenconfigure resource-recycling parameters (e.g., inactivitytimer) more aggressively to accommodate more users.
The general criteria for selecting features is thatany measurable properties associated with RNC canbe considered. We list the potential set of features inTable 3, most of which have been introduced in §2.1.Although it may not be complete, it is a good startingpoint. These features can be classified as static ordynamic. Static features are configured statically onthe RNC. They are thus very stable and relatively easyto measure. Dynamic features, on the other hand,are likely to vary over time thus harder to measure.Also, some features are more expensive to characterize.
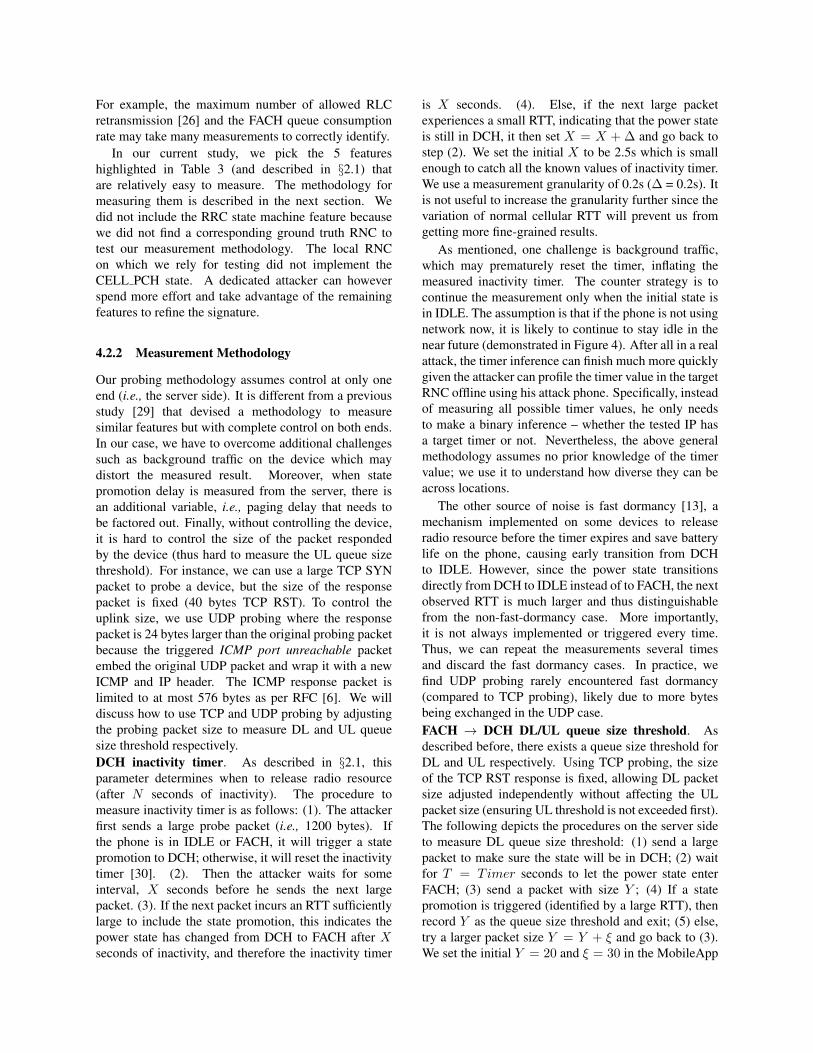
For example, the maximum number of allowed RLCretransmission [26] and the FACH queue consumptionrate may take many measurements to correctly identify.
In our current study, we pick the 5 featureshighlighted in Table 3 (and described in §2.1) thatare relatively easy to measure. The methodology formeasuring them is described in the next section. Wedid not include the RRC state machine feature becausewe did not find a corresponding ground truth RNC totest our measurement methodology. The local RNCon which we rely for testing did not implement theCELL PCH state. A dedicated attacker can howeverspend more effort and take advantage of the remainingfeatures to refine the signature.
4.2.2 Measurement Methodology
Our probing methodology assumes control at only oneend (i.e., the server side). It is different from a previousstudy [29] that devised a methodology to measuresimilar features but with complete control on both ends.In our case, we have to overcome additional challengessuch as background traffic on the device which maydistort the measured result. Moreover, when statepromotion delay is measured from the server, there isan additional variable, i.e., paging delay that needs tobe factored out. Finally, without controlling the device,it is hard to control the size of the packet respondedby the device (thus hard to measure the UL queue sizethreshold). For instance, we can use a large TCP SYNpacket to probe a device, but the size of the responsepacket is fixed (40 bytes TCP RST). To control theuplink size, we use UDP probing where the responsepacket is 24 bytes larger than the original probing packetbecause the triggered ICMP port unreachable packetembed the original UDP packet and wrap it with a newICMP and IP header. The ICMP response packet islimited to at most 576 bytes as per RFC [6]. We willdiscuss how to use TCP and UDP probing by adjustingthe probing packet size to measure DL and UL queuesize threshold respectively.DCH inactivity timer. As described in §2.1, thisparameter determines when to release radio resource(after N seconds of inactivity). The procedure tomeasure inactivity timer is as follows: (1). The attackerfirst sends a large probe packet (i.e., 1200 bytes). Ifthe phone is in IDLE or FACH, it will trigger a statepromotion to DCH; otherwise, it will reset the inactivitytimer [30]. (2). Then the attacker waits for someinterval, X seconds before he sends the next largepacket. (3). If the next packet incurs an RTT sufficientlylarge to include the state promotion, this indicates thepower state has changed from DCH to FACH after Xseconds of inactivity, and therefore the inactivity timer
is X seconds. (4). Else, if the next large packetexperiences a small RTT, indicating that the power stateis still in DCH, it then set X = X + ∆ and go back tostep (2). We set the initial X to be 2.5s which is smallenough to catch all the known values of inactivity timer.We use a measurement granularity of 0.2s (∆ = 0.2s). Itis not useful to increase the granularity further since thevariation of normal cellular RTT will prevent us fromgetting more fine-grained results.
As mentioned, one challenge is background traffic,which may prematurely reset the timer, inflating themeasured inactivity timer. The counter strategy is tocontinue the measurement only when the initial state isin IDLE. The assumption is that if the phone is not usingnetwork now, it is likely to continue to stay idle in thenear future (demonstrated in Figure 4). After all in a realattack, the timer inference can finish much more quicklygiven the attacker can profile the timer value in the targetRNC offline using his attack phone. Specifically, insteadof measuring all possible timer values, he only needsto make a binary inference – whether the tested IP hasa target timer or not. Nevertheless, the above generalmethodology assumes no prior knowledge of the timervalue; we use it to understand how diverse they can beacross locations.
The other source of noise is fast dormancy [13], amechanism implemented on some devices to releaseradio resource before the timer expires and save batterylife on the phone, causing early transition from DCHto IDLE. However, since the power state transitionsdirectly from DCH to IDLE instead of to FACH, the nextobserved RTT is much larger and thus distinguishablefrom the non-fast-dormancy case. More importantly,it is not always implemented or triggered every time.Thus, we can repeat the measurements several timesand discard the fast dormancy cases. In practice, wefind UDP probing rarely encountered fast dormancy(compared to TCP probing), likely due to more bytesbeing exchanged in the UDP case.FACH → DCH DL/UL queue size threshold. Asdescribed before, there exists a queue size threshold forDL and UL respectively. Using TCP probing, the sizeof the TCP RST response is fixed, allowing DL packetsize adjusted independently without affecting the ULpacket size (ensuring UL threshold is not exceeded first).The following depicts the procedures on the server sideto measure DL queue size threshold: (1) send a largepacket to make sure the state will be in DCH; (2) waitfor T = Timer seconds to let the power state enterFACH; (3) send a packet with size Y ; (4) If a statepromotion is triggered (identified by a large RTT), thenrecord Y as the queue size threshold and exit; (5) else,try a larger packet size Y = Y + ξ and go back to (3).We set the initial Y = 20 and ξ = 30 in the MobileApp
Server: Start probing
Phone: paging wakup
Paging delay
Paging wakup Paging wakup
Paging cycle Promotion delay
Receive reply
Send reply
Observed RTT
Time
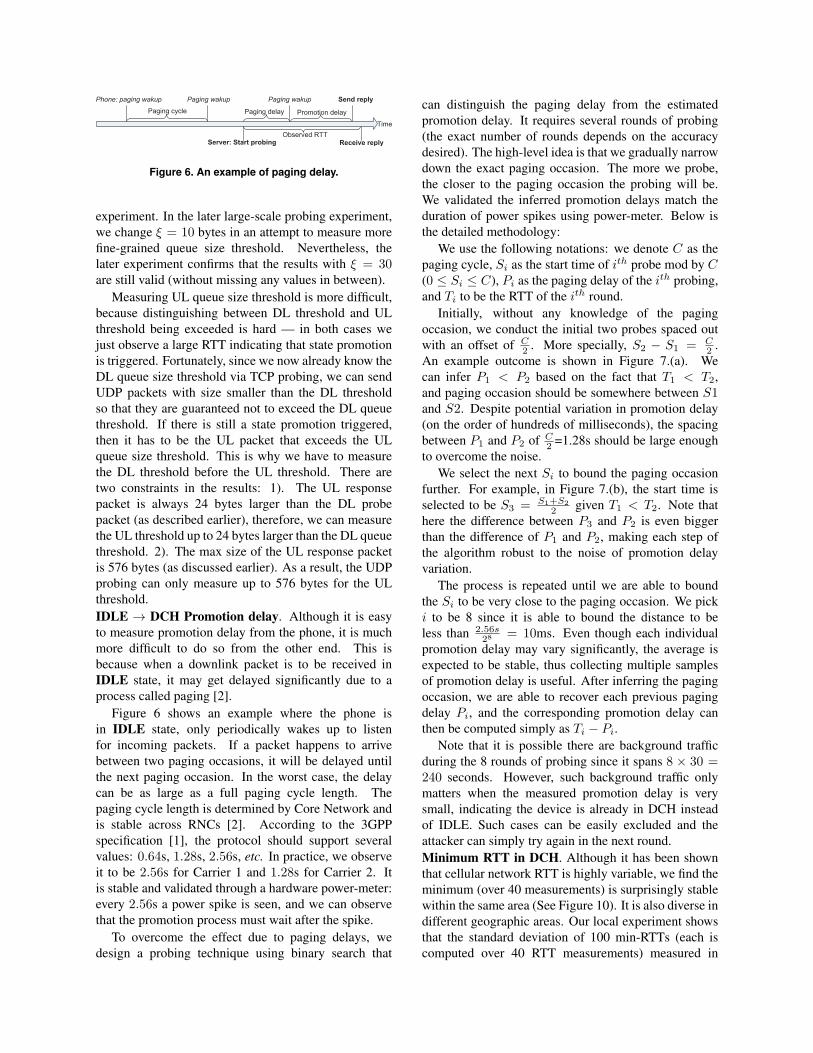
Figure 6. An example of paging delay.
experiment. In the later large-scale probing experiment,we change ξ = 10 bytes in an attempt to measure morefine-grained queue size threshold. Nevertheless, thelater experiment confirms that the results with ξ = 30are still valid (without missing any values in between).
Measuring UL queue size threshold is more difficult,because distinguishing between DL threshold and ULthreshold being exceeded is hard — in both cases wejust observe a large RTT indicating that state promotionis triggered. Fortunately, since we now already know theDL queue size threshold via TCP probing, we can sendUDP packets with size smaller than the DL thresholdso that they are guaranteed not to exceed the DL queuethreshold. If there is still a state promotion triggered,then it has to be the UL packet that exceeds the ULqueue size threshold. This is why we have to measurethe DL threshold before the UL threshold. There aretwo constraints in the results: 1). The UL responsepacket is always 24 bytes larger than the DL probepacket (as described earlier), therefore, we can measurethe UL threshold up to 24 bytes larger than the DL queuethreshold. 2). The max size of the UL response packetis 576 bytes (as discussed earlier). As a result, the UDPprobing can only measure up to 576 bytes for the ULthreshold.IDLE → DCH Promotion delay. Although it is easyto measure promotion delay from the phone, it is muchmore difficult to do so from the other end. This isbecause when a downlink packet is to be received inIDLE state, it may get delayed significantly due to aprocess called paging [2].
Figure 6 shows an example where the phone isin IDLE state, only periodically wakes up to listenfor incoming packets. If a packet happens to arrivebetween two paging occasions, it will be delayed untilthe next paging occasion. In the worst case, the delaycan be as large as a full paging cycle length. Thepaging cycle length is determined by Core Network andis stable across RNCs [2]. According to the 3GPPspecification [1], the protocol should support severalvalues: 0.64s, 1.28s, 2.56s, etc. In practice, we observeit to be 2.56s for Carrier 1 and 1.28s for Carrier 2. Itis stable and validated through a hardware power-meter:every 2.56s a power spike is seen, and we can observethat the promotion process must wait after the spike.
To overcome the effect due to paging delays, wedesign a probing technique using binary search that
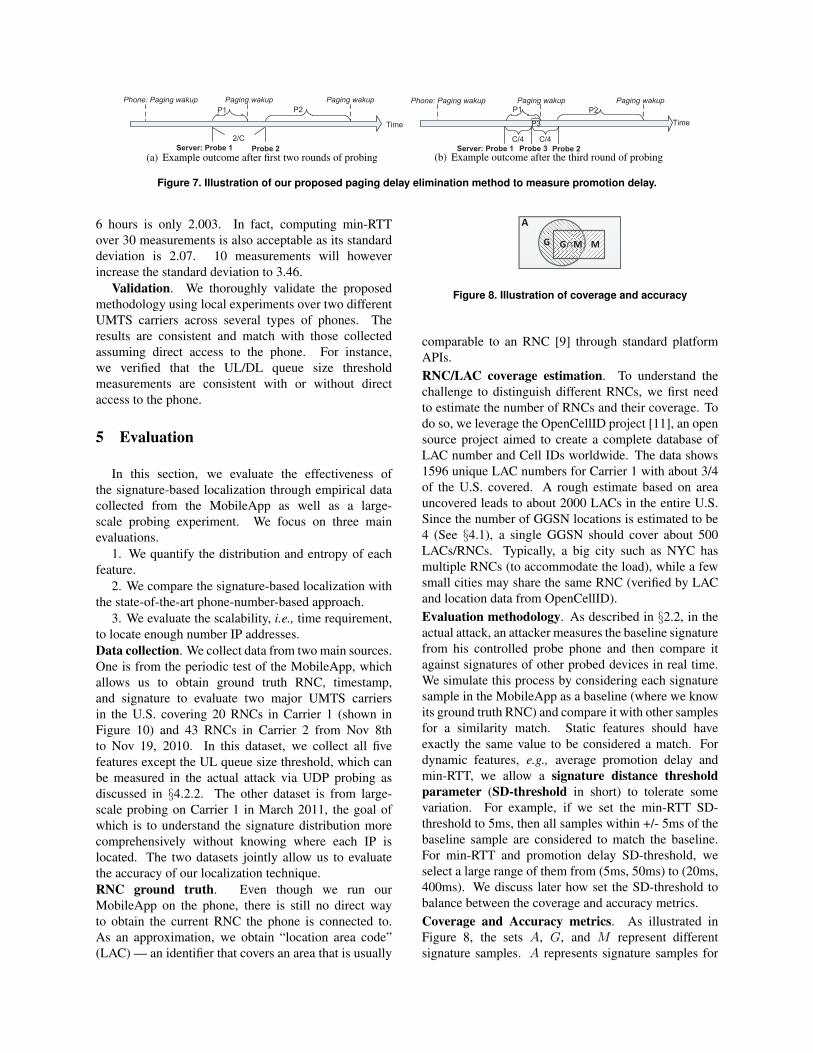
can distinguish the paging delay from the estimatedpromotion delay. It requires several rounds of probing(the exact number of rounds depends on the accuracydesired). The high-level idea is that we gradually narrowdown the exact paging occasion. The more we probe,the closer to the paging occasion the probing will be.We validated the inferred promotion delays match theduration of power spikes using power-meter. Below isthe detailed methodology:
We use the following notations: we denote C as thepaging cycle, Si as the start time of ith probe mod by C(0 ≤ Si ≤ C), Pi as the paging delay of the ith probing,and Ti to be the RTT of the ith round.
Initially, without any knowledge of the pagingoccasion, we conduct the initial two probes spaced outwith an offset of C
2 . More specially, S2 − S1 = C2 .
An example outcome is shown in Figure 7.(a). Wecan infer P1 < P2 based on the fact that T1 < T2,and paging occasion should be somewhere between S1and S2. Despite potential variation in promotion delay(on the order of hundreds of milliseconds), the spacingbetween P1 and P2 of C
2 =1.28s should be large enoughto overcome the noise.
We select the next Si to bound the paging occasionfurther. For example, in Figure 7.(b), the start time isselected to be S3 = S1+S2
2 given T1 < T2. Note thathere the difference between P3 and P2 is even biggerthan the difference of P1 and P2, making each step ofthe algorithm robust to the noise of promotion delayvariation.
The process is repeated until we are able to boundthe Si to be very close to the paging occasion. We picki to be 8 since it is able to bound the distance to beless than 2.56s
28 = 10ms. Even though each individualpromotion delay may vary significantly, the average isexpected to be stable, thus collecting multiple samplesof promotion delay is useful. After inferring the pagingoccasion, we are able to recover each previous pagingdelay Pi, and the corresponding promotion delay canthen be computed simply as Ti − Pi.
Note that it is possible there are background trafficduring the 8 rounds of probing since it spans 8 × 30 =240 seconds. However, such background traffic onlymatters when the measured promotion delay is verysmall, indicating the device is already in DCH insteadof IDLE. Such cases can be easily excluded and theattacker can simply try again in the next round.Minimum RTT in DCH. Although it has been shownthat cellular network RTT is highly variable, we find theminimum (over 40 measurements) is surprisingly stablewithin the same area (See Figure 10). It is also diverse indifferent geographic areas. Our local experiment showsthat the standard deviation of 100 min-RTTs (each iscomputed over 40 RTT measurements) measured in
Paging wakup
Time
Server: Probe 1 Probe 2
Phone: Paging wakup Paging wakup
2/C
P1 P2
(a) Example outcome after first two rounds of probing
Paging wakup
Time
Server: Probe 1 Probe 2
Phone: Paging wakup Paging wakup
Probe 3
P3
P1 P2
C/4 C/4
(b) Example outcome after the third round of probing
Figure 7. Illustration of our proposed paging delay elimination method to measure promotion delay.
6 hours is only 2.003. In fact, computing min-RTTover 30 measurements is also acceptable as its standarddeviation is 2.07. 10 measurements will howeverincrease the standard deviation to 3.46.
Validation. We thoroughly validate the proposedmethodology using local experiments over two differentUMTS carriers across several types of phones. Theresults are consistent and match with those collectedassuming direct access to the phone. For instance,we verified that the UL/DL queue size thresholdmeasurements are consistent with or without directaccess to the phone.
5 Evaluation
In this section, we evaluate the effectiveness ofthe signature-based localization through empirical datacollected from the MobileApp as well as a large-scale probing experiment. We focus on three mainevaluations.
1. We quantify the distribution and entropy of eachfeature.
2. We compare the signature-based localization withthe state-of-the-art phone-number-based approach.
3. We evaluate the scalability, i.e., time requirement,to locate enough number IP addresses.Data collection. We collect data from two main sources.One is from the periodic test of the MobileApp, whichallows us to obtain ground truth RNC, timestamp,and signature to evaluate two major UMTS carriersin the U.S. covering 20 RNCs in Carrier 1 (shown inFigure 10) and 43 RNCs in Carrier 2 from Nov 8thto Nov 19, 2010. In this dataset, we collect all fivefeatures except the UL queue size threshold, which canbe measured in the actual attack via UDP probing asdiscussed in §4.2.2. The other dataset is from large-scale probing on Carrier 1 in March 2011, the goal ofwhich is to understand the signature distribution morecomprehensively without knowing where each IP islocated. The two datasets jointly allow us to evaluatethe accuracy of our localization technique.RNC ground truth. Even though we run ourMobileApp on the phone, there is still no direct wayto obtain the current RNC the phone is connected to.As an approximation, we obtain “location area code”(LAC) — an identifier that covers an area that is usually
MG
A
G∩M
Figure 8. Illustration of coverage and accuracy
comparable to an RNC [9] through standard platformAPIs.RNC/LAC coverage estimation. To understand thechallenge to distinguish different RNCs, we first needto estimate the number of RNCs and their coverage. Todo so, we leverage the OpenCellID project [11], an opensource project aimed to create a complete database ofLAC number and Cell IDs worldwide. The data shows1596 unique LAC numbers for Carrier 1 with about 3/4of the U.S. covered. A rough estimate based on areauncovered leads to about 2000 LACs in the entire U.S.Since the number of GGSN locations is estimated to be4 (See §4.1), a single GGSN should cover about 500LACs/RNCs. Typically, a big city such as NYC hasmultiple RNCs (to accommodate the load), while a fewsmall cities may share the same RNC (verified by LACand location data from OpenCellID).Evaluation methodology. As described in §2.2, in theactual attack, an attacker measures the baseline signaturefrom his controlled probe phone and then compare itagainst signatures of other probed devices in real time.We simulate this process by considering each signaturesample in the MobileApp as a baseline (where we knowits ground truth RNC) and compare it with other samplesfor a similarity match. Static features should haveexactly the same value to be considered a match. Fordynamic features, e.g., average promotion delay andmin-RTT, we allow a signature distance thresholdparameter (SD-threshold in short) to tolerate somevariation. For example, if we set the min-RTT SD-threshold to 5ms, then all samples within +/- 5ms of thebaseline sample are considered to match the baseline.For min-RTT and promotion delay SD-threshold, weselect a large range of them from (5ms, 50ms) to (20ms,400ms). We discuss later how set the SD-threshold tobalance between the coverage and accuracy metrics.Coverage and Accuracy metrics. As illustrated inFigure 8, the sets A, G, and M represent differentsignature samples. A represents signature samples for
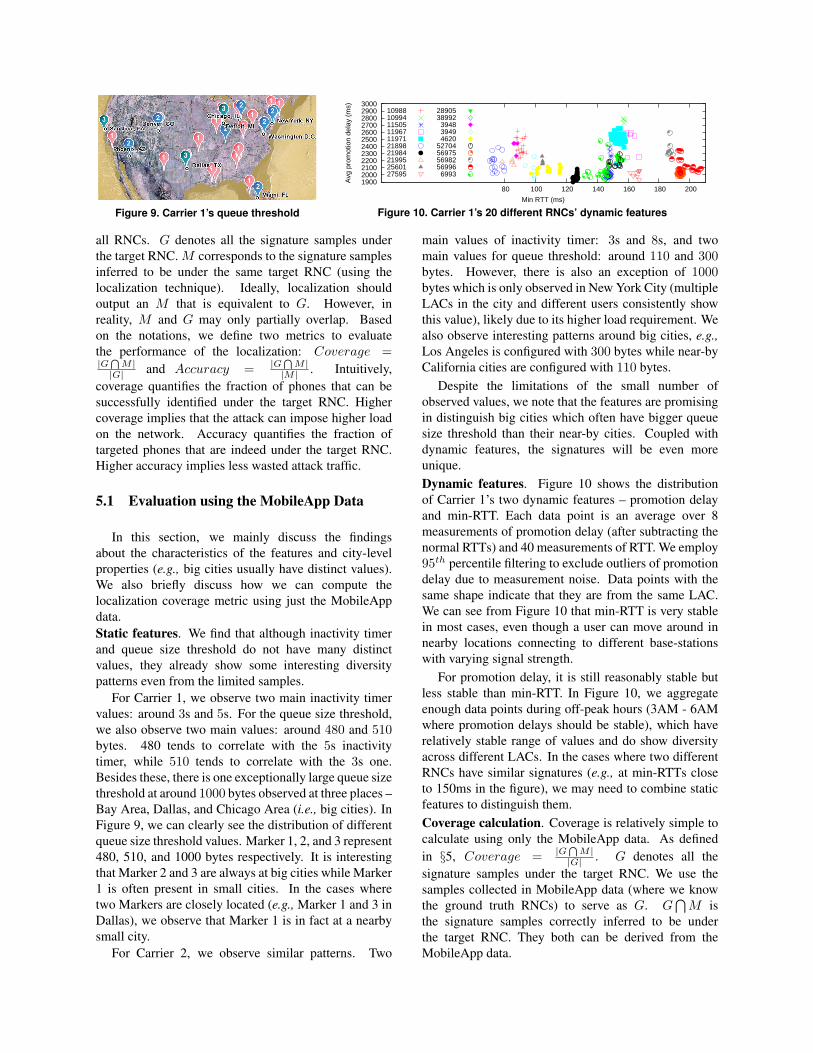
Figure 9. Carrier 1’s queue threshold
1900 2000 2100 2200 2300 2400 2500 2600 2700 2800 2900 3000
80 100 120 140 160 180 200
Avg
pro
mot
ion
dela
y (m
s)
Min RTT (ms)
10988109941150511967119712189821984219952560127595
2890538992
394839494620
52704569755698256996
6993
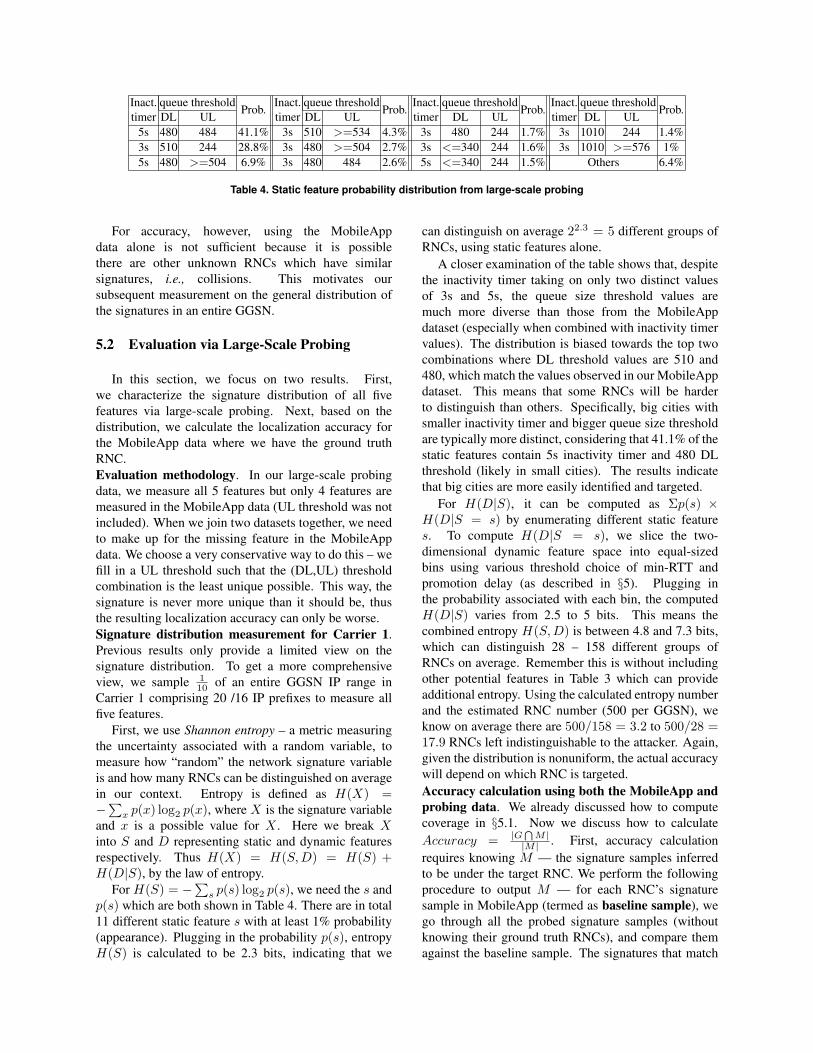
Figure 10. Carrier 1’s 20 different RNCs’ dynamic features
all RNCs. G denotes all the signature samples underthe target RNC. M corresponds to the signature samplesinferred to be under the same target RNC (using thelocalization technique). Ideally, localization shouldoutput an M that is equivalent to G. However, inreality, M and G may only partially overlap. Basedon the notations, we define two metrics to evaluatethe performance of the localization: Coverage =|G
∩M |
|G| and Accuracy = |G∩
M ||M | . Intuitively,
coverage quantifies the fraction of phones that can besuccessfully identified under the target RNC. Highercoverage implies that the attack can impose higher loadon the network. Accuracy quantifies the fraction oftargeted phones that are indeed under the target RNC.Higher accuracy implies less wasted attack traffic.
5.1 Evaluation using the MobileApp Data
In this section, we mainly discuss the findingsabout the characteristics of the features and city-levelproperties (e.g., big cities usually have distinct values).We also briefly discuss how we can compute thelocalization coverage metric using just the MobileAppdata.Static features. We find that although inactivity timerand queue size threshold do not have many distinctvalues, they already show some interesting diversitypatterns even from the limited samples.
For Carrier 1, we observe two main inactivity timervalues: around 3s and 5s. For the queue size threshold,we also observe two main values: around 480 and 510bytes. 480 tends to correlate with the 5s inactivitytimer, while 510 tends to correlate with the 3s one.Besides these, there is one exceptionally large queue sizethreshold at around 1000 bytes observed at three places –Bay Area, Dallas, and Chicago Area (i.e., big cities). InFigure 9, we can clearly see the distribution of differentqueue size threshold values. Marker 1, 2, and 3 represent480, 510, and 1000 bytes respectively. It is interestingthat Marker 2 and 3 are always at big cities while Marker1 is often present in small cities. In the cases wheretwo Markers are closely located (e.g., Marker 1 and 3 inDallas), we observe that Marker 1 is in fact at a nearbysmall city.
For Carrier 2, we observe similar patterns. Two
main values of inactivity timer: 3s and 8s, and twomain values for queue threshold: around 110 and 300bytes. However, there is also an exception of 1000bytes which is only observed in New York City (multipleLACs in the city and different users consistently showthis value), likely due to its higher load requirement. Wealso observe interesting patterns around big cities, e.g.,Los Angeles is configured with 300 bytes while near-byCalifornia cities are configured with 110 bytes.
Despite the limitations of the small number ofobserved values, we note that the features are promisingin distinguish big cities which often have bigger queuesize threshold than their near-by cities. Coupled withdynamic features, the signatures will be even moreunique.Dynamic features. Figure 10 shows the distributionof Carrier 1’s two dynamic features – promotion delayand min-RTT. Each data point is an average over 8measurements of promotion delay (after subtracting thenormal RTTs) and 40 measurements of RTT. We employ95th percentile filtering to exclude outliers of promotiondelay due to measurement noise. Data points with thesame shape indicate that they are from the same LAC.We can see from Figure 10 that min-RTT is very stablein most cases, even though a user can move around innearby locations connecting to different base-stationswith varying signal strength.
For promotion delay, it is still reasonably stable butless stable than min-RTT. In Figure 10, we aggregateenough data points during off-peak hours (3AM - 6AMwhere promotion delays should be stable), which haverelatively stable range of values and do show diversityacross different LACs. In the cases where two differentRNCs have similar signatures (e.g., at min-RTTs closeto 150ms in the figure), we may need to combine staticfeatures to distinguish them.Coverage calculation. Coverage is relatively simple tocalculate using only the MobileApp data. As definedin §5, Coverage = |G
∩M |
|G| . G denotes all thesignature samples under the target RNC. We use thesamples collected in MobileApp data (where we knowthe ground truth RNCs) to serve as G. G
∩M is
the signature samples correctly inferred to be underthe target RNC. They both can be derived from theMobileApp data.
Inact. queue thresholdProb.
Inact. queue thresholdProb.
Inact. queue thresholdProb.
Inact. queue thresholdProb.
timer DL UL timer DL UL timer DL UL timer DL UL5s 480 484 41.1% 3s 510 >=534 4.3% 3s 480 244 1.7% 3s 1010 244 1.4%3s 510 244 28.8% 3s 480 >=504 2.7% 3s <=340 244 1.6% 3s 1010 >=576 1%5s 480 >=504 6.9% 3s 480 484 2.6% 5s <=340 244 1.5% Others 6.4%
Table 4. Static feature probability distribution from largescale probing
For accuracy, however, using the MobileAppdata alone is not sufficient because it is possiblethere are other unknown RNCs which have similarsignatures, i.e., collisions. This motivates oursubsequent measurement on the general distribution ofthe signatures in an entire GGSN.
5.2 Evaluation via LargeScale Probing
In this section, we focus on two results. First,we characterize the signature distribution of all fivefeatures via large-scale probing. Next, based on thedistribution, we calculate the localization accuracy forthe MobileApp data where we have the ground truthRNC.Evaluation methodology. In our large-scale probingdata, we measure all 5 features but only 4 features aremeasured in the MobileApp data (UL threshold was notincluded). When we join two datasets together, we needto make up for the missing feature in the MobileAppdata. We choose a very conservative way to do this – wefill in a UL threshold such that the (DL,UL) thresholdcombination is the least unique possible. This way, thesignature is never more unique than it should be, thusthe resulting localization accuracy can only be worse.Signature distribution measurement for Carrier 1.Previous results only provide a limited view on thesignature distribution. To get a more comprehensiveview, we sample 1
10 of an entire GGSN IP range inCarrier 1 comprising 20 /16 IP prefixes to measure allfive features.
First, we use Shannon entropy – a metric measuringthe uncertainty associated with a random variable, tomeasure how “random” the network signature variableis and how many RNCs can be distinguished on averagein our context. Entropy is defined as H(X) =−∑
x p(x) log2 p(x), where X is the signature variableand x is a possible value for X . Here we break Xinto S and D representing static and dynamic featuresrespectively. Thus H(X) = H(S,D) = H(S) +H(D|S), by the law of entropy.
For H(S) = −∑
s p(s) log2 p(s), we need the s andp(s) which are both shown in Table 4. There are in total11 different static feature s with at least 1% probability(appearance). Plugging in the probability p(s), entropyH(S) is calculated to be 2.3 bits, indicating that we
can distinguish on average 22.3 = 5 different groups ofRNCs, using static features alone.
A closer examination of the table shows that, despitethe inactivity timer taking on only two distinct valuesof 3s and 5s, the queue size threshold values aremuch more diverse than those from the MobileAppdataset (especially when combined with inactivity timervalues). The distribution is biased towards the top twocombinations where DL threshold values are 510 and480, which match the values observed in our MobileAppdataset. This means that some RNCs will be harderto distinguish than others. Specifically, big cities withsmaller inactivity timer and bigger queue size thresholdare typically more distinct, considering that 41.1% of thestatic features contain 5s inactivity timer and 480 DLthreshold (likely in small cities). The results indicatethat big cities are more easily identified and targeted.
For H(D|S), it can be computed as Σp(s) ×H(D|S = s) by enumerating different static features. To compute H(D|S = s), we slice the two-dimensional dynamic feature space into equal-sizedbins using various threshold choice of min-RTT andpromotion delay (as described in §5). Plugging inthe probability associated with each bin, the computedH(D|S) varies from 2.5 to 5 bits. This means thecombined entropy H(S,D) is between 4.8 and 7.3 bits,which can distinguish 28 – 158 different groups ofRNCs on average. Remember this is without includingother potential features in Table 3 which can provideadditional entropy. Using the calculated entropy numberand the estimated RNC number (500 per GGSN), weknow on average there are 500/158 = 3.2 to 500/28 =17.9 RNCs left indistinguishable to the attacker. Again,given the distribution is nonuniform, the actual accuracywill depend on which RNC is targeted.Accuracy calculation using both the MobileApp andprobing data. We already discussed how to computecoverage in §5.1. Now we discuss how to calculateAccuracy = |G
∩M |
|M | . First, accuracy calculationrequires knowing M — the signature samples inferredto be under the target RNC. We perform the followingprocedure to output M — for each RNC’s signaturesample in MobileApp (termed as baseline sample), wego through all the probed signature samples (withoutknowing their ground truth RNCs), and compare themagainst the baseline sample. The signatures that match
LACSignature
LocationPhone-number
Coverage Accuracy Coverage Accuracy11956 52% 41% Queens, NY N/A1
11974 50% 83% Newton, NJ N/A1
26507 50% 3% Ann Arbor, MI N/A1
52704 54% 88% Arlington, TX15.5% 6%
52818 50% 75% Arlington, TX52903 51% 77% Fort Worth, TX 0% 0%1 No such phone number data from MobileApp
Table 5. Coverage and accuracy comparison
0
0.2
0.4
0.6
0.8
1
0 20 40 60 80 100
Avg
Cov
erag
e/A
ccur
acy
Distance (mile)
CoverageAccuracy
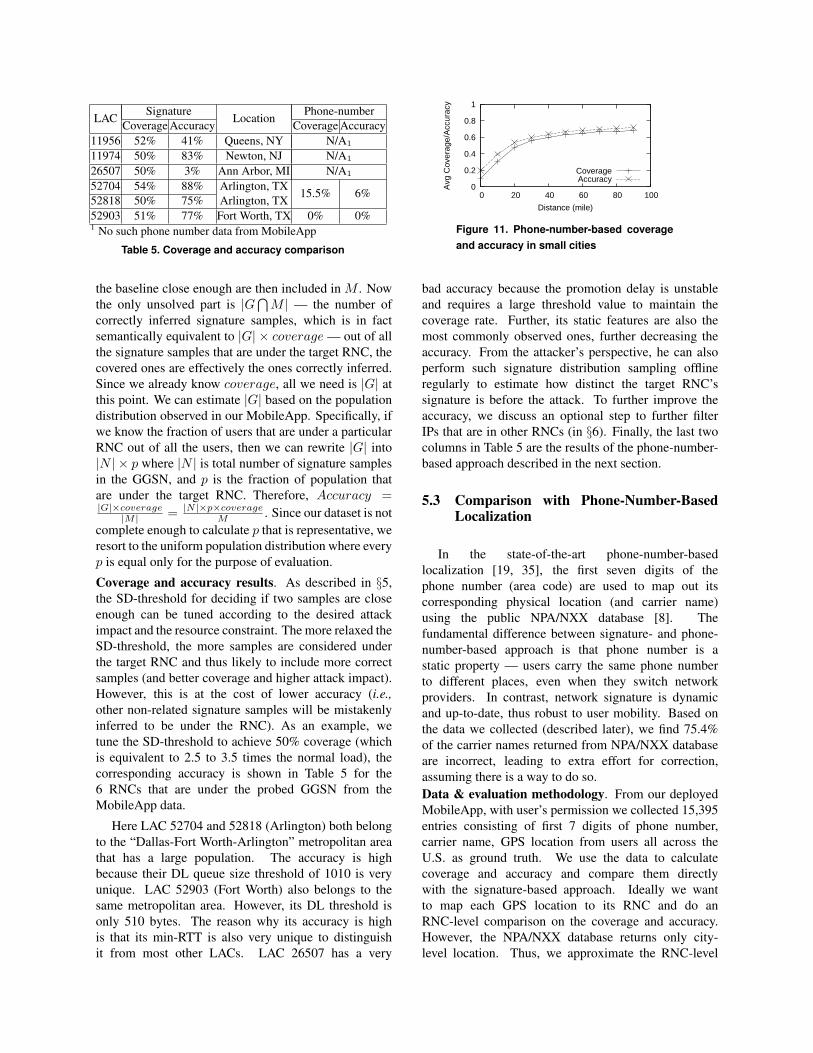
Figure 11. Phonenumberbased coverageand accuracy in small cities
the baseline close enough are then included in M . Nowthe only unsolved part is |G
∩M | — the number of
correctly inferred signature samples, which is in factsemantically equivalent to |G| × coverage — out of allthe signature samples that are under the target RNC, thecovered ones are effectively the ones correctly inferred.Since we already know coverage, all we need is |G| atthis point. We can estimate |G| based on the populationdistribution observed in our MobileApp. Specifically, ifwe know the fraction of users that are under a particularRNC out of all the users, then we can rewrite |G| into|N | × p where |N | is total number of signature samplesin the GGSN, and p is the fraction of population thatare under the target RNC. Therefore, Accuracy =|G|×coverage
|M | = |N |×p×coverageM . Since our dataset is not
complete enough to calculate p that is representative, weresort to the uniform population distribution where everyp is equal only for the purpose of evaluation.
Coverage and accuracy results. As described in §5,the SD-threshold for deciding if two samples are closeenough can be tuned according to the desired attackimpact and the resource constraint. The more relaxed theSD-threshold, the more samples are considered underthe target RNC and thus likely to include more correctsamples (and better coverage and higher attack impact).However, this is at the cost of lower accuracy (i.e.,other non-related signature samples will be mistakenlyinferred to be under the RNC). As an example, wetune the SD-threshold to achieve 50% coverage (whichis equivalent to 2.5 to 3.5 times the normal load), thecorresponding accuracy is shown in Table 5 for the6 RNCs that are under the probed GGSN from theMobileApp data.
Here LAC 52704 and 52818 (Arlington) both belongto the “Dallas-Fort Worth-Arlington” metropolitan areathat has a large population. The accuracy is highbecause their DL queue size threshold of 1010 is veryunique. LAC 52903 (Fort Worth) also belongs to thesame metropolitan area. However, its DL threshold isonly 510 bytes. The reason why its accuracy is highis that its min-RTT is also very unique to distinguishit from most other LACs. LAC 26507 has a very
bad accuracy because the promotion delay is unstableand requires a large threshold value to maintain thecoverage rate. Further, its static features are also themost commonly observed ones, further decreasing theaccuracy. From the attacker’s perspective, he can alsoperform such signature distribution sampling offlineregularly to estimate how distinct the target RNC’ssignature is before the attack. To further improve theaccuracy, we discuss an optional step to further filterIPs that are in other RNCs (in §6). Finally, the last twocolumns in Table 5 are the results of the phone-number-based approach described in the next section.
5.3 Comparison with PhoneNumberBasedLocalization
In the state-of-the-art phone-number-basedlocalization [19, 35], the first seven digits of thephone number (area code) are used to map out itscorresponding physical location (and carrier name)using the public NPA/NXX database [8]. Thefundamental difference between signature- and phone-number-based approach is that phone number is astatic property — users carry the same phone numberto different places, even when they switch networkproviders. In contrast, network signature is dynamicand up-to-date, thus robust to user mobility. Based onthe data we collected (described later), we find 75.4%of the carrier names returned from NPA/NXX databaseare incorrect, leading to extra effort for correction,assuming there is a way to do so.Data & evaluation methodology. From our deployedMobileApp, with user’s permission we collected 15,395entries consisting of first 7 digits of phone number,carrier name, GPS location from users all across theU.S. as ground truth. We use the data to calculatecoverage and accuracy and compare them directlywith the signature-based approach. Ideally we wantto map each GPS location to its RNC and do anRNC-level comparison on the coverage and accuracy.However, the NPA/NXX database returns only city-level location. Thus, we approximate the RNC-level
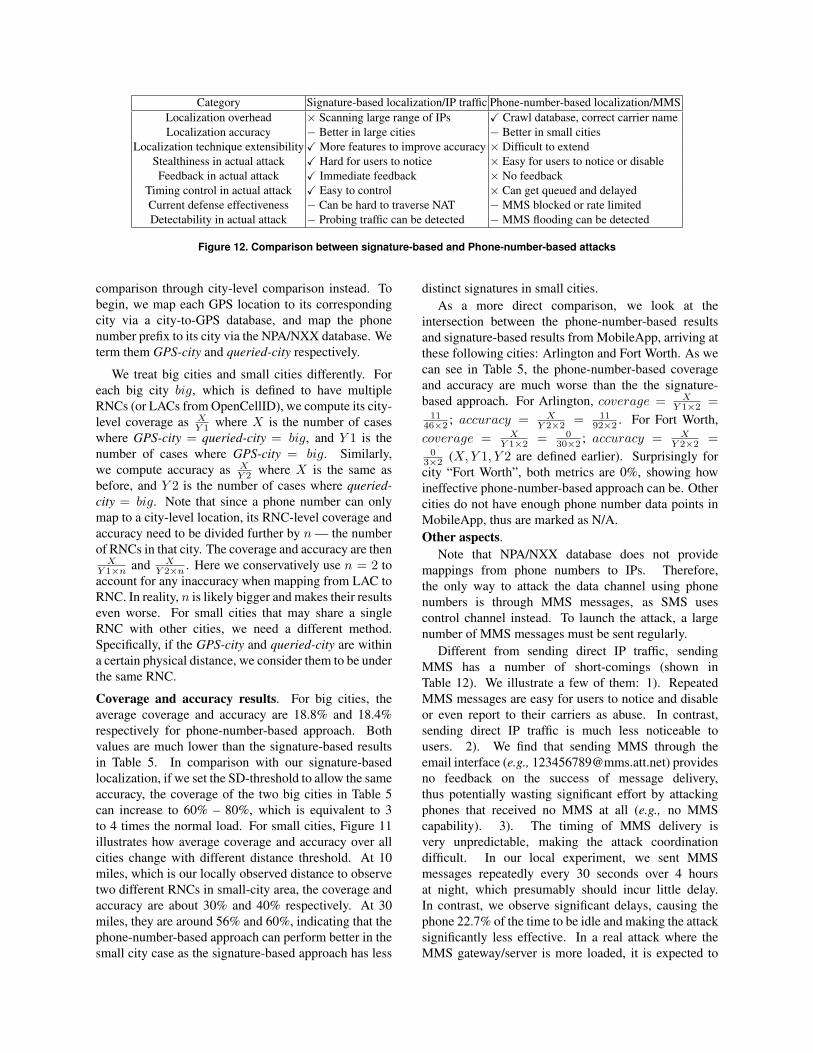
Category Signature-based localization/IP traffic Phone-number-based localization/MMSLocalization overhead × Scanning large range of IPs X Crawl database, correct carrier nameLocalization accuracy − Better in large cities − Better in small cities
Localization technique extensibility X More features to improve accuracy × Difficult to extendStealthiness in actual attack X Hard for users to notice × Easy for users to notice or disableFeedback in actual attack X Immediate feedback × No feedback
Timing control in actual attack X Easy to control × Can get queued and delayedCurrent defense effectiveness − Can be hard to traverse NAT − MMS blocked or rate limitedDetectability in actual attack − Probing traffic can be detected − MMS flooding can be detected
Figure 12. Comparison between signaturebased and Phonenumberbased attacks
comparison through city-level comparison instead. Tobegin, we map each GPS location to its correspondingcity via a city-to-GPS database, and map the phonenumber prefix to its city via the NPA/NXX database. Weterm them GPS-city and queried-city respectively.
We treat big cities and small cities differently. Foreach big city big, which is defined to have multipleRNCs (or LACs from OpenCellID), we compute its city-level coverage as X
Y 1 where X is the number of caseswhere GPS-city = queried-city = big, and Y 1 is thenumber of cases where GPS-city = big. Similarly,we compute accuracy as X
Y 2 where X is the same asbefore, and Y 2 is the number of cases where queried-city = big. Note that since a phone number can onlymap to a city-level location, its RNC-level coverage andaccuracy need to be divided further by n — the numberof RNCs in that city. The coverage and accuracy are then
XY 1×n and X
Y 2×n . Here we conservatively use n = 2 toaccount for any inaccuracy when mapping from LAC toRNC. In reality, n is likely bigger and makes their resultseven worse. For small cities that may share a singleRNC with other cities, we need a different method.Specifically, if the GPS-city and queried-city are withina certain physical distance, we consider them to be underthe same RNC.
Coverage and accuracy results. For big cities, theaverage coverage and accuracy are 18.8% and 18.4%respectively for phone-number-based approach. Bothvalues are much lower than the signature-based resultsin Table 5. In comparison with our signature-basedlocalization, if we set the SD-threshold to allow the sameaccuracy, the coverage of the two big cities in Table 5can increase to 60% – 80%, which is equivalent to 3to 4 times the normal load. For small cities, Figure 11illustrates how average coverage and accuracy over allcities change with different distance threshold. At 10miles, which is our locally observed distance to observetwo different RNCs in small-city area, the coverage andaccuracy are about 30% and 40% respectively. At 30miles, they are around 56% and 60%, indicating that thephone-number-based approach can perform better in thesmall city case as the signature-based approach has less
distinct signatures in small cities.As a more direct comparison, we look at the
intersection between the phone-number-based resultsand signature-based results from MobileApp, arriving atthese following cities: Arlington and Fort Worth. As wecan see in Table 5, the phone-number-based coverageand accuracy are much worse than the the signature-based approach. For Arlington, coverage = X
Y 1×2 =11
46×2 ; accuracy = XY 2×2 = 11
92×2 . For Fort Worth,coverage = X
Y 1×2 = 030×2 ; accuracy = X
Y 2×2 =0
3×2 (X,Y 1, Y 2 are defined earlier). Surprisingly forcity “Fort Worth”, both metrics are 0%, showing howineffective phone-number-based approach can be. Othercities do not have enough phone number data points inMobileApp, thus are marked as N/A.Other aspects.
Note that NPA/NXX database does not providemappings from phone numbers to IPs. Therefore,the only way to attack the data channel using phonenumbers is through MMS messages, as SMS usescontrol channel instead. To launch the attack, a largenumber of MMS messages must be sent regularly.
Different from sending direct IP traffic, sendingMMS has a number of short-comings (shown inTable 12). We illustrate a few of them: 1). RepeatedMMS messages are easy for users to notice and disableor even report to their carriers as abuse. In contrast,sending direct IP traffic is much less noticeable tousers. 2). We find that sending MMS through theemail interface (e.g., [email protected]) providesno feedback on the success of message delivery,thus potentially wasting significant effort by attackingphones that received no MMS at all (e.g., no MMScapability). 3). The timing of MMS delivery isvery unpredictable, making the attack coordinationdifficult. In our local experiment, we sent MMSmessages repeatedly every 30 seconds over 4 hoursat night, which presumably should incur little delay.In contrast, we observe significant delays, causing thephone 22.7% of the time to be idle and making the attacksignificantly less effective. In a real attack where theMMS gateway/server is more loaded, it is expected to
observe even longer delays. In fact, since MMS stilluses SMS to push the notification [10], it is likely thatthe control channel is overloaded first.
5.4 Attack Scalability Analysis
An important question is how fast the attacker canscan a sufficient number of IPs. If it takes too long, thecollected IP address may change (e.g., users may poweroff the phone). With a simple analysis, we estimate thatit takes 1.2 hours to scan enough IPs with 800kbps ofbandwidth. The duration can be significantly shortenedusing more attack machines and bandwidth.Input. The prefix ranges found to be allocatedfor a target location under a GGSN: X.128.X.X –X.147.X.X.(§4.1) are used as input. This correspondsto 1,300,500 IPs.Min-RTT probing. The attacker can first use min-RTT measurements to filter irrelevant IPs as min-RTThas the smallest probing bandwidth requirement and thehighest entropy. Although in total we need 30 – 40probes (as described in §4.2.2) to determine the min-RTT, we need only 1 probe to first check if the IPis assigned or not. Probing one IP with one proberequires bandwidth of 40byte∗8bit
RTT = 1kps (assumingRTT = 0.3s). Probing 800 IPs simultaneously requires1kbps × 800 = 800kbps. Probing each IP once takesabout 1,300,500
800 × 0.3s = 8min.Since many IPs are not allocated at run time, they can
be dropped easily upon the first probe. Considering theonline IP ratio of 22% (§3.3), around 286,110 IPs areleft. Probing the remaining IPs with additional 29 back-to-back measurements will take 286,110
800 × (0.3s×29) =51min. In total, it takes roughly 59 minutes to scan theentire GGSN IP range.Static feature probing. After min-RTT probing, onaverage 1
8 of IPs (around 35,763) remain since theentropy of min-RTT is 3 bits. The attacker can thenmeasure the static features to further narrow down IPs toprobe. Given that the attacker knows the exact inactivitytimer and the queue size threshold in the target locationfrom the probe phone in that area, it can directly look forthese values during scanning. Depending on the timerand queue size threshold, a complete round to measureboth values takes a large packet (1200 bytes) to triggerstate promotion to DCH, a small packet (40 bytes) to testthe inactivity timer, and a packet with size matching thequeue size threshold (suppose it is 500 bytes) to see if itforces the state to go back to DCH. The time to finishsuch a round would be the promotion delay(2s) +inactivity timer(5s) = 7s. The throughputrequirement is then (1200+40+500)∗8bits
7 = 1.94kbps.Scanning 412 IPs simultaneously would require1.94kbps×412 = 800kbps bandwidth and 35,763
412 ×7s =
10min to finish.Promotion delay probing. After the static featureprobing, there are on average 1
5 IPs (around 7,152)remaining for entropy of 2.3 bits. Then the promotiondelay can be measured. It takes only 10.7bps uplinkon the server side, since it only needs to send andreceive one 40-byte packet every 30 second. It takes4min to complete 8 rounds of probing (8 rounds isselected in §4.2.2). The attacker can easily target therest simultaneously using 7, 152 × 10.7bps = 76kbpsbandwidth. The estimated time to finish probing shouldbe 4min since all of them can be done in parallel.
In total, the time to complete the measuring of allfeatures is 59 + 10 + 4 = 73min. Considering 80% ofIPs keep their IPs for more than 4 hours (Figure 3), theattacker has enough time to launch the attack thereafterfor at least several hours.
6 Discussion and Defense
Impact of device difference on dynamic features.Ideally, end-devices should have little impact on thedynamic features such as RTT and promotion delays.However, we do realize that different phones supportingdifferent technologies may co-exist. For instance, somephones may support only HSDPA while their networksupports both HSUPA and HSDPA (i.e., HSPA). Thismeans that these “older” phones may experience slowernetwork performance (e.g., longer RTT and promotiondelay) thus exhibiting different network signatures. Inpractice, however, it is likely that there will always beone or two “dominating” technologies that are mostwidely used in the end-devices and can be consideredas the target for an attacker. For instance, devices arefrequently updated given that smartphones are becomingcheaper and quickly out-dated. Regardless, such phonedifferences do not impact the static features such asqueue length threshold and inactivity timer.Impact of base-station difference on dynamicfeatures. Besides device differences, different base-stations can also impact the measured RTTs orpromotion delays, with bounded noise. Indeed, fromthe MobileApp data, we find that in a short duration(e.g., peak hours), the measured promotion delays donot vary significantly under the same RNC consideringthe samples are collected across multiple base-stationsalready. We do find one instance where the promotiondelay can vary more significantly in different base-stations. This means that we either have to relax theSD-threshold to cover enough signature samples, orneed some way to account for it. As a preliminaryinvestigation, we find that the difference could be causedby different base-stations under different load, indicatedby significantly differing average RTTs (min-RTTs are
still the same) which can be used for calibration. Weleave for future work to systematically address this.
Optional final step to narrow down RNCs. In caseswhere the attacker wants to ensure that the inferredIPs indeed belong to the target RNC, an optional stepthat the attacker can take is to actually try these IPsout. More specifically, the attacker can choose a subsetof the total IPs and launch a mini-attack against theRNCs (which should increase the processing delay onthe RNC) and observe the changed baseline promotiondelay from his probe phone. If the promotion delays ofthe tested IPs match the perturbed baseline promotiondelay, it is likely that they indeed belong to the sameRNC. The attacker can repeat this step multiple times toperform more fine-grained filtering.
Next generation LTE networks. As discussed earlier,LTE networks still have the built-in radio resourcecontrol mechanism with associated configurableparameters [5]. For instance, they allow various timerssuch as inactivity timer, discontinuous reception (DRX)cycle timer to be configured [5]. Fundamentally,due to the scarce nature of the radio resource, thecorresponding radio resource control protocol has toprovide mechanisms for sharing the resource smartlyand flexibly among a large number of users. It isconceivable that network signatures exist for LTEnetworks as well since different network locationsmay again use a different set of configurations toaccommodate the load difference.
Defense. The network signatures can be considered asa type of side channel that leaks information about thenetwork location. A common defense is to eliminatesuch side channel. For instance, instead of using thefixed configuration parameter for all devices at all times,carriers can assign parameters probabilistically within arange, which makes it significantly harder for an attackerto infer the actual parameter. However, this may reducethe effectiveness of the parameter for accommodatingworkload and still requires scrutinization. As networkdefenses, the carrier can disallow direct probing fromthe Internet or other phones. However, it also hasnegative impact as discussed. As host-based defenses,one simple solution is to use host firewall that dropsunsolicited probing packets to prevent informationleakage. This could be an effective solution in the shortterm. As smartphones evolve, however, they may openmore ports to accept incoming connections, making hostfirewall protection less effective. We leave for futurework to systematically study how to defend against suchinformation leakage in critical infrastructures such ascellular networks.
7 Related work
The wide adoption of cellular networks increasinglydraws attention to study their vulnerabilities. Variousforms of attacks have been revealed in the past fewyears. Serror et al. [32] found malicious traffic from theInternet can overload the paging channel in CDMA2000networks. Traynor et al. [35] presented two attacks onGPRS/EDGE networks by abusing the radio resourcesetup and teardown process. Lee et al. [25] showed well-timed attack traffic can trigger excessive radio resourcecontrol messages, which in turn overburden RNCs inUMTS networks. The success of all these attackshinges on the ability to identify many target devices ina particular cellular network region, e.g., under a RNC(which is the focus of this paper).
Our work draws on earlier cellular networkmeasurement studies. Balakrishnan et al. [15] foundIP address alone cannot be used to determine thegeographic location of mobile phone in AT&T’s 3Gnetwork. Latency measurement appears to be moreinformative. However, their observations are drawnfrom latency samples of only three locations.
Prior work leveraged phone numbers to create ahit list for the purpose of launching targeted attacks.Enck et al. [19] generated a hit list of phone numbersthrough a combination of sources such as NPA/NXXdatabase and web scraping. However, its effectivenessis not thoroughly evaluated. Moreover, sending SMS orMMS has a number of limitations compared to sendingIP traffic directly to phones.
There have been extensive studies on geolocatingIP addresses in the Internet. Most of them assumea list of landmarks with well-known geographiclocation, extracted from manually-maintained sourceslike DNS names [28, 33, 12]. They then use latencyconstraints to multiple landmarks to geolocate an IPaddress [22]. Unfortunately, these techniques are ill-suited for geolocation in cellular networks because aphone is often far from its first IP hop (e.g., GGSN) notonly in terms of geographic distance but also in termsof network latency. Given this, instead of attempting toinfer the exact location of a phone, we solve a slightlydifferent (but easier) problem, i.e., determining if twophones are under the same RNC.
There are also studies for localizing mobile devicessuch as Escort [18], VOR [27], Virtual Compass [16],PlaceLab [17], and Radar [14]. The key difference isthat they all require participation and cooperation fromthe phone, which is not assumed in the attack.
8 Conclusion
Motivated by the recent attacks against cellularnetwork infrastructure at a particular target region (e.g.,signaling attack), we focus on a simple but importantquestion of how to create a hit-list of reachable mobileIP addresses associated with the target location tofacilitate such targeted DoS attacks. Our approachuses network signatures through active probing and isapplicable for a large set of current cellular networks westudied. This exposes a new attack vector that cannot beeasily eliminated. From a thorough empirical analysis,we offer suggestions on how to defend against suchreconnaissance effort by attackers.
References
[1] 3GPP TS 25.133: “Requirements for support of radioresource management”.
[2] 3GPP TS 25.331: “RRC Protocol Specification”.[3] AT&T: 80 percent of network now upgraded to HSPA+.
http://www.engadget.com/2010/11/17/atandt-80-percent-of-network-now-upgraded-to-hspa/.
[4] AT&T: wireless capacity upgrades complete inHillsborough, Pasco. http://www.bizjournals.com/tampabay/stories/2010/10/11/daily38.html.
[5] Evolved universal terrestrial radio access (e-utra);radio resource control (rrc); protocol specification.http://www.3gpp.org/ftp/Specs/html-info/36331.htm.
[6] Extended icmp to support multi-part messages. http://tools.ietf.org/html/rfc4884.
[7] iPhone Troubles Might Go Beyond Signaling. http://www.lightreading.com/document.asp?doc_id=190764&piddl_msgid=226225#msg_226225.
[8] Local Calling Guide. http://www.localcallingguide.com/index.php.
[9] Mobility management. http://en.wikipedia.org/wiki/Mobility_management.
[10] Multimedia Messaging Service. http://en.wikipedia.org/wiki/Multimedia_Messaging_Service.
[11] OpenCellID. http://www.opencellid.org/.[12] Whois ip address/domain name lookup. http://
whois.domaintools.com.[13] UE “Fast Dormancy” behavior. 3GPP discussion and
decision notes R2-075251, 2007.[14] P. Bahl and V. N. Padmanabhan. Radar: an in-building
rf-based user location and tracking system. In Proc. ofINFOCOM, 2000.
[15] M. Balakrishnan, I. Mohomed, andV. Ramasubramanian. Where’s That Phone?: GeolocatingIP Addresses on 3G Networks. In Proc. of IMC, 2009.
[16] N. Banerjee, S. Agarwal, P. Bahl, R. Chandra,A. Wolman, , and M. Corner. Virtual Compass: relativepositioning to sense mobile social interactions. In IEEEPervasive Computing, 2010.
[17] Y. Chen, Y. Chawathe, A. LaMarca, and J. Krumm.Accuracy characterization for metropolitan-scale wi-filocalization. In Proc. of Mobisys, 2005.
[18] I. Constandache, X. Bao, M. Azizyan, and R. R.Choudhury. Did You See Bob?: Human Localizationusing Mobile Phones. In Proc. of MobiCom, 2010.
[19] W. Enck, P. Traynor, P. McDaniel, and T. La Porta.Exploiting open functionality in SMS-capable cellularnetworks. In Proc. of CCS, 2005.
[20] H. Galeana, R. Ferrus, and J. Olmos. Transport capacityestimations for over-provisioned utran ip-based networks.In WCNC, 2007.
[21] M. Gruteser, D. Grunwalddepartment, and C. Science.Anonymous usage of location-based services throughspatial and temporal cloaking. In Proc. of Mobisys, 2003.
[22] B. Gueye, A. Ziviani, M. Crovella, and S. Fdida.Constraint-based Geolocation of Internet Hosts. In Proc.of IMC, 2004.
[23] H. Holma and A. Toskala. HSDPA/HSUPA for UMTS:High Speed Radio Access for Mobile Communications.John Wiley and Sons, 2006.
[24] H. Kaaranen, A. Ahtiainen, L. Laitinen, S. Naghian, andV. Niemi. UMTS Networks: Architecture, Mobility andServices (2E). John Wiley & Sons, 2005.
[25] P. P. C. Lee, T. Bu, and T. Woo. On the Detection ofSignaling DoS Attacks on 3G Wireless Networks. InProc. of INFOCOM, 2007.
[26] O. D. Mey, L. Schumacher, and X. Dubois. OptimumNumber of RLC Retransmissions for Best TCPPerformance in UTRAN. In Proc. of Annual IEEEInternational Symposium on Personal Indoor and MobileRadio Communications (PIMRC), 2005.
[27] D. Niculescu and B. Nath. VOR base stations for indoor802.11 positioning. In Proc. of MobiCom, 2004.
[28] V. Padmanabhan and L. Subramanian. An Investigationof Geographic Mapping Techniques for Internet Hosts. InProc. of SIGCOMM, 2001.
[29] F. Qian, Z. Wang, A. Gerber, Z. M. Mao, S. Sen, andO. Spatscheck. Characterizing radio resource allocationfor 3G networks. In Proc. of IMC, 2010.
[30] F. Qian, Z. Wang, A. Gerber, Z. M. Mao, S. Sen,and O. Spatscheck. TOP: Tail Optimization Protocolfor Cellular Radio Resource Allocation. In Proc.International Conference on Network Protocols, 2010.
[31] Z. Qian, Z. M. Mao, Y. Xie, and F. Yu. Investigation oftriangular spamming: a stealthy and efficient spammingtechnique. In In Proc. of IEEE Security and Privacy,2010.
[32] J. Serror, H. Zang, and J. C. Bolot. Impact of PagingChannel Overloads or Attacks on a Cellular Network. InWiSe, 2006.
[33] N. Spring, R. Mahajan, and D. Wetherall. MeasuringISP Topologies with Rocketfuel. In Proc. of SIGCOMM,2002.
[34] P. Traynor, M. Lin, M. Ongtang, V. Rao, T. Jaeger,P. McDaniel, and T. La Porta. On Cellular Botnets:Measuring the Impact of Malicious Devices on a CellularNetwork Core. In Proc. of CCS, 2009.
[35] P. Traynor, P. McDaniel, and T. La Porta. On AttackCausality in Internet-connected Cellular Networks. InProc. of USENIX Security, 2007.
[36] Q. Xu, J. Huang, Z. Wang, F. Qian, A. Gerber,and Z. M. Mao. Cellular data network infrastructurecharacterization and implication on mobile contentplacement. In Proc. of SIGMETRICS, 2011.