Embed Size (px)
Citation preview
Available online at www.worldscientificnews.com
WSN 18 (2015) 133-154 EISSN 2392-2192
Yield Response of Cassava-Okra Intercrop as Influenced by Population Densities and Time of
Introducing Okra in Makurdi, Nigeria
M. O. Ijoyah*, A. U. Usman, N. I. Odiaka
Department of Crop Production, University of Agriculture, P.M.B. 2373, Makurdi, Nigeria
*E-mail address: [email protected]
ABSTRACT
A field experiment was conducted from June to March in years 2013/2014 and 2014/2015 at the
Research Farm, University of Agriculture, Makurdi, Nigeria, to evaluate the yield response of cassava-
okra intercrop as influenced by population densities and time of introducing okra, as well as assessing
the yield advantages of the intercropping system. The experiment was a 3 x 3 factorial combination of
treatments, fitted in a randomized complete block design, with four replications. The population
densities of okra (33,333, 40,000 and 50,000 plants ha-1
equivalent) into cassava constituted the main
plots, while the time of introducing okra into cassava (okra sown at the same time with cassava in mid
June; okra introduced into cassava in mid July and okra introduced into cassava in mid August) were
assigned to the subplots. Results of study showed that sowing okra at the same time as cassava in mid
June, at the population density of 33,333 plants ha-1
produced the highest yields of cassava (46.8 t ha-1
and 39.2 t ha-1
respectively in years 2013 and 2014) and okra (7.7 t ha-1
and 7.5 t ha-1
respectively in
years 2013 and 2014) in a cassava-okra intercrop. This level of interaction also gave the highest total
intercrop yields, highest land equivalent coefficient (LEC) values, highest land equivalent ratio (LER)
values of 1.86 and 1.84 and highest percentage (%) land saved (46.2 % and 45.7 %) respectively
recorded in years 2013 and 2014. The implication of study showed that it is most advantageous having
both crops in intercrop when okra was sown at the same time as cassava in mid June, at the population
density of 33,000 plants ha-1
. This should therefore be recommended for Makurdi location, Nigeria.
Keywords: intercropping; population density; planting dates; cassava; okra; Guinea savannah; Nigeria
World Scientific News 18 (2015) 133-154
-134-
1. INTRODUCTION
Cassava (Manihot esculenta L. Crantz) is a fibrous edible plant of the spurge family
Euphorbiaceae which grows in the tropical and sub-tropical areas of the world (FAO, 2001).
The crop spread rapidly and arrived on the coast of Africa via the Gulf of Guinea and the river
Congo in the 16th
century (Echoi, 2012). It may actually have been introduced to Nigeria over
300 years ago, though its systematic cultivation became generally accepted and integrated into
the farming systems of southern Nigeria over 150 years ago (FAO, 2001). Nigeria is currently
the world leading producer of cassava (Ibeawuchi, 2007). In the country, the crop ranked first
with an annual production of 34 million metric tonnes, followed by yam, sorghum, millet and
rice (Olasunkanmi et al., 2012).
The tubers consist of almost pure starch, the leaves have been found to contain about 17
% protein and therefore a good source of protein in the diet of man and most ruminant
animals. The tuber flesh is composed of about 62 % water, 35 % carbohydrate, 1-2 % protein,
0.3 % fat, 1-2 % fibre and 1 % mineral matter (Echoi, 2012).
Okra (Abelmoschus esculentus (L) Moench) is an herbaceous, hairy, annual plant of the
mallow family Malvaceae and a popular vegetable crop which is grown all the year round for
its good nutritional value (Clementine et al., 2009). The world’s production of okra is 6
million tonnes ha-1
(Iyagba et al., 2012). It is an important crop grown in Nigeria for its edible
tender fresh pods. The crop ranked third following tomato and pepper in terms of
consumption and production area (Ibeawuchi et al., 2005). The immature pods are very rich in
vitamins A, B and C, calcium, potassium and other vital minerals. The pods are consumed as
boiled vegetable, while its dried form is used as soup thickener or in stews (Muoneke et al.,
2007).
Studies have been conducted on sole cassava and sole okra as affected by population
density and planting dates aimed at improving the productivity of both crops (Yadev and
Dhanker, 2002). Research works have also been carried out as it relates to cassava-okra
intercrop as influenced by okra planting density in the humid rain forest agro-ecological zone
of Nigeria (Muoneke et al., 2007). Though farmers in Makurdi, a location in the southern
Guinea savannah of Nigeria intercrop cassava and okra, there is paucity of information on the
optimal planting density and appropriate time of introducing okra in a cassava-okra intercrop.
The study was therefore designed with the aim of evaluating the yield response of cassava-
okra intercrop as influenced by population densities and time of introducing okra, with the
objectives of identifying the optimal planting density and appropriate time of introducing okra
that will maximize intercrop yields of cassava and okra, as well as assess the yield advantages
of the intercropping system.
2. MATERIALS AND METHODS
2. 1. Experimental site, varieties and source of planting materials
The experiments were conducted from June to March in years 2013/2014 and
2014/2015, at the University of Agriculture Teaching and Research Farm, Makurdi, Nigeria,
to evaluate the yield response of cassava-okra intercrop as influenced by population densities
and time of introducing okra. The okra variety ‘NHAe47-4’ was obtained from the National
Institute of Horticultural Research and Training (NIHORT), Ibadan, Nigeria, while the
World Scientific News 18 (2015) 133-154
-135-
cassava variety ‘TMS 98/0581’ was obtained from the National Root Crops Research Institute
(NRCRI), Umudike, Nigeria. The varieties of both crops show good adaptation to Makurdi
environment.
2. 2. Experimental design, plot size and treatments
The experiment was a 3 x 3 factorial combination of treatments, fitted in a randomized
complete block design, replicated four times. The population densities of okra (33,333,
40,000 and 50,000 plants ha-1
equivalent) into cassava constituted the main plots, while the
time of introducing okra into cassava (okra sown with cassava at the same time in mid June;
okra introduced into cassava in mid July; okra introduced into cassava in mid August) were
assigned to the subplots. The experimental area cultivated was 665.0 m2 (0.067 hectares
equivalent), and consisted of 44 treatment plots. Each plot had an area of 12.0 m2.
2. 3. Land preparation and planting
The experimental field was cleared, ploughed, harrowed and ridged. Each plot consisted
of 4 ridges. In sole cassava plot, each ridge consisted of 4 cassava stands at an intra-row
spacing of 1m. A total of 16 cassava stands were sown in each plot (10,000 cassava plants ha-1
equivalent). In the sole okra plot, 10 okra stands were sown on a ridge at an intra-row spacing
of 30 cm (Ijoyah et al., 2010), giving a total of 40 okra stands per plot (33,333 okra stands ha-
1 equivalent). In the sole plots, cassava and okra were planted in a single row, on top of the
ridge, at the recommended population densities and time of planting, while in the intercrop
plots, cassava was sown in a single row on top of the ridge, while okra was sown by the side
of the ridge, but at the varied population densities and different time of introduction.
2. 4. Cultural practices
Weeding was done with the native hoe as the need arose. The recommended rate for
mixed fertilizer NPK (15:15:15) for sole okra at the rate of 100 kg ha-1
as described by Ekpete
(2000); for sole cassava: mixed fertilizer (NPK 20:10:10) was applied at the rate of 100 kg ha-
1; and for cassava-okra intercrop: 120 kg N ha
-1, 120 kg P ha
-1 and 120 kg K ha
-1 were applied
(Enwezor et al., 1989). The band method of fertilizer application was employed. The fertilizer
was applied twice to each plot, at 4 and 8 weeks after planting (WAP).
2. 5. Harvesting
Harvesting of okra was done when the tip of pod was observed to break easily when
pressed with the finger tip (Usman, 2001). Cassava was harvested at 36 WAP, when the
leaves were observed to dry, turn yellowish and fallen off, which were signs of senescence
and tuber maturity (Ijoyah et al., 2012).
2. 6. Data collection
Data were collected on the following:
2. 6. 1. Okra
Days to attain 50 % flowering was taken by counting the number of days from when
crop was sown to when 50 % plants flowered; plant height (cm) taken at 50 % flowering was
World Scientific News 18 (2015) 133-154
-136-
measured as the distance from the soil surface to the tip of the topmost leaf. This was obtained
from a sample of 4 plants in each plot and averaged. The number of branches and number of
leaves per plant were also measured. Leaf area (cm2) was measured as described by Breda
(2003) using the length-width method (L x W), where L is the leaf length and W is the largest
width of the leaf. The number of fresh pods per plant at 1st, 2
nd and 3
rd harvests were obtained
from each plot. The pod length and pod diameter were also measured in cm. Fresh okra was
harvested and weighed for pod weight (g) and total pods for each net plot area were also
harvested and weighed for total yield converted to t ha-1
.
2. 6. 2 Cassava
Plant height taken at 8, 12 and 16 WAP, number of branches per plant at 8, 12 and 16
WAP, number of leaves per plant, leaf area (cm2) at 8, 12 and 16 WAP, number of tubers per
plant, tuber length, tuber diameter (cm), tuber weight and tuber yield (t ha-1
).
2. 7. Statistical Analysis
Analysis of variance (ANOVA) for factorial experiment was carried out on each
observation for each year and the Least significant difference (LSD) was used for means
separation (P ≤ 0.05) following the procedure of Steel and Torrie (1980). Main treatment
effect and the interaction were also determined.
2. 8. Evaluation of yield advantages in intercropping
The land equivalent ratio (LER) was determined as described by Willey (1985) using
the formula:
The competitive ratio (CR) as described by Willey and Rao (1980) was determined
using the formula:
where Partial LER for cassava; Partial LER for okra.
The percentage (%) land saved as described by Willey (1985) using the formula:
% land saved = –
Aggressivity (A) gives a simple measure of how much the relative yield increase in
component ‘a’ is greater than that for component ‘b’ as described by McGilchrist (1971)
using the formula:

World Scientific News 18 (2015) 133-154
-137-
where: A = 0: indicates that both crops are equally competitive; A = - : indicates dominated
component A = + : indicates dominant component
The land equivalent coefficient (LEC) as described by Adetiloye et al., (1983) was
determined using the formula:
where of main crop; of intercrop.
These calculations were used to assess the yield advantages of the intercropping system.
3. RESULTS AND DISCUSSION
3. 1. Growth and yield of cassava in a cassava-okra intercrop as influenced by
population densities and time of introducing okra
Plant height of cassava recorded at 8, 12 and 16 WAP were not significantly (P ≤ 0.05)
affected by the varied population densities of okra (Table 1). Cassava heights at 8, 12 and 16
WAP significantly (P ≤ 0.05) increased as time of introducing okra into cassava advanced
(Table 1). The highest cassava heights were obtained when okra was introduced into cassava
in mid August. The highest cassava heights taken at 16 WAP (178.3 cm and 125.7 cm,
respectively in years 2013 and 2014), were obtained when okra was introduced into cassava in
mid August, at the population density of 50,000 plants ha-1
(Table 2). This result agreed with
Uzozie (2001) who reported increase in cassava heights as time of introducing okra into
cassava advanced in a rain forest location, Nigeria. Muoneke and Asiegbu (1997) reported
increase in cassava height prompted by increase in population density of intercropped maize.
They linked this to competition for light which was intensified at higher densities of maize in
a cassava-maize intercrop.
Table 1. Main effects of population densities of okra and time of introducing okra on cassava plant
height at 8, 12 and 16 WAP and number of branches per cassava plant at 16 WAP in years 2013 and
2014 at Makurdi, Nigeria.
Population
densities of okra
Plant height (cm)
at 8 WAP
Plant height (cm)
at 12 WAP
Plant height (cm)
at 16 WAP
Number of branches
per plant
at 16 WAP
2013 2014 2013 2014 2013 2014 2013 2014
33,333 44.1 48.3 59.7 70.8 121.7 96.0 1.5 1.7
40,000 41.2 51.9 64.0 70.8 124.6 95.8 1.5 2.1
50,000 39.8 52.8 65.4 84.8 130.8 104.7 1.7 2.3
LSD (P ≤ 0.05) 4.1 8.1 5.5 9.9 13.8 10.6 0.1 0.5
Time of introducing
okra
Mid June 39.0 44.2 54.5 64.1 95.7 88.4 1.5 1.5
Mid July 42.3 50.5 63.6 76.3 111.1 94.0 1.5 2.0
World Scientific News 18 (2015) 133-154
-138-
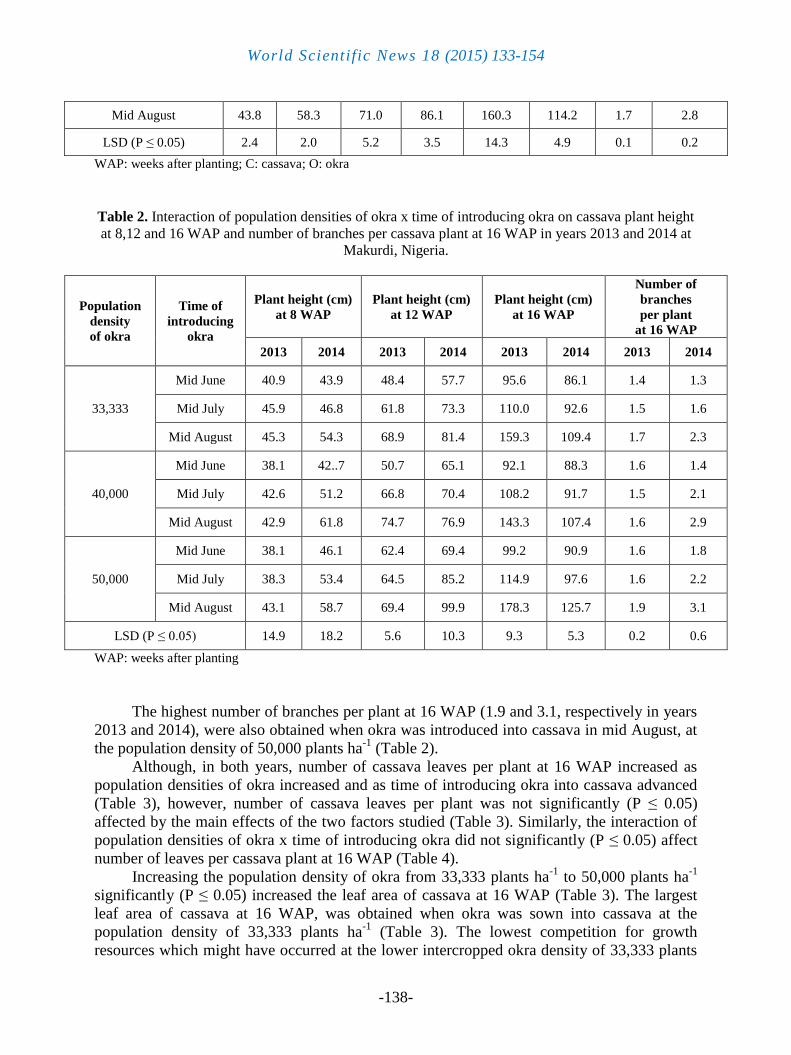
Mid August 43.8 58.3 71.0 86.1 160.3 114.2 1.7 2.8
LSD (P ≤ 0.05) 2.4 2.0 5.2 3.5 14.3 4.9 0.1 0.2
WAP: weeks after planting; C: cassava; O: okra
Table 2. Interaction of population densities of okra x time of introducing okra on cassava plant height
at 8,12 and 16 WAP and number of branches per cassava plant at 16 WAP in years 2013 and 2014 at
Makurdi, Nigeria.
Population
density
of okra
Time of
introducing
okra
Plant height (cm)
at 8 WAP
Plant height (cm)
at 12 WAP
Plant height (cm)
at 16 WAP
Number of
branches
per plant
at 16 WAP
2013 2014 2013 2014 2013 2014 2013 2014
33,333
Mid June 40.9 43.9 48.4 57.7 95.6 86.1 1.4 1.3
Mid July 45.9 46.8 61.8 73.3 110.0 92.6 1.5 1.6
Mid August 45.3 54.3 68.9 81.4 159.3 109.4 1.7 2.3
40,000
Mid June 38.1 42..7 50.7 65.1 92.1 88.3 1.6 1.4
Mid July 42.6 51.2 66.8 70.4 108.2 91.7 1.5 2.1
Mid August 42.9 61.8 74.7 76.9 143.3 107.4 1.6 2.9
50,000
Mid June 38.1 46.1 62.4 69.4 99.2 90.9 1.6 1.8
Mid July 38.3 53.4 64.5 85.2 114.9 97.6 1.6 2.2
Mid August 43.1 58.7 69.4 99.9 178.3 125.7 1.9 3.1
LSD (P ≤ 0.05) 14.9 18.2 5.6 10.3 9.3 5.3 0.2 0.6
WAP: weeks after planting
The highest number of branches per plant at 16 WAP (1.9 and 3.1, respectively in years
2013 and 2014), were also obtained when okra was introduced into cassava in mid August, at
the population density of 50,000 plants ha-1
(Table 2).
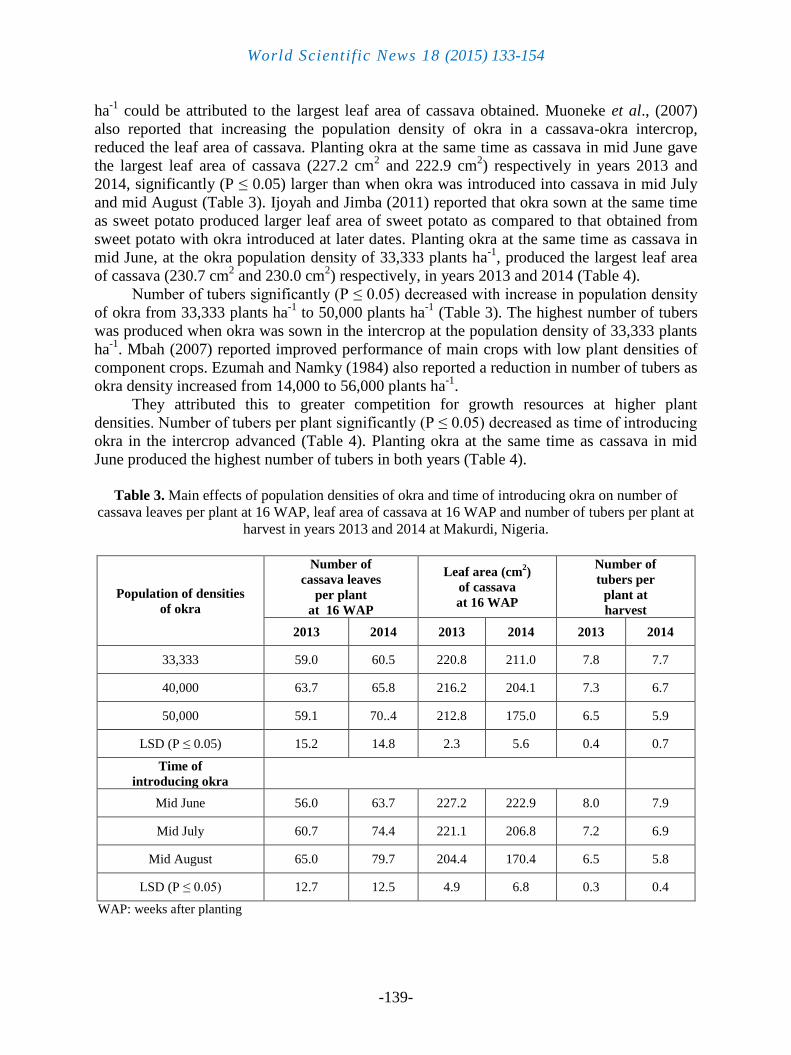
Although, in both years, number of cassava leaves per plant at 16 WAP increased as
population densities of okra increased and as time of introducing okra into cassava advanced
(Table 3), however, number of cassava leaves per plant was not significantly (P ≤ 0.05)
affected by the main effects of the two factors studied (Table 3). Similarly, the interaction of
population densities of okra x time of introducing okra did not significantly (P ≤ 0.05) affect
number of leaves per cassava plant at 16 WAP (Table 4).
Increasing the population density of okra from 33,333 plants ha-1
to 50,000 plants ha-1
significantly (P ≤ 0.05) increased the leaf area of cassava at 16 WAP (Table 3). The largest
leaf area of cassava at 16 WAP, was obtained when okra was sown into cassava at the
population density of 33,333 plants ha-1
(Table 3). The lowest competition for growth
resources which might have occurred at the lower intercropped okra density of 33,333 plants
World Scientific News 18 (2015) 133-154
-139-
ha-1
could be attributed to the largest leaf area of cassava obtained. Muoneke et al., (2007)
also reported that increasing the population density of okra in a cassava-okra intercrop,
reduced the leaf area of cassava. Planting okra at the same time as cassava in mid June gave
the largest leaf area of cassava (227.2 cm2 and 222.9 cm
2) respectively in years 2013 and
2014, significantly (P ≤ 0.05) larger than when okra was introduced into cassava in mid July
and mid August (Table 3). Ijoyah and Jimba (2011) reported that okra sown at the same time
as sweet potato produced larger leaf area of sweet potato as compared to that obtained from
sweet potato with okra introduced at later dates. Planting okra at the same time as cassava in
mid June, at the okra population density of 33,333 plants ha-1
, produced the largest leaf area
of cassava (230.7 cm2 and 230.0 cm
2) respectively, in years 2013 and 2014 (Table 4).
Number of tubers significantly (P ≤ 0.05) decreased with increase in population density
of okra from 33,333 plants ha-1
to 50,000 plants ha-1
(Table 3). The highest number of tubers
was produced when okra was sown in the intercrop at the population density of 33,333 plants
ha-1
. Mbah (2007) reported improved performance of main crops with low plant densities of
component crops. Ezumah and Namky (1984) also reported a reduction in number of tubers as
okra density increased from 14,000 to 56,000 plants ha-1
.
They attributed this to greater competition for growth resources at higher plant
densities. Number of tubers per plant significantly (P ≤ 0.05) decreased as time of introducing
okra in the intercrop advanced (Table 4). Planting okra at the same time as cassava in mid
June produced the highest number of tubers in both years (Table 4).
Table 3. Main effects of population densities of okra and time of introducing okra on number of
cassava leaves per plant at 16 WAP, leaf area of cassava at 16 WAP and number of tubers per plant at
harvest in years 2013 and 2014 at Makurdi, Nigeria.
Population of densities
of okra
Number of
cassava leaves
per plant
at 16 WAP
Leaf area (cm2)
of cassava
at 16 WAP
Number of
tubers per
plant at
harvest
2013 2014 2013 2014 2013 2014
33,333 59.0 60.5 220.8 211.0 7.8 7.7
40,000 63.7 65.8 216.2 204.1 7.3 6.7
50,000 59.1 70..4 212.8 175.0 6.5 5.9
LSD (P ≤ 0.05) 15.2 14.8 2.3 5.6 0.4 0.7
Time of
introducing okra
Mid June 56.0 63.7 227.2 222.9 8.0 7.9
Mid July 60.7 74.4 221.1 206.8 7.2 6.9
Mid August 65.0 79.7 204.4 170.4 6.5 5.8
LSD (P ≤ 0.05) 12.7 12.5 4.9 6.8 0.3 0.4
WAP: weeks after planting
World Scientific News 18 (2015) 133-154
-140-
Table 4. Interaction of population densities of okra x time of introducing okra on number of cassava
leaves per plant at 16 WAP, leaf area of cassava at 16 WAP and number of tubers per plant at harvest
in years 2013 and 2014 at Makurdi, Nigeria.
Population
densities
of okra
Time of
introducing
okra
Number of cassava
leaves per plant
at 16 WAP
Leaf area (cm2)
cassava at
16 WAP
Number of tubers
per plant at
harvest
2013 2014 2013 2014 2013 2014
33,333
Mid June 54.2 56.3 230.7 230.0 8.3 8.3
Mid July 62.3 60.9 220.8 211.6 7.3 7.6
Mid August 60.4 64.1 208.5 191.5 6.6 7.3
40,000
Mid June 58.9 56.9 226.3 227.3 8.1 7.9
Mid July 63.9 64.4 218.7 216.3 7.2 6.9
Mid August 68.4 68.3 199.6 198.7 6.6 5.3
50,000
Mid June 55.0 77.2 225.3 211.5 7.5 7.7
Mid July 56.0 79.2 216.9 192.5 7.1 6.2
Mid August 66.3 80.4 205.3 121.0 6.2 4.9
LSD (P ≤ 0.05) 16.0 15.5 3.8 6.2 0.2 0.4
WAP: weeks after plantings
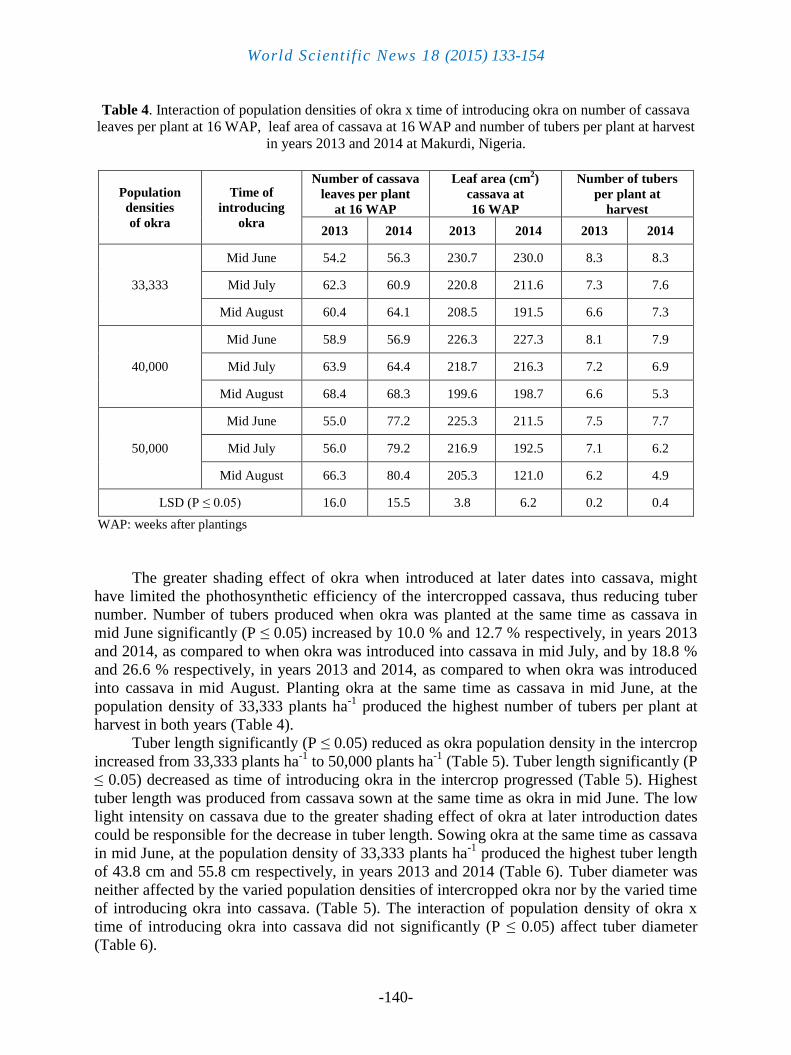
The greater shading effect of okra when introduced at later dates into cassava, might
have limited the phothosynthetic efficiency of the intercropped cassava, thus reducing tuber
number. Number of tubers produced when okra was planted at the same time as cassava in
mid June significantly (P ≤ 0.05) increased by 10.0 % and 12.7 % respectively, in years 2013
and 2014, as compared to when okra was introduced into cassava in mid July, and by 18.8 %
and 26.6 % respectively, in years 2013 and 2014, as compared to when okra was introduced
into cassava in mid August. Planting okra at the same time as cassava in mid June, at the
population density of 33,333 plants ha-1
produced the highest number of tubers per plant at
harvest in both years (Table 4).
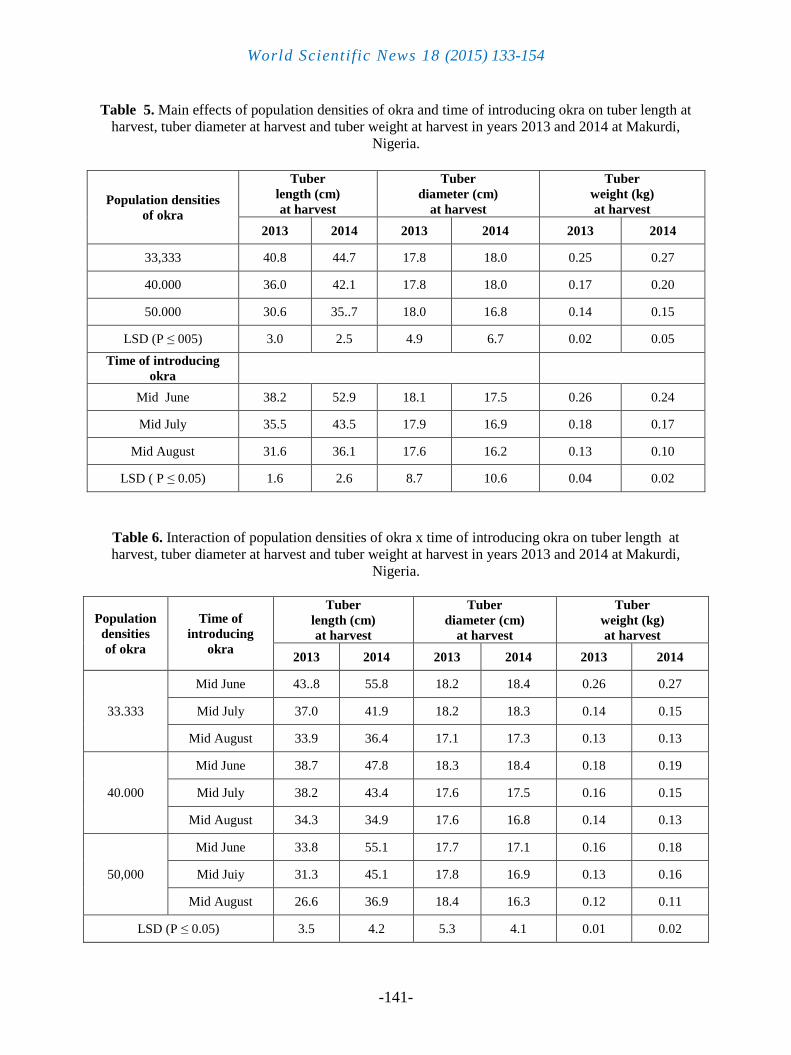
Tuber length significantly (P ≤ 0.05) reduced as okra population density in the intercrop
increased from 33,333 plants ha-1
to 50,000 plants ha-1
(Table 5). Tuber length significantly (P
≤ 0.05) decreased as time of introducing okra in the intercrop progressed (Table 5). Highest
tuber length was produced from cassava sown at the same time as okra in mid June. The low
light intensity on cassava due to the greater shading effect of okra at later introduction dates
could be responsible for the decrease in tuber length. Sowing okra at the same time as cassava
in mid June, at the population density of 33,333 plants ha-1
produced the highest tuber length
of 43.8 cm and 55.8 cm respectively, in years 2013 and 2014 (Table 6). Tuber diameter was
neither affected by the varied population densities of intercropped okra nor by the varied time
of introducing okra into cassava. (Table 5). The interaction of population density of okra x
time of introducing okra into cassava did not significantly (P ≤ 0.05) affect tuber diameter
(Table 6).
World Scientific News 18 (2015) 133-154
-141-
Table 5. Main effects of population densities of okra and time of introducing okra on tuber length at
harvest, tuber diameter at harvest and tuber weight at harvest in years 2013 and 2014 at Makurdi,
Nigeria.
Population densities
of okra
Tuber
length (cm)
at harvest
Tuber
diameter (cm)
at harvest
Tuber
weight (kg)
at harvest
2013 2014 2013 2014 2013 2014
33,333 40.8 44.7 17.8 18.0 0.25 0.27
40.000 36.0 42.1 17.8 18.0 0.17 0.20
50.000 30.6 35..7 18.0 16.8 0.14 0.15
LSD (P ≤ 005) 3.0 2.5 4.9 6.7 0.02 0.05
Time of introducing
okra
Mid June 38.2 52.9 18.1 17.5 0.26 0.24
Mid July 35.5 43.5 17.9 16.9 0.18 0.17
Mid August 31.6 36.1 17.6 16.2 0.13 0.10
LSD ( P ≤ 0.05) 1.6 2.6 8.7 10.6 0.04 0.02
Table 6. Interaction of population densities of okra x time of introducing okra on tuber length at
harvest, tuber diameter at harvest and tuber weight at harvest in years 2013 and 2014 at Makurdi,
Nigeria.
Population
densities
of okra
Time of
introducing
okra
Tuber
length (cm)
at harvest
Tuber
diameter (cm)
at harvest
Tuber
weight (kg)
at harvest
2013 2014 2013 2014 2013 2014
33.333
Mid June 43..8 55.8 18.2 18.4 0.26 0.27
Mid July 37.0 41.9 18.2 18.3 0.14 0.15
Mid August 33.9 36.4 17.1 17.3 0.13 0.13
40.000
Mid June 38.7 47.8 18.3 18.4 0.18 0.19
Mid July 38.2 43.4 17.6 17.5 0.16 0.15
Mid August 34.3 34.9 17.6 16.8 0.14 0.13
50,000
Mid June 33.8 55.1 17.7 17.1 0.16 0.18
Mid Juiy 31.3 45.1 17.8 16.9 0.13 0.16
Mid August 26.6 36.9 18.4 16.3 0.12 0.11
LSD (P ≤ 0.05) 3.5 4.2 5.3 4.1 0.01 0.02

World Scientific News 18 (2015) 133-154
-142-
59,5
41,8 42,1 43,1
37,3
33.0
37,8
33,4 33,7
26,6
31,6
24,9
0
10
20
30
40
50
60
70
2013 2014 2013 2014
Increasing the population density of okra up to 50,000 plants ha-1
in the cassava-okra
intercrop significantly (P ≤ 0.05) reduced tuber weight (Table 5). The highest tuber weight
was obtained with the planting of okra at the density of 33,333 plants ha-1
. Sowing okra at the
same time as cassava in mid June produced the highest tuber weight of 0.26 kg and 0.24 kg
respectively, in years 2013 and 2014 (Table 5). The highest tuber weights obtained when okra
was sown in the intercrop at the density of 33,333 plants ha-1
and at when okra was sown at
the same time with cassava in mid June could have been influenced by the number of tubers
per plant produced at those treatment levels. Planting okra at the same time as cassava in mid
June and at the population density of 33,333 plants ha-1
produced the highest tuber weights in
both years (Table 6).
P1 P2 P3 P1 P2 P3 T1 T2 T3 T1 T2 T3
Population densities of okra Time of introducing okra
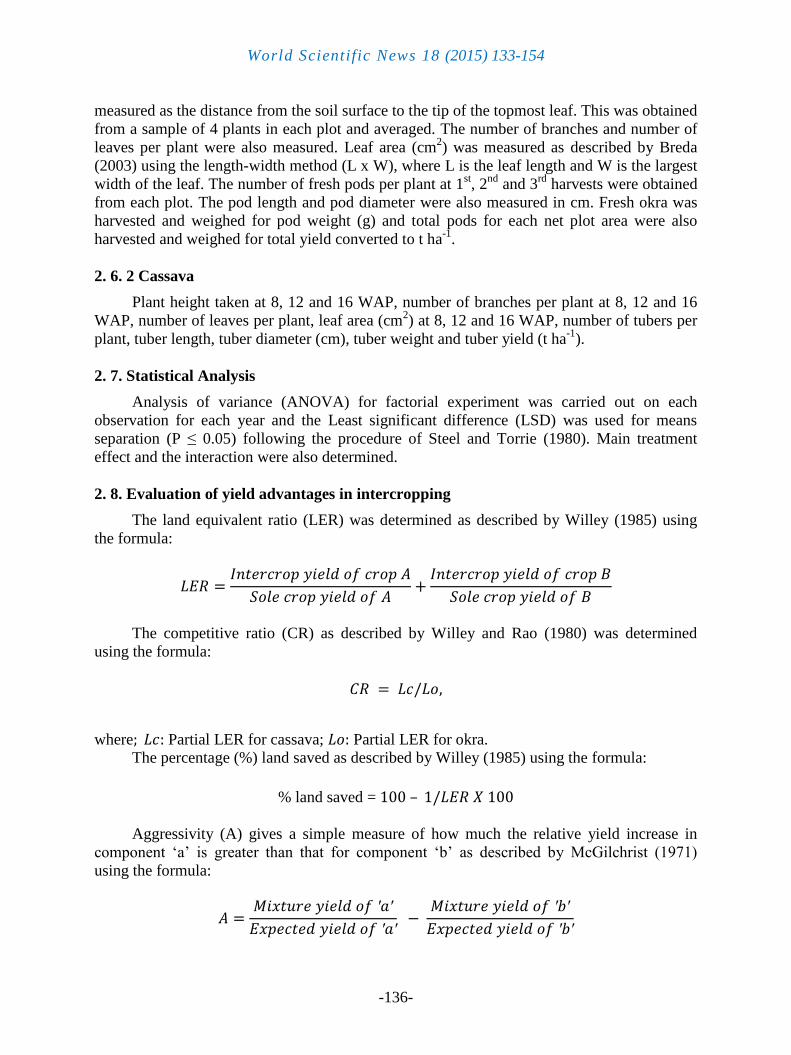
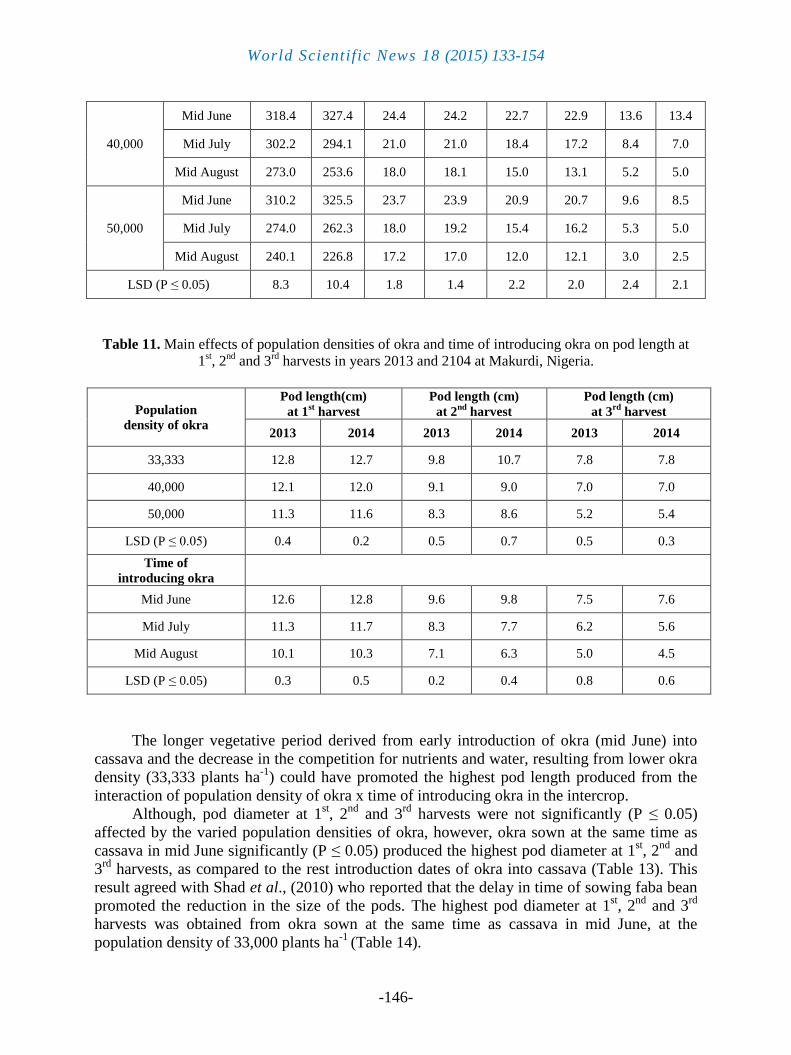
Fig 1. Main effects of population densities of okra and time of introducing okra on tuber yield (t ha-1
)
in a cassava-okra intercrop in years 2013 and 2014 at Makurdi, Nigeria.
P1: Okra at density of 33,333 plants ha-1 T1: Okra introduced into cassava in mid June
P2: Okra at density of 40,000 plants ha-1 T2: Okra introduced into cassava in mid July
P3: Okra at density of 50,000 plants ha-1 T3: Okra introduced into cassava in mid August
In both years, tuber yield decreased as population density of okra increased from 33,333
plants ha-1
to 50,000 plants ha-1
(Fig. 1). This result agreed with Muoneke and Asiegbu (1997)
who reported that cassava root yield declined as maize population density increased in a
cassava-maize intercrop. They attributed this to the depression of the early cassava growth by
the vigorous maize component, thereby reducing the amount of assimilate allocated to cassava
roots.
World Scientific News 18 (2015) 133-154
-143-
The highest tuber yields of 39.5 t ha-1
and 41.8 t ha-1
respectively, in years 2013 and
2014 were produced from cassava with okra sown at the population density of 33,333 plants
ha-1
. Sowing okra at same time with cassava in mid June increased tuber yield by 10.2 % and
22.5 % respectively in years 2013 and 2014, as compared to when okra was introduced in the
intercrop in mid July, and by 24.9 % and 42.2 %, as compared to when okra was introduced in
the intercrop in mid August (Fig. 1). The largest leaf area for cassava recorded at 16 WAP and
highest number of tubers produced from cassava with okra sown at the population density of
33,333 plants ha-1
, and at the period of planting okra same time with cassava in mid June,
could be linked to the highest tuber yields obtained at those treatment levels.
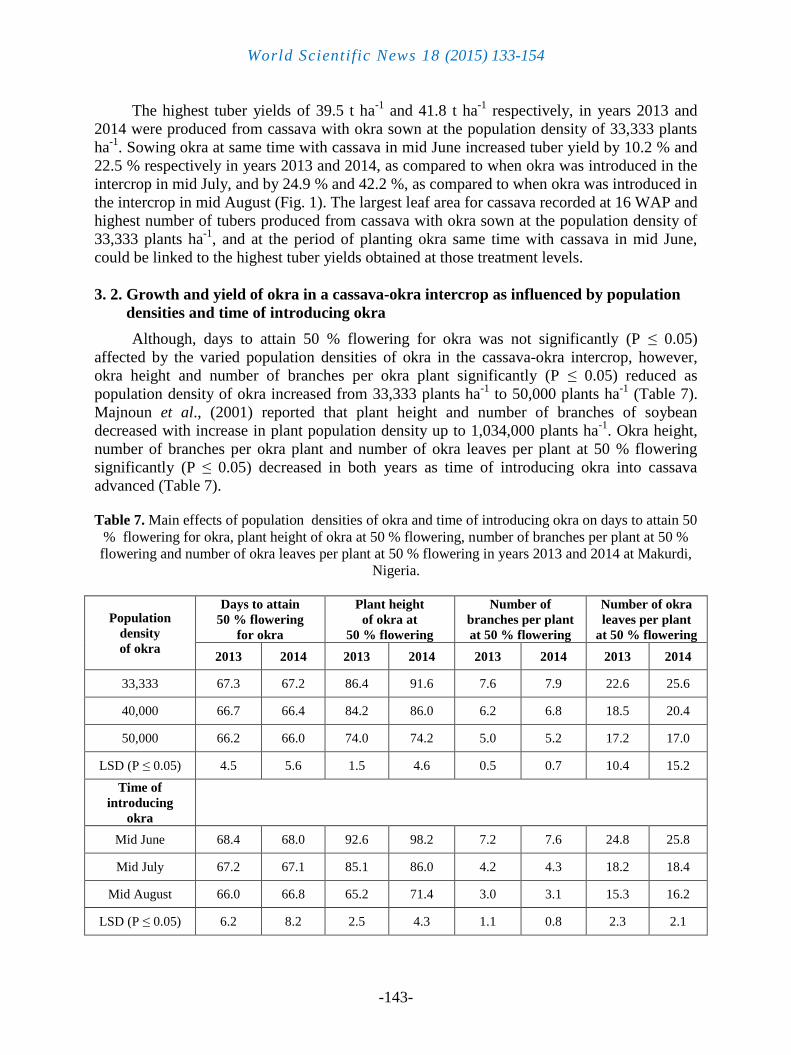
3. 2. Growth and yield of okra in a cassava-okra intercrop as influenced by population
densities and time of introducing okra
Although, days to attain 50 % flowering for okra was not significantly (P ≤ 0.05)
affected by the varied population densities of okra in the cassava-okra intercrop, however,
okra height and number of branches per okra plant significantly (P ≤ 0.05) reduced as
population density of okra increased from 33,333 plants ha-1
to 50,000 plants ha-1
(Table 7).
Majnoun et al., (2001) reported that plant height and number of branches of soybean
decreased with increase in plant population density up to 1,034,000 plants ha-1
. Okra height,
number of branches per okra plant and number of okra leaves per plant at 50 % flowering
significantly (P ≤ 0.05) decreased in both years as time of introducing okra into cassava
advanced (Table 7).
Table 7. Main effects of population densities of okra and time of introducing okra on days to attain 50
% flowering for okra, plant height of okra at 50 % flowering, number of branches per plant at 50 %
flowering and number of okra leaves per plant at 50 % flowering in years 2013 and 2014 at Makurdi,
Nigeria.
Population
density
of okra
Days to attain
50 % flowering
for okra
Plant height
of okra at
50 % flowering
Number of
branches per plant
at 50 % flowering
Number of okra
leaves per plant
at 50 % flowering
2013 2014 2013 2014 2013 2014 2013 2014
33,333 67.3 67.2 86.4 91.6 7.6 7.9 22.6 25.6
40,000 66.7 66.4 84.2 86.0 6.2 6.8 18.5 20.4
50,000 66.2 66.0 74.0 74.2 5.0 5.2 17.2 17.0
LSD (P ≤ 0.05) 4.5 5.6 1.5 4.6 0.5 0.7 10.4 15.2
Time of
introducing
okra
Mid June 68.4 68.0 92.6 98.2 7.2 7.6 24.8 25.8
Mid July 67.2 67.1 85.1 86.0 4.2 4.3 18.2 18.4
Mid August 66.0 66.8 65.2 71.4 3.0 3.1 15.3 16.2
LSD (P ≤ 0.05) 6.2 8.2 2.5 4.3 1.1 0.8 2.3 2.1
World Scientific News 18 (2015) 133-154
-144-
Tsefu and Yamoah (2010) reported that number of branches per carrot plant decreased
as sowing dates progressed. The highest number of okra leaves produced when okra was sown
at the same time as cassava in mid June could be linked to the highest number of branches
produced at same period. Ozer (2003) reported that increase in branching could be a major
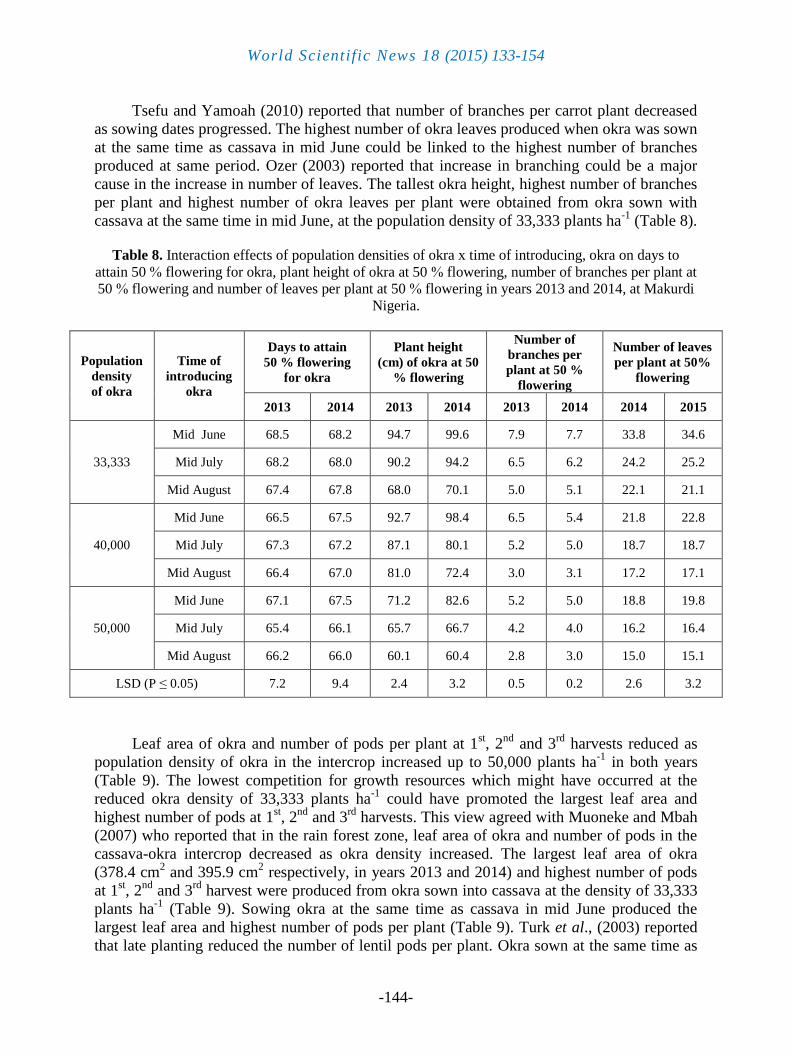
cause in the increase in number of leaves. The tallest okra height, highest number of branches
per plant and highest number of okra leaves per plant were obtained from okra sown with
cassava at the same time in mid June, at the population density of 33,333 plants ha-1
(Table 8).
Table 8. Interaction effects of population densities of okra x time of introducing, okra on days to
attain 50 % flowering for okra, plant height of okra at 50 % flowering, number of branches per plant at
50 % flowering and number of leaves per plant at 50 % flowering in years 2013 and 2014, at Makurdi
Nigeria.
Population
density
of okra
Time of
introducing
okra
Days to attain
50 % flowering
for okra
Plant height
(cm) of okra at 50
% flowering
Number of
branches per
plant at 50 %
flowering
Number of leaves
per plant at 50%
flowering
2013 2014 2013 2014 2013 2014 2014 2015
33,333
Mid June 68.5 68.2 94.7 99.6 7.9 7.7 33.8 34.6
Mid July 68.2 68.0 90.2 94.2 6.5 6.2 24.2 25.2
Mid August 67.4 67.8 68.0 70.1 5.0 5.1 22.1 21.1
40,000
Mid June 66.5 67.5 92.7 98.4 6.5 5.4 21.8 22.8
Mid July 67.3 67.2 87.1 80.1 5.2 5.0 18.7 18.7
Mid August 66.4 67.0 81.0 72.4 3.0 3.1 17.2 17.1
50,000
Mid June 67.1 67.5 71.2 82.6 5.2 5.0 18.8 19.8
Mid July 65.4 66.1 65.7 66.7 4.2 4.0 16.2 16.4
Mid August 66.2 66.0 60.1 60.4 2.8 3.0 15.0 15.1
LSD (P ≤ 0.05) 7.2 9.4 2.4 3.2 0.5 0.2 2.6 3.2
Leaf area of okra and number of pods per plant at 1st, 2
nd and 3
rd harvests reduced as
population density of okra in the intercrop increased up to 50,000 plants ha-1
in both years
(Table 9). The lowest competition for growth resources which might have occurred at the
reduced okra density of 33,333 plants ha-1
could have promoted the largest leaf area and
highest number of pods at 1st, 2
nd and 3
rd harvests. This view agreed with Muoneke and Mbah
(2007) who reported that in the rain forest zone, leaf area of okra and number of pods in the
cassava-okra intercrop decreased as okra density increased. The largest leaf area of okra
(378.4 cm2 and 395.9 cm
2 respectively, in years 2013 and 2014) and highest number of pods
at 1st, 2
nd and 3
rd harvest were produced from okra sown into cassava at the density of 33,333
plants ha-1
(Table 9). Sowing okra at the same time as cassava in mid June produced the
largest leaf area and highest number of pods per plant (Table 9). Turk et al., (2003) reported
that late planting reduced the number of lentil pods per plant. Okra sown at the same time as
World Scientific News 18 (2015) 133-154
-145-
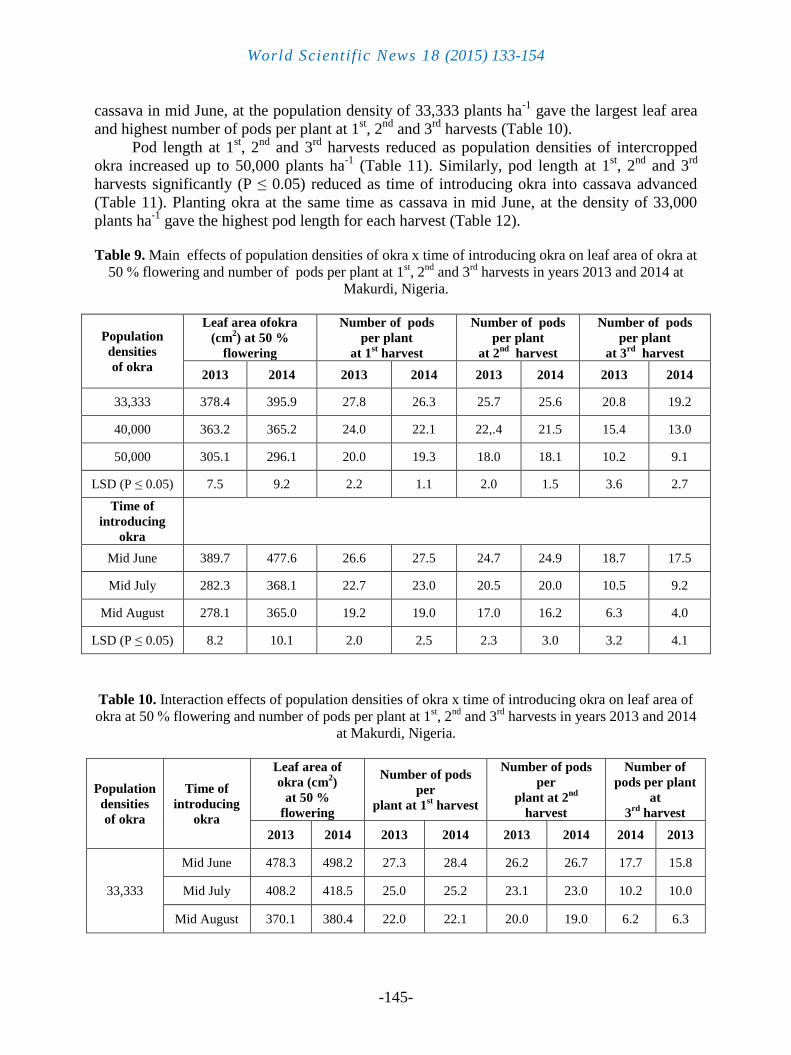
cassava in mid June, at the population density of 33,333 plants ha-1
gave the largest leaf area
and highest number of pods per plant at 1st, 2
nd and 3
rd harvests (Table 10).
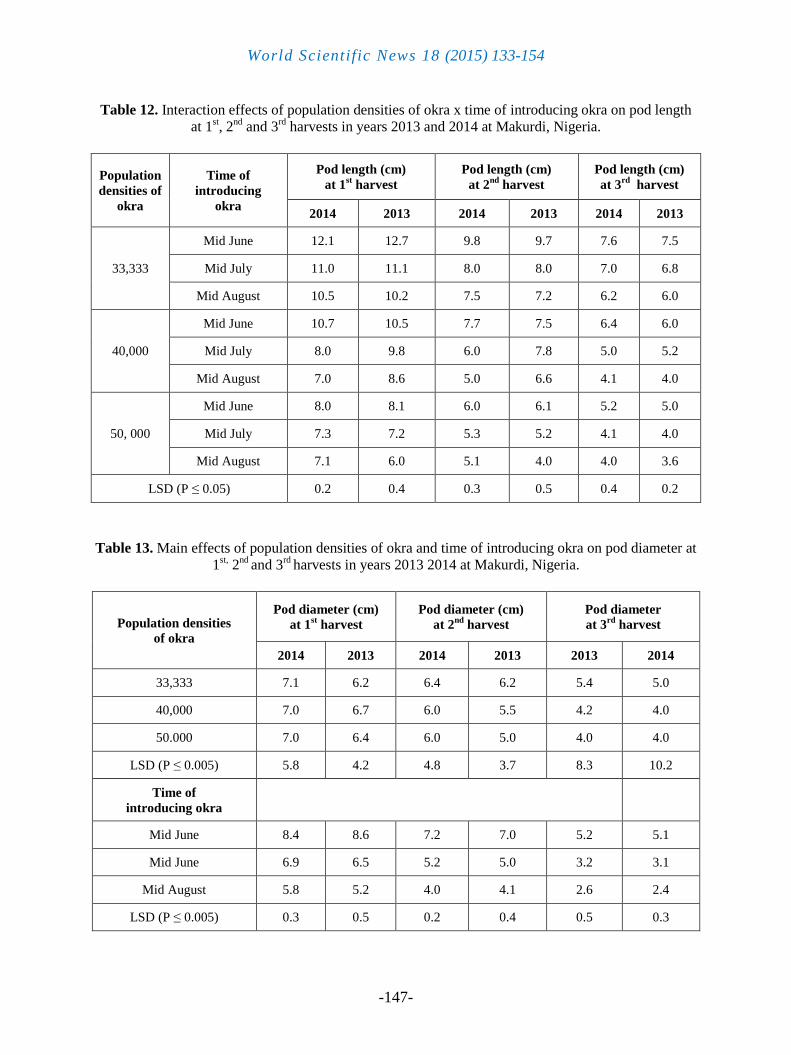
Pod length at 1st, 2
nd and 3
rd harvests reduced as population densities of intercropped
okra increased up to 50,000 plants ha-1
(Table 11). Similarly, pod length at 1st, 2
nd and 3
rd
harvests significantly (P ≤ 0.05) reduced as time of introducing okra into cassava advanced
(Table 11). Planting okra at the same time as cassava in mid June, at the density of 33,000
plants ha-1
gave the highest pod length for each harvest (Table 12).
Table 9. Main effects of population densities of okra x time of introducing okra on leaf area of okra at
50 % flowering and number of pods per plant at 1st, 2
nd and 3
rd harvests in years 2013 and 2014 at
Makurdi, Nigeria.
Population
densities
of okra
Leaf area ofokra
(cm2) at 50 %
flowering
Number of pods
per plant
at 1st harvest
Number of pods
per plant
at 2nd
harvest
Number of pods
per plant
at 3rd
harvest
2013 2014 2013 2014 2013 2014 2013 2014
33,333 378.4 395.9 27.8 26.3 25.7 25.6 20.8 19.2
40,000 363.2 365.2 24.0 22.1 22,.4 21.5 15.4 13.0
50,000 305.1 296.1 20.0 19.3 18.0 18.1 10.2 9.1
LSD (P ≤ 0.05) 7.5 9.2 2.2 1.1 2.0 1.5 3.6 2.7
Time of
introducing
okra
Mid June 389.7 477.6 26.6 27.5 24.7 24.9 18.7 17.5
Mid July 282.3 368.1 22.7 23.0 20.5 20.0 10.5 9.2
Mid August 278.1 365.0 19.2 19.0 17.0 16.2 6.3 4.0
LSD (P ≤ 0.05) 8.2 10.1 2.0 2.5 2.3 3.0 3.2 4.1
Table 10. Interaction effects of population densities of okra x time of introducing okra on leaf area of
okra at 50 % flowering and number of pods per plant at 1st, 2
nd and 3
rd harvests in years 2013 and 2014
at Makurdi, Nigeria.
Population
densities
of okra
Time of
introducing
okra
Leaf area of
okra (cm2)
at 50 %
flowering
Number of pods
per
plant at 1st harvest
Number of pods
per
plant at 2nd
harvest
Number of
pods per plant
at
3rd
harvest
2013 2014 2013 2014 2013 2014 2014 2013
33,333
Mid June 478.3 498.2 27.3 28.4 26.2 26.7 17.7 15.8
Mid July 408.2 418.5 25.0 25.2 23.1 23.0 10.2 10.0
Mid August 370.1 380.4 22.0 22.1 20.0 19.0 6.2 6.3
World Scientific News 18 (2015) 133-154
-146-
40,000
Mid June 318.4 327.4 24.4 24.2 22.7 22.9 13.6 13.4
Mid July 302.2 294.1 21.0 21.0 18.4 17.2 8.4 7.0
Mid August 273.0 253.6 18.0 18.1 15.0 13.1 5.2 5.0
50,000
Mid June 310.2 325.5 23.7 23.9 20.9 20.7 9.6 8.5
Mid July 274.0 262.3 18.0 19.2 15.4 16.2 5.3 5.0
Mid August 240.1 226.8 17.2 17.0 12.0 12.1 3.0 2.5
LSD (P ≤ 0.05) 8.3 10.4 1.8 1.4 2.2 2.0 2.4 2.1
Table 11. Main effects of population densities of okra and time of introducing okra on pod length at
1st, 2
nd and 3
rd harvests in years 2013 and 2104 at Makurdi, Nigeria.
Population
density of okra
Pod length(cm)
at 1st harvest
Pod length (cm)
at 2nd
harvest
Pod length (cm)
at 3rd
harvest
2013 2014 2013 2014 2013 2014
33,333 12.8 12.7 9.8 10.7 7.8 7.8
40,000 12.1 12.0 9.1 9.0 7.0 7.0
50,000 11.3 11.6 8.3 8.6 5.2 5.4
LSD (P ≤ .0.0) 0.4 0.2 0.5 0.7 0.5 0.3
Time of
introducing okra
Mid June 12.6 12.8 9.6 9.8 7.5 7.6
Mid July 11.3 11.7 8.3 7.7 6.2 5.6
Mid August 10.1 10.3 7.1 6.3 5.0 4.5
LSD (P ≤ 0.05) 0.3 0.5 0.2 0.4 0.8 0.6
The longer vegetative period derived from early introduction of okra (mid June) into
cassava and the decrease in the competition for nutrients and water, resulting from lower okra
density (33,333 plants ha-1
) could have promoted the highest pod length produced from the
interaction of population density of okra x time of introducing okra in the intercrop.
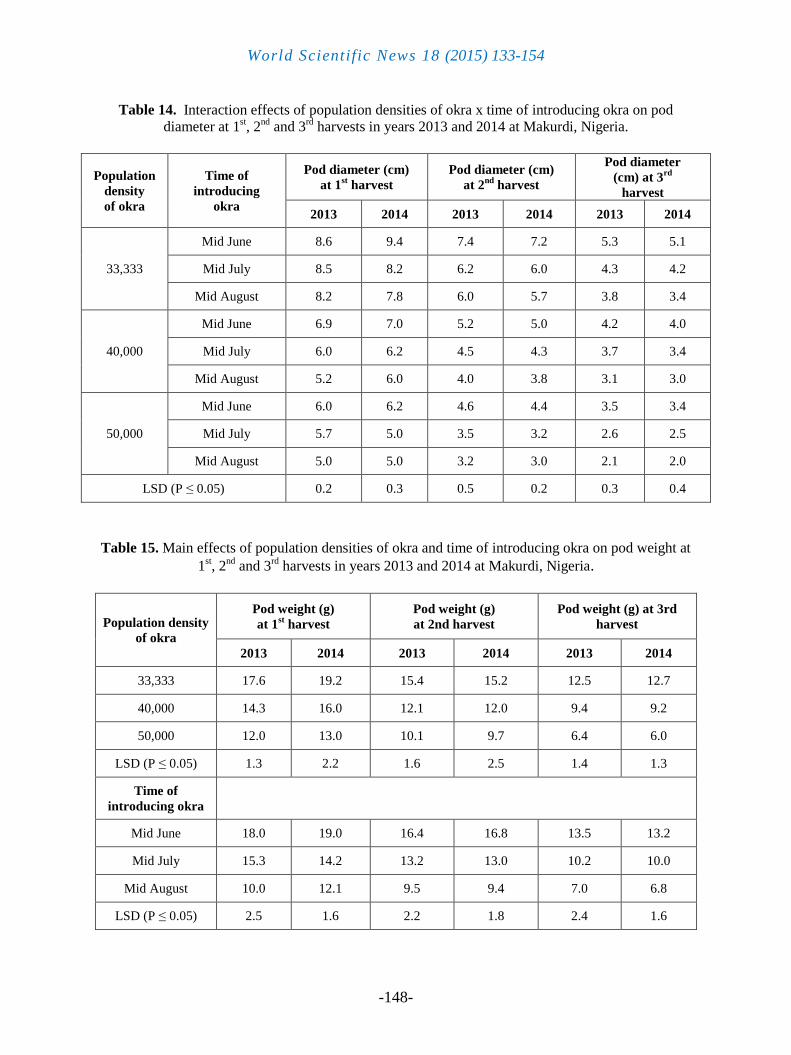
Although, pod diameter at 1st, 2
nd and 3
rd harvests were not significantly (P ≤ 0.05)
affected by the varied population densities of okra, however, okra sown at the same time as
cassava in mid June significantly (P ≤ 0.05) produced the highest pod diameter at 1st, 2
nd and
3rd
harvests, as compared to the rest introduction dates of okra into cassava (Table 13). This
result agreed with Shad et al., (2010) who reported that the delay in time of sowing faba bean
promoted the reduction in the size of the pods. The highest pod diameter at 1st, 2
nd and 3
rd
harvests was obtained from okra sown at the same time as cassava in mid June, at the
population density of 33,000 plants ha-1
(Table 14).
World Scientific News 18 (2015) 133-154
-147-
Table 12. Interaction effects of population densities of okra x time of introducing okra on pod length
at 1st, 2
nd and 3
rd harvests in years 2013 and 2014 at Makurdi, Nigeria.
Population
densities of
okra
Time of
introducing
okra
Pod length (cm)
at 1st harvest
Pod length (cm)
at 2nd
harvest
Pod length (cm)
at 3rd
harvest
2014 2013 2014 2013 2014 2013
33,333
Mid June 12.1 12.7 9.8 9.7 7.6 7.5
Mid July 11.0 11.1 8.0 8.0 7.0 6.8
Mid August 10.5 10.2 7.5 7.2 6.2 6.0
40,000
Mid June 10.7 10.5 7.7 7.5 6.4 6.0
Mid July 8.0 9.8 6.0 7.8 5.0 5.2
Mid August 7.0 8.6 5.0 6.6 4.1 4.0
50, 000
Mid June 8.0 8.1 6.0 6.1 5.2 5.0
Mid July 7.3 7.2 5.3 5.2 4.1 4.0
Mid August 7.1 6.0 5.1 4.0 4.0 3.6
LSD (P ≤ 0.05) 0.2 0.4 0.3 0.5 0.4 0.2
Table 13. Main effects of population densities of okra and time of introducing okra on pod diameter at
1st,
2nd
and 3rd
harvests in years 2013 2014 at Makurdi, Nigeria.
Population densities
of okra
Pod diameter (cm)
at 1st harvest
Pod diameter (cm)
at 2nd
harvest
Pod diameter
at 3rd
harvest
2014 2013 2014 2013 2013 2014
33,333 7.1 6.2 6.4 6.2 5.4 5.0
40,000 7.0 6.7 6.0 5.5 4.2 4.0
50.000 7.0 6.4 6.0 5.0 4.0 4.0
LSD (P ≤ 0.005) 5.8 4.2 4.8 3.7 8.3 10.2
Time of
introducing okra
Mid June 8.4 8.6 7.2 7.0 5.2 5.1
Mid June 6.9 6.5 5.2 5.0 3.2 3.1
Mid August 5.8 5.2 4.0 4.1 2.6 2.4
LSD (P ≤ 0.005) 0.3 0.5 0.2 0.4 0.5 0.3
World Scientific News 18 (2015) 133-154
-148-
Table 14. Interaction effects of population densities of okra x time of introducing okra on pod
diameter at 1st, 2
nd and 3
rd harvests in years 2013 and 2014 at Makurdi, Nigeria.
Population
density
of okra
Time of
introducing
okra
Pod diameter (cm)
at 1st harvest
Pod diameter (cm)
at 2nd
harvest
Pod diameter
(cm) at 3rd
harvest
2013 2014 2013 2014 2013 2014
33,333
Mid June 8.6 9.4 7.4 7.2 5.3 5.1
Mid July 8.5 8.2 6.2 6.0 4.3 4.2
Mid August 8.2 7.8 6.0 5.7 3.8 3.4
40,000
Mid June 6.9 7.0 5.2 5.0 4.2 4.0
Mid July 6.0 6.2 4.5 4.3 3.7 3.4
Mid August 5.2 6.0 4.0 3.8 3.1 3.0
50,000
Mid June 6.0 6.2 4.6 4.4 3.5 3.4
Mid July 5.7 5.0 3.5 3.2 2.6 2.5
Mid August 5.0 5.0 3.2 3.0 2.1 2.0
LSD (P ≤ 0.05) 0.2 0.3 0.5 0.2 0.3 0.4
Table 15. Main effects of population densities of okra and time of introducing okra on pod weight at
1st, 2
nd and 3
rd harvests in years 2013 and 2014 at Makurdi, Nigeria.
Population density
of okra
Pod weight (g)
at 1st harvest
Pod weight (g)
at 2nd harvest
Pod weight (g) at 3rd
harvest
2013 2014 2013 2014 2013 2014
33,333 17.6 19.2 15.4 15.2 12.5 12.7
40,000 14.3 16.0 12.1 12.0 9.4 9.2
50,000 12.0 13.0 10.1 9.7 6.4 6.0
LSD (P ≤ 0.05) 1.3 2.2 1.6 2.5 1.4 1.3
Time of
introducing okra
Mid June 18.0 19.0 16.4 16.8 13.5 13.2
Mid July 15.3 14.2 13.2 13.0 10.2 10.0
Mid August 10.0 12.1 9.5 9.4 7.0 6.8
LSD (P ≤ 0.05) 2.5 1.6 2.2 1.8 2.4 1.6
World Scientific News 18 (2015) 133-154
-149-
Table 16. Interaction effects of population densities of okra x time of introducing okra on pod weight
at 1st, 2
nd and 3
rd harvests in years 2013 and 2014 at Makurdi, Nigeria.
Population
density
of okra
Time of
introducing
okra
Pod weight (g)
at 1st harvest
Pod weight (g)
at 2nd
harvest
Pod weight (g)
at 3rd
harvest
2013 2014 2013 2014 2013 2014
33,333
Mid June 16.3 16.2 13.2 13.0 10.5 10.7
Mid July 13.7 13.0 9.7 9.0 7.4 7.1
Mid August 13.0 12.2 8.4 8.2 6.0 6.0
40,000
Mid June 14.7 14.1 11.5 11.7 7.4 7.2
Mid July 11.3 11.0 8.4 8.0 5.4 5.2
Mid August 9.2 9.0 6.3 6.0 3.4 3.3
50,000
Mid June 13.6 13.4 9.4 9.5 5.2 5.2
Mid July 10.2 10.0 6.2 6.1 3.1 3.2
Mid August 8.1 8.0 5.1 5.0 2.6 2.8
LSD (P ≤ 0.05) 1.4 1.8 1.3 1.1 1.5 0.6
Table 17. Main effects of population densities of okra and time of introducing okra on pod yield at 1
st,
2nd
and 3rd
harvests in years 2013 and 2014 at Makurdi, Nigeria.
Population density
of okra
Pod yield (t ha-1
)
at 1st harvest
Pod yield (t ha-1
)
at 2nd
harvest
Pod yield (t ha-1
)
at 3rd
harvest
2013 2014 2013 2014 2013 2014
33,333 7.5 7.6 6.4 6.4 5.5 5.6
40,000 6.5 6.3 5.2 5.0 4.3 4.2
50,000 6.0 6.0 4.7 4.5 3.1 3.0
LSD (P ≤ 0.05) 0.3 0.2 0.2 0.4 0.8 0.6
Time of
Introducing okra
Mid June 6.3 6.5 5.2 5.0 4.8 4.6
Mid July 5.4 5.7 4.1 4.0 3.4 3.0
Mid August 4.6 4.2 3.1 3.0 2.0 2.0
LSD (P ≤ 0.05) 0.3 0.7 0.5 0.3 0.5 0.8
World Scientific News 18 (2015) 133-154
-150-
Table 18. Interaction effects of population densities of okra x time of introducing okra on pod yield at
1st, 2
nd and 3
rd harvests in years 2013 and 2014 at Makurdi, Nigeria.
Population
density
of okra
Time of
introducing
okra
Pod yield (t ha-1
)
at 1st harvest
Pod yield (t ha-1
)
at 2nd
harvest
Pod yield (t ha-1
)
at 3rd
harvest
2013 2014 2013 2014 2013 2014
33,333
Mid June 7.7 7.5 6.5 6.4 5.4 5.5
Mid July 5.4 5.1 5.2 5.1 4.2 4.3
Mid August 4.6 4.0 4.2 4.0 3.0 3.1
40,000
Mid June 6.0 5.3 5.4 5.4 4.5 4.3
Mid July 5.0 4.6 4.0 4.2 3.2 3.0
Mid August 4.2 4.0 3.0 3.0 2.5 2.3
50,000
Mid June 5.4 5.2 4.6 4.5 3.5 3.4
Mid July 4.2 4.0 3.2 3.3 2.5 2.4
Mid August 4.0 3.6 2.8 2.3 1.4 1.2
LSD (P ≤ 0.05) 0.3 0.2 0.2 0.5 0.7 0.4
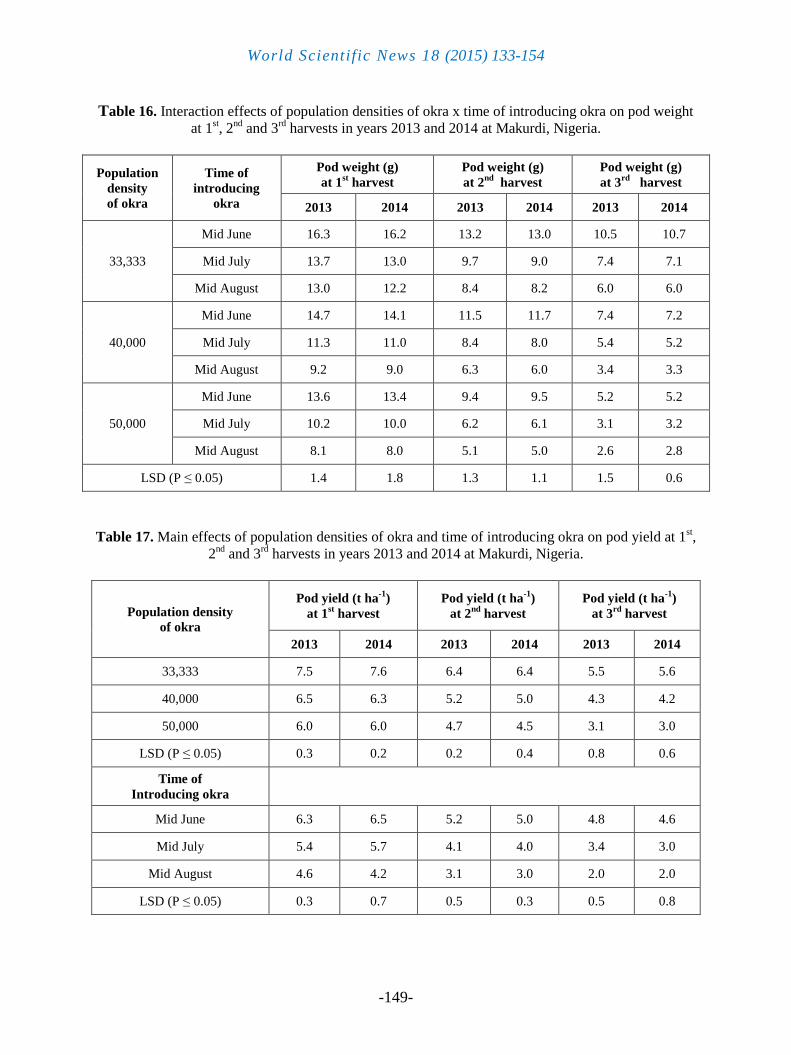
Increasing population density of okra up to 50,000 plants ha-1
significantly (P ≤ 0.05)
reduced pod weight at 1st, 2
nd and 3
rd harvests (Table 15). Okra sown at the same time as
cassava in mid June, at the population density of 33,333 plants ha-1
gave the highest pod
weights at 1st, 2
nd and 3
rd harvests (Table 16). The reduced inter-specific competition for
growth resources at the period of planting okra at the same time as cassava, and at the
population density of 33,333 plants ha-1
could be linked to the highest pod weights obtained at
1st, 2
nd and 3
rd harvests.
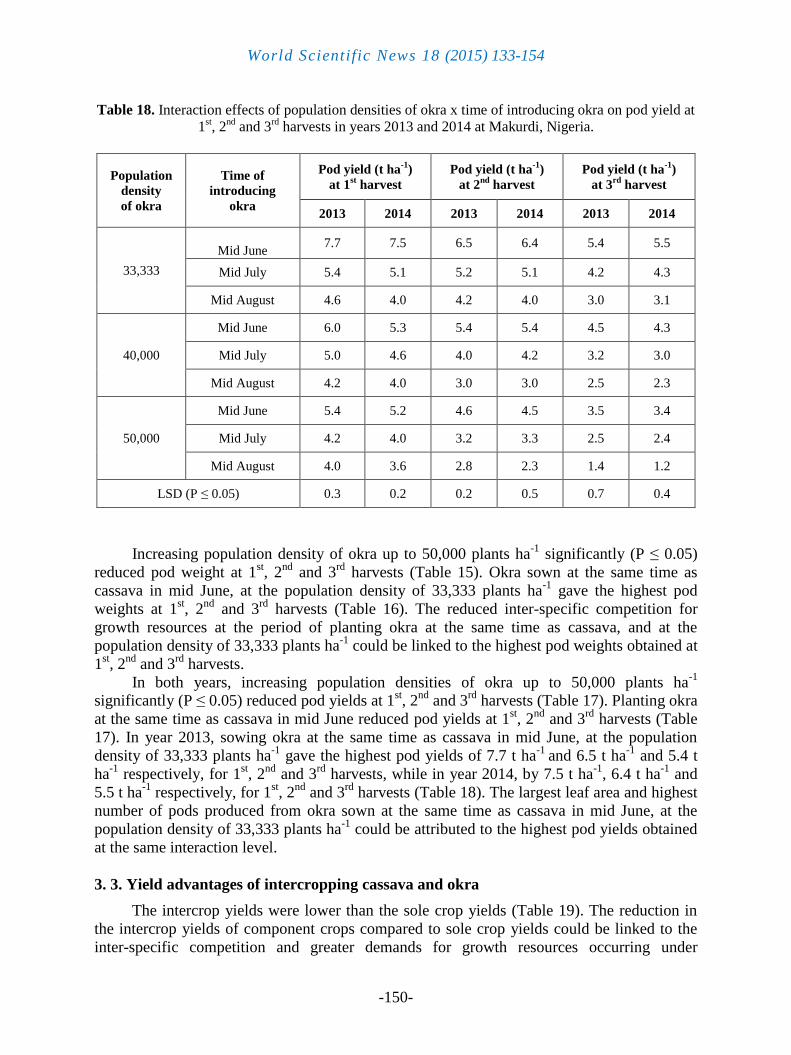
In both years, increasing population densities of okra up to 50,000 plants ha-1
significantly (P ≤ 0.05) reduced pod yields at 1st, 2
nd and 3
rd harvests (Table 17). Planting okra
at the same time as cassava in mid June reduced pod yields at 1st, 2
nd and 3
rd harvests (Table
17). In year 2013, sowing okra at the same time as cassava in mid June, at the population
density of 33,333 plants ha-1
gave the highest pod yields of 7.7 t ha-1
and 6.5 t ha-1
and 5.4 t
ha-1
respectively, for 1st, 2
nd and 3
rd harvests, while in year 2014, by 7.5 t ha
-1, 6.4 t ha
-1 and
5.5 t ha-1
respectively, for 1st, 2
nd and 3
rd harvests (Table 18). The largest leaf area and highest
number of pods produced from okra sown at the same time as cassava in mid June, at the
population density of 33,333 plants ha-1
could be attributed to the highest pod yields obtained
at the same interaction level.
3. 3. Yield advantages of intercropping cassava and okra
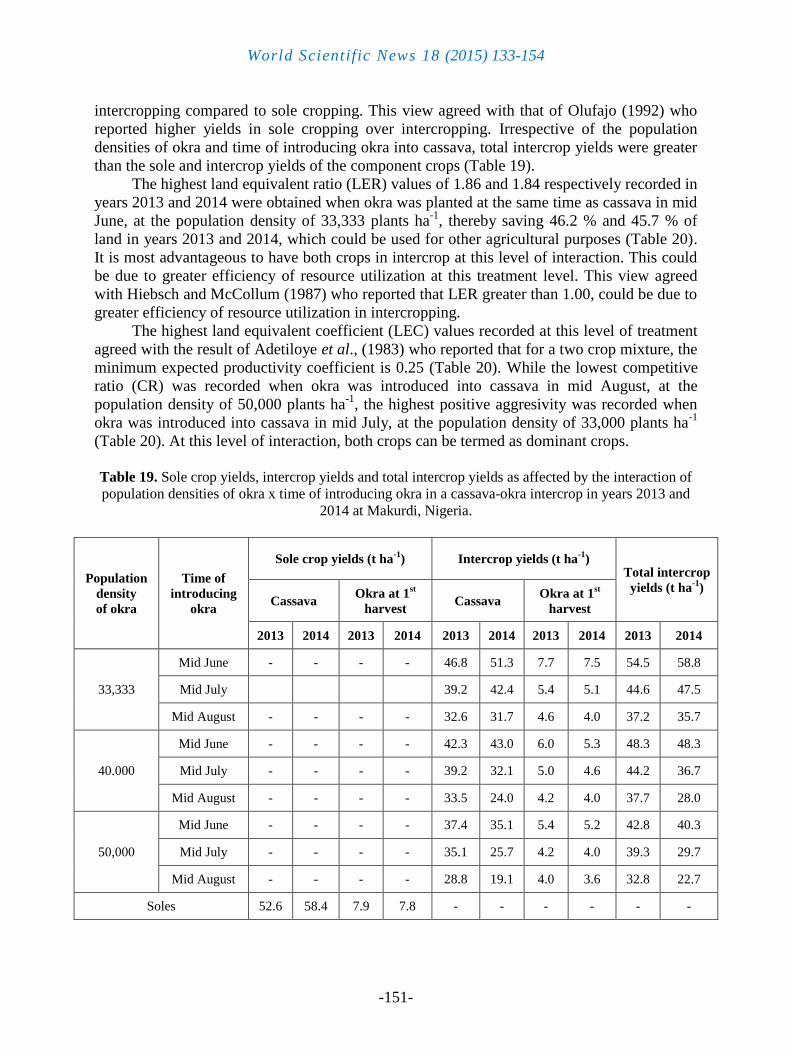
The intercrop yields were lower than the sole crop yields (Table 19). The reduction in
the intercrop yields of component crops compared to sole crop yields could be linked to the
inter-specific competition and greater demands for growth resources occurring under
World Scientific News 18 (2015) 133-154
-151-
intercropping compared to sole cropping. This view agreed with that of Olufajo (1992) who
reported higher yields in sole cropping over intercropping. Irrespective of the population
densities of okra and time of introducing okra into cassava, total intercrop yields were greater
than the sole and intercrop yields of the component crops (Table 19).
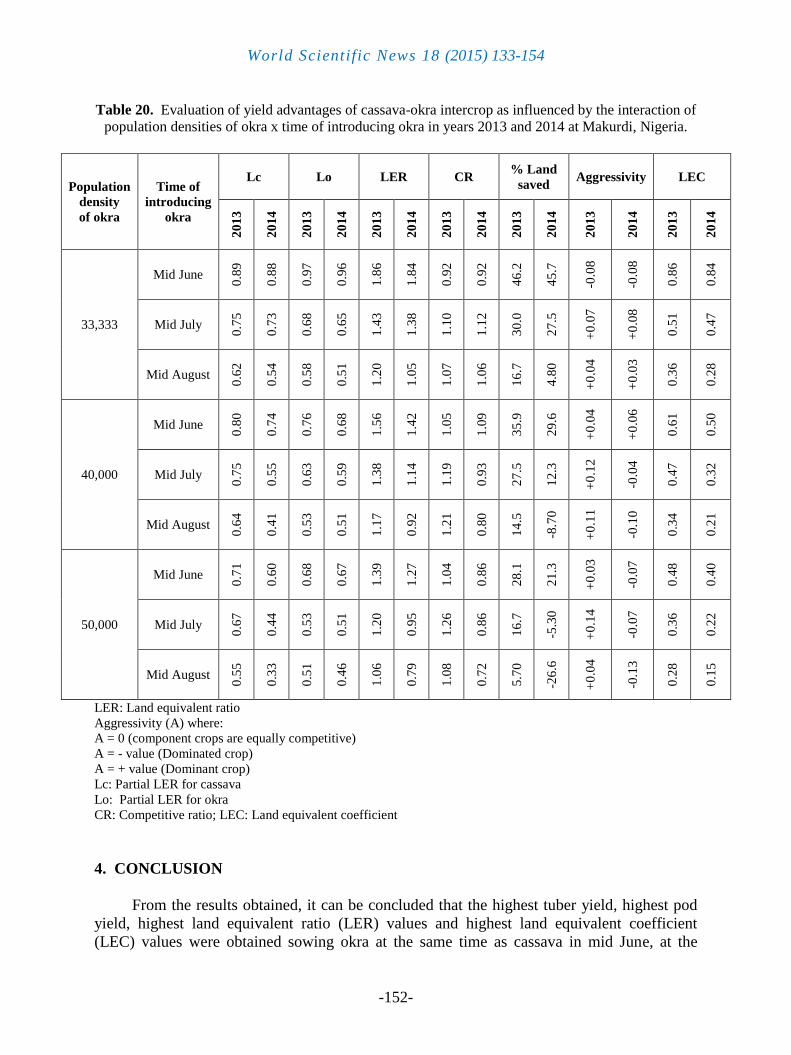
The highest land equivalent ratio (LER) values of 1.86 and 1.84 respectively recorded in
years 2013 and 2014 were obtained when okra was planted at the same time as cassava in mid
June, at the population density of 33,333 plants ha-1
, thereby saving 46.2 % and 45.7 % of
land in years 2013 and 2014, which could be used for other agricultural purposes (Table 20).
It is most advantageous to have both crops in intercrop at this level of interaction. This could
be due to greater efficiency of resource utilization at this treatment level. This view agreed
with Hiebsch and McCollum (1987) who reported that LER greater than 1.00, could be due to
greater efficiency of resource utilization in intercropping.
The highest land equivalent coefficient (LEC) values recorded at this level of treatment
agreed with the result of Adetiloye et al., (1983) who reported that for a two crop mixture, the
minimum expected productivity coefficient is 0.25 (Table 20). While the lowest competitive
ratio (CR) was recorded when okra was introduced into cassava in mid August, at the
population density of 50,000 plants ha-1
, the highest positive aggresivity was recorded when
okra was introduced into cassava in mid July, at the population density of 33,000 plants ha-1
(Table 20). At this level of interaction, both crops can be termed as dominant crops.
Table 19. Sole crop yields, intercrop yields and total intercrop yields as affected by the interaction of
population densities of okra x time of introducing okra in a cassava-okra intercrop in years 2013 and
2014 at Makurdi, Nigeria.
Population
density
of okra
Time of
introducing
okra
Sole crop yields (t ha-1
) Intercrop yields (t ha-1
) Total intercrop
yields (t ha-1
) Cassava
Okra at 1st
harvest Cassava
Okra at 1st
harvest
2013 2014 2013 2014 2013 2014 2013 2014 2013 2014
33,333
Mid June - - - - 46.8 51.3 7.7 7.5 54.5 58.8
Mid July 39.2 42.4 5.4 5.1 44.6 47.5
Mid August - - - - 32.6 31.7 4.6 4.0 37.2 35.7
40.000
Mid June - - - - 42.3 43.0 6.0 5.3 48.3 48.3
Mid July - - - - 39.2 32.1 5.0 4.6 44.2 36.7
Mid August - - - - 33.5 24.0 4.2 4.0 37.7 28.0
50,000
Mid June - - - - 37.4 35.1 5.4 5.2 42.8 40.3
Mid July - - - - 35.1 25.7 4.2 4.0 39.3 29.7
Mid August - - - - 28.8 19.1 4.0 3.6 32.8 22.7
Soles 52.6 58.4 7.9 7.8 - - - - - -
World Scientific News 18 (2015) 133-154
-152-
Table 20. Evaluation of yield advantages of cassava-okra intercrop as influenced by the interaction of
population densities of okra x time of introducing okra in years 2013 and 2014 at Makurdi, Nigeria.
Population
density
of okra
Time of
introducing
okra
Lc Lo LER CR % Land
saved Aggressivity LEC
20
13
20
14
20
13
20
14
20
13
20
14
20
13
20
14
20
13
20
14
20
13
20
14
20
13
20
14
33,333
Mid June
0.8
9
0.8
8
0.9
7
0.9
6
1.8
6
1.8
4
0.9
2
0.9
2
46
.2
45
.7
-0.0
8
-0.0
8
0.8
6
0.8
4
Mid July
0.7
5
0.7
3
0.6
8
0.6
5
1.4
3
1.3
8
1.1
0
1.1
2
30
.0
27
.5
+0
.07
+0
.08
0.5
1
0.4
7
Mid August
0.6
2
0.5
4
0.5
8
0.5
1
1.2
0
1.0
5
1.0
7
1.0
6
16
.7
4.8
0
+0
.04
+0
.03
0.3
6
0.2
8
40,000
Mid June
0.8
0
0.7
4
0.7
6
0.6
8
1.5
6
1.4
2
1.0
5
1.0
9
35
.9
29
.6
+0
.04
+0
.06
0.6
1
0.5
0
Mid July
0.7
5
0.5
5
0.6
3
0.5
9
1.3
8
1.1
4
1.1
9
0.9
3
27
.5
12
.3
+0
.12
-0.0
4
0.4
7
0.3
2
Mid August
0.6
4
0.4
1
0.5
3
0.5
1
1.1
7
0.9
2
1.2
1
0.8
0
14
.5
-8.7
0
+0
.11
-0.1
0
0.3
4
0.2
1
50,000
Mid June
0.7
1
0.6
0
0.6
8
0.6
7
1.3
9
1.2
7
1.0
4
0.8
6
28
.1
21
.3
+0
.03
-0.0
7
0.4
8
0.4
0
Mid July
0.6
7
0.4
4
0.5
3
0.5
1
1.2
0
0.9
5
1.2
6
0.8
6
16
.7
-5.3
0
+0
.14
-0.0
7
0.3
6
0.2
2
Mid August
0.5
5
0.3
3
0.5
1
0.4
6
1.0
6
0.7
9
1.0
8
0.7
2
5.7
0
-26
.6
+0
.04
-0.1
3
0.2
8
0.1
5
LER: Land equivalent ratio
Aggressivity (A) where:
A = 0 (component crops are equally competitive)
A = - value (Dominated crop)
A = + value (Dominant crop)
Lc: Partial LER for cassava
Lo: Partial LER for okra
CR: Competitive ratio; LEC: Land equivalent coefficient
4. CONCLUSION
From the results obtained, it can be concluded that the highest tuber yield, highest pod
yield, highest land equivalent ratio (LER) values and highest land equivalent coefficient
(LEC) values were obtained sowing okra at the same time as cassava in mid June, at the
World Scientific News 18 (2015) 133-154
-153-
population density of 33,333 plants ha-1
. Though, the lowest competitive ratio (CR) was
obtained introducing okra into cassava in mid August, at the population density of 50,000
plants ha-1
, however, the highest positive aggresivity was recorded introducing okra in mid
July, at the population density of 33,333 plants ha-1
. It is however recommended that further
study be evaluated across wider varieties of cassava and okra, and across different locations
within the Guinea savannah agro-ecological zone of Nigeria.
References
[1] Adetiloye P.O., Ezedinma F.O.C., Okigbo B.N., Ecological Modeling 19 (1983) 27-39.
[2] Breda N.J., Journal of Experimental Botany 54 (2003) 2403-2417.
[3] Clementine L.D., Malick N.B., Koussao S., Antoine S., African Journal of Agricultural
Research 4(12) (2009) 1488-1492.
[4] Echoi E.E. (2012). Yield effects of cassava as affected by different stem cutting lengths
in Makurdi, Nigeria. B. Agric. Project, Department of Crop Production, University of
Agriculture, Makurdi, Nigeria.
[5] Ekpete D.M., Nigerian Agricultural Journal 13 (2000) 96-102.
[6] Enwezor W.O.E., Udo J., Ajotade K.A. (1989). Fertilizer procurement and distribution,
fertilizer use and management practice for crops in Nigeria. Savenda Publishers,
Nsukka, Nigeria, pp. 25-28.
[7] Ezumah H.C., Namky N. (1984). Mixtures of maize, cowpea, okra and cassava.
International Institute of Tropical Agriculture, Annual Report, pp. 181-182.
[8] FAO Report (2001). Production Crops: Primary and Domain. Food and Agricultural
Organization Report, pp. 35.
[9] Hiebsch C.K., McCollum R.C., Agronomy Journal 79 (1987) 15-23.
[10] Ibeawuchi I.K., Nature and Science 5(1) (2007) 46-49.
[11] Ibeawuchi I.I., Obiefuna J.C., Ofor M.C., Ihejirika G.O., Tom C.T., Onweremadu E.U.,
Opara C.C., Pakistan Journal of Biological Sciences 8(2) (2005) 215-219.
[12] Ijoyah M.O., Alexander A., Fanen F.T., Agriculture and Biology Journal of Northern
America 6 (2012) 1328-1332.
[13] Ijoyah M.O., Jimba J., Agricultural Science Research Journal 1(8) (2011) 184-190.
[14] Ijoyah M.O., Atanu S.O., Ojo S., Journal of Applied Biosciences 32 (2010) 2015-2019.
[15] Iyagba A.G., Onuegbu B.A., Ibe A.E., Global Journal of Science Frontier Research
12(7) (2012) 10-14.
[16] Majnoun H.N., Ellis R.H., Yazdi-Samadi B., Journal of Science and Technology 3
(2001) 131-139.
[17] Mbah E.U., Tropical and Subtropical Agroecosystems 15 (2007) 241-248.
[18] McGilchrist C.A., Biometrics 27 (1971) 659-671.
World Scientific News 18 (2015) 133-154
-154-
[19] Muoneke C.O., Asiegbu J.E., Journal of Agronomy and Crop Science 179 (1997) 201-
207.
[20] Muoneke C.O., Mbah E.U., African Journal of Agricultural Research 2(5) (2007) 223-
231.
[21] Muoneke C.O., Ogwuche M.A.O., Kalu B.A., African Journal of Agricultural Research
2(12) (2007) 667-677.
[22] Olasunkanmi M.B., Michael A., Fisayo D., Greener Journal of Agricultural Sciences
2(1) (2012) 13-20.
[23] Olufajo O.O., Tropical Oil Seeds Journal 1 (1992) 27-33.
[24] Ozer H., Journal of Plant Soil Environment 49(9) (2003) 422-426.
[25] Shad K.K., Wahab A., Rehman A., Fida M., Wahab S., Khan A.Z., Zubair M., Mir
K.S., Khalil I.H., Amin R., Pakistan Journal of Botany 42(6) (2010) 3831-3838.
[26] Steel G.O., Torrie J.H. (1980). Principles and procedures of statistics. A biometrical
approach. 2nd
edition, McGraw-Hill Book International Company, New York, Pp. 633.
[27] Tsefu M., Yamoah C., African Journal of Plant Science 4(8) (2010) 270-279.
[28] Turk M.A., Tawaha A.M., El-Shatnawi M.E., Journal of Agronomy and Crop Science
189(1) (2003) 1-6.
[29] Usman S.D., Seed Research 29(1) (2001) 47-51.
[30] Uzozie L.C., Tropical Geography 8(2) (2001) 62-72.
[31] Willey R.W., Experimental Agriculture 21 (1985) 119-133.
[32] Willey R.W., Rao M.R., Experimental Agriculture 16 (1980) 117-125.
[33] Yadev S.K., Dhanker B.S., Vegetable Science 27 (2002) 70-74.
( Received 14 July 2015; accepted 29 July 2015 )