Embed Size (px)
DESCRIPTION
Minimizing Wide-Area Performance Disruptions in Inter-Domain Routing. Yaping Zhu [email protected] Advisor: Prof. Jennifer Rexford Princeton University. Minimize Performance Disruptions. Network changes affect user experience Equipment failures Routing changes Network congestion - PowerPoint PPT Presentation
Citation preview

Yaping Zhu [email protected]
Advisor: Prof. Jennifer RexfordPrinceton University
Minimizing Wide-Area Performance Disruptions in Inter-Domain Routing

Minimize Performance Disruptions
• Network changes affect user experience– Equipment failures– Routing changes– Network congestion
• Network operators have to react and fix problems– Fix equipment failure– Change route selection– Change server selection
2

Diagnosis Framework: Enterprise Network
3
Measure: network changes
Diagnose
Fix: equipment, config, etc.
Full Visibility Full Control
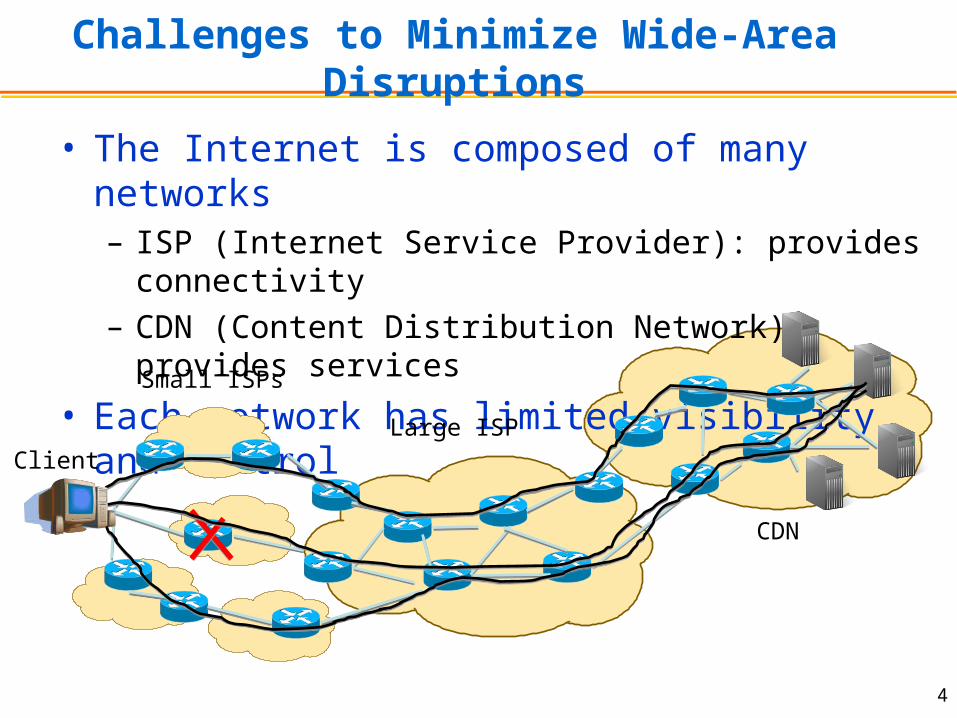
Challenges to Minimize Wide-Area Disruptions
• The Internet is composed of many networks– ISP (Internet Service Provider): provides connectivity– CDN (Content Distribution Network): provides services
• Each network has limited visibility and control
4
Client
Small ISPs
Large ISP
CDN

ISP’s Challenge: Provide Good Transit for Packets
• Limited visibility– Small ISP: lack of visibility into problem
• Limited control– Large ISP: lack of direct control to fix congestion
5
Client
Small ISPs
Large ISP
CDN

CDN’s Challenge: Maximize Performance for Services
• Limited visibility– CDN: can’t figure out exact root cause
• Limited control– CDN: lack of direct control to fix problem
6
Client
Small ISPs
Large ISP
CDN

Summary of Challenges of Wide-Area Diagnosis
• Measure: large volume and diverse kinds of data• Diagnosis today: ad-hoc
– Takes a long time to get back to customers– Does not scale to large number of events
7
Our Goal: Build Systems for Wide-Area DiagnosisFormalize and automate the diagnosis processAnalyze a large volume of measurement data

Techniques and Tools for Wide-Area Diagnosis
8
Tool Problem Statement Results
Route Oracle
Track route changes scalably for ISPs
Deployed at AT&T[IMC09, PER10]
NetDiag Diagnose wide-area latency increases for CDNs
Deployed at GoogleIn submission

Rethink Routing Protocol Design
• Many performance problems caused by routing– Route selection not based on performance – 42.2% of the large latency increases in a large CDN
correlated with inter-domain routing changes– No support for multi-path routing
9
Our Goal: Routing Protocol for Better PerformanceFast convergence to reduce disruptionsRoute selection based on performance
Scalable multi-path to avoid disruptionsLess complexity for fewer errors

Thesis Outline
Chapter Problem Statement Results
Route Oracle
Track route changes scalably for ISPs
Deployed at AT&T[IMC09, PER10]
NetDiag Diagnose wide-area latency increases for CDNs
Deployed at GoogleIn submission
Next-hop BGP
Routing protocol designed for better performance
[HotNets10]In submission to CoNext
10

Work with: Jennifer Rexford Aman Shaikh and Subhabrata Sen
AT&T Research
Route Oracle: Where Have All the Packets Gone?

12
Route Oracle: Where Have All the Packets Gone?
IP Packet
Ingress Router
Egress Router
AS Path
AT&T IP Network
DestinationIP Address
• Inputs:– Destination: IP Address– When? Time– Where? Ingress router
• Outputs:– Where leaving the network? Egress router– What’s the route to destination? AS path

13
Application: Service-Level Performance Management
AT&T
AT&TCDN Server in Atlanta
Router in Atlanta Leave AT&T in Atlanta
Leave AT&T in Washington DC
Atlanta users
Sprint
• Troubleshoot CDN throughput drop• Case provided by AT&T ICDS (Intelligent
Content Distribution Service) Project

14
• IP prefix: IP address / prefix length– E.g. 12.0.0.0 / 8 stands for [12.0.0.0, 12.255.255.255]
• Suppose the routing table has routes for prefixes: – 12.0.0.0/8: [12.0.0.0-12.255.255.255]– 12.0.0.0/16: [12.0.0.0-12.0.255.255]– [12.0.0.0-12.0.255.255] covered by both /8 and /16
prefix
• Prefix nesting: IPs covered by multiple prefixes– 24.2% IP addresses are covered by more than one
prefix
Background: IP Prefix and Prefix Nesting

Background: Longest Prefix Match (LPM)
• BGP update format– by IP prefix – egress router, AS path
• Longest prefix match (LPM):– Routers use LPM to forward IP packets– LPM changes as routes are announced and withdrawn– 13.0% BGP updates cause LPM changes
15
Challenge: determine the route for an IP address -> LPM for the IP address -> track LPM changes for the IP address

Challenge: Scale of the BGP Data
• Data collection: BGP Monitor– Have BGP session with each router– Receive incremental updates of best routes
• Data Scale– Dozens of routers (one per city)– Each router has many prefixes (~300K)– Each router receives lots of updates (millions per day)
16BGP Routers
Software Router Centralized Server
Best routes

Background: BGP is Incremental Protocol
• Incremental Protocol– Routes not changed are not updated
• How to log routes for incremental protocol?– Routing table dump: daily– Incremental updates: 15mins
17BGP Routers
Software Router Centralized Server
Best routes
Daily table dump15 mins updates

Route Oracle: Interfaces and Challenges
• Challenges– Track longest prefix match– Scale of the BGP data– Need answer to queries
• At scale: for many IP addresses• In real time: for network operation
Yaping Zhu, Princeton University18
Route Oracle
Inputs Destination IP Address Ingress Router Time
EgressRouter
BGP Routing DataBGP Routing Data
ASPath
Outputs

Strawman Solution: Track LPM Changesby Forwarding Table
• How to implement– Run routing software to update forwarding table– Forwarding table answers queries based on LPM
• Answer query for one IP address– Suppose: n prefixes in routing table at t1, m updates
from t1 to t2– Time complexity: O(n+m)– Space complexity:
• O(P): P stands for #prefixes covering the query IP address
19

Strawman Solution: Track LPM Changes by Forwarding Table
• Answer queries for k IP addresses– Keep all prefixes in forwarding table– Space complexity: O(n)
• Time complexity: major steps– Initialize n routes: n*log(n)+k*n– Process m updates: m*log(n)+k*m– In sum: (n+m)*(log(n)+k)
• Goal: reduce query processing time– Trade more space for less time: pre-processing– Store pre-processed results: not scale for 232 IPs– need to track LPM scalably
20

Track LPM Scalably: Address Range
• Prefix set– Collection of all matching prefixes for given IP address
• Address range– Contiguous addresses that have the same prefix set
• E.g. 12.0.0.0/8 and 12.0.0.0/16 in routing table– [12.0.0.0-12.0.255.255] has prefix set {/8, /16}– [12.1.0.0-12.255.255.255] has prefix set {/8}
• Benefits of address range– Track LPM scalably– No dependency between different address ranges
21

Track LPM by Address Range: Data Structure and Algorithm
• Tree-based data structure: node stands for address range• Real-time algorithm for incoming updates
22
[12.0.0.0-12.0.0.255]
[12.0.1.0-12.0.255.255]
[12.1.0.0-12.255.255.255]
/8 /16 /24 /8 /16 /8
Prefix BGP Route
12.0.0.0/8
12.0.0.0/16
12.0.0.0/24
Routing Table

Track LPM by Address Range: Complexity
• Pre-processing: – for n initial routes in the routing table and m updates– Time complexity: (n+m)*log(n)– Space complexity: O(n+m)
• Query processing: for k queries– Time complexity: O((n+m)*k)– Parallelization using c processors: O((n+m)*k/c)
23
Strawman approach Route Oracle
Space complexity O(n) O(n+m)
Pre-processing time O((n+m)*log(n))
Query time O((n+m)*(log(n)+k)) O((n+m)*k)
Query parallelization No Yes

24
Route Oracle: System Implementation
Precomputation
Query Inputs:Destination IPIngress routerTime
BGP Routing Data: Daily table dump, 15 mins updates
QueryProcessing
Daily snapshot of routes by address ranges
Output for each query:Egress router, AS path
Incremental route updates for address ranges

• Optimize for multiple queries– Amortize the cost of reading address range records:
across multiple queried IP addresses
• Parallelization– Observation: address range records could be
processed independently– Parallelization on multi-core machine
25
Query Processing: Optimizations

Performance Evaluation: Pre-processing
• Experiment on SMP server– Two quad-core Xeon X5460 Processors– Each CPU: 3.16 GHz and 6 MB cache– 16 GB of RAM
• Experiment design– BGP updates received over fixed time-intervals– Compute the pre-processing time for each batch of
updates
• Can we keep up? pre-processing time– 5 mins updates: ~2 seconds
– 20 mins updates: ~5 seconds
26

Performance Evaluation: Query Processing
27
• Query for one IP (duration: 1 day) • Route Oracle 3-3.5 secs; Strawman approach: minutes
• Queries for many IPs: scalability (duration: 1 hour)

Performance Evaluation: Query Parallelization
28

Conclusion
Challenges Contributions
1 Prefix nestingLPM changes
Introduce “address range”Track LPM changes scalably for many IPs
2 Scale of BGP data Tree based data structureReal-time algorithm for incoming updates
3 Answer queries at scale and in real time
Pre-processing: more space for less timeAmortize the processing for multiple queriesParallelize query processing
29

Work with: Jennifer Rexford Benjamin Helsley, Aspi Siganporia, and Sridhar Srinivasan
Google Inc.
NetDiag: Diagnosing Wide-Area Latency Changes for CDNs

Background: CDN Architecture
31
Ingress Router
Client
CDN Network
Egress RouterAS Path
Front-end Server (FE)
• Life of a client request• Front-end (FE) server selection
• Latency map• Load balancing (LB)

Challenges
• Many factors contribute to latency increase– Internal factors– External factors
• Separate cause from effect– e.g., FE changes lead to ingress/egress changes
• The scale of a large CDN– Hundreds of millions of users, grouped by ISP/Geo– Clients served at multiple FEs– Clients traverse multiple ingress/egress routers
32

Contributions
• Classification:– Separating cause from effect– Identify threshold for classification
• Metrics: analyze over sets of servers and routers– Metrics for each potential cause– Metrics by an individual router or server
• Characterization: – Events of latency increases in Google’s CDN (06/2010)
33

Background: Client Performance Data
34
Ingress Router
Client
CDN Network
Egress RouterAS Path
Front-end Server (FE)
Performance Data
Performance Data Format:IP prefix, FE, Requests Per Day (RPD), Round-Trip Time (RTT)

Background: BGP Routing and Netflow Traffic
• Netflow traffic (at edge routers): 15 mins by prefix– Incoming traffic: ingress router, FE, bytes-in– Outgoing traffic: egress router, FE, bytes-out
• BGP routing (at edge routers): 15 mins by prefix– Egress router and AS path
35

Background: Joint Data Set
• Granularity– Daily– By IP prefix
• Format– FE, requests per day (RPD), round-trip time (RTT)– List of {ingress router, bytes-in}– List of {egress router, AS path, bytes-out}
36
BGP Routing DataBGP Routing Data Netflow Traffic DataNetflow Traffic Data Performance DataPerformance Data
Joint Data Set
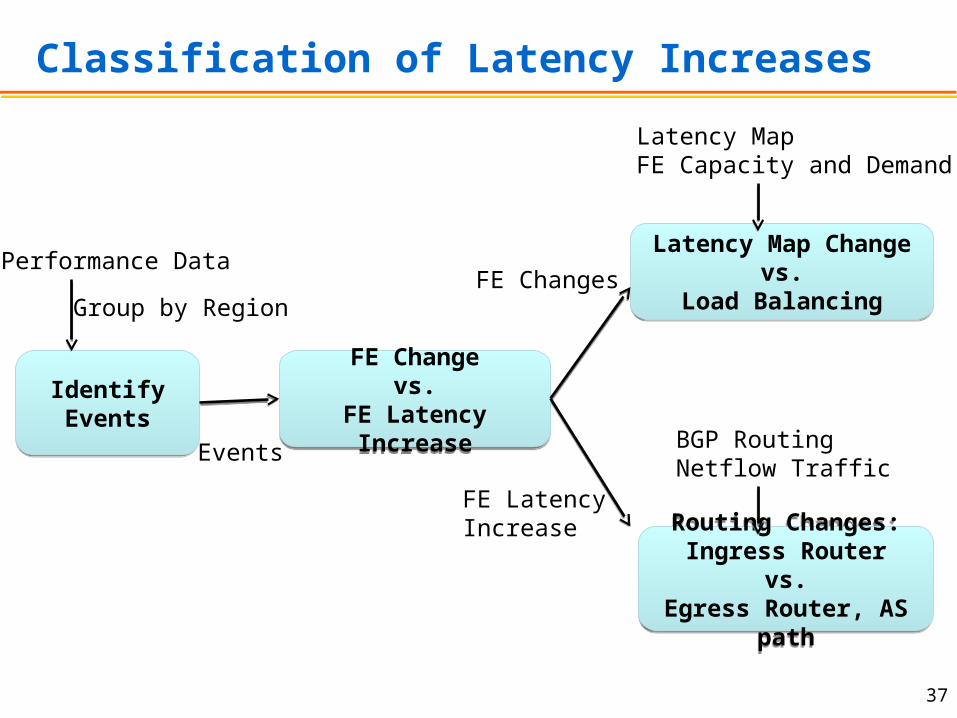
Classification of Latency Increases
37
Identify EventsIdentify Events
FE Changevs.
FE Latency Increase
FE Changevs.
FE Latency Increase
Latency Map Changevs.
Load Balancing
Latency Map Changevs.
Load Balancing
Routing Changes:Ingress Router
vs.Egress Router, AS
path
Routing Changes:Ingress Router
vs.Egress Router, AS
path
Performance Data
Group by Region
Events
FE Changes
FE Latency Increase
Latency MapFE Capacity and Demand
BGP RoutingNetflow Traffic

Case Study: Flash Crowd Leads some Requests to a Distant Front-End Server
• Identify event: RTT doubled for an ISP in Malaysia
• Diagnose: follow the decision tree
38
FE Changevs.
FE Latency Increase
FE Changevs.
FE Latency Increase
Latency Map Changevs.
Load Balancing
Latency Map Changevs.
Load Balancing
Latency MapFE Capacity and Demand
RPD (requests per day) jumped: RPD2/RPD1 = 2.5
97.9% by FE changes32.3% FE changeBy load balancing

Classification: FE Server and Latency Metrics
39
Identify EventsIdentify Events
FE Changevs.
FE Latency Increase
FE Changevs.
FE Latency Increase
Latency Map Changevs.
Load Balancing
Latency Map Changevs.
Load Balancing
Routing Changes:Ingress Router
vs.Egress Router, AS
path
Routing Changes:Ingress Router
vs.Egress Router, AS
path
Performance Data
Group by Region
Events
FE Changes
FE Latency Increase
Latency MapFE Capacity and Demand
BGP RoutingNetflow Traffic

FE Change vs. FE Latency Increase
40
€
ΔRTT = (RTT2i *RPD2i
RPD2
− RTT1i *RPD1i
RPD1
)i
∑
€
RTT = RTTi *RPDiRPDi
∑
• RTT: weighted by requests from FEs
• Break down RTT change by two factors• FE change
– Clients switch from one FE to another (with higher RTT)
• FE latency change– Clients using the same FE, latency to FE increases
€
ΔFE
€
ΔLat

FE Change vs. FE Latency Change Breakdown
• FE change
• FE latency change
• Important properties– Analysis over a set of FEs– Sum up to 1
41
€
ΔFE =i
∑ RTT2i * (RPD2i
RPD2
−RPD1i
RPD1
) /ΔRTT
€
ΔLat =i
∑ (RTT2i − RTT1i) *RPD1i
RPD1
/ΔRTT
€
ΔFE + ΔLat =1

FE Changes: Latency Map vs. Load Balancing
42
Identify EventsIdentify Events
FE Changevs.
FE Latency Increase
FE Changevs.
FE Latency Increase
Latency Map Changevs.
Load Balancing
Latency Map Changevs.
Load Balancing
Routing Changes:Ingress Router
vs.Egress Router, AS
path
Routing Changes:Ingress Router
vs.Egress Router, AS
path
Performance Data
Group by Region
Events
FE Changes
FE Latency Increase
Latency MapFE Capacity and Demand
BGP RoutingNetflow Traffic

FE Changes: Latency Map vs. Load Balancing
43
FE Changevs.
FE Latency Increase
FE Changevs.
FE Latency Increase
Latency Map Changevs.
Load Balancing
Latency Map Changevs.
Load BalancingFE Changes
Latency MapFE Capacity and Demand
• Classify FE changes by two metrics:• Fraction of traffic shift by latency map• Fraction of traffic shift by load balancing

Latency Map: Closest FE Server
• Calculate latency map– Latency map format: (prefix, closest FE)– Aggregate by groups of clients:
list of (FEi, ri)
ri: fraction of requests directed to FEi by latency map
• Define latency map metric
44
€
ΔLatMap = | r2i − r1i | /2i
∑

Load Balancing: Avoiding Busy Servers
• FE request distribution change
• Fraction of requests shifted by the load balancer
– Sum only if positive: target request load > actual load
• Metric: more traffic load balanced on day 2
45
€
ΔFEDist = |RPD2i
RPD2i
∑ −RPD1i
RPD1
| /2
€
LoadBalance1 = [r1i −RPD1i
RPD1i
∑ ]+
€
ΔLoadBal = LoadBalance2 − LoadBalance1
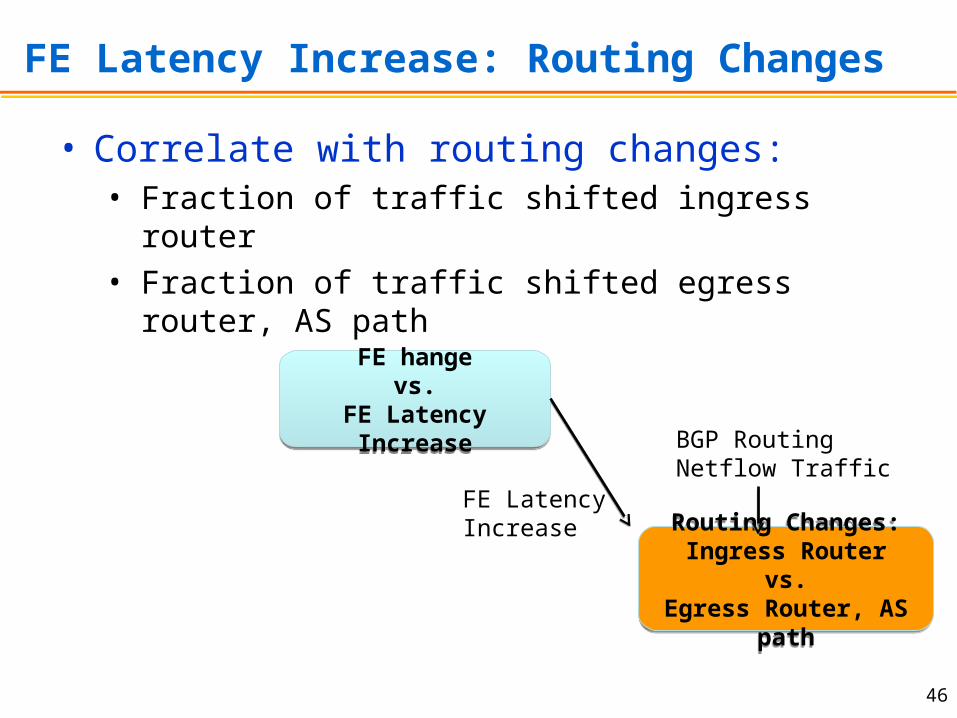
FE Latency Increase: Routing Changes
46
FE hangevs.
FE Latency Increase
FE hangevs.
FE Latency Increase
Routing Changes:Ingress Router
vs.Egress Router, AS
path
Routing Changes:Ingress Router
vs.Egress Router, AS
path
FE Latency Increase
BGP RoutingNetflow Traffic
• Correlate with routing changes:• Fraction of traffic shifted ingress router• Fraction of traffic shifted egress router, AS path

Routing Changes: Ingress, Egress, AS Path
47
• Identify the FE with largest impact
• Calculate fraction of traffic which shifted routes– Ingress router:
• f1j, f2j: fraction of traffic entering ingress j on days 1 and 2
– Egress router and AS path
• g1k, g2k: fraction of traffic leaving egress/AS path k on day 1, 2
€
ΔLati = (RTT2i − RTT1i) *RPD1i
RPD1
/ΔRTT
€
ΔIngress = | f2 j − f1 j | /2j
∑
€
ΔEgressASPath = | g2k − g1k | /2k
∑

Identify Significant Performance Disruptions
48
Identify EventsIdentify Events
FE Changevs.
FE Latency Increase
FE Changevs.
FE Latency Increase
Latency Map Changevs.
Load Balancing
Latency Map Changevs.
Load Balancing
Routing Changes:Ingress Router
vs.Egress Router, AS
path
Routing Changes:Ingress Router
vs.Egress Router, AS
path
Performance Data
Group by Region
Events
FE Changes
FE Latency Increase
Latency MapFE Capacity and Demand
BGP RoutingNetflow Traffic

Identify Significant Performance Disruptions
• Focus on large events– Large increases: >= 100 msec, or doubles– Many clients: for an entire region (country/ISP)– Sustained period: for an entire day
• Characterize latency changes– Calculate daily latency changes by region
49
Event Category Percentage
Latency Increase by more than 100 msec 1%
Latency more than doubles 0.45%

Latency Characterization for Google’s CDN
50
Category % Events
FE latency increase 73.9%
Ingress router 10.3%
(Egress router, AS path) 14.5%
Both 17.4%
Unknown 31.5%
FE server change 34.7%
Latency map 14.2%
Load balancing 2.9%
Both 9.3%
Unknown 8.4%
Total 100.0%
• Apply the classification to one month of data (06/2010)

Conclusion and Future Work
• Conclusion– Method for automatic classification of latency increases– Tool deployed at Google since 08/2010
• Future work– More accurate diagnosis on smaller timescale– Incorporate active measurement data
51

Work with: Michael Schapira, Jennifer Rexford Princeton University
Putting BGP on the Right Path:Better Performance via Next-Hop
Routing

Motivation: Rethink BGP Protocol Design
• Many performance problems caused by routing– Slow convergence during path exploration– Path selection based on AS path length, not
performance– Selecting a single path, rather than multiple– Vulnerability to attacks that forge the AS-PATH
53
Many performance problems related to:Routing decision based on AS path length, not performance

Next-Hop Routing: for Better Performance
• Control plane: path-based routing -> next-hop routing– Fast convergence through less path exploration– Scalable multipath routing without exposing all paths
• Data plane: performance and security– Path selection based on performance– Reduced attack surface without lying on AS-PATH
54

Today’s BGP: Path-Based Routing
55
3 d
1
2
32d > 31d
Don’t export 2d
to 3
1, 2, I’m available
3, I’m using 1d

Background: BGP Decision Process
• Import policy• Decision process
– Prefer higher local preference– Prefer shorter AS path length– etc.
• Export policy
56
Receiveroute updates
from neighbors
Choose single “best”route
(ranking)
Send route updates to neighbors
(export policy)
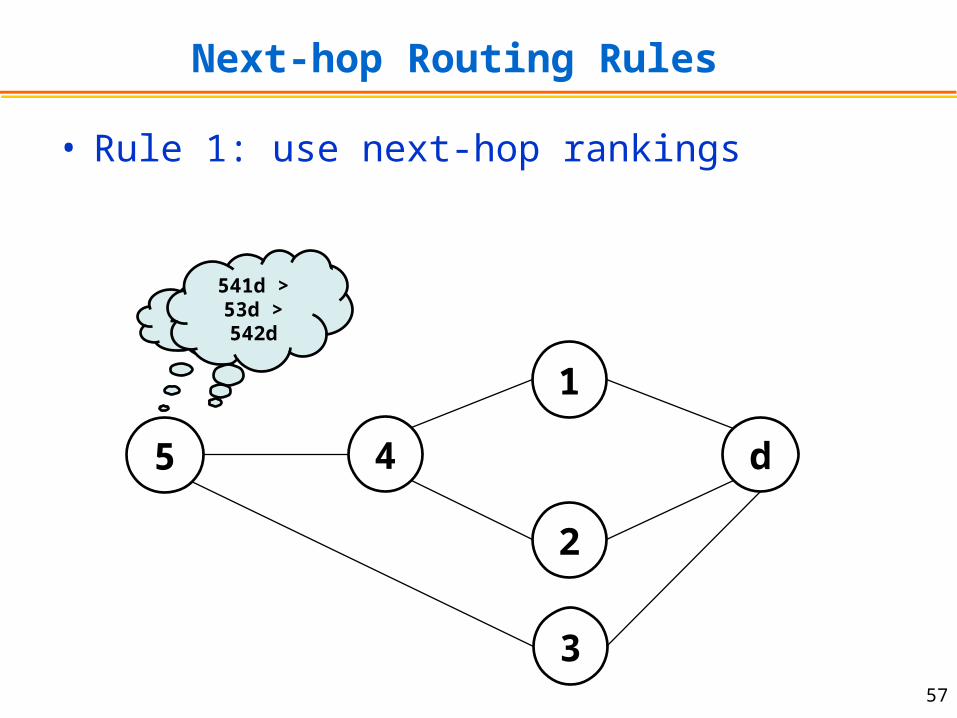
Next-hop Routing Rules
• Rule 1: use next-hop rankings
57
4 d
3
5
1
2
4 > 3
541d > 53d > 542d

Next-hop Routing Rules
• Rule 1: use next-hop rankings• Rule 2: prioritize current route
– To minimize path exploration
58
2
d
3
1
2=3Break ties in
favor of lower AS number
2=3Prioritize current route

Next-hop Routing Rules
• Rule 1: use next-hop rankings• Rule 2: prioritize current route• Rule 3: consistently export:
– If a route P is exportable to a neighbor AS i, then so must be all routes that are more highly ranked than P.
– To avoid disconnecting upstream nodes
59
3 d41
1 > 2,Export 32d, but not 31d,
to 4
1 > 2,Export 31d
to 4
2

Next-Hop Routing: for Better Performance
• Control plane– Fast convergence– Scalable multipath routing
• Data plane– Performance-driven routing– Reduced attack surface
60

Simulation Setup
• C-BGP simulator. Cyclops AS-level topology– Jan 1st 2010: 34.0k ASes, 4.7k non-stubs
• Protocols– BGP, Prefer Recent Route (PRR), Next-hop routing
• Metrics– # updates, # routing changes, # forwarding changes
• Events: – prefix up, link failure, link recovery
• Methodology: – 500 experiments– vantage points: all non-stubs, randomly chosen 5k stubs
61

Fast Convergence: # Updates
62
• X-axis: # updates after a link failure• Y-axis: Fraction of non-stubs with more than x updates

Fast Convergence: # Routing Changes
63
• X-axis: # routing changes after a link failure• Y-axis: Fraction of non-stubs with more than x changes

Next-Hop Routing: for Better Performance
• Control plane– Fast convergence– Scalable multipath routing
• Data plane– Performance-driven routing– Reduced attack surface
64

Multipath with Today’s BGP: Not Scalable
65
d
5
6
78
I’m using 1 and 2
I’m using 3 and 4
I’m using 5-1, 5-2, 6-3 and 6-4
1
2
3
4

Making Multipath Routing Scalable
66
d
5
6
78
I’m using {1,2}
I’m using {3,4}
I’m using {1,2,3,4,5,6}
1
2
3
4
• Benefits: availability, failure recovery, load balancing

Next-Hop Routing: for Better Performance
• Control plane– Fast convergence– Scalable multipath routing
• Data plane– Performance-driven routing– Reduced attack surface
67

Performance-driven Routing
• Next-hop routing can lead to longer paths– Evaluate across events: prefix up, link failure/recovery– 68.7%-89.9% ASes have same path length– Most other ASes experience one extra hop
• Decision based on measurements of path quality– Performance metrics: throughput, latency, or loss– Adjust ranking of next-hop ASes – Split traffic over multiple next-hop ASes
68
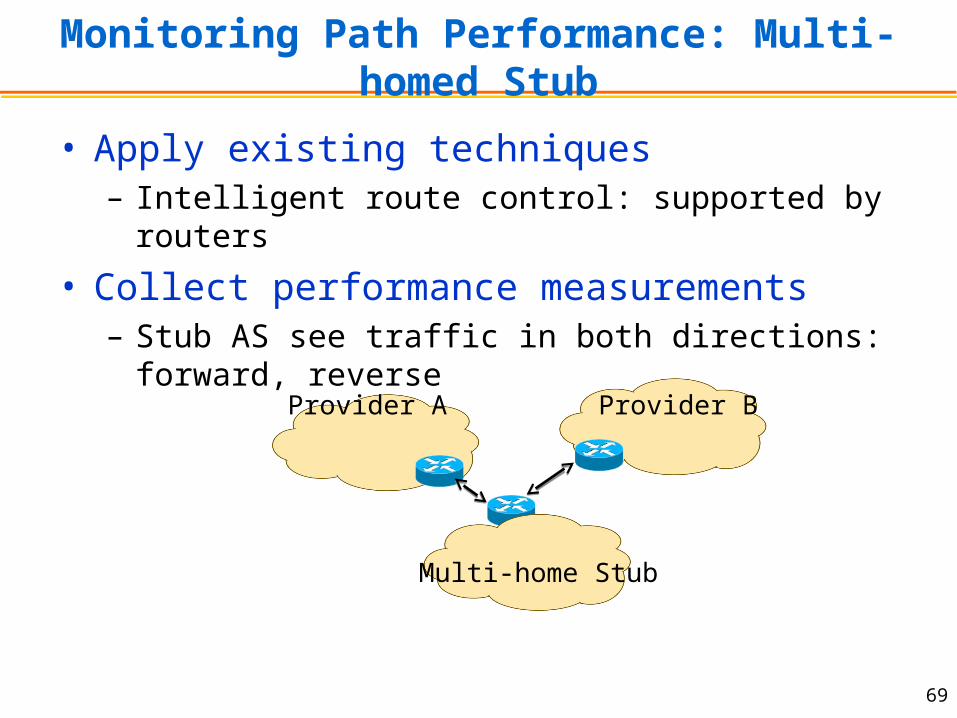
Monitoring Path Performance: Multi-homed Stub
• Apply existing techniques– Intelligent route control: supported by routers
• Collect performance measurements– Stub AS see traffic in both directions: forward, reverse
69
Multi-home Stub
Provider A Provider B

Monitoring Path Performance: Service Provider
• Monitor end-to-end performance for clients– Collect logs at servers: e.g. round-trip time
• Explore alternate routes: route injection– Announce more-specific prefix– Direct a small portion of traffic on alternate path
• Active probing on alternate paths
70

Monitoring Path Performance: ISPs
• Challenges– Most traffic does not start or end in ISP network– Asymmetric routing
• Focus on single-homed customers– Why single-homed?
• See both directions of the traffic
– How to collect passive flow measurement selectively?• Hash-based sampling
71

Next-Hop Routing: for Better Performance
• Control plane– Fast convergence– Scalable multipath routing
• Data plane– Performance-driven routing– Reduced attack surface
72

Security
• Reduced attack surface– Attack: announce shorter path to attract traffic– Next-hop routing: AS path not used, cannot be forged!
• Incentive compatible– Definition: AS cannot get a better next-hop by deviating
from protocol (e.g. announce bogus route, report inconsistent information to neighbors)
– Theorem [1]: ASes do not have incentives to violate the next-hop routing protocol
• End-to-end security mechanisms: – Not rely on BGP for data-plane security– Use encryption, authentication, etc.
73
[1] J. Feigenbaum, V. Ramachandran, and M. Schapira, “Incentive-compatible interdomain routing”, in Proc. ACM Electronic Commerce, pp. 130-139, 2006.

Conclusion
• Next-hop routing for better performance– Control-plane: fast convergence, scalable multipath– Data-plane: performance-driven routing, less attacks
• Future work– Remove the AS path attribute entirely– Stability and efficiency of performance-driven routing
74

Conclusion
Chapter Contributions Results
Route Oracle
Analysis of prefix nesting, LPM changesTrack LPM scalably by address rangeSystem implementation with optimizations
Deployed at AT&T[IMC09, PER10]
NetDiag Classification for causes of latency increasesMetrics to analyze sets of servers and routersLatency characterization for Google’s CDN
Deployed at GoogleIn submission
Next-hop BGP
Proposal of BGP variant by next-hop routingEvaluate better convergenceScalable multi-pathperformance-driven routing
[HotNets10]In submission to CoNext
75