Embed Size (px)
Citation preview
ABSTRACT
The conceptual leap from point array to diffraction pat-terns has long been recognized as challenging. For morethan sixty years it has been known that an analogy can bedrawn between optical and X-ray diffraction, requiringonly a source of monochromatic light and an array of scat-terers with spacings of 50 - 200 µm. Inexpensive lasers ful-fill the first requirement, but the second has beenproblematic due to difficulties in producing scattering ar-rays. A number of approaches have been used, includingpantograph reduction, several types of photographic re-duction, and even standard sieves, but all require signifi-cant preparation, limiting in-lab experimentation.
Laser printers with resolutions of 600 or 1200 dots perinch (one dot per 42 or 21 µm) are inexpensive and readilyavailable. Improvements in the screen magnification capa-bilities of common graphics software allow students tocreate and modify arrays, print them on transparencies,and illuminate them with laser pointers. Introductory ex-amples can demonstrate basic principles, whereas ad-vanced examples can illustrate plane lattices, stackingfaults or even powder diffraction. The turnaround timefrom idea to observation is as little as a few minutes, al-lowing students to experiment with near real-time feed-back.
Keywords: Education - graduate; education - undergrad-uate; geology - teaching and curriculum; mineralogy andcrystallography.
INTRODUCTION
Teaching students how to collect and examine data on acomputer-automated powder diffractometer is not a chal-lenging task. Although some have ventured into more il-lustrative exercises that make substantial use of moderndiffractometer software (Horton, 1994; Brady and New-ton, 1995; Hluchy, 1999), instruction consists principally ofdemonstrations of the mechanics (physical as well as com-putational) of X-ray diffraction, superficial discussions ofthe principles, followed by on cue recitations. The resultsreflect this; students enjoy the chance to do somethinghands-on, usually appreciate some of the applications, butmiss a deeper understanding. This is through no real faultof the students: what could be more “black-box” than pro-cedures whose results are dependent on the arrangement,spacing and type of atoms in crystals?
The recognition of this obstacle, and of the idealmeans of surmounting it, date back to the earliest work inX-ray diffraction. As noted by Harburn and others, (1975)“The idea of using optical analogues to aid in the interpre-
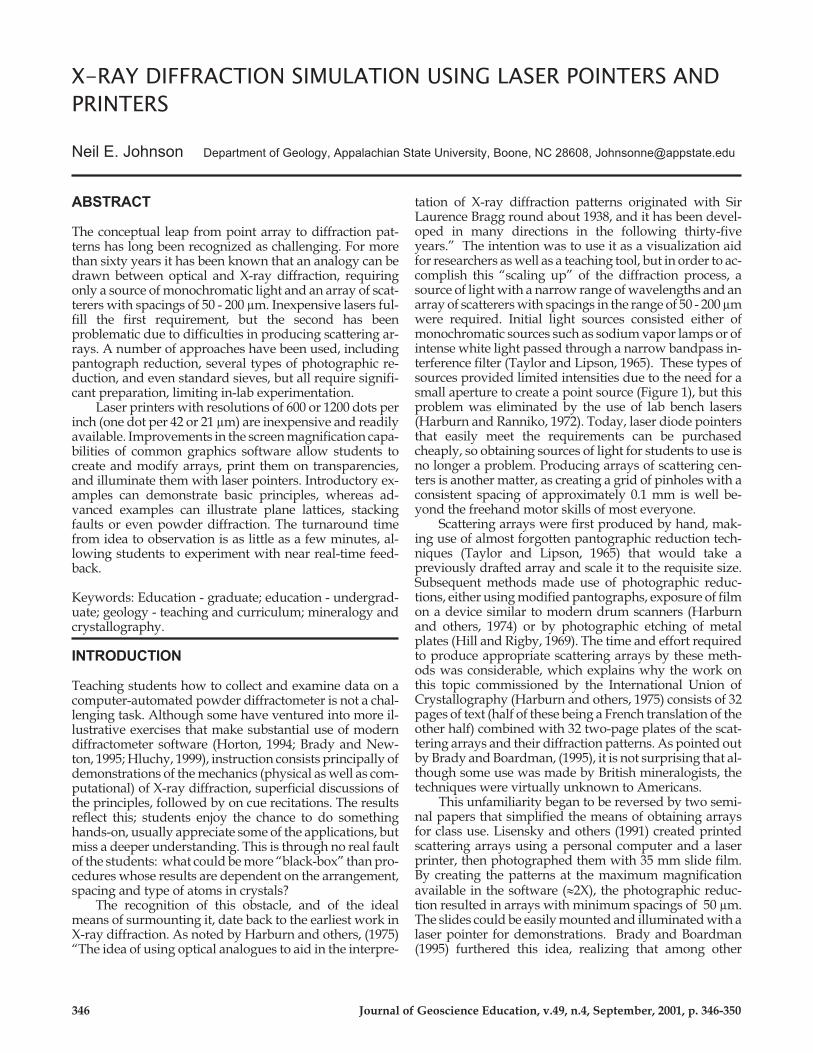
tation of X-ray diffraction patterns originated with SirLaurence Bragg round about 1938, and it has been devel-oped in many directions in the following thirty-fiveyears.” The intention was to use it as a visualization aidfor researchers as well as a teaching tool, but in order to ac-complish this “scaling up” of the diffraction process, asource of light with a narrow range of wavelengths and anarray of scatterers with spacings in the range of 50 - 200 µmwere required. Initial light sources consisted either ofmonochromatic sources such as sodium vapor lamps or ofintense white light passed through a narrow bandpass in-terference filter (Taylor and Lipson, 1965). These types ofsources provided limited intensities due to the need for asmall aperture to create a point source (Figure 1), but thisproblem was eliminated by the use of lab bench lasers(Harburn and Ranniko, 1972). Today, laser diode pointersthat easily meet the requirements can be purchasedcheaply, so obtaining sources of light for students to use isno longer a problem. Producing arrays of scattering cen-ters is another matter, as creating a grid of pinholes with aconsistent spacing of approximately 0.1 mm is well be-yond the freehand motor skills of most everyone.
Scattering arrays were first produced by hand, mak-ing use of almost forgotten pantographic reduction tech-niques (Taylor and Lipson, 1965) that would take apreviously drafted array and scale it to the requisite size.Subsequent methods made use of photographic reduc-tions, either using modified pantographs, exposure of filmon a device similar to modern drum scanners (Harburnand others, 1974) or by photographic etching of metalplates (Hill and Rigby, 1969). The time and effort requiredto produce appropriate scattering arrays by these meth-ods was considerable, which explains why the work onthis topic commissioned by the International Union ofCrystallography (Harburn and others, 1975) consists of 32pages of text (half of these being a French translation of theother half) combined with 32 two-page plates of the scat-tering arrays and their diffraction patterns. As pointed outby Brady and Boardman, (1995), it is not surprising that al-though some use was made by British mineralogists, thetechniques were virtually unknown to Americans.
This unfamiliarity began to be reversed by two semi-nal papers that simplified the means of obtaining arraysfor class use. Lisensky and others (1991) created printedscattering arrays using a personal computer and a laserprinter, then photographed them with 35 mm slide film.By creating the patterns at the maximum magnificationavailable in the software (�2X), the photographic reduc-tion resulted in arrays with minimum spacings of 50 µm.The slides could be easily mounted and illuminated with alaser pointer for demonstrations. Brady and Boardman(1995) furthered this idea, realizing that among other
346 Journal of Geoscience Education, v.49, n.4, September, 2001, p. 346-350
X-RAY DIFFRACTION SIMULATION USING LASER POINTERS AND
PRINTERS
Neil E. Johnson Department of Geology, Appalachian State University, Boone, NC 28608, [email protected]
things, standard sieves of appropriate sizes could also beused for such demonstrations. They also demonstratedthe similarities between the optical diffraction patternsand precession photographs, and even extended the anal-ogy to the point of simulating Debye-Scherrer geometryby suspending a line grating into a fishbowl lined with pa-per. A computer variant of this, in which all of the diffrac-tion information is calculated and displayed, is alsoavailable (Neder and Proffen, 1996).
This recent work has gone a long way towards thegoal of allowing students to discover for themselves whatoccurs in the process of X-ray diffraction, but still containsan important obstacle: all of the scattering arrays must becreated ahead of time. Students may choose from any ofthe previously prepared options, but cannot manipulatethe arrays to determine the results with direct feedback.
DIRECT PRODUCTION OF SCATTERING AR-
RAYS
Perhaps the most unappreciated aspect of the personalcomputer revolution has been the parallel revolution inpersonal computer output. Twenty years ago dot matrixprintouts were perfectly acceptable but today we expectresolution and quality from printers virtually indistin-guishable from that of commercial presses. For nearly thesame price as a 300 dot per inch (dpi) laser printer a dozenyears ago, printers are available with ten times the speedand four times the resolution, meaning an inexpensive (�$500) laser printer can image dots with separations assmall as 42 µm (600 dpi resolution). Improvements ingraphics software have matched the abilities of the outputdevices, allowing for the direct manipulation of graphicson the computer screens at magnifications over 30X. Theend result is that scattering arrays can be created, editedand printed directly onto clear overhead transparencieswith no post-printing reduction requirements: straightfrom the laser printer to the laser pointer.
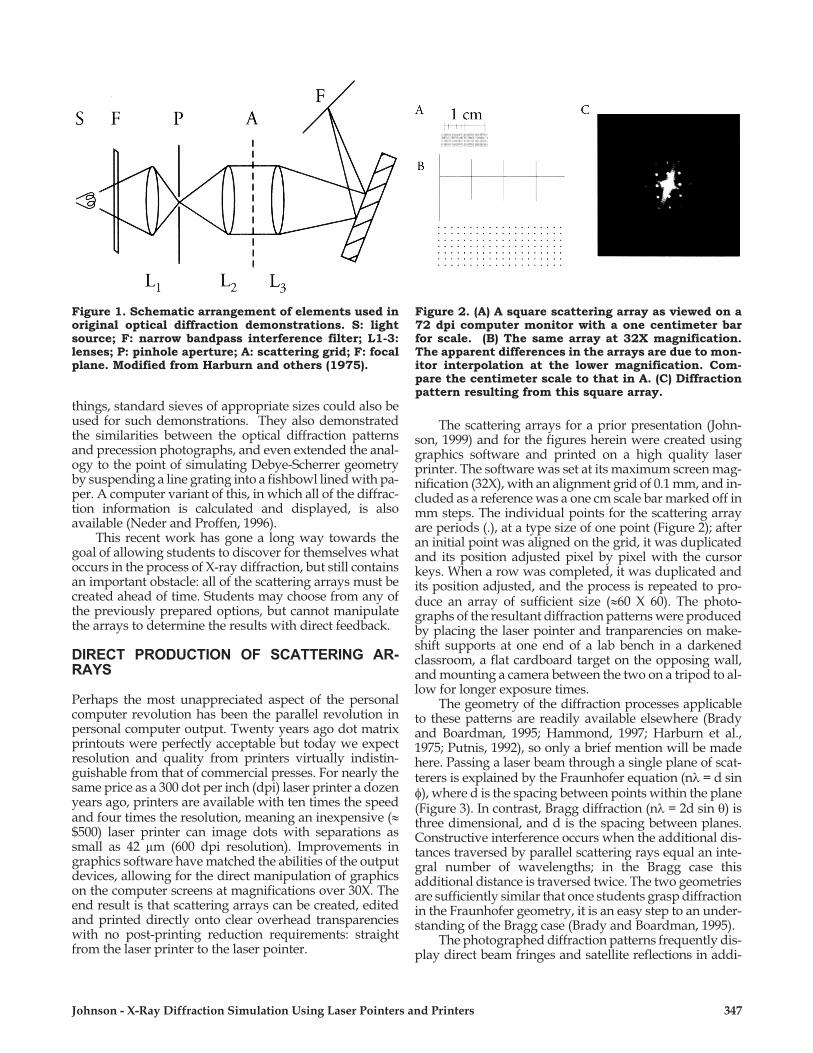
The scattering arrays for a prior presentation (John-son, 1999) and for the figures herein were created usinggraphics software and printed on a high quality laserprinter. The software was set at its maximum screen mag-nification (32X), with an alignment grid of 0.1 mm, and in-cluded as a reference was a one cm scale bar marked off inmm steps. The individual points for the scattering arrayare periods (.), at a type size of one point (Figure 2); afteran initial point was aligned on the grid, it was duplicatedand its position adjusted pixel by pixel with the cursorkeys. When a row was completed, it was duplicated andits position adjusted, and the process is repeated to pro-duce an array of sufficient size (�60 X 60). The photo-graphs of the resultant diffraction patterns were producedby placing the laser pointer and tranparencies on make-shift supports at one end of a lab bench in a darkenedclassroom, a flat cardboard target on the opposing wall,and mounting a camera between the two on a tripod to al-low for longer exposure times.
The geometry of the diffraction processes applicableto these patterns are readily available elsewhere (Bradyand Boardman, 1995; Hammond, 1997; Harburn et al.,1975; Putnis, 1992), so only a brief mention will be madehere. Passing a laser beam through a single plane of scat-terers is explained by the Fraunhofer equation (n� = d sin�), where d is the spacing between points within the plane(Figure 3). In contrast, Bragg diffraction (n� = 2d sin �) isthree dimensional, and d is the spacing between planes.Constructive interference occurs when the additional dis-tances traversed by parallel scattering rays equal an inte-gral number of wavelengths; in the Bragg case thisadditional distance is traversed twice. The two geometriesare sufficiently similar that once students grasp diffractionin the Fraunhofer geometry, it is an easy step to an under-standing of the Bragg case (Brady and Boardman, 1995).
The photographed diffraction patterns frequently dis-play direct beam fringes and satellite reflections in addi-
Johnson - X-Ray Diffraction Simulation Using Laser Pointers and Printers 347
Figure 1. Schematic arrangement of elements used inoriginal optical diffraction demonstrations. S: lightsource; F: narrow bandpass interference filter; L1-3:lenses; P: pinhole aperture; A: scattering grid; F: focalplane. Modified from Harburn and others (1975).
Figure 2. (A) A square scattering array as viewed on a72 dpi computer monitor with a one centimeter barfor scale. (B) The same array at 32X magnification.The apparent differences in the arrays are due to mon-itor interpolation at the lower magnification. Com-pare the centimeter scale to that in A. (C) Diffractionpattern resulting from this square array.

348 Journal of Geoscience Education, v.49, n.4, September, 2001, p. 346-350
tion to the main reflections, due to the use of the laserpointer as a source. Although each of the printed arrays isrelatively large (1 – 4 cm2), the typical beam diameter of alaser pointer is only about three mm, so only a fraction ofthe array diffracts at any one time. In some cases, the satel-lites and fringes can obscure parts of the diffraction pat-tern. This can be solved by using a bench top laser fittedwith a series of lenses that expand the beam diameterwhile maintaining collimation. Such laser beam expand-ers are commercially available from laboratory optics ven-dors.
EXAMPLES
The examples included here include some of the basic andsome of the more advanced applications that are possible.Figure 2A is an example of how a basic square array ap-pears at normal (1X) magnification, whereas 2B is thesame array at 32X, and 2C shows the diffraction patternthat results. Figure 4A is a square with a much larger unitcell, and 4B is the pattern showing the apparentlycounterintuitive result: a larger number of more closelyspaced spots. This demonstrates the reciprocal relation-ship between a scattering array and its diffraction pattern,an observation that can stand on its own or lead to discus-sions about reciprocal space. Arrays representing theother four plane lattices are reasonably simple to create.As an example, Figures 4C and D show a diamond arrayand the resultant diffraction pattern.
Of the simple patterns, perhaps the most interestingcan be found in Figure 4E, showing a small fragment of arectangular array adjacent to a large number of duplicatesof that same fragment, each rotated by random amountsand directions in the plane of the page. These represent in-dividual crystallites, so the pattern that emerges (Figure4F) consists of a ring – a powder pattern. A bench laserwith an expander lens set will illuminate a large area of thearray, producing more rings that are sharper, and better
organized, whereas using a laser pointer results in morediffuse and “spotty” rings, which (if desired) can be com-pared to poorer quality Debye-Scherrer films. In this case,the appearance of the ring is enhanced by tracking the la-ser beam across the array (or vice versa); the ring will re-main in place while the randomly scattered points move
At a more advanced level, the ability to directly ma-nipulate individual scattering points or rows and/or col-umns of points allows for the creation and discussion ofmore subtle diffraction effects. Figure 5A displays a seriesof stacking faults: the horizontal layer offsets are one-thirdand two-thirds of the horizontal cell dimension, and thefault probability for each layer is 0.5. The diffraction result(Figure 5B) is the production of numerous satellite reflec-tions along with the first-order spots in same direction asthe faulting, which can be contrasted with the lack of extrareflections for the zero-order spots and for higher orderspots in the unfaulted direction. Figures 5C and D demon-
Figure 3. The geometry for Fraunhofer diffraction ver-sus that for Bragg diffraction. The equation resulting
from the Fraunhofer case is n� = d sin �, whereas in the
Bragg case is n� = 2d sin �. Modified from Lisensky etal. (1991).
Figure 4. (A) A square scattering array with a largerunit cell than that in Figure 2. (B) Resultant diffrac-tion pattern. (C) A diamond scattering array. (D) Resul-tant diffraction pattern. (E) Randomly oriented crys-tallites. (F) Resultant powder pattern. Illuminating dif-ferent areas of the array with a laser pointer will pro-duce complete or “spotty” rings, depending on howmany crystallites are illuminated, and tracking thebeam across the array makes the rings more evident.
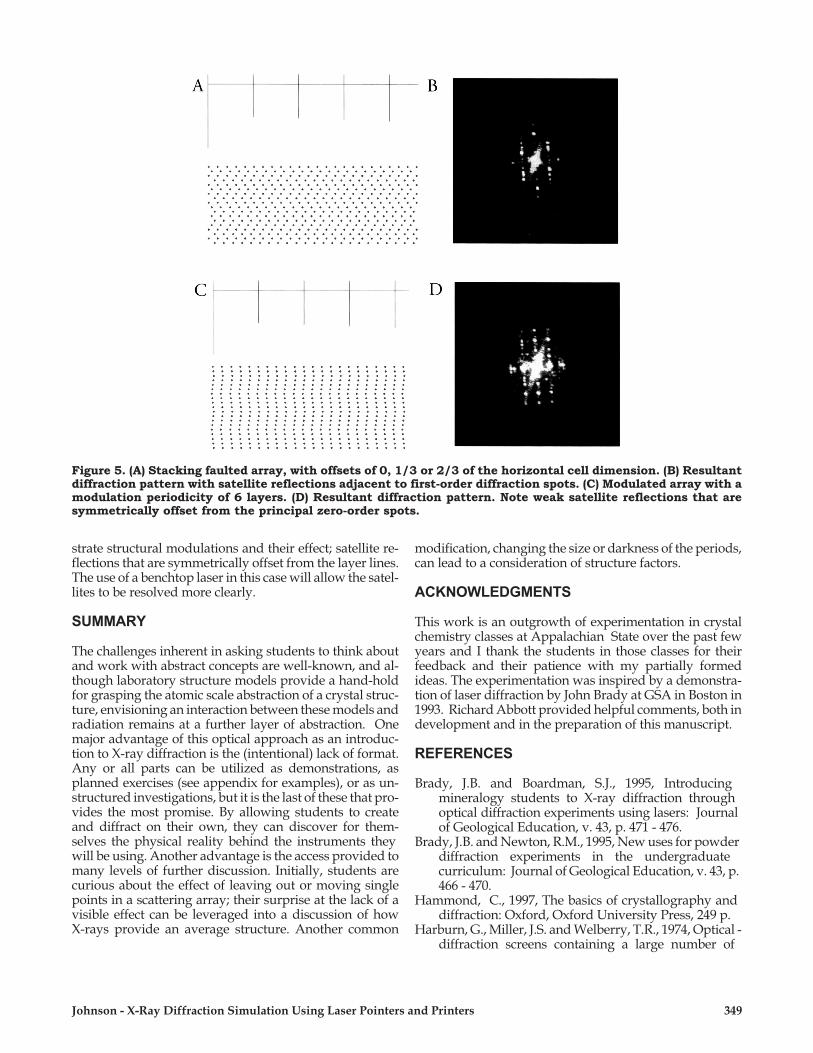
strate structural modulations and their effect; satellite re-flections that are symmetrically offset from the layer lines.The use of a benchtop laser in this case will allow the satel-lites to be resolved more clearly.
SUMMARY
The challenges inherent in asking students to think aboutand work with abstract concepts are well-known, and al-though laboratory structure models provide a hand-holdfor grasping the atomic scale abstraction of a crystal struc-ture, envisioning an interaction between these models andradiation remains at a further layer of abstraction. Onemajor advantage of this optical approach as an introduc-tion to X-ray diffraction is the (intentional) lack of format.Any or all parts can be utilized as demonstrations, asplanned exercises (see appendix for examples), or as un-structured investigations, but it is the last of these that pro-vides the most promise. By allowing students to createand diffract on their own, they can discover for them-selves the physical reality behind the instruments theywill be using. Another advantage is the access provided tomany levels of further discussion. Initially, students arecurious about the effect of leaving out or moving singlepoints in a scattering array; their surprise at the lack of avisible effect can be leveraged into a discussion of howX-rays provide an average structure. Another common
modification, changing the size or darkness of the periods,can lead to a consideration of structure factors.
ACKNOWLEDGMENTS
This work is an outgrowth of experimentation in crystalchemistry classes at Appalachian State over the past fewyears and I thank the students in those classes for theirfeedback and their patience with my partially formedideas. The experimentation was inspired by a demonstra-tion of laser diffraction by John Brady at GSA in Boston in1993. Richard Abbott provided helpful comments, both indevelopment and in the preparation of this manuscript.
REFERENCES
Brady, J.B. and Boardman, S.J., 1995, Introducingmineralogy students to X-ray diffraction throughoptical diffraction experiments using lasers: Journalof Geological Education, v. 43, p. 471 - 476.
Brady, J.B. and Newton, R.M., 1995, New uses for powderdiffraction experiments in the undergraduatecurriculum: Journal of Geological Education, v. 43, p.466 - 470.
Hammond, C., 1997, The basics of crystallography anddiffraction: Oxford, Oxford University Press, 249 p.
Harburn, G., Miller, J.S. and Welberry, T.R., 1974, Optical -diffraction screens containing a large number of
Johnson - X-Ray Diffraction Simulation Using Laser Pointers and Printers 349
Figure 5. (A) Stacking faulted array, with offsets of 0, 1/3 or 2/3 of the horizontal cell dimension. (B) Resultantdiffraction pattern with satellite reflections adjacent to first-order diffraction spots. (C) Modulated array with amodulation periodicity of 6 layers. (D) Resultant diffraction pattern. Note weak satellite reflections that aresymmetrically offset from the principal zero-order spots.
350 Journal of Geoscience Education, v.49, n.4, September, 2001, p. 346-350
apertures: Journal of Applied Crystallography, v.7, p.36-37.
Harburn, G. and Ranniko, J.K., 1972, An improved opticaldiffractometer: Journal of Physics E: ScientificInstrumentation, v. 5, p. 757-762.
Harburn, G., Taylor, C.A., and Welberry, T.R., 1975, Atlasof optical transforms: London, G. Bell & Sons, 32 p.
Hill, A.E. and Rigby, P.A., 1969, The precisionmanufacture and registration of masks for vacuumevaporation. Journal of Physics E: ScientificInstrumentation, v. 2, p. 1084-1086.
Hluchy, M.M., 1999, The value of teaching X-raytechniques and clay mineralogy to undergraduates:Journal of Geological Education, v. 47, p. 236 - 240.
Horton, R.A., Jr., 1994, X-ray diffraction as an instructionaltool at all levels of the geology curriculum: Journal ofGeological Education, v. 42, p. 452 - 454.
Johnson, N.E., 1999, Optical transforms redux: Creatingdiffraction gratings on a laser printer for X-raydiffraction simulation: Geological Society of America,Abstracts with Programs, v. 25, A-347.
Lisensky, G.C., Kelly, T.F., Neu, D.R., and Ellis, A. B., 1991,The optical transform, simulating diffractionexperiments in introductory courses: Journal ofChemical Education, v. 68, p. 91-96.
Neder, R.B. and Proffen, T.H., 1996, Teaching diffractionwith the aid of computer simulations: Journal ofApplied Crystallography, v.29, p. 727-735.
Putnis, A., 1992, Introduction to mineral sciences:Cambridge, Cambridge University Press, 457 p.
Taylor, C.A. and Lipson, H., 1965, Optical transforms.Their preparation and application to X-ray diffractionproblems: Ithaca, Cornell University Press, 182 p.
APPENDIX A - OUTLINE OF SAMPLE LABORATORY EXERCISE
Goals
Demonstrate the process of diffraction and the important features: basic trigonometric relationships, reciprocal re-lationships of distances between scattering points and diffraction spots, effect of wavelength on diffraction pattern.
Procedures
Introduce the concept of the diffraction of light (introductory physics texts usually contain a useful discussion). Ex-plain the process, with emphasis on constructive versus destructive interference and introduce the Fraunhoferequation. Set up a laser (bench laser or inexpensive pointer of wavelength 650 nm) and a primitive square scatteringarray printed on clear overhead transparency at one end of classroom. Place a target at other end of classroom(square ruled graph paper is convenient). Make certain that students do not look down direct laser beam. Have stu-dents measure distance from scattering array to target (Floor Distance or FD) and horizontal or vertical distancefrom direct beam spot to diffracted spot (Spot Distance or SD), then use this data and simple trigonometry to calcu-late the diffraction angle (phi). Note that for FD �� SD, � = sin �. Using the Fraunhofer equation and known laserwavelength, calculate the separation between scattering points (d). Measure several spot distances in this mannerand calculate and average value for d. Compare this measured d with value of d used to create scattering ray.
Change the wavelength of the light source (different color laser) and repeat experiment, which will demonstratethat the results are independent of wavelength used to make the measurements. Repeat the experiment using aprimitive square array of different d, to demonstrate the reciprocal relationship between the diffraction pattern andactual scattering array. Introduce the Bragg equation and compare and contrast this with the Fraunhofer equation.Provide students with precession photographs, known camera distance (CD to replace FD) and x-ray wavelength.Have students calculate d-spacings for crystal.
Further Directions
Using the concepts of Miller indices, have the students index the spots on the primitive diffraction pattern. Providethe students with a centered square array to index and determine d-spacings for the crystal. Discuss the effects ofcentering on diffraction patterns.
In a computer lab, provide students with the graphics software used to create the scattering arrays, a sample array(or two) to edit, and blank overhead transparencies. Direct students to edit the arrays as they see fit, print them out,and describe the effects the changes have on the diffraction patterns. Students may also be organized into groups forthis exercise, with each group required to present their results to the class.