Embed Size (px)
Citation preview

www.antonydavies.org
There are two types of seat in the room:
35 Consumers14 Insurers
Sit one person to each seat.If you are comfortable doing a lot of rudimentary
math, sit at an Insurer seat.
After all the seats are filled, extra bodies should team up with insurers.
Do not team up with consumers.

www.antonydavies.org
Health Insurance

www.antonydavies.org
The Players and the Goals
In this experiment, there are CONSUMERS and INSURERS.
INSURERS sell INSURANCE.
CONSUMERS buy FOOD and INSURANCE.
3

www.antonydavies.org
Consumers
Each consumer gets $25 per day.
A unit of food costs $1.
4
$25
The more food the consumer eats, the happier the consumer becomes.

www.antonydavies.org
Consumers: The Catch
Each day, consumers face some risk of badness.
5
vs.
If badness befalls the consumer, the consumer loses all of the purchased food for that day.

www.antonydavies.org
Consumers: The Insurance
But, consumers can purchase insurance contracts from the insurance companies.
6
Each contract pays the consumer $1 worth of food if badness befalls the consumer that day.

www.antonydavies.org
Consumers: Example
Suppose you can purchase insurance contracts at a price of $0.50 each (the price of food is always $1 each).
7
$20
You spend $5 on insurance contracts. The remaining $20 is automatically spent on food.
10 insurance contracts
20 food
(Consumers may buy fractions of a unit of food.)
$20$5

www.antonydavies.org
Consumers: Example
If badness does not befall you, then you eat 20 units of food and are very happy.
8
Very Happy !
!

www.antonydavies.org
Consumers: Example
If badness does befall you, the 20 units of food disappear, and each insurance contract pays $1. You automatically buy food, eat it, and are somewhat happy.
9
Somewhat Happy

www.antonydavies.org
Decision
Consumers: Example
The consumer makes one set of decisions that are repeated for each of the three days. Daily outcomes may change due to randomness.
Day 1
10 insurance contracts 15 food
Day 2
10 insurance contracts 15 food
Day 3
10 insurance contracts 15 food
10

www.antonydavies.org
Consumers
Each consumer’s goal: Maximize happiness
More insurance means
More food when badness befalls.
Less food when badness does not befall.
Too little insurance is bad. Too much insurance is also bad.
11

www.antonydavies.org
Insurers
Each insurer can write as many insurance contracts as liked and charge any price.
12

www.antonydavies.org
Insurers
If badness does not befall the consumer, the insurer walks away with the money the consumer paid for the contracts.
13
$ $ $
$ $ $

www.antonydavies.org
Insurers
If badness does befall the consumer, the insurer pays the consumer $1 for each contract the insurer sold the consumer.
14

www.antonydavies.org
Insurers: Example
You sell Consumer A six contracts for $0.60 each, and sell Consumer B five contracts for $0.30 each.
15
For each of the three days, you collect $3.60 from Consumer A and $1.50 from Consumer B.
$15.30
Revenue =
$3.60 $3.60$3.60
$1.50 $1.50$1.50
$3.60
$1.50

www.antonydavies.org
Insurers: Example
Suppose that badness then befalls Consumer B on two of the days, but Consumer A on none of the days.
16
You owe Consumer B $1 for each contract for the two days.
$15.30
Revenue =
$10.00
Cost =
$5.30Profit =
$5.00 $5.00

www.antonydavies.org
Insurers: Example
Alternatively, suppose that badness befalls Consumer A on all three days, but Consumer B on none of the days.
17
You owe Consumer A $1 for each contract for the three days.
$15.30
Revenue =
$18.00
Cost =
$2.70Loss =
(Insurers do not need cash reserves to cover policies.)
$6.00 $6.00$6.00

www.antonydavies.org
Insurers
Each insurer’s goal: Maximize expected profit
Insurers can ask whatever prices they like for contracts
Too low a price is bad. Too high a price is also bad.
18
www.antonydavies.org 19
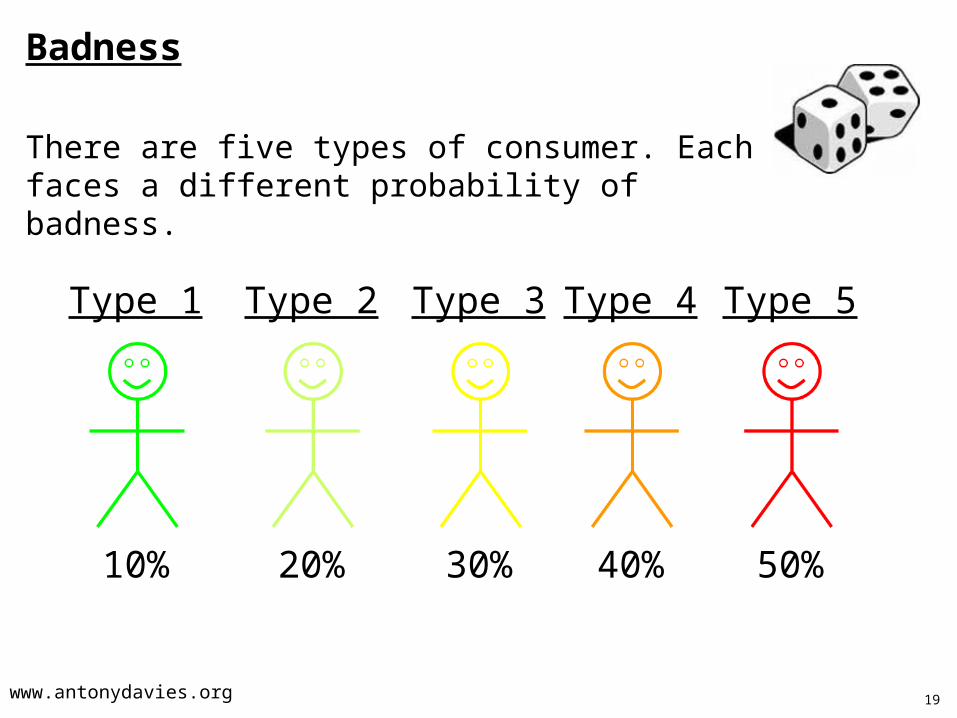
Type 1
10%
Badness
There are five types of consumer. Each faces a different probability of badness.
Type 2
20%
Type 3
30%
Type 4
40%
Type 5
50%

www.antonydavies.org
The Objects
20
= insurance contract(s)
Contracts Sold BuyerSuspected Risk
(0.1 to 0.5 )Total Revenue
Expected Cost (contracts x risk )
Expected Profit (revenue - cost )
= sales register

www.antonydavies.org
Contracts
21
12 6
$4.80
Customer 6 purchases 12 contracts from insurer 4 for $0.40 each.
This contract generates $4.80 daily income for three days for the insurer.

www.antonydavies.org
Contracts Sold Buyer Risk (0.1 to 0.5 )Total Revenue
per DayCost per Day
(contracts x risk )Expected Profit
per Day
Register
22
12
6 0.3
The register is for your own use in tracking your customers.• Be aware of customers who buy a lot of insurance.
• At the end of the round, watch to see which of your customers has badness befall them.
These are possible signs that the customer is high risk.
You will need to estimate consumers’ risks.

www.antonydavies.org
The Mechanics
23
Agent
Insurers Consumers
Head Office $0.50
Prices are per contract.You may buy multiple contracts.

www.antonydavies.org
The Mechanics
24
Agent
Insurers Consumers
Head Office

www.antonydavies.org
The Mechanics
25
Agent
Insurers Consumers
Head Office
Consumers:Keep track of how much you have spent. You need to save cash to buy food and you only have $20.
Head Office:Keep track of risk estimates and expected profits. Advise the agent on setting prices.
Agent:Try to estimate consumers’ risks based on how many contracts they want and the prices they are willing to pay.
www.antonydavies.org
Risk Types
26

www.antonydavies.org 27
Risk Type Prob. Of Badness Risk Type Prob. Of BadnessConsumer #1 5 50% Consumer #18 3 30%Consumer #2 1 10% Consumer #19 2 20%Consumer #3 3 30% Consumer #20 4 40%Consumer #4 2 20% Consumer #21 5 50%Consumer #5 4 40% Consumer #22 1 10%Consumer #6 5 50% Consumer #23 3 30%Consumer #7 1 10% Consumer #24 2 20%Consumer #8 3 30% Consumer #25 4 40%Consumer #9 2 20% Consumer #26 5 50%Consumer #10 4 40% Consumer #27 1 10%Consumer #11 5 50% Consumer #28 3 30%Consumer #12 1 10% Consumer #29 2 20%Consumer #13 3 30% Consumer #30 4 40%Consumer #14 2 20% Consumer #31 5 50%Consumer #15 4 40% Consumer #32 1 10%Consumer #16 5 50% Consumer #33 3 30%Consumer #17 1 10% Consumer #34 2 20%
Consumer #35 4 40%

www.antonydavies.org 28
Risk Type Prob. Of BadnessConsumer #1 5 50%Consumer #2 1 10%Consumer #3 3 30%Consumer #4 2 20%Consumer #5 4 40%Consumer #6 5 50%Consumer #7 1 10%Consumer #8 3 30%Consumer #9 2 20%Consumer #10 4 40%Consumer #11 5 50%Consumer #12 1 10%Consumer #13 3 30%Consumer #14 2 20%Consumer #15 4 40%Consumer #16 5 50%Consumer #17 1 10%

www.antonydavies.org 29
Risk Type Prob. Of BadnessConsumer #18 3 30%Consumer #19 2 20%Consumer #20 4 40%Consumer #21 5 50%Consumer #22 1 10%Consumer #23 3 30%Consumer #24 2 20%Consumer #25 4 40%Consumer #26 5 50%Consumer #27 1 10%Consumer #28 3 30%Consumer #29 2 20%Consumer #30 4 40%Consumer #31 5 50%Consumer #32 1 10%Consumer #33 3 30%Consumer #34 2 20%Consumer #35 4 40%

www.antonydavies.org
Ready to begin…
30

www.antonydavies.org 31
Consumers: You have $25.
Buy some insurance (if you want).
All remaining money goes to food.
Insurers: Sell insurance to maximize expected profit.

www.antonydavies.org
Accounting Phase
Consumers report:
• Contracts purchased, cost, and from which insurer(s)
32

www.antonydavies.org 33
Food Contracts1 18.6 19 YES YES YES 57.02 22.5 10 no no no 67.53 22.8 10 no YES no 55.64 24.5 5 no no no 73.55 22.5 10 no no no 67.56 20.8 15 no YES no 56.57 25.0 0 no no no 75.08 22.8 10 no YES YES 42.89 22.0 10 no no no 66.010 21.0 20 no no YES 62.011 18.0 20 YES YES no 58.012 24.4 3 no no no 73.213 18.7 18 no no no 56.114 20.5 15 no no YES 56.015 16.5 20 YES YES YES 60.016 22.9 10 YES YES YES 30.017 20.7 18 no YES no 59.418 22.6 8 YES YES no 38.619 21.9 13 no no YES 56.8
ConsumerDaily Purchases Badness
Day 1Badness
Day 2Badness
Day 3Total
Consumption

www.antonydavies.org
Food Contracts20 23.4 4 no no YES 50.821 22.5 10 YES no YES 42.522 22.8 20 no no no 68.423 21.7 12 YES no no 55.424 22.4 13 no no no 67.225 23.0 8 YES YES YES 24.026 23.1 9 no no no 69.227 24.0 10 no no no 72.028 24.4 5 no no YES 53.729 24.5 5 no no no 73.530 11.0 16 YES YES YES 48.031 19.4 22 YES YES no 63.432 23.7 7 no no no 71.133 21.7 10 no no no 65.134 23.8 2 no no no 71.435 23.4 7 no YES no 53.8
Maximum 75.0Median 58.0Minimum 30.0
ConsumerDaily Purchases Badness
Day 1Badness
Day 2Badness
Day 3Total
Consumption
34

www.antonydavies.org 35
TotalCosts
1 $21.45 $51.00 ($29.55)2 $13.80 $36.00 ($22.20)3 $8.10 $5.00 $3.104 $32.55 $35.00 ($2.45)5 $27.90 $10.00 $17.906 $28.50 $59.00 ($30.50)7 $27.75 $42.00 ($14.25)8 $28.50 $40.00 ($11.50)9 $16.50 $14.00 $2.5010 $58.35 $46.00 $12.3511 $23.40 $61.00 ($37.60)12 $12.00 $9.00 $3.0013 $20.10 $36.00 ($15.90)14 $16.05 $34.00 ($17.95)
InsurerTotal
PremiaTotal Profit

www.antonydavies.org
Mandated Insurance
People have lobbied the government to require insurance companies to provide at least 50 contracts’ worth of coverage.
Insurers now may not sell fewer than 50 contracts to a consumer.*
*(unless the consumer already owns at least 50 contracts)
36

www.antonydavies.org
Ready to begin…
37

www.antonydavies.org 38
Consumers: You have $25.
Buy some insurance (if you want).
All remaining money goes to food.
Insurers: Sell insurance to maximize expected profit.
You may not sell fewer than 50 contracts to a consumer unless that consumer already owns at least 50 contracts.

www.antonydavies.org 39
Accounting Phase
Consumers report:
• Contracts purchased, cost, and from which insurer(s)

www.antonydavies.org 40
Food Contracts1 9.5 50 YES no YES 109.52 25.0 0 no no no 75.03 12.5 50 no YES no 75.04 25.0 0 no no no 75.05 12.3 85 no YES no 109.56 6.8 70 no YES no 83.57 22.5 50 no no no 67.58 25.0 0 YES YES YES 0.09 8.0 60 no no no 24.010 11.5 50 no no no 34.511 12.0 50 YES YES YES 150.012 17.5 50 no no no 52.513 14.0 50 no no no 42.014 18.0 50 no no YES 86.015 12.5 50 YES no YES 112.516 11.0 55 YES YES YES 165.017 25.0 0 no no no 75.018 8.3 50 no no YES 66.719 10.5 54 no no no 31.5
Total Consumption
ConsumerDaily Purchases Badness
Day 1Badness
Day 2Badness
Day 3

www.antonydavies.org 41
Food Contracts20 25.0 0 no no YES 50.021 15.0 50 no YES no 80.022 20.0 50 no no no 60.023 9.3 50 no no no 27.824 17.5 50 no YES no 85.025 13.5 50 YES no no 77.026 11.5 50 no YES no 73.027 25.0 0 no no no 75.028 17.0 50 no no YES 84.029 17.5 50 no no no 52.530 10.0 50 no no no 30.031 15.0 50 no YES no 80.032 17.5 50 no no YES 85.033 15.0 50 YES no YES 115.034 20.0 50 YES no no 90.035 25.0 0 no no YES 50.0
Maximum 165.0Median 75.0Minimum 0.0
Badness Day 3
Total Consumption
ConsumerDaily Purchases Badness
Day 1Badness
Day 2

www.antonydavies.org 42
TotalCosts
1 $43.50 $100.00 ($56.50)2 $81.51 $120.00 ($38.49)3 $27.00 $85.00 ($58.00)4 $58.50 $130.00 ($71.50)5 $57.75 $60.00 ($2.25)6 $94.50 $120.00 ($25.50)7 $76.50 $170.00 ($93.50)8 $82.50 $100.00 ($17.50)9 $33.00 $60.00 ($27.00)10 $89.25 $110.00 ($20.75)11 $18.00 $20.00 ($2.00)12 $114.00 $140.00 ($26.00)13 $71.25 $80.00 ($8.75)14 $96.00 $25.00 $71.00
InsurerTotal
PremiaTotal Profit

www.antonydavies.org
Mandatory Insurance
Concerned that some consumers are uninsured, the government requires that all consumers buy at least 50 contracts.
43

www.antonydavies.org
Ready to begin…
44

www.antonydavies.org 45
Consumers: You have $25.
You must buy at least 50 contracts.
All remaining money goes to food.
Insurers: Sell insurance to maximize expected profit.

www.antonydavies.org 46
Accounting Phase
Consumers report:
• Contracts purchased, cost, and from which insurer(s)

www.antonydavies.org 47
Food Contracts1 7.3 55 YES no YES 117.32 22.5 50 no no no 67.53 13.8 50 no YES no 77.54 22.5 50 no no YES 95.05 9.5 80 YES YES no 169.56 3.0 95 no no YES 101.07 17.0 200 no no no 51.08 1.0 80 YES no no 82.09 19.5 50 no no YES 89.010 15.0 50 no no no 45.011 11.0 50 YES no no 72.012 15.0 50 no no no 45.013 15.4 50 no no YES 80.814 16.5 50 YES no no 83.015 11.3 50 no no YES 72.516 16.3 55 no no YES 87.517 15.0 50 no no no 45.018 7.0 50 no no YES 64.019 13.3 50 no no no 39.8
Total Consumption
ConsumerDaily Purchases Badness
Day 1Badness
Day 2Badness
Day 3

www.antonydavies.org 48
Food Contracts20 14.0 50 no no no 42.021 12.5 55 no YES no 80.022 19.0 50 YES YES no 119.023 12.5 50 no YES YES 112.524 16.0 65 no no no 48.025 12.5 50 YES YES YES 150.026 10.0 50 no YES no 70.027 14.5 50 no no no 43.528 15.0 50 YES no no 80.029 17.5 50 no no no 52.530 -1.5 100 YES YES YES 300.031 16.3 50 no YES YES 116.332 17.5 50 no no no 52.533 22.4 60 YES no YES 142.434 17.0 50 no no YES 84.035 15.0 50 no no YES 80.0
Maximum 169.5Median 77.5Minimum 39.8
Badness Day 3
Total Consumption
ConsumerDaily Purchases Badness
Day 1Badness
Day 2

www.antonydavies.org 49
TotalCosts
1 $36.00 $110.00 ($74.00)2 $97.50 $105.00 ($7.50)3 $27.45 $62.00 ($34.55)4 $99.00 $250.00 ($151.00)5 $66.75 $125.00 ($58.25)6 $64.50 $105.00 ($40.50)7 $138.00 $210.00 ($72.00)8 $112.50 $100.00 $12.509 $42.00 $115.00 ($73.00)10 $135.00 $95.00 $40.0011 $46.35 $78.00 ($31.65)12 $135.00 $195.00 ($60.00)13 $62.55 $250.00 ($187.45)14 $117.00 $225.00 ($108.00)
InsurerTotal
PremiaTotal Profit

www.antonydavies.org
Results…
50

www.antonydavies.org
Compared to the free market, what do you believe happens to the price of insurance under…
1.Mandated insurance
2.Mandatory insurance
51

www.antonydavies.org
$0.00
$0.05
$0.10
$0.15
$0.20
$0.25
$0.30
Free Market Mandated Mandatory
Insurance Price per Contract
52

www.antonydavies.org 53
Compared to the free market, what do you believe happens to the number of uninsured people under…
1.Mandated insurance
2.Mandatory insurance

www.antonydavies.org 54
0%
5%
10%
15%
20%
25%
Free Market Mandated Mandatory
Uninsured

www.antonydavies.org
Consider
The price per contract isn’t the consumer’s health care cost.
The consumer’s health care cost is the total amount of money the consumer pays for insurance.
55

www.antonydavies.org
Compared to the free market, what do you believe happens to the total cost of insurance per insured person under…
1.Mandated insurance
2.Mandatory insurance
56

www.antonydavies.org 57
$0
$2
$4
$6
$8
$10
$12
Free Market Mandated Mandatory
Insurance Cost per Insured Person

www.antonydavies.org
$0
$5
$10
$15
$20
$25
Free Market Mandated Mandatory
Insurance Cost per Insured Person
58

www.antonydavies.org 59
Compared to the free market, what do you believe happens to food purchases under…
1.Mandated insurance
2.Mandatory insurance

www.antonydavies.org 60
0
100
200
300
400
500
600
700
800
900
Free Market Mandated Mandatory
Units of Food Purchased
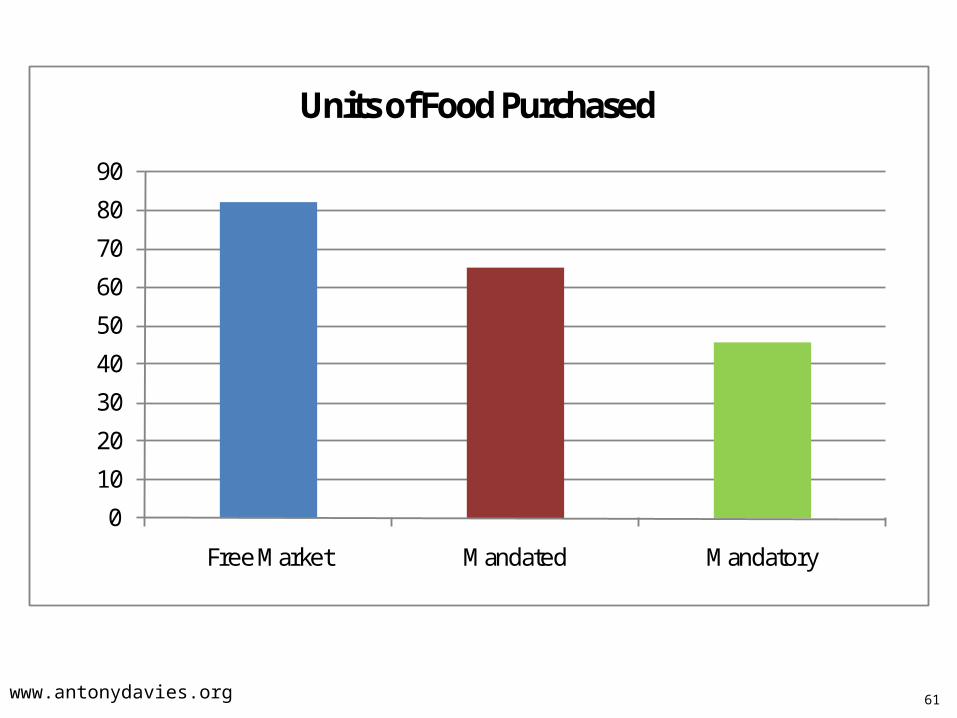
www.antonydavies.org 61
0
10
20
30
40
50
60
70
80
90
Free Market Mandated Mandatory
Units of Food Purchased

www.antonydavies.org 62
On whom do you believe the insurance companies make or lose money in each scenario?

www.antonydavies.org 63
-$350
-$300
-$250
-$200
-$150
-$100
-$50
$0
$50
$100
Type 1 Type 2 Type 3 Type 4 Type 5
Source of Insurance Profits
Free Market Mandated Mandatory

www.antonydavies.org 64
($800)
($600)
($400)
($200)
$0
$200
$400
$600
Type 1 Type 2 Type 3 Type 4 Type 5
Source of Insurance Profits (all firms per 3 days)
Free Market Mandated Mandatory

www.antonydavies.org
• Forces people to consume quantities of goods and insurance that they may not want to consume.
• Transfers wealth from low risk to high risk people.
A better solution is simply to tax the low risk people, give the money to the high risk people and let them buy what they want.
65
What is the effect of insurance mandates?
(but what if they don’t buy insurance?)

www.antonydavies.org
But, we have to do something!
Look at what has been happening to the cost of health care over time!
66

www.antonydavies.org
0.0
50.0
100.0
150.0
200.0
250.0
300.0
350.0
400.0
1980
1981
1982
1983
1984
1985
1986
1987
1988
19
8919
9019
9119
9219
9319
9419
9519
9619
9719
9819
9920
0020
0120
0220
0320
0420
0520
06
Price of Medical Care Consumer Prices Excluding Medical Care
67
Source: Bureau of Labor Statistics (www.economy.com)
Price of medical care has increased 350% since 1980 versus 135% for other consumer prices.
www.antonydavies.org
But, the cost of health care is only half of the picture.
What has been happening to the quality of health care?
68

www.antonydavies.org
How do we measure the quality of health care?
1. What is “quality?”
69
2. How do we account for care didn’t exist in the past?
3. How do we weigh qualities across different types of care?

www.antonydavies.org
How does one measure the quality of health care?
An easy and only-somewhat-sucky measure of the effectiveness of health care is the mortality rate.
70

www.antonydavies.org
0.0
5.0
10.0
15.0
20.0
25.0
30.0
1960
1970
1972
1974
1976
1978
1980
1982
1984
1986
1988
1990
1992
1994
1996
1998
2000
2002
2004
2006
Infant Mortality per 1,000 Live Births
71
Source: Statistical Abstract of the United States, 2008, Table 77.
From 1960 to 2006, infant mortality fell 70%.

www.antonydavies.org 72
Source: Statistical Abstract of the United States, 2008, Table 110.
0.0
10.0
20.0
30.0
40.0
50.0
60.0
1960
1962
1964
1966
1968
1970
1972
1974
1976
1978
1980
1982
1984
1986
1988
1990
1992
1994
1996
1998
2000
2002
2004
Deaths by Influence and Pneumonia (per 100,000 population)Deaths by Influenza and Pneumonia (per 100,000 population)
From 1960 to 2004, deaths due to influenza and pneumonia fell 60%.

www.antonydavies.org 73
7.5
8.0
8.5
9.0
9.5
10.0
1960
1970
1972
1974
1976
1978
1980
1982
1984
1986
1988
1990
1992
1994
1996
1998
2000
2002
2004
2006
Deaths per 1,000 People
Source: Statistical Abstract of the United States, 2008, Table 77.
From 1960 to 2006, the mortality rate fell by 15%.

www.antonydavies.org 74
What does the increased cost of health care buy us?

www.antonydavies.org
1.7
1.9
2.1
2.3
2.5
2.7
2.9
3.1
1967
1968
1969
1970
1971
1972
1973
1974
1975
1976
1977
1978
1979
1980
1981
1982
1983
1984
1985
1986
1987
1988
1989
1990
1991
1992
1993
1994
1995
1996
1997
1998
1999
2000
2001
2002
2003
2004
2005
2006
2007
2008
2009
2010
Mill
ions
Actual Deaths
75
Source: Derived from Statistical Abstract of the United States, and the Bureau of Economic Analysis.
If the quality of our health care had remained at the level it was in 1967, how many people would have died each year since 1967?

www.antonydavies.org
1.7
1.9
2.1
2.3
2.5
2.7
2.9
3.1
1967
1968
1969
1970
1971
1972
1973
1974
1975
1976
1977
1978
1979
1980
1981
1982
1983
1984
1985
1986
1987
1988
1989
1990
1991
1992
1993
1994
1995
1996
1997
1998
1999
2000
2001
2002
2003
2004
2005
2006
2007
2008
2009
2010
Mill
ions
Actual Deaths Deaths at 1967 Mortality Rate
76
Source: Derived from Statistical Abstract of the United States, and the Bureau of Economic Analysis.
600,000 lives saved just in 2010

www.antonydavies.org
What are the claimed problems?
77
• Many people are uninsured.
• Many people cannot afford insurance.
• Lack of competition makes insurance too expensive.

www.antonydavies.org 78
Many people are uninsured

www.antonydavies.org
0%
2%
4%
6%
8%
10%
12%
14%
16%
18%
1987
1988
1989
1990
1991
1992
1993
1994
1995
1996
1997
1998
1999
2000
2001
2002
2003
2004
2005
2006
2007
79
Source: Income, Poverty, and Health Insurance Coverage in the U.S.: 2006, US Census Bureau.
The percentage of the population that is uninsured has remained rather stable over time.

www.antonydavies.org 80
Source: Bureau of Labor Statistics, Census Bureau
Insured
Uninsured (15% of the population)
How many Americans are uninsured?

www.antonydavies.org
Insured
Claim to be Uninsured but
Aren't
Medicaid or SCHIP Eligible
Uninsured
81
Source: Bureau of Labor Statistics, Census Bureau
(12% of the population)
How many Americans are uninsured?

www.antonydavies.org
Insured
Claim to be Uninsured but
Aren't
Medicaid or SCHIP Eligible
Uninsured Less Than 4 Months
18 to 34 and Childless
Uninsured
82
Source: Bureau of Labor Statistics, Census Bureau
(4% of the population)
How many Americans are uninsured?
If we count one-third of this group, the uninsured are between 6% and 8% of the population depending on whether or not we count this group.
www.antonydavies.org 83
Many people cannot afford insurance
www.antonydavies.org
$0
$2,000
$4,000
$6,000
$8,000
$10,000
$12,000
$14,000
$16,000
New
Yor
kM
assa
chus
etts
Rhod
e Is
land
Mai
neCo
nnec
ticut
New
Ham
pshi
reM
onta
naN
evad
aVi
rgin
iaG
eorg
iaO
klah
oma
Texa
sSo
uth
Caro
lina
Flor
ida
Tenn
esse
eM
inne
sota
Ari
zona
Neb
rask
aCa
lifor
nia
Indi
ana
Penn
sylv
ania
Illin
ois
Colo
rado
Kent
ucky
Mis
sour
iO
hio
Kans
asN
orth
Car
olin
aIo
wa
Ann
ual P
rem
ium
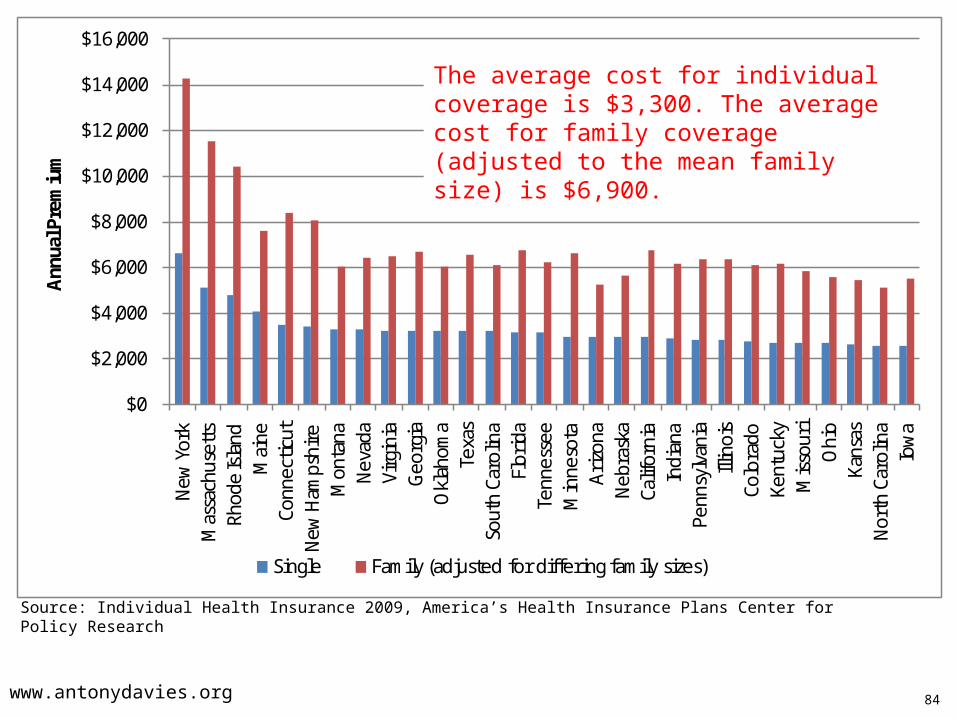
Single Family (adjusted for differing family sizes)
84
Source: Individual Health Insurance 2009, America’s Health Insurance Plans Center for Policy Research
The average cost for individual coverage is $3,300. The average cost for family coverage (adjusted to the mean family size) is $6,900.

www.antonydavies.org
$0
$2,000
$4,000
$6,000
$8,000
$10,000
$12,000
$14,000
$16,000
New
Yor
kM
assa
chus
etts
Rhod
e Is
land
Mai
neCo
nnec
ticut
New
Ham
pshi
reM
onta
naN
evad
aVi
rgin
iaG
eorg
iaO
klah
oma
Texa
sSo
uth
Caro
lina
Flor
ida
Tenn
esse
eM
inne
sota
Ari
zona
Neb
rask
aCa
lifor
nia
Indi
ana
Penn
sylv
ania
Illin
ois
Colo
rado
Kent
ucky
Mis
sour
iO
hio
Kans
asN
orth
Car
olin
aIo
wa
Ann
ual P
rem
ium
Single Family (adjusted for differing family sizes)
85
Source: Individual Health Insurance 2009, America’s Health Insurance Plans Center for Policy Research
Community Rating Cannot charge based on
health history
Guaranteed Issue May not deny coverage

www.antonydavies.org
$0
$2,000
$4,000
$6,000
$8,000
$10,000
$12,000
$14,000
$0 $1,000 $2,000 $3,000 $5,000 $10,000
Ann
ual P
rem
ium
(fam
ily p
olic
ies)
Deductible
86
Source: Individual Health Insurance 2009, America’s Health Insurance Plans Center for Policy Research
Annual premia are significantly higher for low deductible policies.

www.antonydavies.org
$0
$1,000
$2,000
$3,000
$4,000
$5,000
$6,000
$7,000
$8,000
$9,000
$10,000 A
nnua
l Cos
ts f
or A
vera
ge A
mer
ican
Fam
ily
87
Source: Consumer Expenditures, US Bureau of Labor Statistics, 2009.
Average annual expenditures (per household) compared to the cost of family health insurance.

www.antonydavies.org 88
Lack of competition makes insurance expensive.

www.antonydavies.org 89
The law makes it difficult for insurance companies to operate across state lines.
Individual insurance is subject to mandates that employer-provided insurance is not.
Employer-provided insurance benefits are tax-free, which causes an increase in demand for insurance and health services.

www.antonydavies.org 90
Can one place a value on a human life?(and, if yes, is it wrong to do so?)
Yes, it is possible.No, it is not wrong to do so.
Almost everyone does it almost every day.

www.antonydavies.org
Seat Belts on School Buses
It costs (on average) $2.5 million for every child’s life saved.
Should we install seatbelts on school buses?

www.antonydavies.org
Spend $2.5 million on: # Lives Saved Annually
Seatbelts on school buses 1
Airbags in cars 3
Heart transplants 13
Malaria prevention 975
If our concern is saving lives, then we should not spend money for seatbelts on school buses because every 1 life saved will be offset by 975 lives we might otherwise have saved.