Embed Size (px)
Citation preview
WWDC Platte River Basin
Plan,
Groundwater Study (Level I)
WSGS – USGS – WRDS
Karl Taboga, P.G.
Hydrogeologist
Wyoming State Geological Survey (WSGS)
Laramie, Wyoming
Groundwater Study Team
WWDO Project Manager – Jodi Pavlica
Deputy Director, River Basin Planning – Phil Ogle
WSGS –Jim Stafford, Tomas Gracias, Seth Wittke and
Karl Taboga
USGS – Tim Bartos, Melanie Clark, Laura Hallberg
WRDS – Chris Nicholson
Energy Compliance – Paul Taucher
Hinckley Consulting – Bern Hinkley
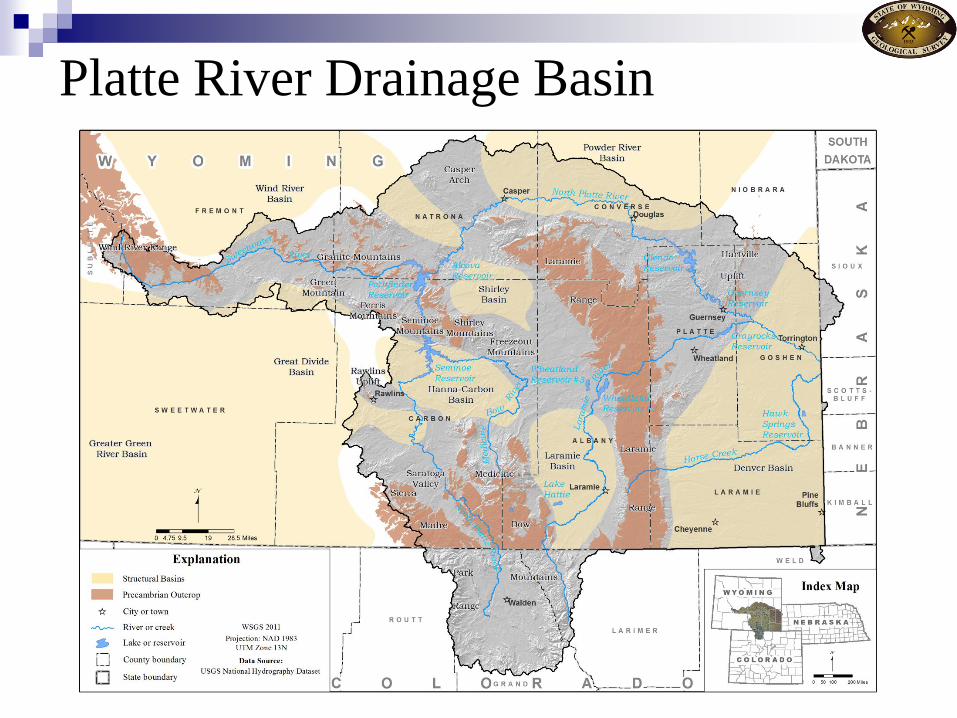
Platte River Drainage Basin
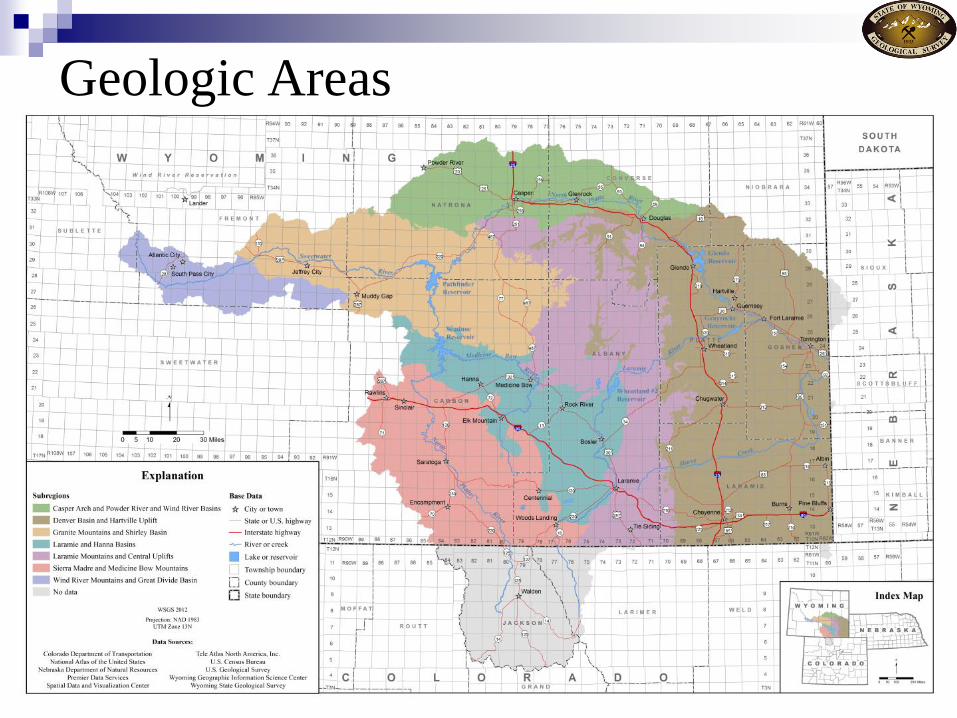
Geologic Areas
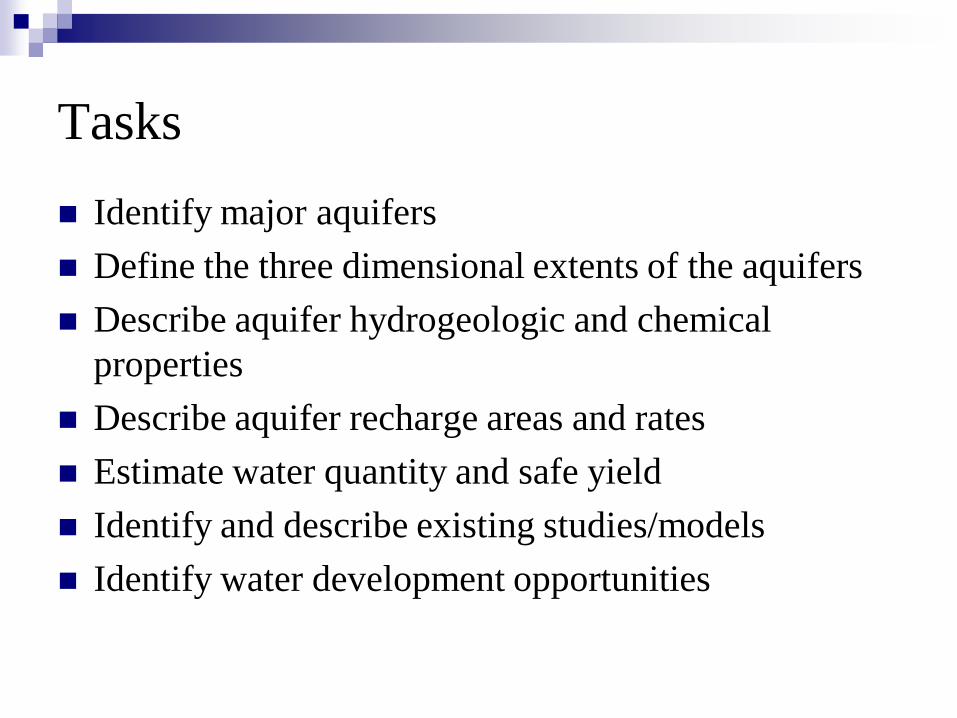
Tasks
Identify major aquifers
Define the three dimensional extents of the aquifers
Describe aquifer hydrogeologic and chemical
properties
Describe aquifer recharge areas and rates
Estimate water quantity and safe yield
Identify and describe existing studies/models
Identify water development opportunities
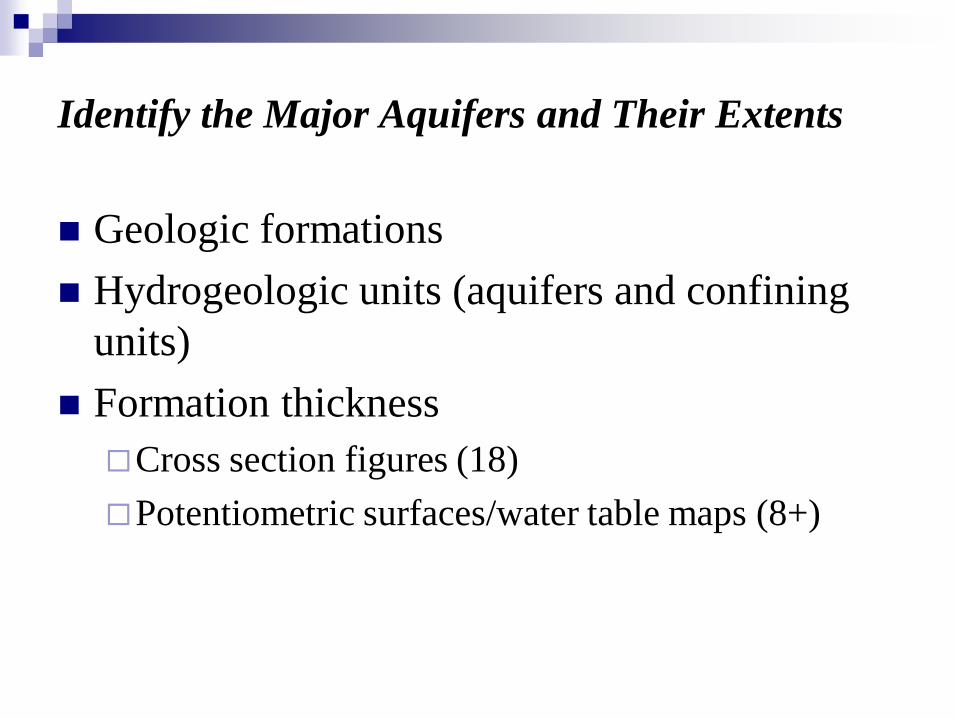
Identify the Major Aquifers and Their Extents
Geologic formations
Hydrogeologic units (aquifers and confining
units)
Formation thickness
Cross section figures (18)
Potentiometric surfaces/water table maps (8+)
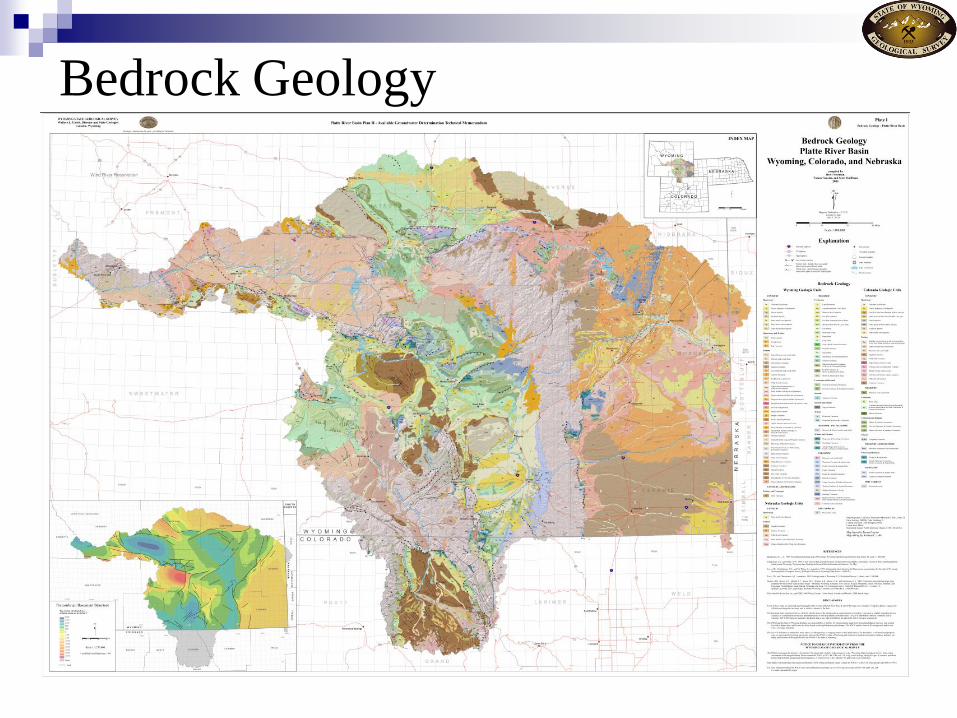
Bedrock Geology
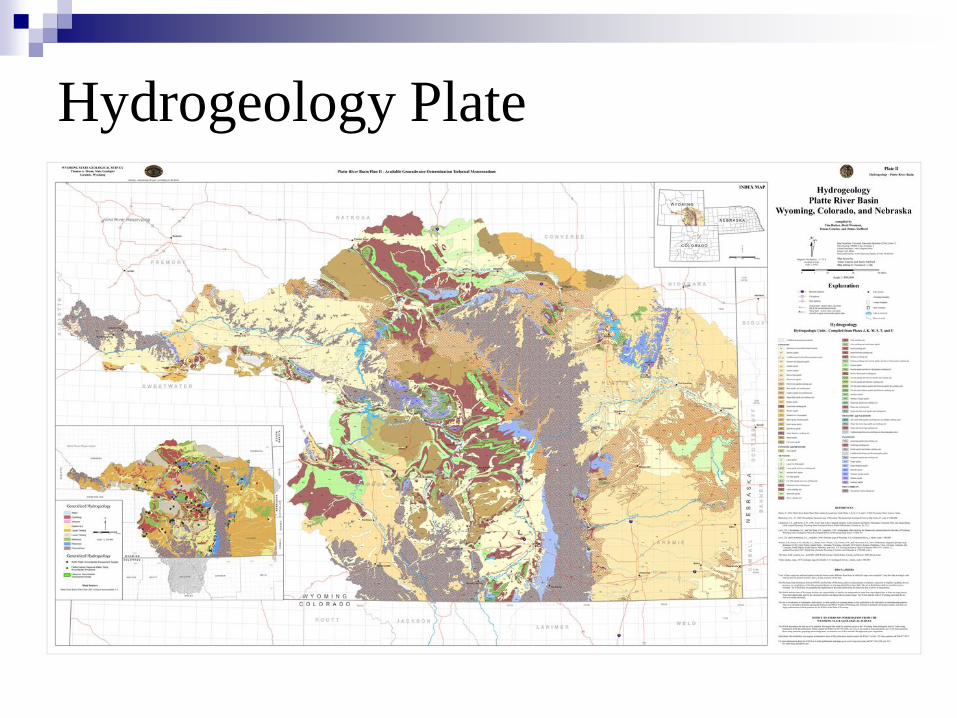
Hydrogeology Plate
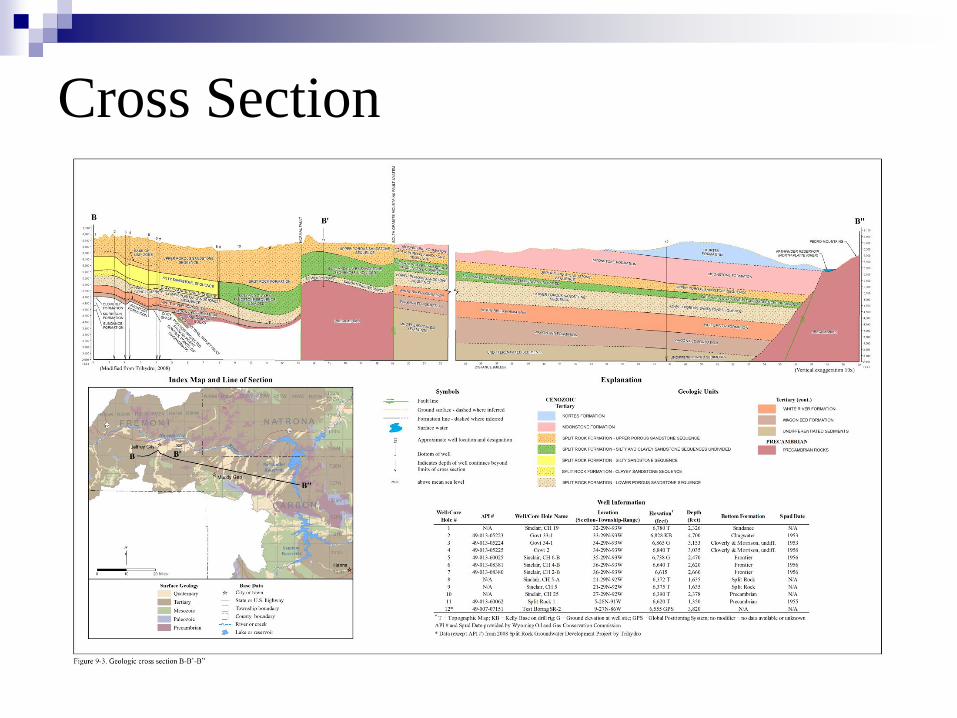
Cross Section
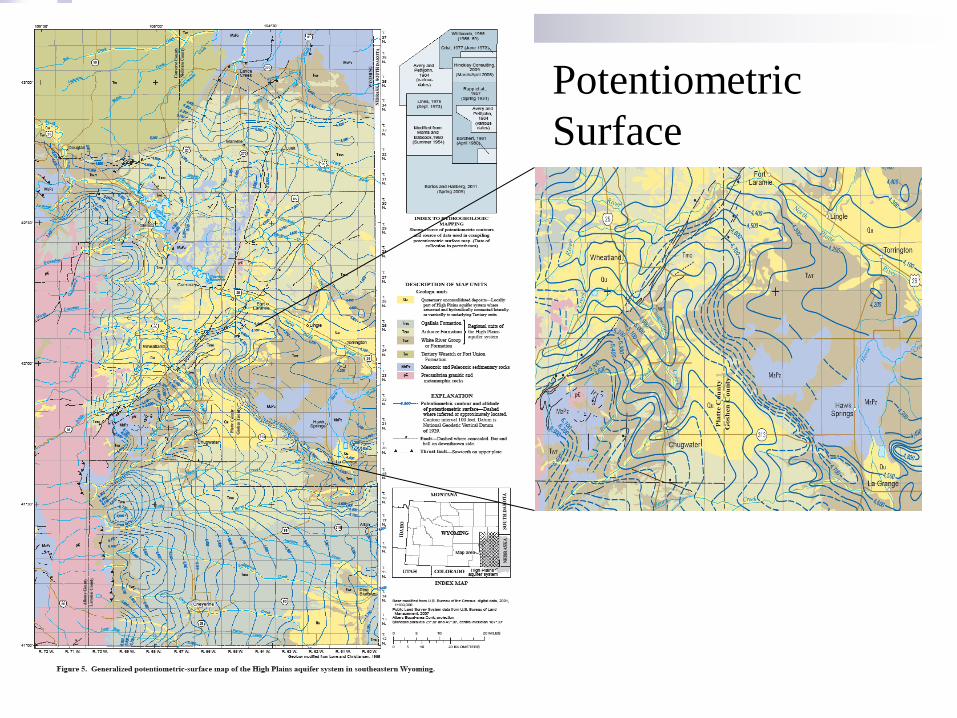
Potentiometric
Surface
Identify Aquifer Hydrogeologic Properties
USGS examined physical hydrogeologic properties in
Chapter 7
Statistical analysis of water quality from over 2100
water samples
Mapped and describe potential contaminant sites
identified from WDEQ and WOGCC data.
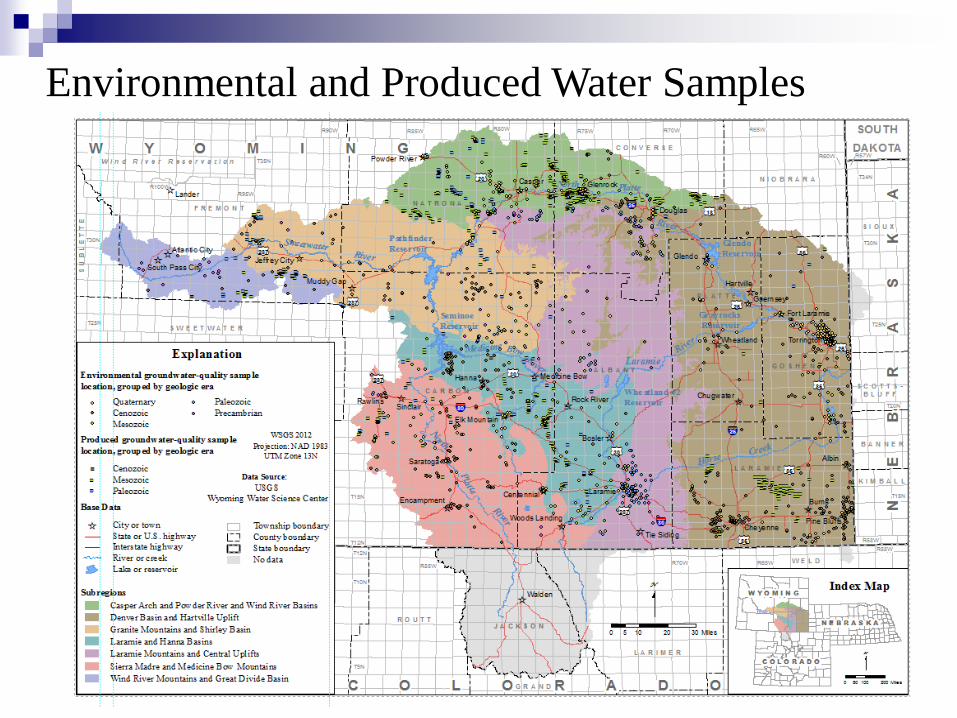
Environmental and Produced Water Samples
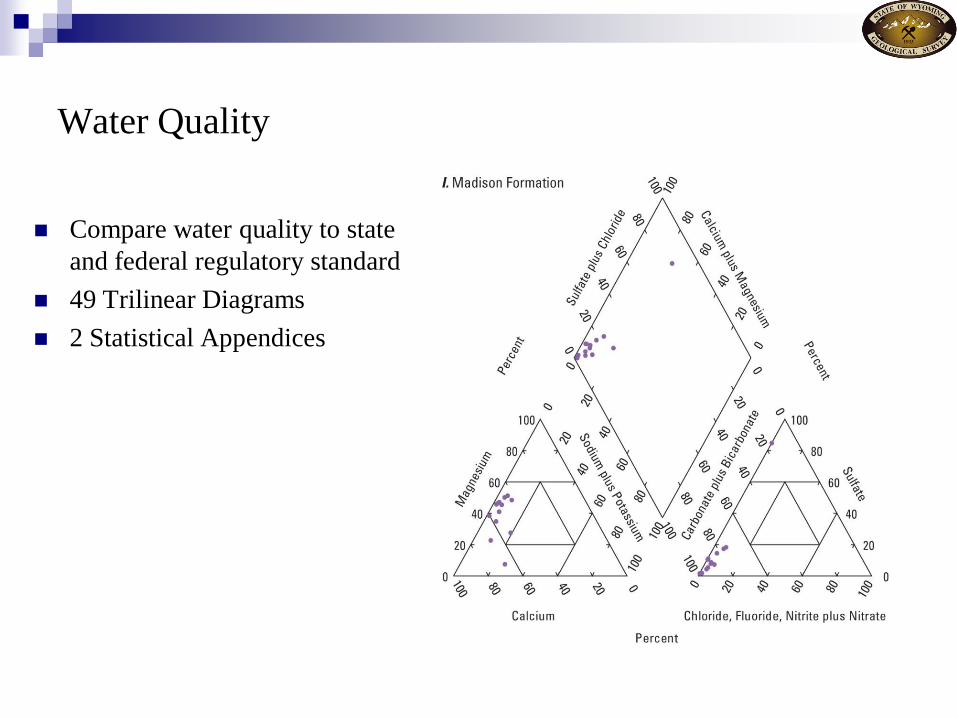
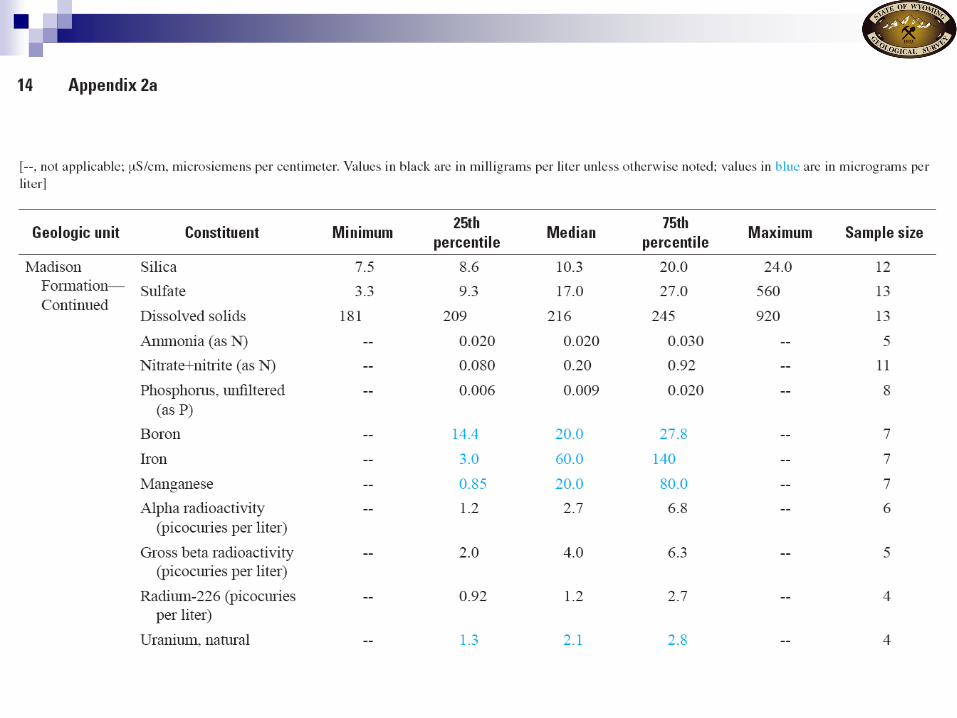
Water Quality
Compare water quality to state
and federal regulatory standards
49 Trilinear Diagrams
2 Statistical Appendices
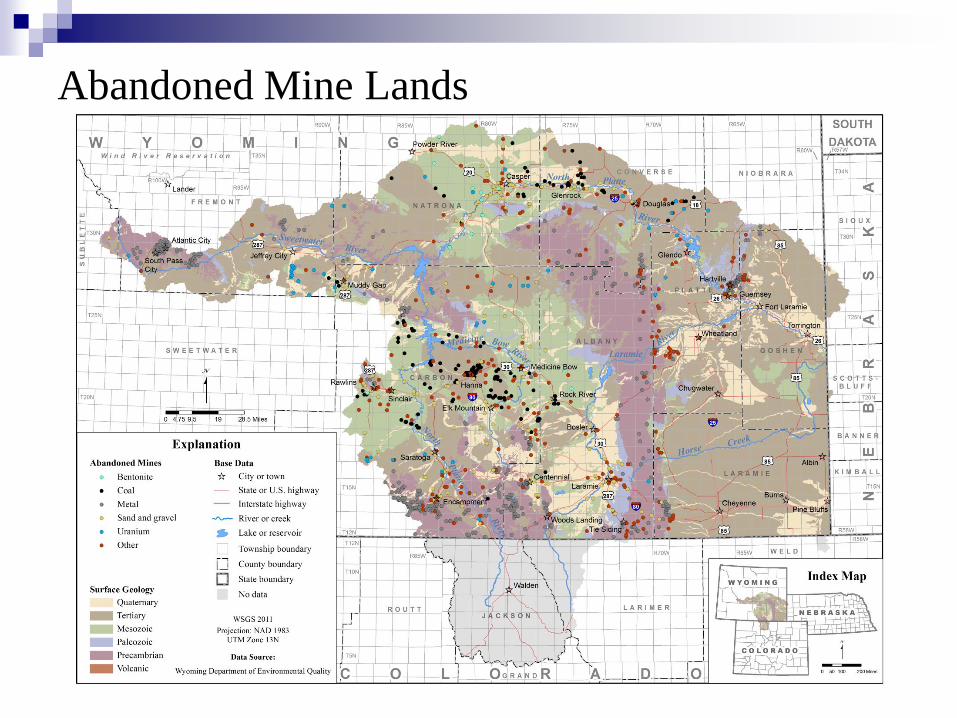
Abandoned Mine Lands
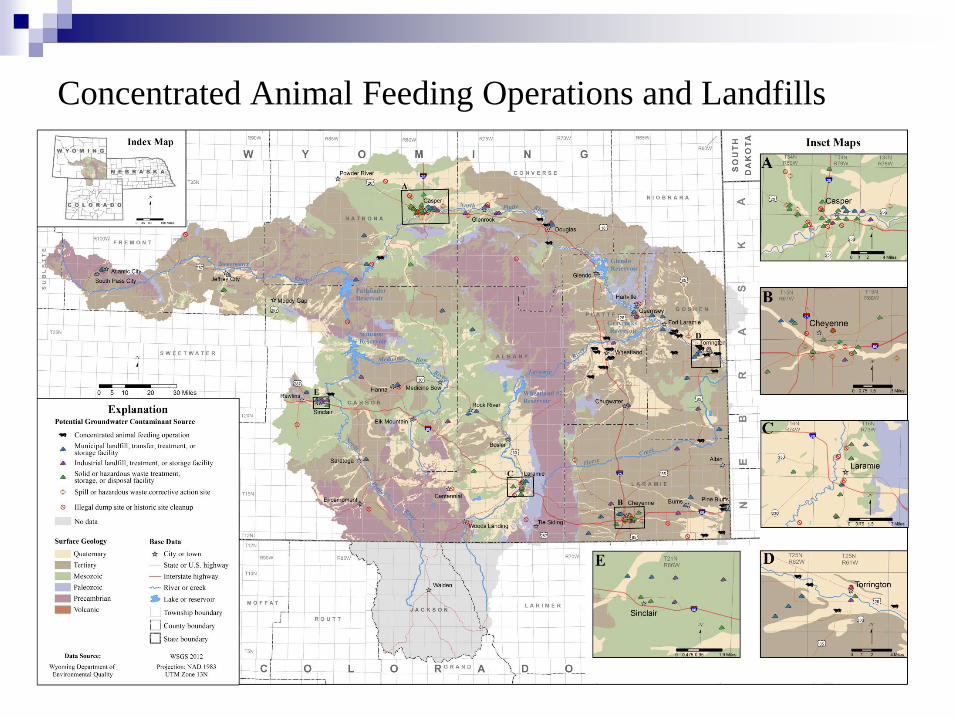
Concentrated Animal Feeding Operations and Landfills
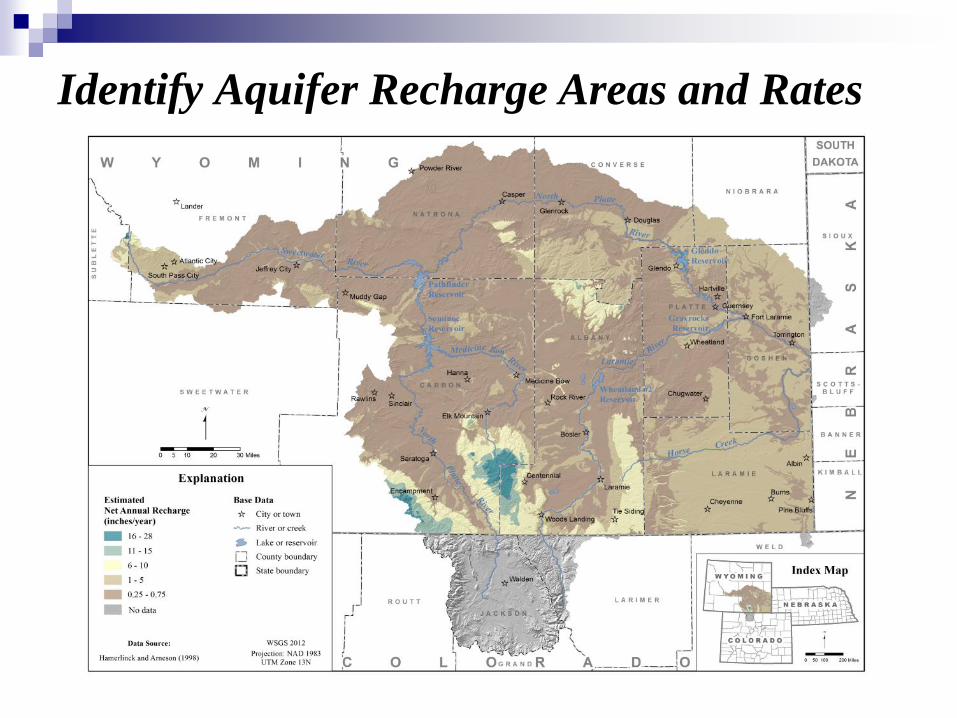
Identify Aquifer Recharge Areas and Rates
Estimate Water Quantity and Safe Yield
Provide a basin wide water balance (mass
balance model)
Maps of basin groundwater uses
Discussion of “safe” vs “sustainable” yield
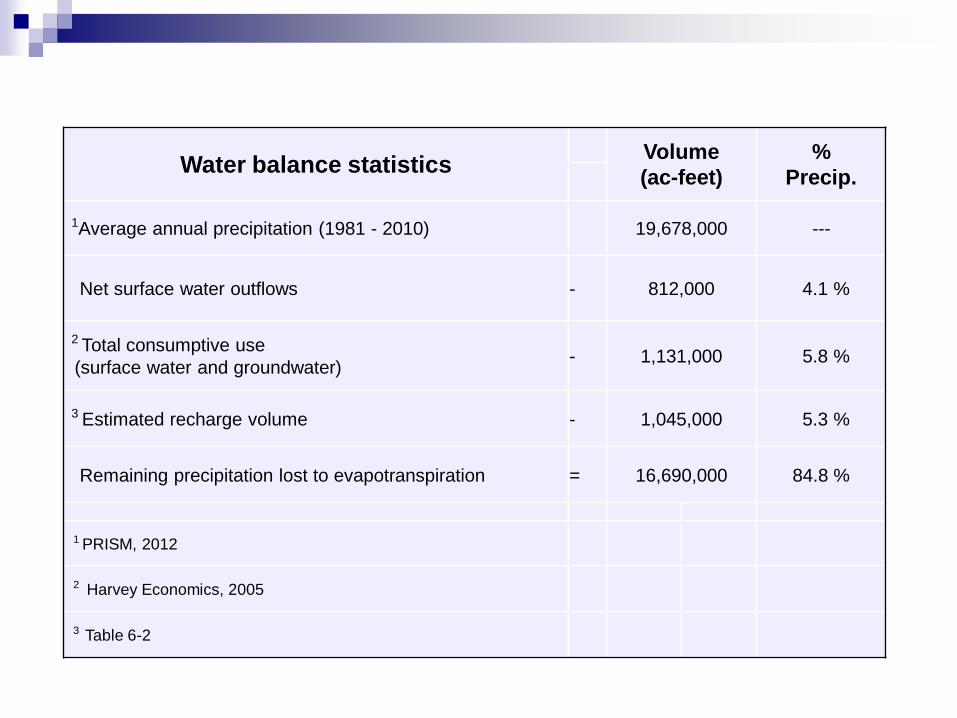
Water balance statistics Volume
(ac-feet)
%
Precip.
1Average annual precipitation (1981 - 2010) 19,678,000 ---
Net surface water outflows - 812,000 4.1 %
2 Total consumptive use
(surface water and groundwater) - 1,131,000 5.8 %
3 Estimated recharge volume - 1,045,000 5.3 %
Remaining precipitation lost to evapotranspiration = 16,690,000 84.8 %
1 PRISM, 2012
2 Harvey Economics, 2005
3 Table 6-2
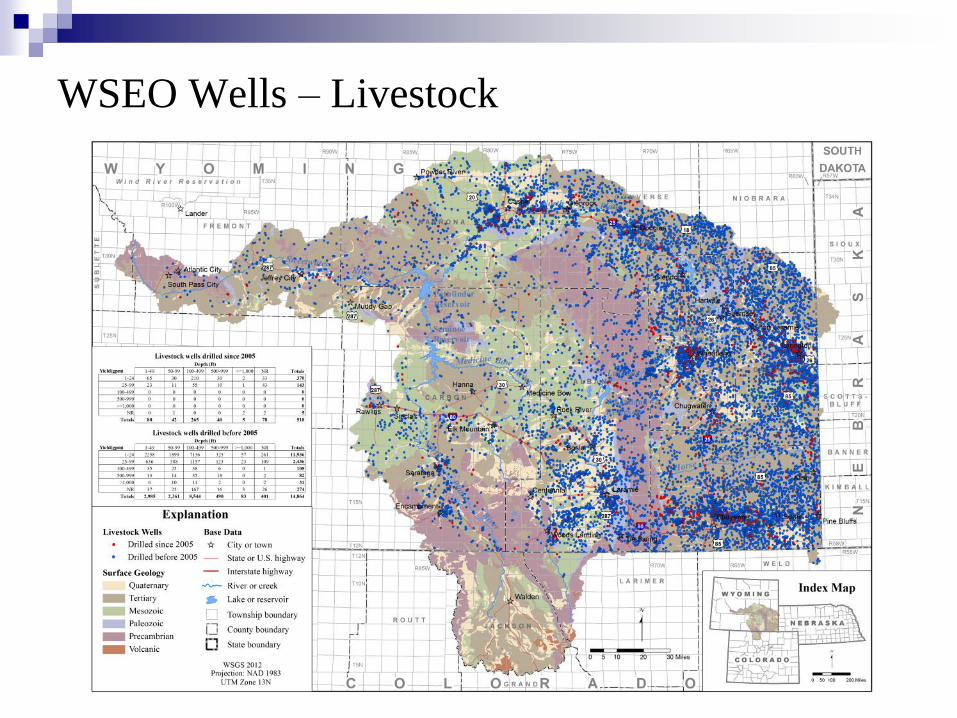
WSEO Wells – Livestock
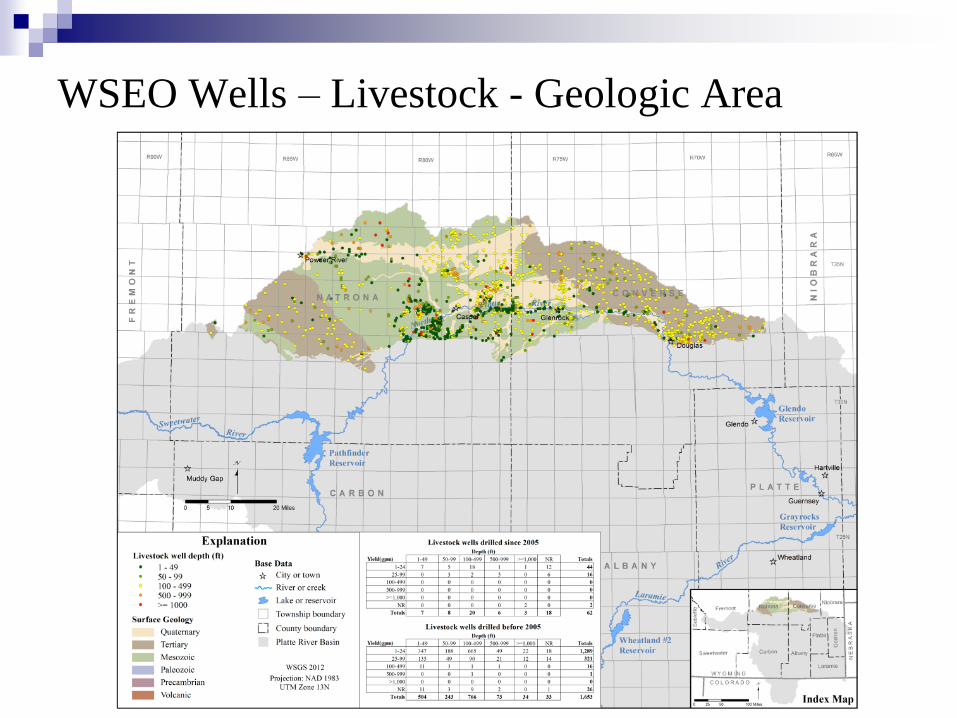
WSEO Wells – Livestock - Geologic Area
“Safe Yield” – An Evolving Concept
Lee (1915): “the limit to quantity of water that can be
withdrawn regularly and permanently without
dangerous depletion of the storage reserve.”
Meinzer (1923): “the rate at which ground water can be
withdrawn from an aquifer for human use without
depleting the supply to such an extent that withdrawal at
this rate is no longer economically feasible.”
Misconceptions Related to “Safe Yield”
Groundwater withdrawals from wells and
springs are “safe” as long as they do not
exceed the amount of annual recharge.
Safe yield (average annual recharge) can be
determined by developing a water balance.
Water in (Recharge) = Water out (Discharge) +
Change in aquifer storage (long term assumed to
be 0)
Or, simply
Recharge = Discharge
Pre-development: Natural discharges to springs
and streams reach dynamic equilibrium with
recharge volumes.
Under development: Groundwater volumes
extracted from wells and developed springs
result in reduced natural discharges to streams.
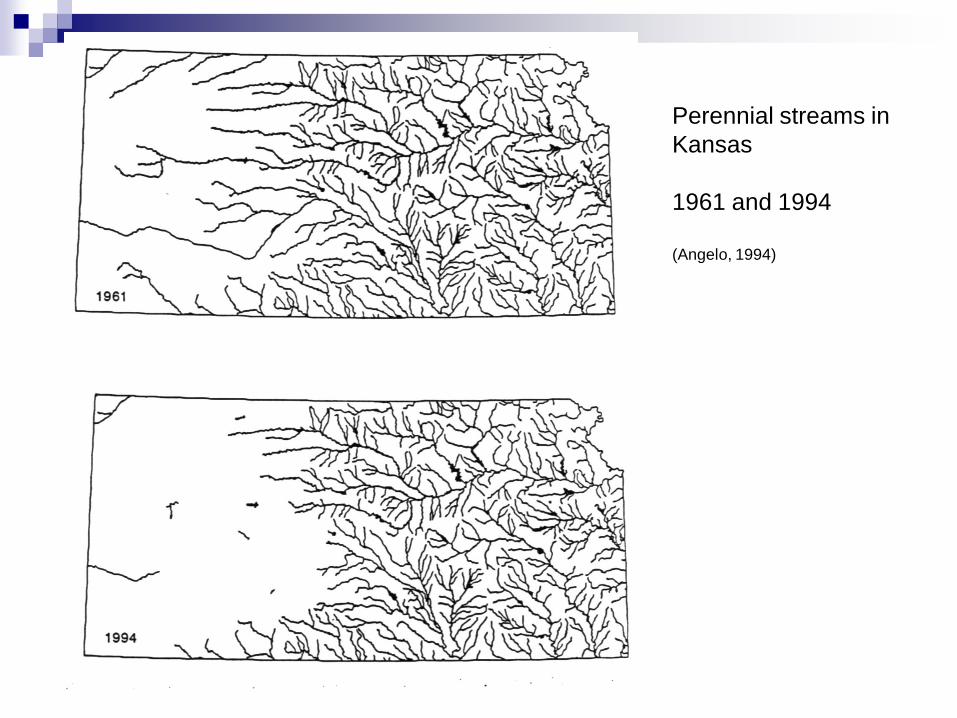
Perennial streams in
Kansas
1961 and 1994
(Angelo, 1994)
It’s unlikely that a basin scale value of safe yield
can be calculated accurately, because:
Heterogeneity – Any drainage basin is a
complex system of aquifers and confining
units that possess high levels hydrogeologic
heterogeneity.
Scale - A regional water balance analysis may
mask unacceptable groundwater depletions on
the local level.
Sustainable water systems
American Society of Civil Engineers - “… those
designed and managed to fully contribute to the
objectives of society, now and in the future, while
maintaining their ecological, environmental and
hydrological integrity.”
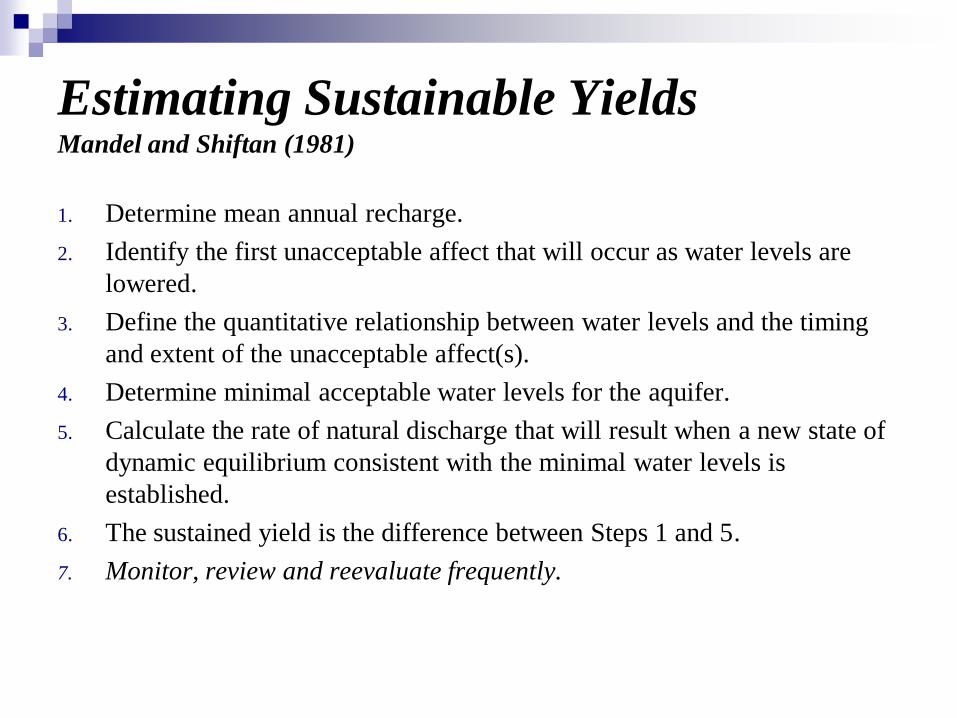
Estimating Sustainable Yields Mandel and Shiftan (1981)
1. Determine mean annual recharge.
2. Identify the first unacceptable affect that will occur as water levels are
lowered.
3. Define the quantitative relationship between water levels and the timing
and extent of the unacceptable affect(s).
4. Determine minimal acceptable water levels for the aquifer.
5. Calculate the rate of natural discharge that will result when a new state of
dynamic equilibrium consistent with the minimal water levels is
established.
6. The sustained yield is the difference between Steps 1 and 5.
7. Monitor, review and reevaluate frequently.
Identify Water Development Opportunities
Future water development opportunities in the Platte
River Basin are subject to the provisions of the 2001
Modified North Platte River Decree, the Laramie River
Decree and the Platte River Recovery Implementation
Program (PRRIP).
WSGS reviewed WWDC water development projects
(2005 and later) for 13 towns, cities and geographic
areas in the basin.
Identify Existing Studies
The USGS identified over 240 previous studies
in their hydrostratigraphy plates and in Chapter
7.
WSGS reviewed 107 WWDC studies in
Appendix B
Summary
The Platte River Basin groundwater report can
be accessed online:
WWDC website http://waterplan.state.wy.us/plan/platte/2013/finalrept/gw_toc.html
WSGS website http://www.wsgs.uwyo.edu/Research/Water-Resources/PtRB/Default.aspx
Or search “Platte River Basin Report”


![[Osxdev]wwdc 14행사와 dev tool](https://img.dokumen.tips/doc/110x75/554a059bb4c9055b7a8b5496/osxdevwwdc-14-dev-tool.jpg)