Embed Size (px)
Citation preview
Writing Proficiency
Updated: September 2012
Writing Proficiency
September 2012
2 | P a g e
Among eighth-graders in 2011, the average writing proficiency score for females
was 20 points higher than the average for males.
Importance
Writing is an essential skill for all students if they are to be successful in school and in the workplace. In
English classes, writing skills are often directly taught and assessed. In social science, humanities, and
science classes, writing well is essential for students to demonstrate knowledge and express ideas. Outside
of the classroom, writing well is necessary to express ideas, persuade, create, advocate as a citizen, and,
increasingly, it is a skill highly valued by prospective employers.1,2 Indeed, one estimate put the cost to
taxpayers at $250 million annually, to address through extra training and oversight the writing deficiencies
among state government workers.3
Recognizing the essential role of writing in personal, public, civic, working, and recreational areas of life, the
National Council of Teachers of English established October 20 as National Day on Writing, starting in 2009.
They cite five reasons:4
1. to highlight the fundamental place that writing has in American culture;
2. to emphasize the importance of teaching writing at every grade level and in every subject;
3. to underscore the life-long process of learning to write;
4. to bring attention to the range of writing done by Americans in subject matter as well as in media;
and
5. to encourage more writing.
Writing Proficiency
September 2012
3 | P a g e
Trends
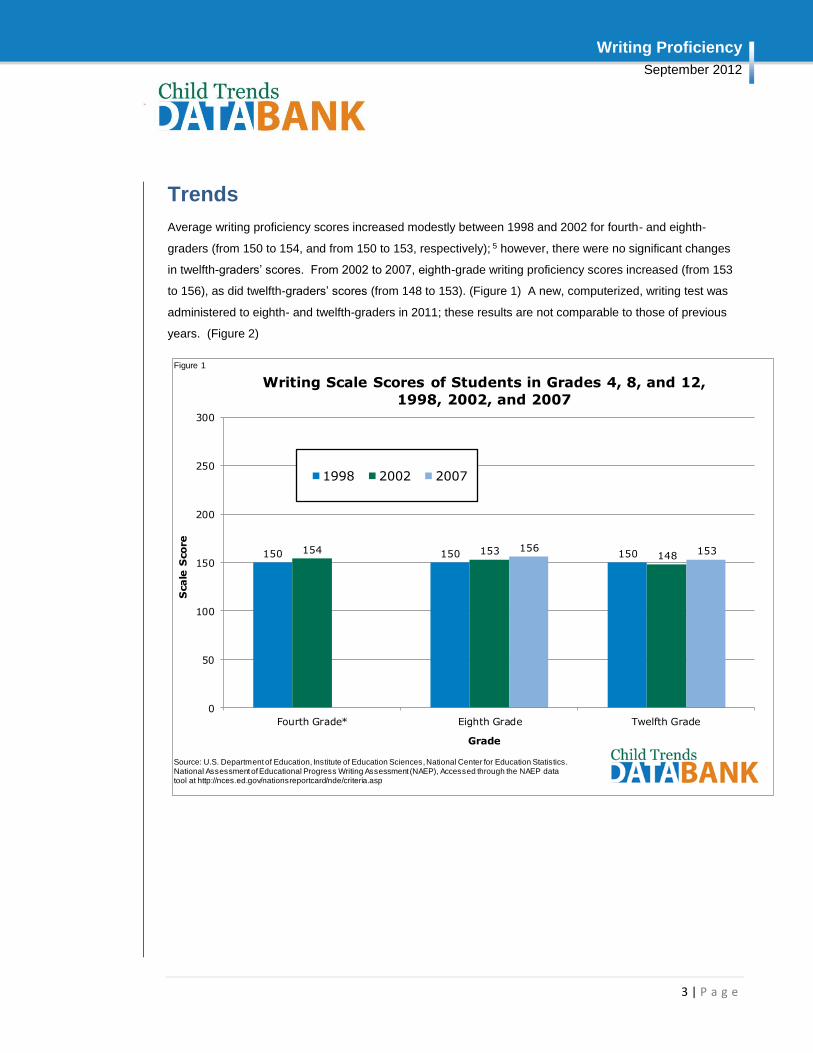
Average writing proficiency scores increased modestly between 1998 and 2002 for fourth- and eighth-
graders (from 150 to 154, and from 150 to 153, respectively); 5 however, there were no significant changes
in twelfth-graders’ scores. From 2002 to 2007, eighth-grade writing proficiency scores increased (from 153
to 156), as did twelfth-graders’ scores (from 148 to 153). (Figure 1) A new, computerized, writing test was
administered to eighth- and twelfth-graders in 2011; these results are not comparable to those of previous
years. (Figure 2)
150 150 150154 153148
156 153
0
50
100
150
200
250
300
Fourth Grade* Eighth Grade Twelfth Grade
Scale
Score
Grade
Writing Scale Scores of Students in Grades 4, 8, and 12,
1998, 2002, and 2007
1998 2002 2007
Source: U.S. Department of Education, Institute of Education Sciences, National Center for Education Statistics. National Assessment of Educational Progress Writing Assessment (NAEP), Accessed through the NAEP data tool at http://nces.ed.gov/nationsreportcard/nde/criteria.asp
Figure 1
Writing Proficiency
September 2012
4 | P a g e
Differences by Gender
Between 1998 and 2007, the gender gap for eighth-grade did not change, but for twelfth-graders, it
decreased between 2002 and 2007, after increasing between 1998 and 2002. (Appendix 1)
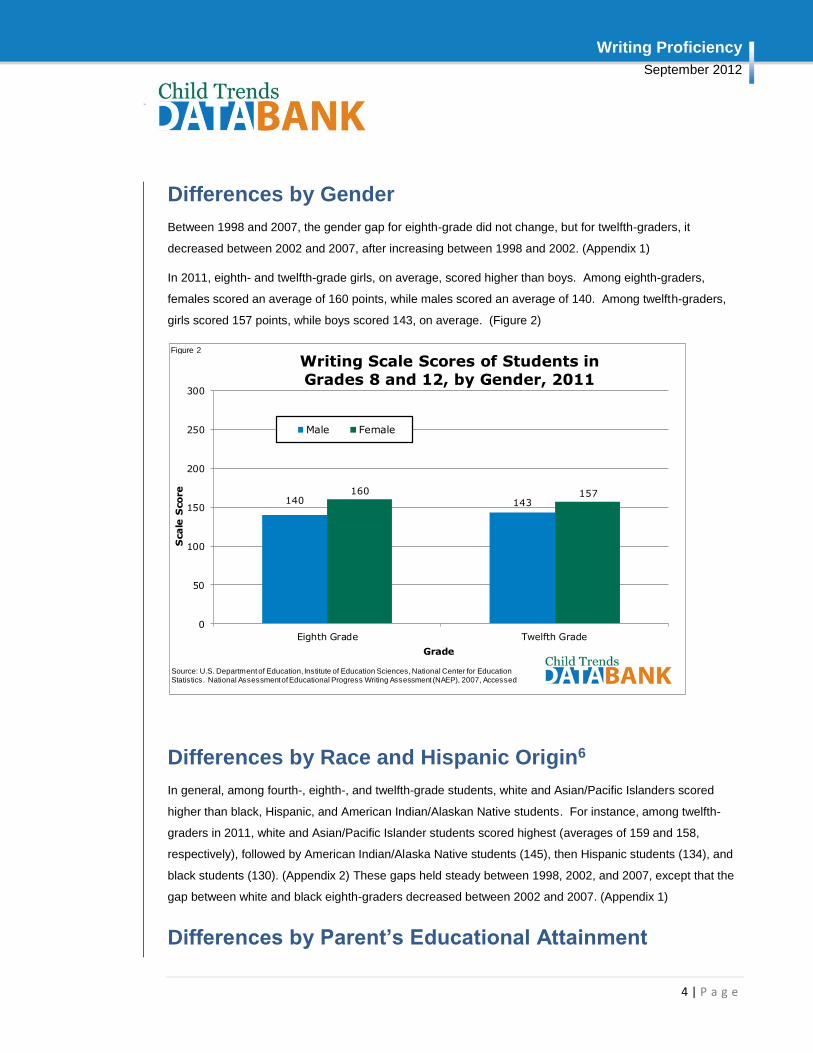
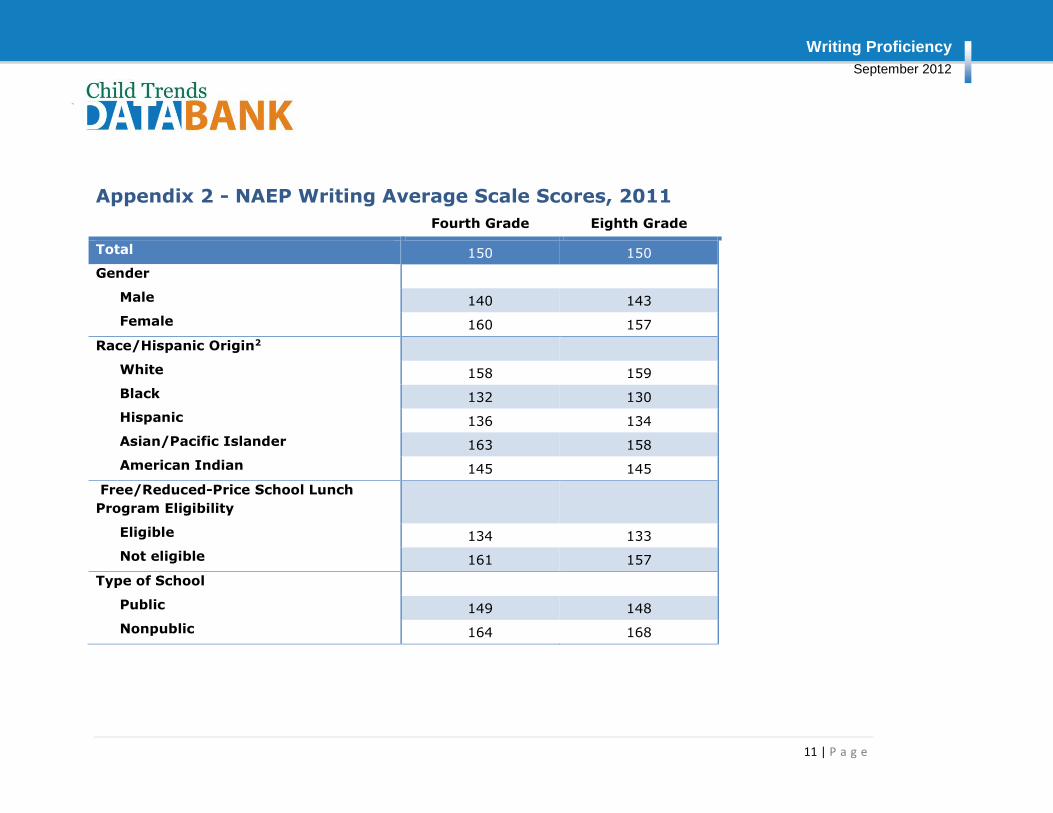
In 2011, eighth- and twelfth-grade girls, on average, scored higher than boys. Among eighth-graders,
females scored an average of 160 points, while males scored an average of 140. Among twelfth-graders,
girls scored 157 points, while boys scored 143, on average. (Figure 2)
Differences by Race and Hispanic Origin6
In general, among fourth-, eighth-, and twelfth-grade students, white and Asian/Pacific Islanders scored
higher than black, Hispanic, and American Indian/Alaskan Native students. For instance, among twelfth-
graders in 2011, white and Asian/Pacific Islander students scored highest (averages of 159 and 158,
respectively), followed by American Indian/Alaska Native students (145), then Hispanic students (134), and
black students (130). (Appendix 2) These gaps held steady between 1998, 2002, and 2007, except that the
gap between white and black eighth-graders decreased between 2002 and 2007. (Appendix 1)
Differences by Parent’s Educational Attainment
140 143
160 157
0
50
100
150
200
250
300
Eighth Grade Twelfth Grade
Scale
Score
Grade
Writing Scale Scores of Students in Grades 8 and 12, by Gender, 2011
Male Female
Source: U.S. Department of Education, Institute of Education Sciences, National Center for Education Statistics. National Assessment of Educational Progress Writing Assessment (NAEP), 2007, Accessed
Figure 2
Writing Proficiency
September 2012
5 | P a g e
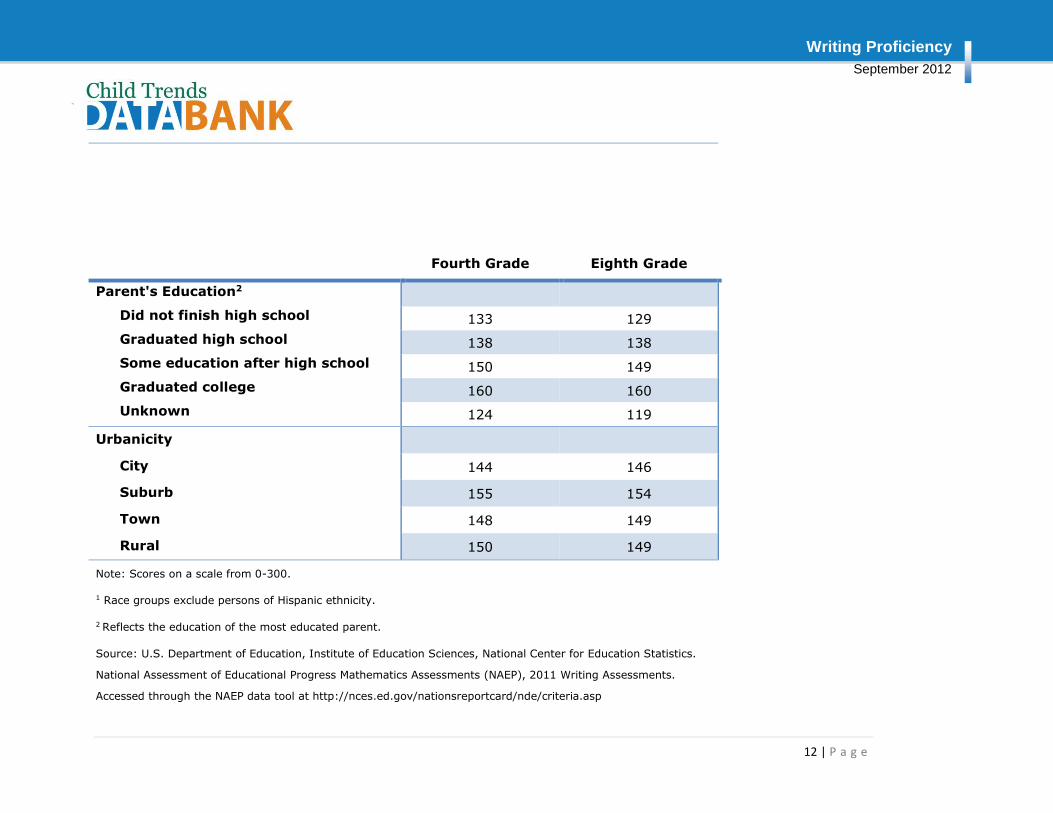
Overall, in 2002, 2007, and 2011, the more educated the parents of eighth- and twelfth-graders were, the
higher were students’ writing scores.7 For example, in 2011, eighth-grade students with college-educated
parents had an average score of 160, compared with 150 for students whose parents had only some
education after high school, 138 for students with parents who had a high school education only, and 133 for
students whose parents did not finish high school. (Appendix 2)
Differences by Free/Reduced-Price School Lunch Program Eligibility
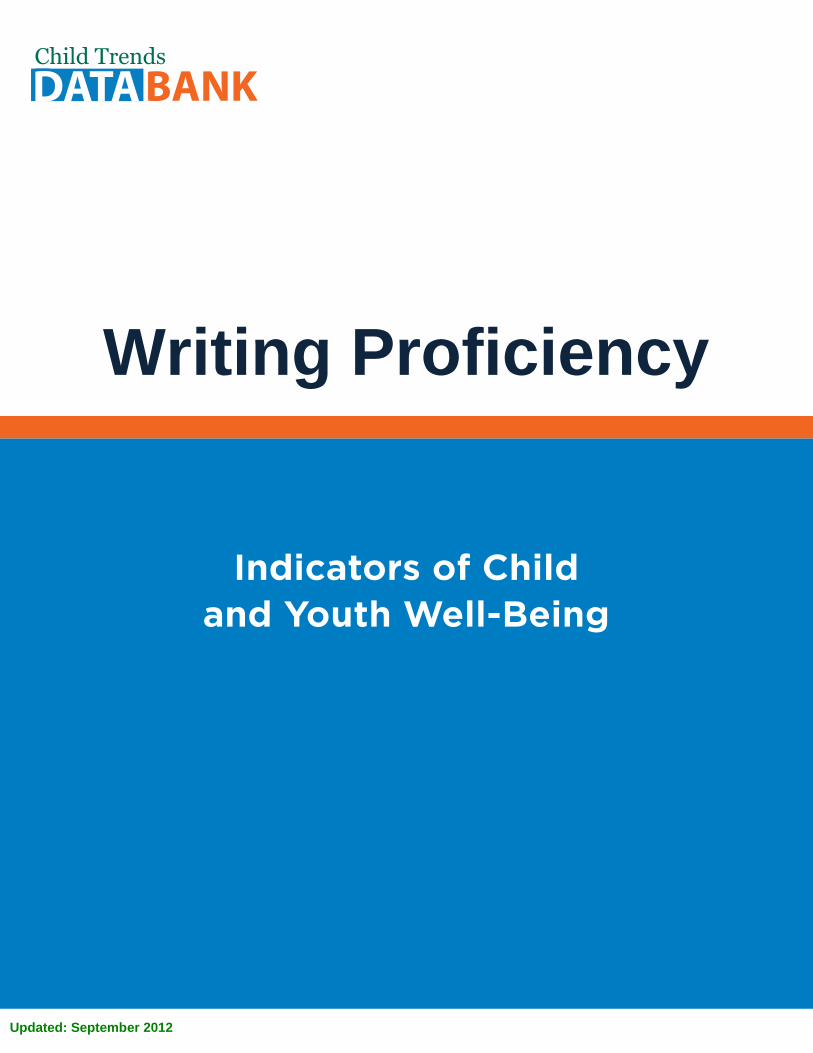
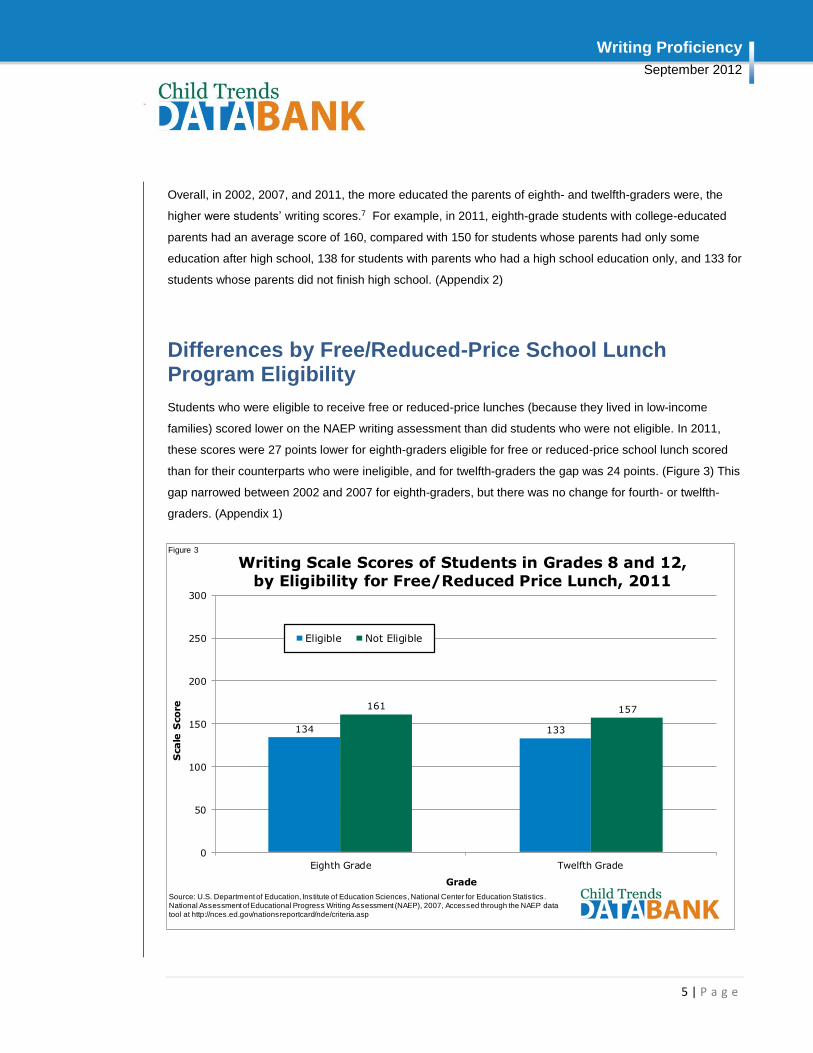
Students who were eligible to receive free or reduced-price lunches (because they lived in low-income
families) scored lower on the NAEP writing assessment than did students who were not eligible. In 2011,
these scores were 27 points lower for eighth-graders eligible for free or reduced-price school lunch scored
than for their counterparts who were ineligible, and for twelfth-graders the gap was 24 points. (Figure 3) This
gap narrowed between 2002 and 2007 for eighth-graders, but there was no change for fourth- or twelfth-
graders. (Appendix 1)
134 133
161 157
0
50
100
150
200
250
300
Eighth Grade Twelfth Grade
Scale
Score
Grade
Writing Scale Scores of Students in Grades 8 and 12, by Eligibility for Free/Reduced Price Lunch, 2011
Eligible Not Eligible
Source: U.S. Department of Education, Institute of Education Sciences, National Center for Education Statistics. National Assessment of Educational Progress Writing Assessment (NAEP), 2007, Accessed through the NAEP data tool at http://nces.ed.gov/nationsreportcard/nde/criteria.asp
Figure 3
Writing Proficiency
September 2012
6 | P a g e
State and Local Estimates
2007 state estimates for eighth- and twelfth-graders are available at
http://nationsreportcard.gov/writing_2007/
The following 2002 state estimates are available from
http://datacenter.kidscount.org/data#USA/2/8/10,11,12,13,14,15 (select Test Scores):
4th graders who scored below the basic writing level
4th graders who scored at or above the proficient writing level
8th graders who scored below the basic writing level
8th graders who scored at or above the proficient writing level.
1998 state estimates for fourth- and eighth-graders are available from the following sites:
Fourth Grade- http://nces.ed.gov/nationsreportcard/pubs/stt2002/20035324.asp
Eighth Grade- http://nces.ed.gov/nationsreportcard/pubs/stt2002/20035328.asp
International Estimates
None available.
National Goals
None.
Related Indicators
Reading Proficiency: www.childtrends.org/?indicators=reading-proficiency
Science Proficiency: www.childtrends.org/?indicators=science-proficiency
Mathematics Proficiency: www.childtrends.org/?indicators=mathematics-proficiency
Writing Proficiency
September 2012
7 | P a g e
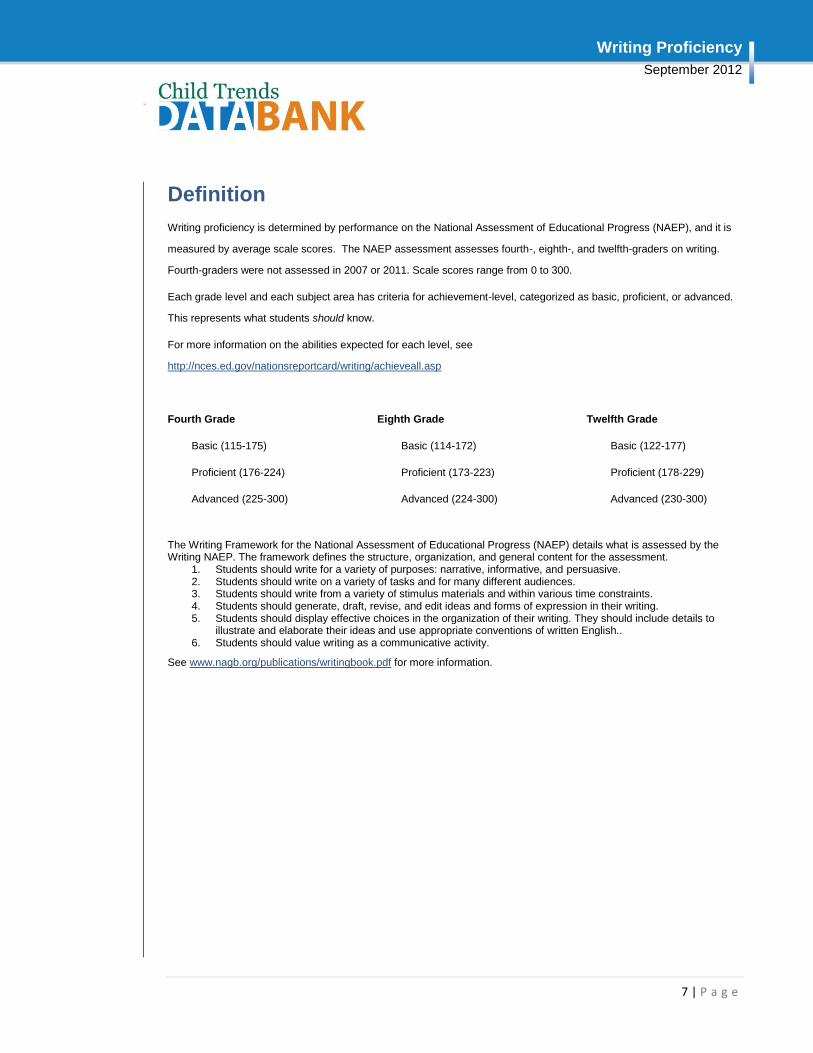
Definition
Writing proficiency is determined by performance on the National Assessment of Educational Progress (NAEP), and it is
measured by average scale scores. The NAEP assessment assesses fourth-, eighth-, and twelfth-graders on writing.
Fourth-graders were not assessed in 2007 or 2011. Scale scores range from 0 to 300.
Each grade level and each subject area has criteria for achievement-level, categorized as basic, proficient, or advanced.
This represents what students should know.
For more information on the abilities expected for each level, see
http://nces.ed.gov/nationsreportcard/writing/achieveall.asp
Fourth Grade
Basic (115-175)
Proficient (176-224)
Advanced (225-300)
Eighth Grade
Basic (114-172)
Proficient (173-223)
Advanced (224-300)
Twelfth Grade
Basic (122-177)
Proficient (178-229)
Advanced (230-300)
The Writing Framework for the National Assessment of Educational Progress (NAEP) details what is assessed by the Writing NAEP. The framework defines the structure, organization, and general content for the assessment.
1. Students should write for a variety of purposes: narrative, informative, and persuasive. 2. Students should write on a variety of tasks and for many different audiences. 3. Students should write from a variety of stimulus materials and within various time constraints. 4. Students should generate, draft, revise, and edit ideas and forms of expression in their writing. 5. Students should display effective choices in the organization of their writing. They should include details to
illustrate and elaborate their ideas and use appropriate conventions of written English.. 6. Students should value writing as a communicative activity.
See www.nagb.org/publications/writingbook.pdf for more information.
Writing Proficiency
September 2012
8 | P a g e
Data Sources
Data for 1998 and 2002: U.S. Department of Education, Office of Educational Research and
Improvement, National Center for Education Statistics. The Nation’s Report Card: Writing 2002,
NCES 2003-529, by H.R Persky, M.C. Daane, and Y. Jin. Washington, DC: 2003.
http://nces.ed.gov/nationsreportcard/pdf/main2002/2003529.pdf
Data for 2007: U.S. Department of Education, Office of Educational Research and Improvement,
National Center for Education Statistics. The Nation’s Report Card: Writing 2007, NCES 2008-468.
Washington, DC: 2008. http://nces.ed.gov/nationsreportcard/pdf/main2007/2008468.pdf
Data for 2011: U.S. Department of Education, Institute of Education Sciences, National Center for
Education Statistics. National Assessment of Educational Progress (NAEP), 2011 Writing
Assessments. Accessed through the NAEP data tool. Available at
http://nces.ed.gov/nationsreportcard/naepdata/dataset.aspx
Raw Data Source
National Assessment of Educational Progress, Writing Assessments
http://nces.ed.gov/nationsreportcard/writing/
Writing Proficiency
September 2012
9 | P a g e
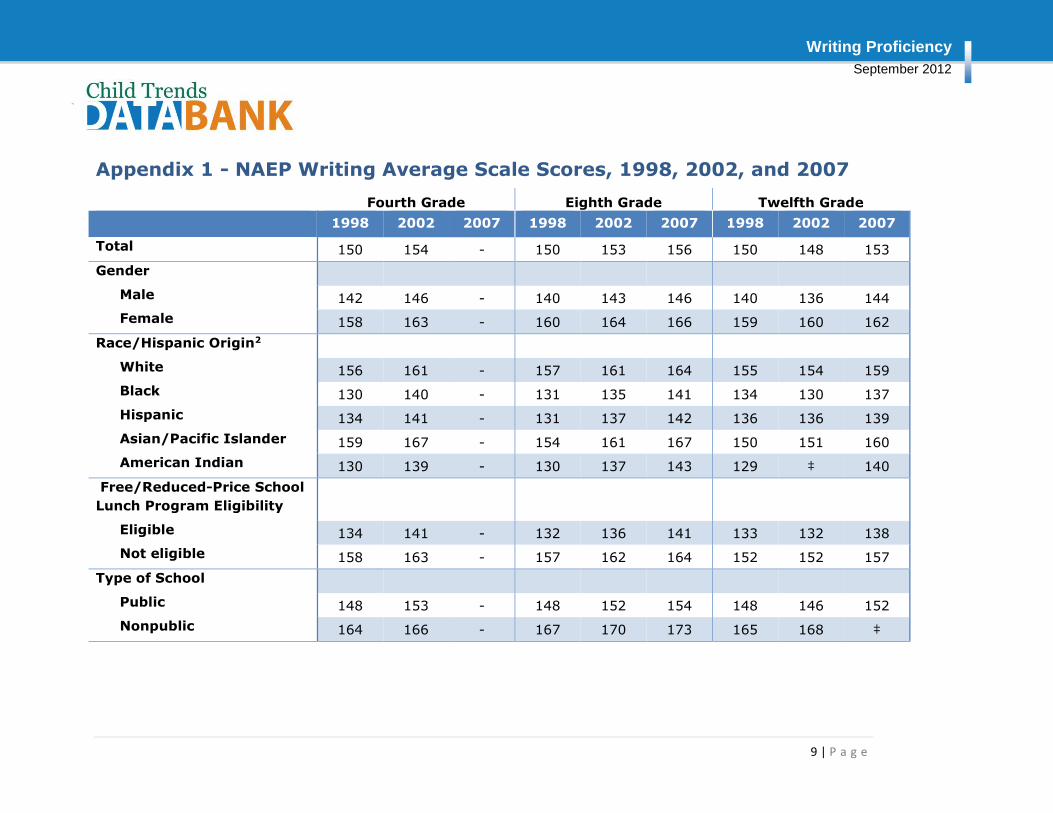
Appendix 1 - NAEP Writing Average Scale Scores, 1998, 2002, and 2007
Fourth Grade Eighth Grade Twelfth Grade
1998 2002 2007 1998 2002 2007 1998 2002 2007
Total 150 154 - 150 153 156 150 148 153
Gender
Male 142 146 - 140 143 146 140 136 144
Female 158 163 - 160 164 166 159 160 162
Race/Hispanic Origin2
White 156 161 - 157 161 164 155 154 159
Black 130 140 - 131 135 141 134 130 137
Hispanic 134 141 - 131 137 142 136 136 139
Asian/Pacific Islander 159 167 - 154 161 167 150 151 160
American Indian 130 139 - 130 137 143 129 ‡ 140
Free/Reduced-Price School
Lunch Program Eligibility
Eligible 134 141 - 132 136 141 133 132 138
Not eligible 158 163 - 157 162 164 152 152 157
Type of School
Public 148 153 - 148 152 154 148 146 152
Nonpublic 164 166 - 167 170 173 165 168 ‡
Writing Proficiency
September 2012
10 | P a g e
Fourth Grade Eighth Grade Twelfth Grade
1998 2002 2007 1998 2002 2007 1998 2002 2007
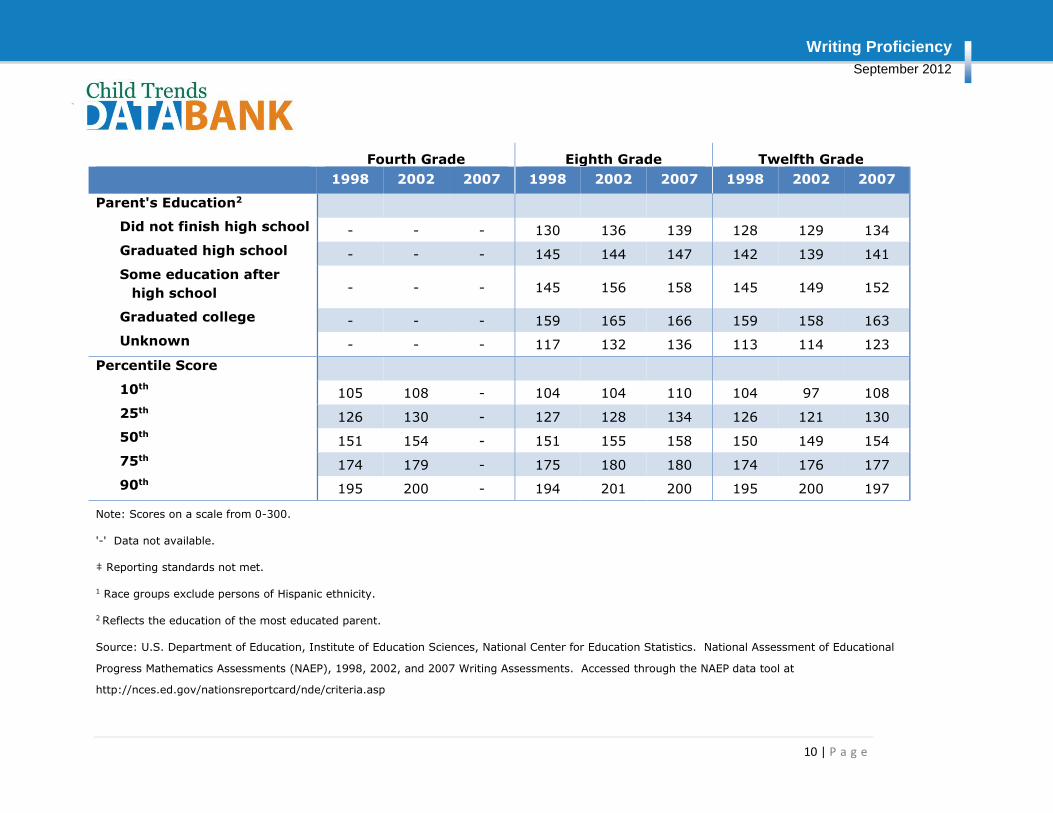
Parent's Education2
Did not finish high school - - - 130 136 139 128 129 134
Graduated high school - - - 145 144 147 142 139 141
Some education after
high school - - - 145 156 158 145 149 152
Graduated college - - - 159 165 166 159 158 163
Unknown - - - 117 132 136 113 114 123
Percentile Score
10th 105 108 - 104 104 110 104 97 108
25th 126 130 - 127 128 134 126 121 130
50th 151 154 - 151 155 158 150 149 154
75th 174 179 - 175 180 180 174 176 177
90th 195 200 - 194 201 200 195 200 197
Note: Scores on a scale from 0-300.
'-' Data not available.
‡ Reporting standards not met.
1 Race groups exclude persons of Hispanic ethnicity.
2 Reflects the education of the most educated parent.
Source: U.S. Department of Education, Institute of Education Sciences, National Center for Education Statistics. National Assessment of Educational
Progress Mathematics Assessments (NAEP), 1998, 2002, and 2007 Writing Assessments. Accessed through the NAEP data tool at
http://nces.ed.gov/nationsreportcard/nde/criteria.asp
Writing Proficiency
September 2012
11 | P a g e
Appendix 2 - NAEP Writing Average Scale Scores, 2011
Fourth Grade Eighth Grade
Total 150 150
Gender
Male 140 143
Female 160 157
Race/Hispanic Origin2
White 158 159
Black 132 130
Hispanic 136 134
Asian/Pacific Islander 163 158
American Indian 145 145
Free/Reduced-Price School Lunch
Program Eligibility
Eligible 134 133
Not eligible 161 157
Type of School
Public 149 148
Nonpublic 164 168
Writing Proficiency
September 2012
12 | P a g e
Fourth Grade Eighth Grade
Parent's Education2
Did not finish high school 133 129
Graduated high school 138 138
Some education after high school 150 149
Graduated college 160 160
Unknown 124 119
Urbanicity
City 144 146
Suburb 155 154
Town 148 149
Rural 150 149
Note: Scores on a scale from 0-300.
1 Race groups exclude persons of Hispanic ethnicity.
2 Reflects the education of the most educated parent.
Source: U.S. Department of Education, Institute of Education Sciences, National Center for Education Statistics.
National Assessment of Educational Progress Mathematics Assessments (NAEP), 2011 Writing Assessments.
Accessed through the NAEP data tool at http://nces.ed.gov/nationsreportcard/nde/criteria.asp

Writing Proficiency
September 2012
13 | P a g e
Endnotes
1 U.S. Department of Education, Office of Educational Research and Improvement, National Center for Education
Statistics. The Nation’s Report Card: Writing 2002, NCES 2003-529, by H.R Persky, M.C. Daane, and Y. Jin.
Washington, DC: 2003. http://nces.ed.gov/nationsreportcard/pdf/main2002/2003529.pdf
2 The National Commission on Writing. (2004). Writing: A ticket to work . . . or a ticket out: A survey of business leaders.
The College Board. Available at: www.writingcommission.org/prod_downloads/writingcom/writing-ticket-to-work.pdf.
3 The National Commission on Writing. (2005). Writing: A powerful message from state government. The College Board.
Available at: www.writingcommission.org/prod_downloads/writingcom/powerful-message-from-state.pdf.
4 For more information see http://www.galleryofwriting.org/about_ncte.php#day
5 In 2007 and 2011, fourth graders were not administered the writing assessment.
6 Note that none of the race groups include Hispanics of those races. Hispanics may be any race.
7 No information for fourth-graders is available.