Embed Size (px)
Citation preview

INNOVCare - Innovative Patient-Centred Approach for Social Care Provision to Complex Conditions
Technical note or random sampling and random allocation
WP7: TECHNICAL NOTE ON RANDOM SAMPLING AND RANDOM ALLOCATION
OF THE PARTICIPANTS OF THE INNOVCARE PILOT
This project is co-funded by the European Union
Call for Proposals VP/2014/008; EaSI PROGRESS, DG Employment, Social Affairs and Inclusion
The information contained in this publication does not necessarily reflect the official position of the European Commission.
Juliet Tschank & Katharina Handler
Centre for Social Innovation (ZSI), Austria Technical note on random sampling and Random allocation

INNOVCare - Innovative Patient-Centred Approach for Social Care Provision to Complex Conditions
Technical note or random sampling and random allocation
- 1 -
TABLE OF CONTENTS
1. RANDOM SAMPLING .................................................................................................. - 4 -
1.1 The procedure for selecting INNOVCare’s random sample................................................. - 4 - 1.1.1 Identifying all sampling units .............................................................................................................. - 4 - 1.1.2 Identifying the strata in which the population is to be divided .......................................................... - 5 - 1.1.3 Determining the number of elements to be selected in each stratum .............................................. - 7 - 1.1.4 Selecting the required number of participants from each stratum .................................................... - 9 - 1.1.5 Checking representativeness of the sample ..................................................................................... - 13 -
2. RANDOM ALLOCATION.............................................................................................. - 21 -
2.1 The procedure for the random allocation of participants into the 1st and 2nd cohorts ....... - 22 - 2.1.1 Identifying the blocking variables ..................................................................................................... - 22 - 2.1.2 Running the random allocation ........................................................................................................ - 25 - 2.1.3 Ex-post assessment of the randomisation procedure ...................................................................... - 26 -
3. 2nd selection and random allocation .......................................................................... - 33 -
3.1 Procedure for the 2nd selection ..................................................................................... - 34 - 3.1.1 Checking the representativeness of the sample ............................................................................... - 37 -
3.2 Procedure for randomisation of the 2nd selection ........................................................... - 45 - 3.2.1 Running the random allocation procedure on the 2
nd selection ...................................................... - 46 -
3.2.2 Ex-post assessment of the randomisation procedure ...................................................................... - 51 -
References ....................................................................................................................... - 59 -

INNOVCare - Innovative Patient-Centred Approach for Social Care Provision to Complex Conditions
Technical note or random sampling and random allocation
- 2 -
TABLE OF TABLES Table 1: Distribution of the total eligible population (N=275) according to age ...................................................... - 6 - Table 2: Distribution of the total eligible population (N=275) according to age and gender ................................... - 6 - Table 3: Ratio of each stratum in total eligible population (N=275)......................................................................... - 7 - Table 4: Number of participants in each stratum for a sample size of n=120 based on the ratios of each stratum in the total eligible population (in exact numbers) ....................................................................................................... - 7 - Table 5: Number of participants in each stratum for a sample size of n=120 based on the ratios of each stratum in the total eligible population (in whole numbers) ...................................................................................................... - 8 - Table 6: Distribution of NoRo participants according to defined strata based on age and gender.......................... - 8 - Table 7: Overview of expected n per stratum in a sample of n=120; distribution of NoRo participants according to strata and patients to sampled (n=60) in exact numbers ......................................................................................... - 9 - Table 8: Number of patients to be sampled per stratum (in whole numbers) .......................................................... - 9 - Table 9: Distribution of the total eligible population (N=275) according to the ‘stratvar’ (a combination of the variables: ‘noro’, ‘agegroup’ and ‘sex’) .................................................................................................................. - 10 - Table 10: Sample to be drawn according to the ‘stratvar’ (a combination of the variables: ‘noro’, ‘agegroup’ and ‘sex’) ........................................................................................................................................................................ - 11 - Table 11: Independent T-Test of the age variable on the ‘selected’ variable (INNOVCare participant vs. remaining eligible population) ................................................................................................................................................. - 13 - Table 12: Chi-Square test of independence of the ‘agegroup’ variable between the selected INNOVCare participants and the remaining eligible population ................................................................................................ - 14 - Table 13: Chi-Square test of independence of the ‘noro’ variable between the selected INNOVCare participants and the remaining eligible population ........................................................................................................................... - 15 - Table 14: Chi-Square test of independence of the ‘sex’ variable between the selected INNOVCare participants and the remaining eligible population ........................................................................................................................... - 16 - Table 15: Chi-Square test of independence of the ‘area’ variable between the selected INNOVCare participants and the remaining eligible population ........................................................................................................................... - 17 - Table 16: Distribution of total sample according to ‘noro’ and ‘area’ .................................................................... - 17 - Table 17: Chi-Square test of independence of the ‘cluster’ variable between the selected INNOVCare participants and the remaining eligible population .................................................................................................................... - 18 - Table 18: Distribution of total sample according to ‘cluster’ and ‘noro’ ................................................................ - 19 - Table 19: Chi-Square test of independence of the ‘disability’ variable between the selected INNOVCare participants and the remaining eligible population .................................................................................................................... - 20 - Table 20: Distribution of the total sample (N=120) according to the ‘randvar’ (a combination of the variables: ‘noro’, ‘agegroup2’, ‘sex’ and ‘area’) ...................................................................................................................... - 24 - Table 21: Allocation of participants in each stratum into the 1
st and 2
nd cohort .................................................... - 25 -
Table 22: Independent T-Test of the age variable on the ‘group’ variable (1st
cohort vs. 2nd
cohort) .................... - 26 - Table 23: Chi-Square test of independence of the ‘agegroup2’ variable between the 1
st and 2
nd cohorts ............. - 27 -
Table 24: Chi-Square test of independence of the ‘noro’ variable between the 1st
and 2nd
cohorts ....................... - 28 - Table 25: Chi-Square test of independence of the ‘sex’ variable between the 1
st and 2
nd cohorts ......................... - 29 -
Table 26: Chi-Square test of independence of the ‘area’ variable between the 1st
and 2nd
cohorts ....................... - 30 - Table 27: Chi-Square test of independence of the ‘cluster’ variable between 1
st and 2
nd cohorts .......................... - 31 -
Table 28: Chi-Square test of independence of the ‘disability’ variable between the 1st
and 2nd
cohorts ................ - 32 - Table 29: New total sample (as of April 2017) ........................................................................................................ - 34 - Table 30: Distribution of new total sample according to participation in pilot ...................................................... - 34 - Table 31: Possible replacements of the non-takers according to ‘agegroup’ and ‘sex’ .......................................... - 35 - Table 32: Distribution of non-takers and automatically eligible cases by ‘agegroup’ and ‘sex’ and as a result, the number of cases to be selected by ‘agegroup’ and ‘sex’ ........................................................................................ - 36 - Table 33: Number of cases per stratum sampled ................................................................................................... - 36 - Table 34: Demonstration of the ‘combo’ variable (missing the codes for ‘replacement’: 0 and 2) ........................ - 37 -

INNOVCare - Innovative Patient-Centred Approach for Social Care Provision to Complex Conditions
Technical note or random sampling and random allocation
- 3 -
Table 35: Independent T-Test of the age variable on the ‘selected’ variable (new composition of INNOVCare participants vs. remaining eligible population) ...................................................................................................... - 38 - Table 36: Chi-Square test of independence of the ‘agegroup’ variable between the new composition of INNOVCare participants and the remaining eligible population ................................................................................................ - 38 - Table 37: Chi-Square test of independence of the ‘noro’ variable between the new composition of INNOVCare participants and the remaining eligible population ................................................................................................ - 40 - Table 38: Chi-Square test of independence of the ‘sex’ variable between the new composition of INNOVCare participants and the remaining eligible population ................................................................................................ - 41 - Table 39: Chi-Square test of independence of the ‘area’ variable between the new composition of INNOVCare participants and the remaining eligible population ................................................................................................ - 42 - Table 40: Chi-Square test of independence of the ‘disease cluster’ variable between the new composition of INNOVCare participants and the remaining eligible population ............................................................................ - 43 - Table 41: Chi-Square test of independence of the ‘disability’ variable between the new composition of INNOVCare participants and the remaining eligible population ................................................................................................ - 44 - Table 42: Distribution of the non-takers between the 1
st and the 2
nd cohorts ....................................................... - 45 -
Table 43: Distribution of the new selection (N=25) according to the ‘randvar’ (a combination of the variables: ‘noro’, ‘agegroup2’, ‘sex’ and ‘area’) ...................................................................................................................... - 46 - Table 44: Allocation of participants in each stratum into the 1
st and 2
nd cohort .................................................... - 47 -
Table 45: Distribution of the new composition of INNOVCare participants according to case managers ............. - 49 - Table 46: Distribution of the new composition of INNOVCare participants according to case managers and cohorts- 49 - Table 47: Independent T-Test of the age variable on the ‘group’ variable (1
st cohort vs. 2
nd cohort) .................... - 51 -
Table 48: Chi-Square test of independence of the ‘agegroup2’ variable between the 1st
and 2nd
cohorts ............. - 52 - Table 49: Chi-Square test of independence of the ‘noro’ variable between the 1
st and 2
nd cohorts ....................... - 53 -
Table 50: Chi-Square test of independence of the ‘sex’ variable between the 1st
and 2nd
cohorts ......................... - 54 - Table 51: Chi-Square test of independence of the ‘area’ variable between the 1
st and 2
nd cohorts ....................... - 55 -
Table 52: Chi-Square test of independence of the ‘disease cluster’ variable between the 1st
and 2nd
cohorts ....... - 56 - Table 53: Chi-Square test of independence of the ‘degree of disability` variable between the 1
st and 2
nd cohorts - 57 -
TABLES OF FIGURES
Figure 1: Depiction of the sampling procedure in a hierarchy diagram ................................................................. - 12 - Figure 2: Depiction of the randomisation procedure in a hierarchy diagram ......................................................... - 24 -

INNOVCare - Innovative Patient-Centred Approach for Social Care Provision to Complex Conditions
Technical note or random sampling and random allocation
- 4 -
1. RANDOM SAMPLING
‘Sampling is the process of selecting a few from a bigger group to become the basis of estimating or predicting the prevalence of an unknown piece of information, situation or outcome regarding the bigger group (Kumar, 2005, p. 164)’ – the process of choosing research participants from the population. Random or probability designs are based on the idea that ‘each element in the population has an equal and independent chance of selection in the sample’ (Kumar, 2005, p. 168). In the case of INNOVCare’s pilot study, ‘an element’ refers to individual rare disease patients in the county of Salaj. INNOVCare’s pilot study implements both random and non-random sampling. The automatic inclusion of the existing patients of NoRo in the study presents the non-random aspect. To increase the representativeness of the sample, based strictly on the resource availability in the project, 60 new participants from the total eligible population of rare disease patients in the county of Salaj will be randomly sampled. Random sampling enables generalisation of findings to the population from which the sample has been drawn (Verma, 2016). There are three types of random/probability sampling: simple random sampling stratified random sampling (proportionate and disproportionate) and cluster sampling. For the purpose of this study, a proportionate stratified random sampling will be used to select 60 new participants, who are rare disease patients in the county of Salaj currently not benefitting from NoRo’s services. This method is superior to both the simple random sampling and the cluster sampling because it more accurately represents the whole population. The remaining eligible population, after eliminating those who are currently under NoRo’s care, will be divided into different groups also known as strata based on their characteristics and on characteristics which are likely to affect or be related to the outcome or dependent variable of the experiment. Once the eligible sample has been divided into groups, the sample is selected proportionally to the size of each stratum in the eligible population – this is referred to as ‘proportionate stratified sampling’ (Kumar, 2005, p. 176). Below, the randomisation process is described. 1.1 The procedure for selecting INNOVCare’s random sample
1.1.1 Identifying all sampling units
A list with all the rare disease patients registered in the registry of the County of Salaj was provided to NoRo. NoRo then counterchecked the list with its own patients. For each patient, they indicated whether the patient was already under NoRo’s care by giving the patient a code starting with ‘int’ or whether the patient was external and therefore not under their care, they gave such cases a code starting with ‘ext’. As NoRo’s patients not only include rare disease patients but also patients with complex conditions, some of its existing patients were not already included in the list, and as a result, these patients were added to the list. Finally, NoRo provided ZSI an anonymous list (no names, just participant codes) with 275 rare and complex disease patients. The information that was made available for each patient includes:
Patient code: For patients under NoRo’s care, ranging from ‘int001’ to ‘int060’ and for external patients ranging from ‘ext001’ to ‘ext215’

INNOVCare - Innovative Patient-Centred Approach for Social Care Provision to Complex Conditions
Technical note or random sampling and random allocation
- 5 -
Age: ranging from 0 to 82 Age category: Adult (N=129) or minor (N=146) Gender: Female (N=149) or male (N=126) Location: Urban (N=156) or rural (N=119) Type of disease: 27 different diseases (ADHD, Albinism, Anaemia, autistic spectrum disorders,
autistic spectrum disorders & epilepsy, Crohn disease, Downs syndrome, Epidermolysis bullosa, epilepsy, Extramedullary plasma, kidney disease, Mastocytosis, Multiple sclerosis, Muscular dystrophies, Myasthenia gravis, Myeloma, Myopathy, Neuropathies, Pervasive development disorder, Pervasive development disorder & ADHD, PKU, Prader Willi, Ring chromosome 18, Tetraparesis, Turner Syndrome, West Syndrome and Williams Syndrome) and undiagnosed (N=12)
Disease cluster: 8 clusters altogether (Autistic spectrum disorders (N=21), Congenital anomalies with intellectual disabilities (N=71), Epilepsies (N=18), Kidney disease (N=5), Metabolic diseases (N=11), Neurological diseases (N=128), Rare tumours (N=12) and Skin and tissue complex disorders (N=9)) Note: From the 12 undiagnosed patients 11 of them were under NoRo’s care and based on their expertise, they categorised these patients under ‘congenital anomalies with intellectual disabilities’. The one external undiagnosed patient was also classified under this group based on NoRo’s expertise, considering the patients age and ORPHA code.
Degree of disability: classified into 6 categories (no disability (N=2), severe functional deficiency without personal assistant (N=20), severe functional deficiency with personal assistant (N=141), marked functional deficiency (N=104), moderate functional deficiency (n=7) and mild functional deficiency (N=1))
ORPHA code
1.1.2 Identifying the strata in which the population is to be divided
Considering that the majority of the existing patients at NoRo are under 18 (n=50), age will be one of the variables for stratification to ensure that the other age groups are also represented. Sampling other age groups also increases validity in the data because due to ‘maturation’ participants especially ‘young ones may change simply as a consequence of development; changes of which might be confused as those due to the manipulations of the independent variable’ (Field & Hole, 2003, p. 59). As one of the advantages of stratification is the possibility of sub-group analysis of data, a good balance of stratification variables should be struck to ensure that the groups generated are not too small rendering sub-group analysis meaningless. As a result, gender is the only other variable that was used in the stratification. The age variable was divided into the following 9 groups:
INNOVCare - Innovative Patient-Centred Approach for Social Care Provision to Complex Conditions
Technical note or random sampling and random allocation
- 6 -
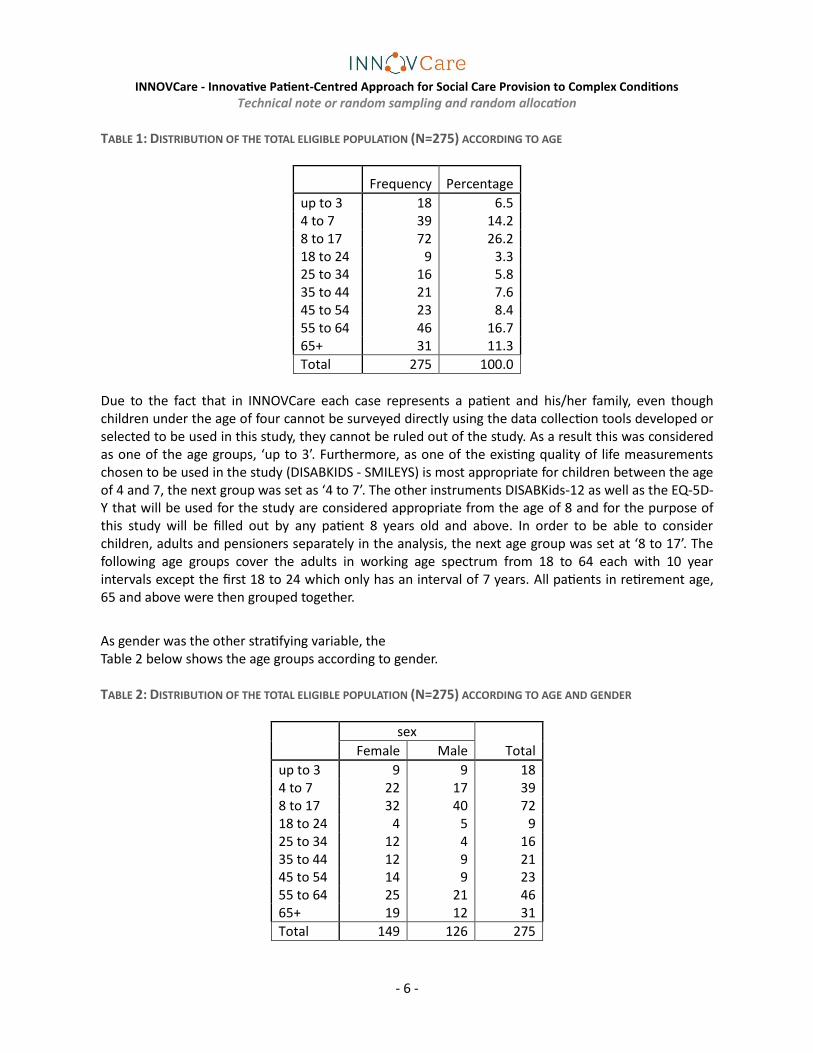
TABLE 1: DISTRIBUTION OF THE TOTAL ELIGIBLE POPULATION (N=275) ACCORDING TO AGE
Frequency Percentage
up to 3 18 6.5 4 to 7 39 14.2 8 to 17 72 26.2 18 to 24 9 3.3 25 to 34 16 5.8 35 to 44 21 7.6 45 to 54 23 8.4 55 to 64 46 16.7 65+ 31 11.3
Total 275 100.0
Due to the fact that in INNOVCare each case represents a patient and his/her family, even though children under the age of four cannot be surveyed directly using the data collection tools developed or selected to be used in this study, they cannot be ruled out of the study. As a result this was considered as one of the age groups, ‘up to 3’. Furthermore, as one of the existing quality of life measurements chosen to be used in the study (DISABKIDS - SMILEYS) is most appropriate for children between the age of 4 and 7, the next group was set as ‘4 to 7’. The other instruments DISABKids-12 as well as the EQ-5D-Y that will be used for the study are considered appropriate from the age of 8 and for the purpose of this study will be filled out by any patient 8 years old and above. In order to be able to consider children, adults and pensioners separately in the analysis, the next age group was set at ‘8 to 17’. The following age groups cover the adults in working age spectrum from 18 to 64 each with 10 year intervals except the first 18 to 24 which only has an interval of 7 years. All patients in retirement age, 65 and above were then grouped together.
As gender was the other stratifying variable, the Table 2 below shows the age groups according to gender. TABLE 2: DISTRIBUTION OF THE TOTAL ELIGIBLE POPULATION (N=275) ACCORDING TO AGE AND GENDER
sex
Total Female Male
up to 3 9 9 18 4 to 7 22 17 39 8 to 17 32 40 72 18 to 24 4 5 9 25 to 34 12 4 16 35 to 44 12 9 21 45 to 54 14 9 23 55 to 64 25 21 46 65+ 19 12 31
Total 149 126 275

INNOVCare - Innovative Patient-Centred Approach for Social Care Provision to Complex Conditions
Technical note or random sampling and random allocation
- 7 -
1.1.3 Determining the number of elements to be selected in each stratum
The ratios of each stratum in comparison to the total population were calculated. For example, female patients aged up to 3 (N=9) make up 3% of the total population (N=275). Below are the ratios for each stratum. TABLE 3: RATIO OF EACH STRATUM IN TOTAL ELIGIBLE POPULATION (N=275)
Ratio
in age group
Ratio of females
in age group
Ratio of males
in age group
up to 3 0.07 0.03 0.03 4 to 7 0.14 0.08 0.06 8 to 17 0.26 0.12 0.15 18 to 24 0.03 0.01 0.02 25 to 34 0.06 0.04 0.01 35 to 44 0.08 0.04 0.03 45 to 54 0.08 0.05 0.03 55 to 64 0.17 0.09 0.08 65+ 0.11 0.07 0.04
Total (N=275) 1.00 0.54 0.46
Considering that the total sample should be n=120, the ratios presented in Table 3 above were used to calculate the number of participants required in each stratum (ratio multiplied by 120) for a total sample of 120 one would need 4 female patients aged up to 3 (0.03*120). Table 4 below shows the number of participants in each stratum for the total sample size of n=120 in exact numbers. TABLE 4: NUMBER OF PARTICIPANTS IN EACH STRATUM FOR A SAMPLE SIZE OF N=120 BASED ON THE RATIOS OF EACH
STRATUM IN THE TOTAL ELIGIBLE POPULATION (IN EXACT NUMBERS)
Ratio
in age group Ratio of females
in age group Ratio of males
in age group
up to 3 7.85 3.93 3.93
4 to 7 17.02 9.60 7.42
8 to 17 31.42 13.96 17.45
18 to 24 3.93 1.75 2.18
25 to 34 6.98 5.24 1.75
35 to 44 9.16 5.24 3.93
45 to 54 10.04 6.11 3.93
55 to 64 20.07 10.91 9.16
65+ 13.53 8.29 5.24

INNOVCare - Innovative Patient-Centred Approach for Social Care Provision to Complex Conditions
Technical note or random sampling and random allocation
- 8 -
120.00 65.02 54.98
Table 5 below shows the number of participants in each stratum for the total sample size of n=120 in whole numbers. TABLE 5: NUMBER OF PARTICIPANTS IN EACH STRATUM FOR A SAMPLE SIZE OF N=120 BASED ON THE RATIOS OF EACH
STRATUM IN THE TOTAL ELIGIBLE POPULATION (IN WHOLE NUMBERS)
Ratio
in age group Ratio of females
in age group Ratio of males
in age group
up to 3 8 4 4
4 to 7 17 10 7
8 to 17 31 14 17
18 to 24 4 2 2
25 to 34 7 5 2
35 to 44 9 5 4
45 to 54 10 6 4
55 to 64 20 11 9
65+ 14 8 5
120 65 55
As 60 of the 120 participants are already predefined, one needs to consider where they fall in each stratum in order to determine how many participants in each stratum need to be selected from the remaining population of eligible participants. Table 6 below shows NoRo’s participants and where they fall in respect to the defined strata according to age and gender. TABLE 6: DISTRIBUTION OF NORO PARTICIPANTS ACCORDING TO DEFINED STRATA BASED ON AGE AND GENDER
NoRo's patients (n=60)
Total Female Male
up to 3 1 0 1 4 to 7 18 8 10 8 to 17 31 15 16 18 to 24 2 2 0 25 to 34 6 6 0 35 to 44 2 1 1 45 to 54 0 0 0 55 to 64 0 0 0 65+ 0 0 0
60 32 28
To determine how many new patients need to be sampled, one needs to subtract NoRo’s patients from the expected number considering a sample of n=120 in each stratum.

INNOVCare - Innovative Patient-Centred Approach for Social Care Provision to Complex Conditions
Technical note or random sampling and random allocation
- 9 -
TABLE 7: OVERVIEW OF EXPECTED N PER STRATUM IN A SAMPLE OF N=120; DISTRIBUTION OF NORO PARTICIPANTS
ACCORDING TO STRATA AND PATIENTS TO SAMPLED (N=60) IN EXACT NUMBERS
Expected n per stratum in a
sample of n=120 Noro's patients (n=60) Patients to sample
(n=60)
Total Female Male Total Female Male Total Female Male
up to 3 8 4 4 1 0 1 7 4 3
4 to 7 17 10 7 18 8 10 -1 2 -3
8 to 17 31 14 17 31 15 16 0 -1 1
18 to 24 4 2 2 2 2 0 2 0 2
25 to 34 7 5 2 6 6 0 1 -1 2
35 to 44 9 5 4 2 1 1 7 4 3
45 to 54 10 6 4 0 0 0 10 6 4
55 to 64 20 11 9 0 0 0 20 11 9
65+ 14 8 5 0 0 0 14 8 5
120 65 55 60 32 28 60 33 27
As can be seen in Table 7 above, in 4 cases (in red) NoRo patients in those strata are slightly more than the calculated ratios. On account that existing NoRo patients are automatically eligible for the intervention, these exceptions will have to be left. As they are quite few, they are unlikely to have any effect on the representativeness of the sample. Below are the patients to be sampled in whole numbers. TABLE 8: NUMBER OF PATIENTS TO BE SAMPLED PER STRATUM (IN WHOLE NUMBERS)
Patients to sample
(n=60)
Total Female Male
up to 3 7 4 3 4 to 7 0 0 0 8 to 17 0 0 0 18 to 24 2 0 2 25 to 34 1 0 1
35 to 44 7 4 3
45 to 54 10 6 4 55 to 64 20 11 9
65+ 13 8 5
60 33 27
1.1.4 Selecting the required number of participants from each stratum

INNOVCare - Innovative Patient-Centred Approach for Social Care Provision to Complex Conditions
Technical note or random sampling and random allocation
- 10 -
In SPSS, the variables ‘noro’ (NoRo’s patients or external patients), ‘agegroup’ (up to 3, 4 to 7, 8 to 17, 18 to 24, 25 to 34, 35 to 44, 45 to 54, 55 to 64 and 65+) and ‘sex’ (female or male) were combined into one variable ‘stratvar’. TABLE 9: DISTRIBUTION OF THE TOTAL ELIGIBLE POPULATION (N=275) ACCORDING TO THE ‘STRATVAR’ (A COMBINATION
OF THE VARIABLES: ‘NORO’, ‘AGEGROUP’ AND ‘SEX’)
Group stratvar: Combination of noro, agegroup and sex (N=275) Frequency Percentage
1 noro = 1 (NoRos patients) agegroup = 1 (up to 3) sex = 2 (Male) 1 .4
2 noro = 1 (NoRos patients) agegroup = 2 (4 to 7) sex = 1 (Female) 8 2.9
3 noro = 1 (NoRos patients) agegroup = 2 (4 to 7) sex = 2 (Male) 10 3.6
4 noro = 1 (NoRos patients) agegroup = 3 (8 to 17) sex = 1 (Female) 15 5.5
5 noro = 1 (NoRos patients) agegroup = 3 (8 to 17) sex = 2 (Male) 16 5.8
6 noro = 1 (NoRos patients) agegroup = 4 (18 to 24) sex = 1 (Female) 2 .7
7 noro = 1 (NoRos patients) agegroup = 5 (25 to 34) sex = 1 (Female) 6 2.2
8 noro = 1 (NoRos patients) agegroup = 6 (35 to 44) sex = 1 (Female) 1 .4
9 noro = 1 (NoRos patients) agegroup = 6 (35 to 44) sex = 2 (Male) 1 .4
10 noro = 2 (External patients) agegroup = 1 (up to 3) sex = 1 (Female) 9 3.3
11 noro = 2 (External patients) agegroup = 1 (up to 3) sex = 2 (Male) 8 2.9
12 noro = 2 (External patients) agegroup = 2 (4 to 7) sex = 1 (Female) 14 5.1
13 noro = 2 (External patients) agegroup = 2 (4 to 7) sex = 2 (Male) 7 2.5
14 noro = 2 (External patients) agegroup = 3 (8 to 17) sex = 1 (Female) 17 6.2
15 noro = 2 (External patients) agegroup = 3 (8 to 17) sex = 2 (Male) 24 8.7
16 noro = 2 (External patients) agegroup = 4 (18 to 24) sex = 1 (Female) 2 .7
17 noro = 2 (External patients) agegroup = 4 (18 to 24) sex = 2 (Male) 5 1.8
18 noro = 2 (External patients) agegroup = 5 (25 to 34) sex = 1 (Female) 6 2.2
19 noro = 2 (External patients) agegroup = 5 (25 to 34) sex = 2 (Male) 4 1.5
20 noro = 2 (External patients) agegroup = 6 (35 to 44) sex = 1 (Female) 11 4.0
21 noro = 2 (External patients) agegroup = 6 (35 to 44) sex = 2 (Male) 8 2.9
22 noro = 2 (External patients) agegroup = 7 (45 to 54) sex = 1 (Female) 14 5.1
23 noro = 2 (External patients) agegroup = 7 (45 to 54) sex = 2 (Male) 9 3.3
24 noro = 2 (External patients) agegroup = 8 (55 to 64) sex = 1 (Female) 25 9.1
25 noro = 2 (External patients) agegroup = 8 (55 to 64) sex = 2 (Male) 21 7.6
26 noro = 2 (External patients) agegroup = 9 (65+) sex = 1 (Female) 19 6.9
27 noro = 2 (External patients) agegroup = 9 (65+) sex = 2 (Male) 12 4.4
Total 275 100
A completely random variable was then generated that assigned a random number to each participant between 0 and 1. These random values were then ranked for each of the 27 groups above. For each group between 10 and 27 (inclusive), which represent the external participants divided by age group and gender, a fixed number of participants according to Table 8 above were randomly drawn.
INNOVCare - Innovative Patient-Centred Approach for Social Care Provision to Complex Conditions
Technical note or random sampling and random allocation
- 11 -
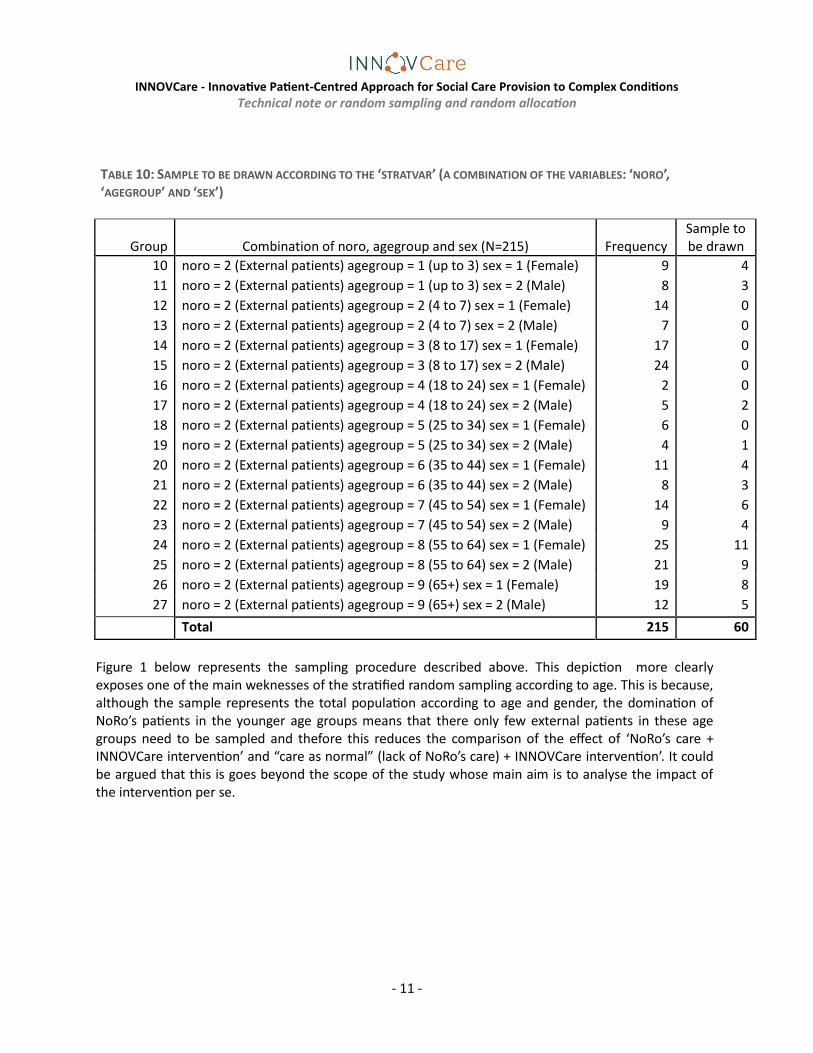
TABLE 10: SAMPLE TO BE DRAWN ACCORDING TO THE ‘STRATVAR’ (A COMBINATION OF THE VARIABLES: ‘NORO’, ‘AGEGROUP’ AND ‘SEX’)
Group Combination of noro, agegroup and sex (N=215) Frequency Sample to be drawn
10 noro = 2 (External patients) agegroup = 1 (up to 3) sex = 1 (Female) 9 4
11 noro = 2 (External patients) agegroup = 1 (up to 3) sex = 2 (Male) 8 3
12 noro = 2 (External patients) agegroup = 2 (4 to 7) sex = 1 (Female) 14 0
13 noro = 2 (External patients) agegroup = 2 (4 to 7) sex = 2 (Male) 7 0
14 noro = 2 (External patients) agegroup = 3 (8 to 17) sex = 1 (Female) 17 0
15 noro = 2 (External patients) agegroup = 3 (8 to 17) sex = 2 (Male) 24 0
16 noro = 2 (External patients) agegroup = 4 (18 to 24) sex = 1 (Female) 2 0
17 noro = 2 (External patients) agegroup = 4 (18 to 24) sex = 2 (Male) 5 2
18 noro = 2 (External patients) agegroup = 5 (25 to 34) sex = 1 (Female) 6 0
19 noro = 2 (External patients) agegroup = 5 (25 to 34) sex = 2 (Male) 4 1
20 noro = 2 (External patients) agegroup = 6 (35 to 44) sex = 1 (Female) 11 4
21 noro = 2 (External patients) agegroup = 6 (35 to 44) sex = 2 (Male) 8 3
22 noro = 2 (External patients) agegroup = 7 (45 to 54) sex = 1 (Female) 14 6
23 noro = 2 (External patients) agegroup = 7 (45 to 54) sex = 2 (Male) 9 4
24 noro = 2 (External patients) agegroup = 8 (55 to 64) sex = 1 (Female) 25 11
25 noro = 2 (External patients) agegroup = 8 (55 to 64) sex = 2 (Male) 21 9
26 noro = 2 (External patients) agegroup = 9 (65+) sex = 1 (Female) 19 8
27 noro = 2 (External patients) agegroup = 9 (65+) sex = 2 (Male) 12 5
Total 215 60
Figure 1 below represents the sampling procedure described above. This depiction more clearly exposes one of the main weknesses of the stratified random sampling according to age. This is because, although the sample represents the total population according to age and gender, the domination of NoRo’s patients in the younger age groups means that there only few external patients in these age groups need to be sampled and thefore this reduces the comparison of the effect of ‘NoRo’s care + INNOVCare intervention’ and “care as normal” (lack of NoRo’s care) + INNOVCare intervention’. It could be argued that this is goes beyond the scope of the study whose main aim is to analyse the impact of the intervention per se.

INNOVCare - Innovative Patient-Centred Approach for Social Care Provision to Complex Conditions
Technical note or random sampling and random allocation
- 12 -
FIGURE 1: DEPICTION OF THE SAMPLING PROCEDURE IN A HIERARCHY DIAGRAM
Total eligible population
(N=275)
Up to 3
(N=18)
Female
(N=9)
NoRo (N=0)
External (N=9)
Female (n=4)
Male (N=9)
NoRo (N=1)
External (N=8)
Male (n=3)
4 to 7 (N=39)
Female (N=22)
NoRo (N=8)
External (N=14)
Female (n=0)
Male (N=17)
NoRo (N=10)
External (N=7)
Male (n=0)
8 to 17 (N=72)
Female (N=32)
NoRo (N=15)
External (N=17)
Female (n=0)
Male (N=40)
NoRo (N=16)
External (N=24)
Male (n=0)
18 to 24 (N=9)
Female (N=4)
NoRo (N=2)
External (N=2)
Female (n=0)
Male (N=5)
NoRo (N=0)
External (N=5)
Male (N=2)
25 to 34 (N=16)
Female (N=12)
NoRo (N=6)
External (N=6)
Female (n=0)
Male (N=4)
NoRo (N=0)
External (N=4)
Male (n=1)
35 to 44 (N=21)
Female (N=12)
NoRo (N=1)
External (N=11)
Female (n=4)
Male (N=9)
NoRo (N=1)
External (N=8)
Male (n=3)
45 to 54 (N=23)
Female (N=14)
NoRo (N=0)
External (N=14)
Female (n=6)
Male (N=9)
NoRo (N=0)
External (N=9)
Male (n=4)
55 to 64 (N=46)
Female (N=25)
NoRo (N=0)
External (N=25)
Female (n=11)
Male (N=21)
NoRo (N=0)
External (N=21)
Male (n=9)
65+ (N=31)
Female (N=19)
NoRo (N=0)
External (N=19)
Female (n=8)
Male (N=12)
NoRo (N=0)
External (N=12)
Male (n=5)

INNOVCare - Innovative Patient-Centred Approach for Social Care Provision to Complex Conditions
Technical note or random sampling and random allocation
- 13 -
1.1.5 Checking representativeness of the sample
On the basis of the available variables (age, age group, gender, degree of disability, disease cluster and area), the sample drawn was checked for its representativeness of the whole population. 1.1.5.1 Age
On average, the sample selected has a slightly lower mean (M=31.41, SE=1.970) than the remaining eligible population (M=31.63, SE=2.25). This difference of 0.22, 95% CI [-5.659, 6.107] was not significant t(273) = 0.075, p =.940 meaning that there is no statistically significant difference in the age distribution of the two groups.
TABLE 11: INDEPENDENT T-TEST OF THE AGE VARIABLE ON THE ‘SELECTED’ VARIABLE (INNOVCARE PARTICIPANT VS. REMAINING ELIGIBLE POPULATION)
Group Statistics
selected
N Mean Standard deviation
Standard error of
the mean
age Not selected 155 31.63 24.522 1.970
INNOVCare participants
120 31.41 24.648 2.250
Independent Samples Test
Levene’s Test for Equality of Variances T-Test for equality of means
F Significance T df
Sig. (2-
tailed) Mean
difference
Standard error of
the difference
95% Confidence
interval of the difference
Lower upper
age Variances are equal
.029 .865 .075 273 .940 .224 2.988 -5.659 6.107
Variances are not equal
.075 255.379 .940 .224 2.990 -5.665 6.113

INNOVCare - Innovative Patient-Centred Approach for Social Care Provision to Complex Conditions
Technical note or random sampling and random allocation
- 14 -
1.1.5.2 Age group (9 levels) There is no significant difference in the distribution of the age groups between the selected participants and the remaining eligible population X2 (8) = 0.160, p =1.000.
TABLE 12: CHI-SQUARE TEST OF INDEPENDENCE OF THE ‘AGEGROUP’ VARIABLE BETWEEN THE SELECTED INNOVCARE
PARTICIPANTS AND THE REMAINING ELIGIBLE POPULATION
Crosstab agegroup by selected
selected
Total Not
selected INNOVCare participants
agegroup up to 3 Count 10 8 18
% Within Selected .1 .1 .1
4 to 7 Count 21 18 39
% Within Selected .1 .2 .1
8 to 17 Count 41 31 72
% Within Selected .3 .3 .3
18 to 24 Count 5 4 9
% Within Selected .0 .0 .0
25 to 34 Count 9 7 16
% Within Selected .1 .1 .1
35 to 44 Count 12 9 21
% Within Selected .1 .1 .1
45 to 54 Count 13 10 23
% Within Selected .1 .1 .1
55 to 64 Count 26 20 46
% Within Selected .2 .2 .2
65+ Count 18 13 31
% Within Selected .1 .1 .1
Total Count 155 120 275
% Within Selected 1.0 1.0 1.0
Chi-Square Tests
Value df
Asymp. Sig. (2-Tailed)
Pearson Chi-Square .160a 8 1.000
Likelihood Ratio .160 8 1.000
Linear-by-Linear Association .059 1 .809
N of Valid Cases 275
a. 1 cell (5.6%) has an expected count of less than 5. The minimal expected frequency is 3.93.

INNOVCare - Innovative Patient-Centred Approach for Social Care Provision to Complex Conditions
Technical note or random sampling and random allocation
- 15 -
1.1.5.3 Type of patient There is a significant difference in the distribution of the type of patient (NoRo’s patients or external patients) between the selected participants and the remaining eligible population X2 (1) = 99.128, p <0.0001. This is clear because all NoRo patients are automatically eligible and are included in the sample. The remaining eligible population does not include any NoRo patients. TABLE 13: CHI-SQUARE TEST OF INDEPENDENCE OF THE ‘NORO’ VARIABLE BETWEEN THE SELECTED INNOVCARE
PARTICIPANTS AND THE REMAINING ELIGIBLE POPULATION
Crosstab noro by selected
selected
Total Not
selected INNOVCare participants
noro NoRos patients Count 0 60 60
% Within Selected .0 .5 .2
External patients Count 155 60 215
% Within Selected 1.0 .5 .8
Total Count 155 120 275
% Within Selected 1.0 1.0 1.0
Chi-Square Tests
Value df
Asymp. Sig. (2-Tailed)
Exact Sig. (2-Tailed)
Exact. Sig. (1-Tailed)
Pearson Chi-Square 99.128a 1 .000
Continuity Correctionb 96.218 1 .000
Likelihood Ratio 122.173 1 .000
Fisher’s Exact Test .000 .000
Linear-by-Linear Association 98.767 1 .000
N of Valid Cases 275
a. 0 cells have expected counts less than 5. The minimal expected frequency is 26.18. b. Computed only for a 2X2 table.

INNOVCare - Innovative Patient-Centred Approach for Social Care Provision to Complex Conditions
Technical note or random sampling and random allocation
- 16 -
1.1.5.4 Gender There is no significant difference in the distribution of the gender between the selected participants and the remaining eligible population X2 (1) = 0.00, p =0.996. TABLE 14: CHI-SQUARE TEST OF INDEPENDENCE OF THE ‘SEX’ VARIABLE BETWEEN THE SELECTED INNOVCARE
PARTICIPANTS AND THE REMAINING ELIGIBLE POPULATION
Crosstab sex by selected
selected
Total Not
selected INNOVCare participants
sex Female Count 84 65 149
% Within Selected .5 .5 .5
Male Count 71 55 126
% Within Selected .5 .5 .5
Total Count 155 120 275
% Within Selected 1.0 1.0 1.0
Chi-Quadrat-Tests
Value df
Asymp. Sig. (2-Tailed)
Exact Sig. (2-Tailed)
Exact. Sig. (1-Tailed)
Pearson Chi-Square .000 a 1 .996
Continuity Correctionb .000 1 1.000
Likelihood Ratio .000 1 .996
Fisher’s Exact Test 1.000 .547
Linear-by-Linear Association .000 1 .996
N of Valid Cases 275
a. 0 cells have expected counts less than 5. The minimal expected frequency is 54.98. b. Computed only for a 2X2 table.

INNOVCare - Innovative Patient-Centred Approach for Social Care Provision to Complex Conditions
Technical note or random sampling and random allocation
- 17 -
1.1.5.5 Area
There is a significant difference in the distribution of the area where the participants live between the selected participants and the remaining eligible population X2 (1) = 15.279, p =<0.001. The significant difference of this variable between the two groups is as a result of the fact that about 91.7% of NoRo’s patients live in urban areas (see Table 16), all of which have automatic eligibility into the study. TABLE 15: CHI-SQUARE TEST OF INDEPENDENCE OF THE ‘AREA’ VARIABLE BETWEEN THE SELECTED INNOVCARE
PARTICIPANTS AND THE REMAINING ELIGIBLE POPULATION
Crosstab area by selected
selected
Total Not
selected INNOVCare participants
area Urban Count 72 84 156
% Within Selected .5 .7 .6
Rural Count 83 36 119
% Within Selected .5 .3 .4
Total Count 155 120 275
% Within Selected 1.0 1.0 1.0
Chi-Square Tests
Value df
Asymp. Sig. (2-Tailed)
Exact Sig. (2-Tailed)
Exact. Sig. (1-Tailed)
Pearson Chi-Square 15.279 a 1 .000 Continuity Correctionb 14.335 1 .000 Likelihood Ratio 15.536 1 .000 Fisher’s Exact Test .000 .000 Linear-by-Linear Association 15.223 1 .000 N of Valid Cases 275
a. 0 cells have expected counts less than 5. The minimal expected frequency is 51.93. b. Computed only for a 2X2 table.
TABLE 16: DISTRIBUTION OF TOTAL SAMPLE ACCORDING TO ‘NORO’ AND ‘AREA’
Crosstab noro by area
area
Total Urban Rural
noro NoRos patients Count 55 5 60
% Within noro 91,7% 8,3% 100%
External patients Count 101 114 215
% Within noro 47,0% 53,0% 100%
Total Count 156 119 275
% Within noro 56,7% 43,3% 100%
INNOVCare - Innovative Patient-Centred Approach for Social Care Provision to Complex Conditions
Technical note or random sampling and random allocation
- 18 -
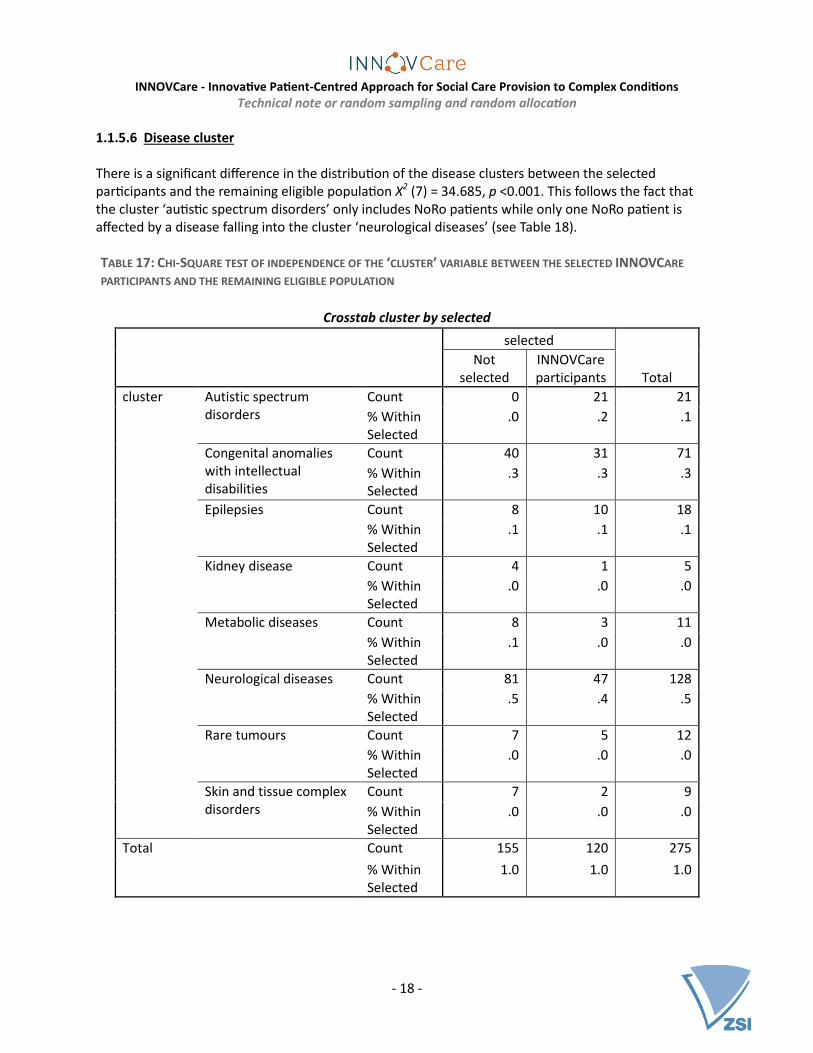
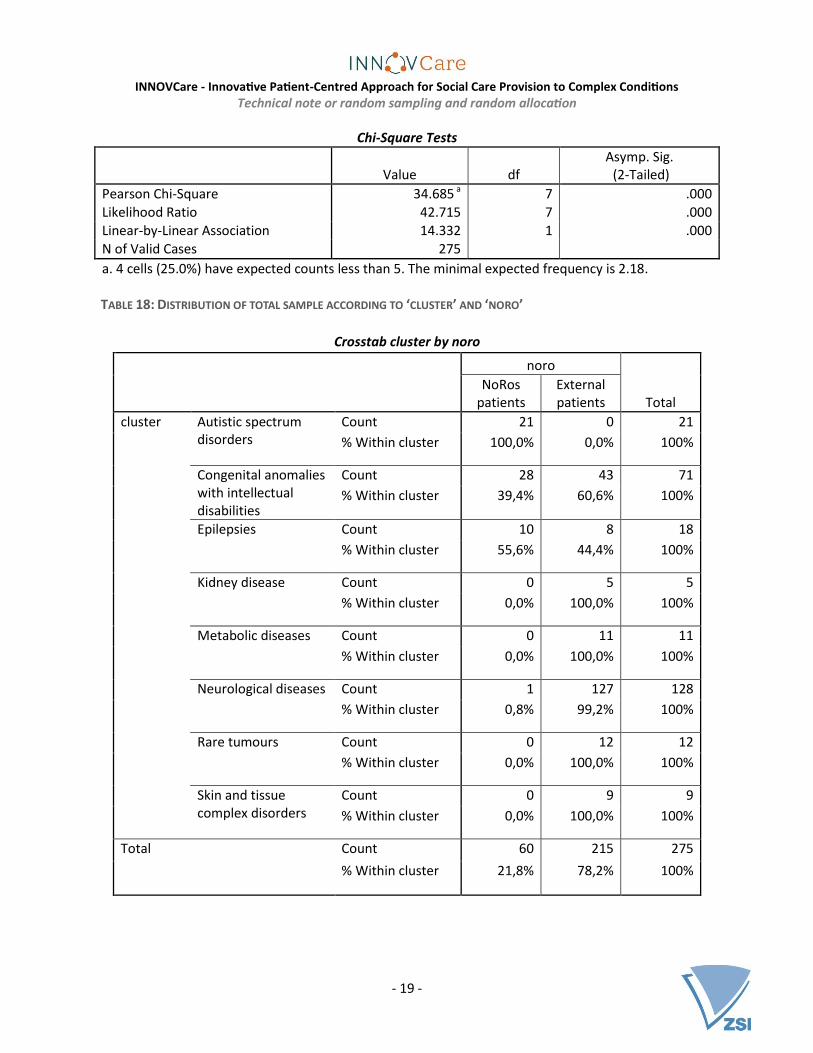
1.1.5.6 Disease cluster There is a significant difference in the distribution of the disease clusters between the selected participants and the remaining eligible population X2 (7) = 34.685, p <0.001. This follows the fact that the cluster ‘autistic spectrum disorders’ only includes NoRo patients while only one NoRo patient is affected by a disease falling into the cluster ‘neurological diseases’ (see Table 18). TABLE 17: CHI-SQUARE TEST OF INDEPENDENCE OF THE ‘CLUSTER’ VARIABLE BETWEEN THE SELECTED INNOVCARE
PARTICIPANTS AND THE REMAINING ELIGIBLE POPULATION
Crosstab cluster by selected
selected
Total Not
selected INNOVCare participants
cluster Autistic spectrum disorders
Count 0 21 21
% Within Selected
.0 .2 .1
Congenital anomalies with intellectual disabilities
Count 40 31 71
% Within Selected
.3 .3 .3
Epilepsies Count 8 10 18
% Within Selected
.1 .1 .1
Kidney disease Count 4 1 5
% Within Selected
.0 .0 .0
Metabolic diseases Count 8 3 11
% Within Selected
.1 .0 .0
Neurological diseases Count 81 47 128
% Within Selected
.5 .4 .5
Rare tumours Count 7 5 12
% Within Selected
.0 .0 .0
Skin and tissue complex disorders
Count 7 2 9
% Within Selected
.0 .0 .0
Total Count 155 120 275
% Within Selected
1.0 1.0 1.0
INNOVCare - Innovative Patient-Centred Approach for Social Care Provision to Complex Conditions
Technical note or random sampling and random allocation
- 19 -
Chi-Square Tests
Value df
Asymp. Sig. (2-Tailed)
Pearson Chi-Square 34.685 a 7 .000 Likelihood Ratio 42.715 7 .000
Linear-by-Linear Association 14.332 1 .000 N of Valid Cases 275
a. 4 cells (25.0%) have expected counts less than 5. The minimal expected frequency is 2.18. TABLE 18: DISTRIBUTION OF TOTAL SAMPLE ACCORDING TO ‘CLUSTER’ AND ‘NORO’
Crosstab cluster by noro
noro
Total NoRos
patients External patients
cluster Autistic spectrum disorders
Count 21 0 21
% Within cluster 100,0% 0,0% 100%
Congenital anomalies with intellectual disabilities
Count 28 43 71
% Within cluster 39,4% 60,6% 100%
Epilepsies Count 10 8 18
% Within cluster 55,6% 44,4% 100%
Kidney disease Count 0 5 5
% Within cluster 0,0% 100,0% 100%
Metabolic diseases Count 0 11 11
% Within cluster 0,0% 100,0% 100%
Neurological diseases Count 1 127 128
% Within cluster 0,8% 99,2% 100%
Rare tumours Count 0 12 12
% Within cluster 0,0% 100,0% 100%
Skin and tissue complex disorders
Count 0 9 9
% Within cluster 0,0% 100,0% 100%
Total Count 60 215 275
% Within cluster 21,8% 78,2% 100%

INNOVCare - Innovative Patient-Centred Approach for Social Care Provision to Complex Conditions
Technical note or random sampling and random allocation
- 20 -
1.1.5.7 Degree of disability
There is no significant difference in the distribution of the degree of disability of the participants between the selected participants and the remaining eligible population X2 (5) = 6.182, p =0.289. TABLE 19: CHI-SQUARE TEST OF INDEPENDENCE OF THE ‘DISABILITY’ VARIABLE BETWEEN THE SELECTED INNOVCARE
PARTICIPANTS AND THE REMAINING ELIGIBLE POPULATION
Crosstab disability * selected
selected
Total Not
selected INNOVCare participants
disability No disability Count 0 2 2
% Within Selected .0 .0 .0
Severe functional deficiency (without personal assistant)
Count 14 6 20
% Within Selected .1 .1 .1
Severe functional deficiency (with personal assistant)
Count 74 67 141
% Within Selected .5 .6 .5
Marked functional deficiency
Count 62 42 104
% Within Selected .4 .4 .4
Moderate functional deficiency
Count 4 3 7
% Within Selected .0 .0 .0
Mild functional deficiency
Count 1 0 1
% Within Selected .0 .0 .0
Total Count 155 120 275
% Within Selected 1.0 1.0 1.0
Chi-Square Tests
Value df
Asymp. Sig. (2-Tailed)
Pearson Chi-Square 6.182 a 5 .289
Likelihood Ratio 7.345 5 .196 Linear-by-Linear Association 1.680 1 .195 N of Valid Cases 275
a. 6 cells (60.0%) have expected counts less than 5. The minimal expected frequency is 0.44.

INNOVCare - Innovative Patient-Centred Approach for Social Care Provision to Complex Conditions
Technical note or random sampling and random allocation
- 21 -
In conclusion the selected participants and the remaining eligible population are balanced on all the available variables except from ‘noro’, ‘area’ and ‘disease cluster’ all of which are related to the fact that NoRo’s patients were not randomly selected and therefore shows selectivity in terms of the location of the participants and their type of disease.
2. RANDOM ALLOCATION
Randomisation is considered the ‘golden standard’ of experimental designs because it reduces the ‘plausibility of alternative explanations for observed effects’ (Shadish, et al., 2002, p. 247). The objective of randomisation is to ‘ensure that that the only systematic difference between the programme participants (treatment) and non-participants (control) is the presence of the programme’ (Aker, 2012, p. 6). This in essence means randomly assigning the participants to the experimental conditions; in INNOVCare’s case, to the first cohort and to the second cohort. Like in random sampling, here also each participant has an equal chance of being placed into any group. By the virtue that everyone recruited in the experiment will need to receive treatment because INNOVCare considers it unethical to withhold treatment from one group, randomisation here means that participants will randomly be assigned a time when they can access treatment: the first cohort will receive treatment during the first nine months while the second cohort will receive treatment during the following nine months of the pilot study (Glennerster & Takavarasha, 2013). Like in random sampling, the process of randomly allocating treatment to subjects can also take a number of shapes. Simple random assignment does not control for characteristics of the participants that could affect the outcome variable and can therefore suffer from ‘chance bias’; which is where the resulting groups are not balanced on important covariates or groups that are not evenly balanced. This is more so a problem for smaller samples of which INNOVCare falls into this category. The best way to solve this problem is using matched-pair or stratified random assignment. In matched-paired random assignment, units are matched on a list of important variables or even just one continuous variable. Each resulting unit in the pair is then randomly assigned to either the treatment group or to the control group (Glennerster & Takavarasha, 2013). It was initially thought of performing a matched-pair randomisation procedure to assign the participants to the two experimental conditions in INNOVCare’s pilot study, however in this case the limitations of such a randomisation design outweighed its benefits. Although this design has the advantage that it can control for multiple extraneous variables (through the matching variables), it can also be rendered unrewarding if the matching variables are not related to the outcome variable. Due to the complexity of topic under investigation in the INNOVCare pilot study, namely quality of life of rare disease patients; it would be very difficult to come up with matching variables from which the matching could be based. A good option would be to base the matching on the results of the pretest. However, this poses a threat to the recruitment process of the participants as they would need to be informed when they would receive treatment (which cohort they belong to) already at the first information session. Another reason, and in this case the main reason, for rejecting matched-pairing for this particular study is the argument presented by Glennerster & Takavarasha (2013). They argue that because in matched-paired randomisation, when one unit for whatever reason drops out of the study, then the matched unit in the pair also has to be removed from the analysis, is basically reacting

INNOVCare - Innovative Patient-Centred Approach for Social Care Provision to Complex Conditions
Technical note or random sampling and random allocation
- 22 -
to the effects of the intervention (which one shouldn’t do as the aim is to measure the effects of the intervention; positive or negative) and also interferes with the randomisation thus nullifying it.
All things considered, the randomisation of the INNOVCare pilot study participants will be implement using stratified random assignment technique; also commonly referred to as a ‘randomised block design’ (Verma, 2016, p. 6). This design produces balance, increases statistical power and enables sub-group analysis (Glennerster & Takavarasha, 2013, p. 154). Like in stratified random sampling, the total sample (n=120) will be divided into blocks or groups based on variables that are likely to affect the outcome of the experiment and then, a simple random sampling within the groups will then be carried out. After the assignment into the two cohorts the participants are randomly assigned to one of the four case managers using simple random assignment. 2.1 The procedure for the random allocation of participants into the 1st and 2nd cohorts
2.1.1 Identifying the blocking variables
The age and gender like in the stratified random sampling will be used in the stratification for random allocation. Additionally, the variables ‘noro’ (NoRo’s patient or external patient) and the variable ‘area’ (urban or rural) will be included in the stratification. The degree of disability as one of the stratification variables was ruled out after a consultation with the experts at NoRo who argued that this assignment often does not correspond to the reality of the patients. Furthermore the disease clusters were also excluded in this process because on one hand it is not certain to what extent this variable is related to the outcome variable, if at all and also the fact that it is divided into 8 levels which cannot be further compressed makes it impossible to have more than two participants in each stratum. Unlike in the random sampling where the age variable was divided into nine groups, for the random allocation, it was considered reasonable to compress this variable further into just three levels: Children (up to 17), adults in working age (17 to 64) and pensioners (65+). Ideally, each strata or block should be divisible by the randomisation cell; in INNOVCare’s pilot study the randomisation cell has two levels (experimental and control group or 1st and 2nd cohort). Glennerster & Takavarasha (2013) suggest that if there is risk of attrition, which is the loss of subjects during the experiment, each stratum should include at least twice the number of randomisation cells; in this case meaning a minimum of four cases per stratum. The blocking variables for INNOVCare’s randomisation of participants into the first and second cohort are as follows:
1. Type of patient (two levels: NoRo’s patients and external patients) 2. Age (three levels: Under 18, 18-64 and 65+) 3. Gender (two levels: Females and males) 4. Location of patients(two levels: Urban and rural) 5.
It was considered important to include the type of patient (NoRo’s patients or external patients) as the hypothesis is that NoRo’s patient are already exposed to many services some of which are very similar to the case management service that will be provided and as a result, the intervention may have a lower effect on them than on the external patients who are currently not under NoRo’s care.
INNOVCare - Innovative Patient-Centred Approach for Social Care Provision to Complex Conditions
Technical note or random sampling and random allocation
- 23 -
With regard to age, due to the fact that n=50 of NoRo’s patients (ca. 41.7% of the total sample) were under 18, including age as a blocking variable would ensure that the groups are balanced also in terms of age and that future analysis can be carried out based on these variables. Including gender as one of the blocking variables ensures that gender can, not only be taken into consideration in future alysis, but it also controls for any effects of gender on the outcome variable. There are many studies that show that females react differently to medication than males and considering that all the participants have a disease, this could have an impact on the variable of interest. Furthermore, there are also studies that show female and male patients are not always handled equally in different situations. The location has also been considered a relevant blocking variable because on one hand, patients living in urban areas are already overrepresented in the sample based on the fact that 91.7% of NoRo’s patients live in urban areas. On the other hand, the hypothesis is that those living in rural areas generally have lower access to services than those in urban areas and are thefore probably going to benefit more from the intervention than those patients living in urban areas. Table 20 below shows the number of cases in each stratum based on the four blocking variables above. The highlighted rows represents those strata with less than four cases. Those highlighted in a darker shade are strata containing just one case; those highlighted in a lighter shade contain two or three cases each.

INNOVCare - Innovative Patient-Centred Approach for Social Care Provision to Complex Conditions
Technical note or random sampling and random allocation
- 24 -
TABLE 20: DISTRIBUTION OF THE TOTAL SAMPLE (N=120) ACCORDING TO THE ‘RANDVAR’ (A COMBINATION OF THE
VARIABLES: ‘NORO’, ‘AGEGROUP2’, ‘SEX’ AND ‘AREA’)
Group randvar: A combination of the variables: ‘noro’, ‘agegroup2’, ‘sex’ and ‘area’ Frequency Percentage
1 noro = 1 (NoRos patients) agegroup2 = 1 (up to 17) sex = 1 (Female) area = 1 (Rural) 1 .8 2 noro = 1 (NoRos patients) agegroup2 = 1 (up to 17) sex = 1 (Female) area = 1 (Urban) 22 18.3 3 noro = 1 (NoRos patients) agegroup2 = 1 (up to 17) sex = 2 (Male) area = 2 (Rural) 3 2.5 4 noro = 1 (NoRos patients) agegroup2 = 1 (up to 17) sex = 2 (Male) area = 2 (Urban) 24 20.0 5 noro = 1 (NoRos patients) agegroup2 = 2 (18 to 64) sex = 1 (Female) area = 1 (Rural) 1 .8 6 noro = 1 (NoRos patients) agegroup2 = 2 (18 to 64) sex = 1 (Female) area = 1 (Urban) 8 6.7 7 noro = 1 (NoRos patients) agegroup2 = 2 (18 to 64) sex = 2 (Male) area = 2 (Urban) 1 .8 8 noro = 2 (External patients) agegroup2 = 1 (up to 17) sex = 1 (Female) area = 1 (Rural) 4 3.3 9 noro = 2 (External patients) agegroup2 = 1 (up to 17) sex = 2 (Male) area = 2 (Rural) 2 1.7 10 noro = 2 (External patients) agegroup2 = 1 (up to 17) sex = 2 (Male) area = 2 (Urban) 1 .8 11 noro = 2 (External patients) agegroup2 = 2 (18 to 64) sex = 1 (Female) area = 1 (Rural) 6 5.0 12 noro = 2 (External patients) agegroup2 = 2 (18 to 64) sex = 1 (Female) area = 1 (Urban) 15 12.5 13 noro = 2 (External patients) agegroup2 = 2 (18 to 64) sex = 2 (Male) area = 2 (Rural) 12 10.0 14 noro = 2 (External patients) agegroup2 = 2 (18 to 64) sex = 2 (Male) area = 2 (Urban) 7 5.8 15 noro = 2 (External patients) agegroup2 = 3 (65+) sex = 1 (Female) area = 1 (Rural) 5 4.2 16 noro = 2 (External patients) agegroup2 = 3 (65+) sex = 1 (Female) area = 1 (Urban) 3 2.5 17 noro = 2 (External patients) agegroup2 = 3 (65+) sex = 2 (Male) area = 2 (Rural) 2 1.7 18 noro = 2 (External patients) agegroup2 = 3 (65+) sex = 2 (Male) area = 2 (Urban) 3 2.5
Total 120 100
This distribution of cases according to the four blocking variables is also represented in the figure below. FIGURE 2: DEPICTION OF THE RANDOMISATION PROCEDURE IN A HIERARCHY DIAGRAM
Total sample (n=120)
NoRo's patients
Under 18
Female
Rural (n=1)
Urban (n=22)
Male
Rural (n=3)
Urban (n=24)
18 to 64
Female
Rural (n=1)
Urban (n=8)
Male
Rural (n=0)
Urban (n=1)
External patients
Under 18
Female
Rural (n=4)
Urban (n=0)
Male
Rural (n=2)
Urban (n=1)
18 to 64
Female
Rural (n=6)
Urban (n=15)
Male
Rural (n=12)
Urban (n=7)
65+
Female
Rural (n=5)
Urban (n=3)
Male
Rural (n=2)
Urban (n=3)

INNOVCare - Innovative Patient-Centred Approach for Social Care Provision to Complex Conditions
Technical note or random sampling and random allocation
- 25 -
2.1.2 Running the random allocation
2.1.2.1 Step 1: Splitting the dataset according ‘randvar’ The dataset with the 120 selected particants was divided according to the strata with more than one case each. Each of the files was saved as ‘group+”randvar”’ for example 2randvar.sav containing 22 female participants of NoRo, of up to 17 years of age and living in urban areas. The four strata with one case each were then combined into one data file and named in the same way; in this case ‘15710randvar.sav’ for easy identification. In total the dataset with n=120 was divided into 15 different files. 2.1.2.2 Step 2: Random allocation As a next step each file was retrieved and a new completely random variable was computed. Each case in the dataset was assigned a random number between o and 1000. Due to the small sample size assigning values between 0 to 1000 reduces the chances of duplication of the random numbers. The file was then sorted according to the random numbers. In cases where the total number of cases in a stratum was a multiple of two, the first half of the cases were assigned to the 1st cohort while the second half were assigned to the 2nd cohort by generating a new variable called ‘group’. Below, Table 21 details how the data was further split especially for those strata that didn’t have cases in multiples of two. TABLE 21: ALLOCATION OF PARTICIPANTS IN EACH STRATUM INTO THE 1ST
AND 2ND COHORT
Value randvar: A combination of the variables: ‘noro’, ‘agegroup2’, ‘sex’ and ‘area’ n
in stratum 1st
cohort 2nd
cohort
2 noro = 1 (NoRos patients) agegroup2 = 1 (up to 17) sex = 1 (Female) area = 1 (Urban) 22 11 11
3 noro = 1 (NoRos patients) agegroup2 = 1 (up to 17) sex = 2 (Male) area = 2 (Rural) 3 2 1
4 noro = 1 (NoRos patients) agegroup2 = 1 (up to 17) sex = 2 (Male) area = 2 (Urban) 24 12 12
6 noro = 1 (NoRos patients) agegroup2 = 2 (18 to 64) sex = 1 (Female) area = 1 (Urban) 8 4 4
8 noro = 2 (External patients) agegroup2 = 1 (up to 17) sex = 1 (Female) area = 1 (Rural) 4 2 2
9 noro = 2 (External patients) agegroup2 = 1 (up to 17) sex = 2 (Male) area = 2 (Rural) 2 1 1
11 noro = 2 (External patients) agegroup2 = 2 (18 to 64) sex = 1 (Female) area = 1 (Rural) 6 3 3
12 noro = 2 (External patients) agegroup2 = 2 (18 to 64) sex = 1 (Female) area = 1 (Urban) 15 7 8
13 noro = 2 (External patients) agegroup2 = 2 (18 to 64) sex = 2 (Male) area = 2 (Rural) 12 6 6
14 noro = 2 (External patients) agegroup2 = 2 (18 to 64) sex = 2 (Male) area = 2 (Urban) 7 4 3
15 noro = 2 (External patients) agegroup2 = 3 (65+) sex = 1 (Female) area = 1 (Rural) 5 2 3
16 noro = 2 (External patients) agegroup2 = 3 (65+) sex = 1 (Female) area = 1 (Urban) 3 2 1
17 noro = 2 (External patients) agegroup2 = 3 (65+) sex = 2 (Male) area = 2 (Rural) 2 1 1
18 noro = 2 (External patients) agegroup2 = 3 (65+) sex = 2 (Male) area = 2 (Urban) 3 1 2
15710 Combination of stratum 1, 5, 7 and 10 4 2 2
Total 120 60 60

INNOVCare - Innovative Patient-Centred Approach for Social Care Provision to Complex Conditions
Technical note or random sampling and random allocation
- 26 -
Before saving, each file was sorted in ascending order according to code to ease merging of the files in the next step. 2.1.2.3 Step 3: Merging the different strata with allocated participants As a final step, all the 15 files containing the different strata with the cases allocated to either the 1st cohort or the 2nd cohort were merged. 2.1.2.4 Step 4: Randomly assigning the participants to the case managers In total, four case managers will work with the participants. For every period, each case manager should be responsible for taking care and supporting 15 patients and their families. As a result, after merging the files (in the step above), each participant was assigned a random number from 0 to 1000. The cases were then sorted according to ‘group’ (1st or 2nd cohort) and the random number. For the first chort, the first 15 cases were assigned to ‘case manager 1’, the second 15 cases to ‘case manager2’ the third to ‘case manager 3’ and the last 15 cases to ‘case manger 4’. The same process was repeted for the 2nd cohort. This means that in each phase, each case manager will be resposible for 15 participants and their families; during the whole intervention duration, this means 30 participants and their families per case manager. A quick check was made to see of the two siblings ‘int5’ and ‘int6’ were assigned to the same case manager which revealed that they were randomly assigned to the same case manager. A list with the 120 participants including the participant code, group and case managers were generated and sent to NoRo for recruitment.
2.1.3 Ex-post assessment of the randomisation procedure
2.1.3.1 Age
On average, the 2nd cohort has a slightly higher mean age (M=32.42, SE=3.208) than the 1st cohort (M=30.40, SE=3.178). This difference of -2.017, 95% CI [-10.958, 6.925] was not significant t(118) = -0.447, p =.656 meaning that there is no statistically significant difference in the ages of the two groups.
TABLE 22: INDEPENDENT T-TEST OF THE AGE VARIABLE ON THE ‘GROUP’ VARIABLE (1ST
COHORT VS. 2ND COHORT)
Group Statistics
group N Mean
Standard deviation
Standard error of
the mean
age 1st cohort 60 30.40 24.613 3.178
2nd cohort 60 32.42 24.849 3.208

INNOVCare - Innovative Patient-Centred Approach for Social Care Provision to Complex Conditions
Technical note or random sampling and random allocation
- 27 -
Independent Samples Test
Levene-Test for Equality of Variances T-Test for equality of means
F Significance T df Sig. (2-tailed)
Mean difference
Standard error of
the difference
95% Confidence interval of the
difference
Lower Upper
age Variance is equal
.006 .940 -.447 118 .656 -2.017 4.515 -10.958 6.925
Variance is not equal
-.447 117.989 .656 -2.017 4.515 -10.958 6.925
2.1.3.2 Age group (children, adults in working age and pensioners) There is no significant difference in the distribution of the age groups (children, adults in working age and pensioners) between the 1st cohort and the 2nd cohorts X2 (2) = 0.315, p =0.854. TABLE 23: CHI-SQUARE TEST OF INDEPENDENCE OF THE ‘AGEGROUP2’ VARIABLE BETWEEN THE 1ST
AND 2ND COHORTS
Crosstab agegroup2 by group
group
Total 1st cohort 2nd cohort
agegroup2 Under 18 Count 30 27 57
% within group .5 .5 .5
18 to 64 Count 24 26 50
% within group .4 .4 .4
65+ Count 6 7 13
% within group .1 .1 .1
Total Count 60 60 120
% within group 1.0 1.0 1.0
Chi-Square Tests
Value df
Asymp. Sig. (2-Tailed)
Pearson Chi-Square .315 2 .854
Likelihood Ratio .315 2 .854
Linear-by-Linear Association .295 1 .587
N of Valid Cases 120
a. 0 cells have expected counts less than 5. The minimal expected frequency is 6.5

INNOVCare - Innovative Patient-Centred Approach for Social Care Provision to Complex Conditions
Technical note or random sampling and random allocation
- 28 -
2.1.3.3 Type of patient There is no significant difference in the distribution of the type of patient (NoRo’s patients or external patients) between the 1st cohort and the 2nd cohorts X2 (1) = 0, p =1.0. TABLE 24: CHI-SQUARE TEST OF INDEPENDENCE OF THE ‘NORO’ VARIABLE BETWEEN THE 1ST
AND 2ND COHORTS
Crosstab noro by group
group
Total 1st cohort 2nd cohort
noro NoRos patients
Count 30 30 60
% Within group
.5 .5 .5
External patients
Count 30 30 60
% Within group
.5 .5 .5
Total Count 60 60 120
% Within group
1.0 1.0 1.0
Chi-Square Tests
Value df
Asymp. Sig. (2-Tailed)
Exact Sig. (2-Tailed)
Exact. Sig. (1-Tailed)
Pearson Chi-Square .000a 1 1.000 Continuity Correctionb .000 1 1.000 Likelihood Ratio .000 1 1.000 Fisher’s Exact Test 1.000 .572 Linear-by-Linear Association .000 1 1.000 N of Valid Cases 120
a. 0 cells have expected counts less than 5. The minimal expected frequency is 6.5. b. Computed only for a 2X2 table.

INNOVCare - Innovative Patient-Centred Approach for Social Care Provision to Complex Conditions
Technical note or random sampling and random allocation
- 29 -
2.1.3.4 Gender There is no significant difference in the distribution of the gender between the 1st cohort and the 2nd cohorts X2 (1) = 0.34, p =0.855. TABLE 25: CHI-SQUARE TEST OF INDEPENDENCE OF THE ‘SEX’ VARIABLE BETWEEN THE 1ST
AND 2ND COHORTS
Crosstab sex by group
group
Total 1st cohort 2nd cohort
sex Female Count 32 33 65
% Within group
.5 .6 .5
Male Count 28 27 55
% Within group
.5 .5 .5
Total Count 60 60 120
% Within group
1.0 1.0 1.0
Chi-Quadrat-Tests
Value df
Asymp. Sig. (2-Tailed)
Exact Sig. (2-Tailed)
Exact. Sig. (1-Tailed)
Pearson Chi-Square .034a 1 .855
Continuity Correctionb .000 1 1.000 Likelihood Ratio .034 1 .855 Fisher’s Exact Test 1.000 .500 Linear-by-Linear Association
.033 1 .855
N of Valid Cases 120
a. 0 cells have expected counts less than 5. The minimal expected frequency is 27.5. b. Computed only for a 2X2 table.

INNOVCare - Innovative Patient-Centred Approach for Social Care Provision to Complex Conditions
Technical note or random sampling and random allocation
- 30 -
2.1.3.5 Area
There is no significant difference in the distribution of the area (urban or rural) that the participants live between the 1st cohort and the 2nd cohorts X2 (1) = 0.000, p =1.0. TABLE 26: CHI-SQUARE TEST OF INDEPENDENCE OF THE ‘AREA’ VARIABLE BETWEEN THE 1ST
AND 2ND COHORTS
Crosstab area by group
group
Total 1st cohort 2nd cohort
area Urban Count 42 42 84
% Within group
.7 .7 .7
Rural Count 18 18 36
% Within group
.3 .3 .3
Total Count 60 60 120
% Within group
1.0 1.0 1.0
Chi-Square Tests
Value df
Asymp. Sig. (2-Tailed)
Exact Sig. (2-Tailed)
Exact. Sig. (1-Tailed)
Pearson Chi-Square .000a 1 1.000
Continuity Correctionb .000 1 1.000
Likelihood Ratio .000 1 1.000
Fisher’s Exact Test 1.000 .579
Linear-by-Linear Association .000 1 1.000
N of Valid Cases 120
a. 0 cells have expected counts less than 5. The minimal expected frequency is 18.00. b. Computed only for a 2X2 table.

INNOVCare - Innovative Patient-Centred Approach for Social Care Provision to Complex Conditions
Technical note or random sampling and random allocation
- 31 -
2.1.3.6 Disease cluster There is no significant difference in the distribution of the disease clusters between the 1st cohort and the 2nd cohorts X2 (7) = 3.552, p =0.830. TABLE 27: CHI-SQUARE TEST OF INDEPENDENCE OF THE ‘CLUSTER’ VARIABLE BETWEEN 1ST
AND 2ND COHORTS
Crosstab cluster by group
group
Total 1st cohort 2nd
cohort
cluster Autistic spectrum disorders Count 8 13 21
% Within group .1 .2 .2
Congenital anomalies with intellectual disabilities
Count 18 13 31
% Within group .3 .2 .3
Epilepsies Count 5 5 10
% Within group .1 .1 .1
Kidney disease Count 0 1 1
% Within group .0 .0 .0
Metabolic diseases Count 2 1 3
% Within group .0 .0 .0
Neurological diseases Count 23 24 47
% Within group .4 .4 .4
Rare tumours Count 3 2 5
% Within group .1 .0 .0
Skin and tissue complex disorders
Count 1 1 2
% Within group .0 .0 .0
Total Count 60 60 120
% Within group 1.0 1.0 1.0
Chi-Square Tests
Value df
Asymp. Sig. (2-Tailed)
Pearson Chi-Square 3.552a 7 .830
Likelihood Ratio 3.961 7 .784
Linear-by-Linear Association .082 1 .774
N of Valid Cases 120
a. 8 cells (50.0%) have expected counts less than 5. The minimal expected frequency is 0.5.
INNOVCare - Innovative Patient-Centred Approach for Social Care Provision to Complex Conditions
Technical note or random sampling and random allocation
- 32 -
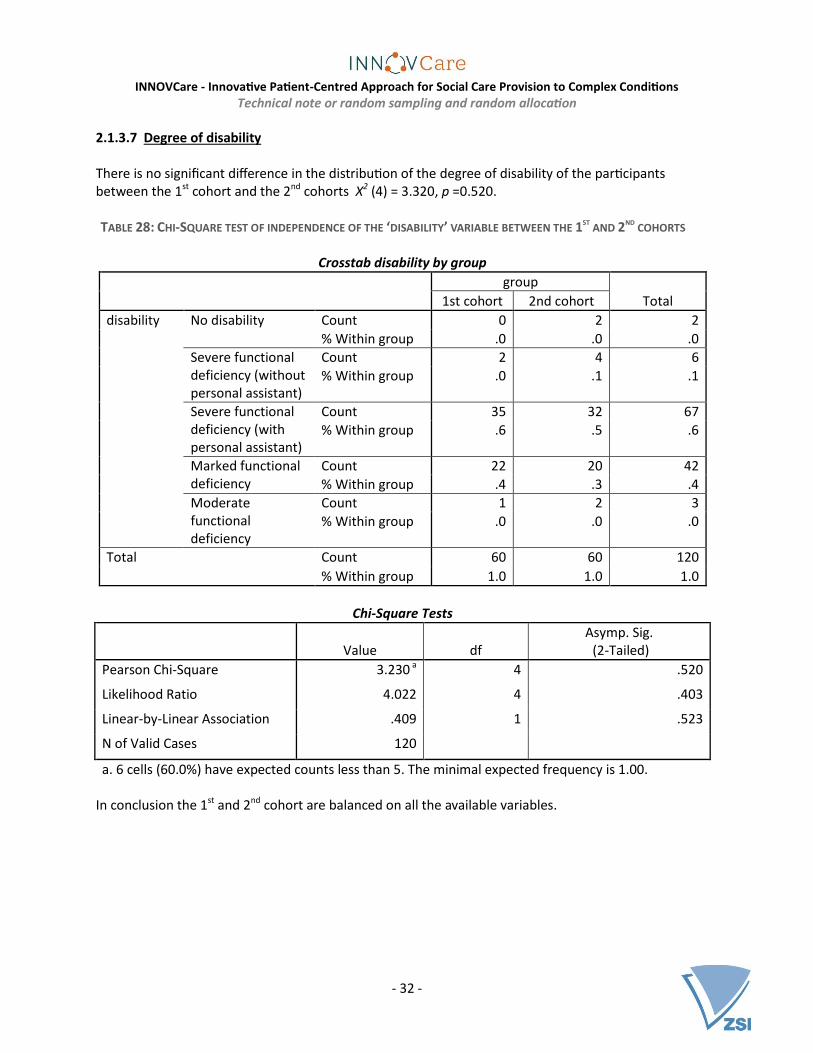
2.1.3.7 Degree of disability
There is no significant difference in the distribution of the degree of disability of the participants between the 1st cohort and the 2nd cohorts X2 (4) = 3.320, p =0.520. TABLE 28: CHI-SQUARE TEST OF INDEPENDENCE OF THE ‘DISABILITY’ VARIABLE BETWEEN THE 1ST
AND 2ND COHORTS
Crosstab disability by group
group
Total 1st cohort 2nd cohort
disability No disability Count 0 2 2
% Within group .0 .0 .0
Severe functional deficiency (without personal assistant)
Count 2 4 6
% Within group .0 .1 .1
Severe functional deficiency (with personal assistant)
Count 35 32 67
% Within group .6 .5 .6
Marked functional deficiency
Count 22 20 42
% Within group .4 .3 .4
Moderate functional deficiency
Count 1 2 3
% Within group .0 .0 .0
Total Count 60 60 120
% Within group 1.0 1.0 1.0
Chi-Square Tests
Value df
Asymp. Sig. (2-Tailed)
Pearson Chi-Square 3.230 a 4 .520
Likelihood Ratio 4.022 4 .403
Linear-by-Linear Association .409 1 .523
N of Valid Cases 120
a. 6 cells (60.0%) have expected counts less than 5. The minimal expected frequency is 1.00. In conclusion the 1st and 2nd cohort are balanced on all the available variables.

INNOVCare - Innovative Patient-Centred Approach for Social Care Provision to Complex Conditions
Technical note or random sampling and random allocation
- 33 -
3. 2nd selection and random allocation As of April 2017 a couple of weeks after the start of the INNOVCare pilot, it was ascertained that 25 of the selected participants (n=22 external and n=3 existing patients of NoRo) could not or did not want to participate in the pilot for a number of reasons. These reasons included: Lack of motivation (n=11); declaration that ‘they are too old to be helped’ (n=3), relocation – i.e. no longer living in the county of Salaj (n=5); preference to concentrate to medical services (n=3), declaration that ‘they can only be helped by God’ (n=2) and death (n=1). In order to ensure that the study had enough participants to be able to detect changes caused by the intervention, but also based on ethical considerations; that it would be unethical to include 25 participants less in the study although resources to support them were available and considering that the intervention had just kicked off, the project consortium decided to select 25 new participants from the study to ‘replace’ the 25 non-takers. Like with the first selection, this selection included both random and non-random elements. 10 of the 25 participants were predefined for the following reasons:
1. In the meantime, NoRo had some new beneficiaries and it was felt that they too (like the automatically eligible participants in the first selection) needed to be included in the pilot (n=6: int61 to int66)
2. Some former beneficiaries of NoRo heard about the project and wanted to participate. NoRo felt that these participants due to their affiliation to the organisation and especially due to their prioir inclusion in the youth programme – independent living skills needed to be included in the second selection to support them further in their quest of living independently: ext216 and ext217
3. From the initially selected participants who agreed to participate in the study (n=95), there were some cases that were related, however, this information was not available at the time of selection. It was felt that it would be unfair if the family members would be excluded from the study. As a result, two external persons were automatically included in the second selection (ext127 and ext183)
Other than these predetermination of the 10 participants, there was also a necessity in one case to reassign the cohort of one participant (int034) because s/he would be unavailable in the second phase of the project. In a number of cases it was also deemed necessary to to reassign the case managers:
1. Ext057 had to be reassigned to case manager 4, the only Hungaria-speaking case manager, to facilitate communication
2. Due to conflict of interest int0020 also needed to be reallocated
The two family members decribed in point 3 above, also had to be allocated the same case managers as their family members.

INNOVCare - Innovative Patient-Centred Approach for Social Care Provision to Complex Conditions
Technical note or random sampling and random allocation
- 34 -
3.1 Procedure for the 2nd selection
The 8 new cases (6 new NoRo beneficiaries and 2 former NoRo beneficiaries) who were not yet listed in list of total eligible sample were added. TABLE 29: NEW TOTAL SAMPLE (AS OF APRIL 2017)
Number of participants
External 215 (this includes the 2 family members) Former NoRo beneficiaries (now external) 2 Current NoRo beneficiaries 66
Total 283
A new variable to identify the non-takers was added. TABLE 30: DISTRIBUTION OF NEW TOTAL SAMPLE ACCORDING TO PARTICIPATION IN PILOT
Frequency Percentage
Remaining eligible population 153 54.1
NoRo - initially selected and consented 57 20.1
NoRo - initially selected but non-takers 3 1.1
New NoRo beneficiaries (automatically eligible) 6 2.1
Former NoRo beneficiaries (automatically eligible) 2 0.7
External - initially selected and consented 38 13.4
External - initially selected but non-takers 22 7.8
External - initally NOT selected by family members of selected (automatically eligible)
2 0.7
Total 283 100
To determine the replacements of the non-takers, maintaining the representativeness of the sample was of high importance. In the first selection this was ensured largely by the proportionate stratified random sampling used to select the external participants. As a result, it was decided to select the 15 not automatically eligible non-takers by their ‘twin’ or participant most similar to them from the remaining eligible population. Considering that the pilot had just started, this was regarded the best options as the chances of the sample being corrupted were very low. As a result, the dataset was sorted according to ‘agegroup’ (see Table 1), ‘sex’ and ‘nontakers’ (in descending order). A new variable ‘replace’ was created in that for every case, if the previous case is a non-taker, has the same sex and is in the same age group, then it is considered a possible replacement. In total, from the remaining eligible population, n=123 were considered as possible replacements (see Table 31 below):

INNOVCare - Innovative Patient-Centred Approach for Social Care Provision to Complex Conditions
Technical note or random sampling and random allocation
- 35 -
TABLE 31: POSSIBLE REPLACEMENTS OF THE NON-TAKERS ACCORDING TO ‘AGEGROUP’ AND ‘SEX’
sex
Total Female Male
Excluded - first 120 and
new automatically
eligible
agegroup
up to 3 4 5 9
4 to 7 9 10 19
8 to 17 16 17 33
18 to 24 3 2 5
25 to 34 9 2 11
35 to 44 5 4 9
45 to 54 6 5 11
55 to 64 11 9 20
65+ 8 5 13
Total 71 59 130
Possible replacements agegroup
up to 3 5 0 5
4 to 7 14 0 14
8 to 17 0 23 23
18 to 24 0 3 3
25 to 34 6 3 9
35 to 44 7 5 12
45 to 54 8 4 12
55 to 64 14 12 26
65+ 11 7 18
Total 65 57 122
Excluded - not possible
matches to non-takers
agegroup
up to 3 0 5 5
4 to 7 0 7 7
8 to 17 17 0 17
18 to 24 2 0 2
Total 19 12 31
The next step was to check where the non-takers as well as the automatically eligible cases fell with respect to the stratifying variables: agegroup and sex in order to be to calculate how many participants in each strata need to be selected (see Table 32).

INNOVCare - Innovative Patient-Centred Approach for Social Care Provision to Complex Conditions
Technical note or random sampling and random allocation
- 36 -
TABLE 32: DISTRIBUTION OF NON-TAKERS AND AUTOMATICALLY ELIGIBLE CASES BY ‘AGEGROUP’ AND ‘SEX’ AND AS A
RESULT, THE NUMBER OF CASES TO BE SELECTED BY ‘AGEGROUP’ AND ‘SEX’
Female Male
Non-takers Automatically
eligible To sample Non-takers Automatically
eligible To
sample
agegroup up to 3 2 0 2 0 1 -1
4 to 7 1 1 0 0 0 0
8 to 17 0 1 -1 1 1 0
18 to 24 0 1 -1 1 0 1
25 to 34 1 3 -2 1 1 0
35 to 44 2 0 2 1 0 1
45 to 54 2 0 2 1 1 0
55 to 64 3 0 3 3 0 3
65+ 4 0 4 2 0 2
Total 15 6 9 10 4 6
As can be seenin Table 32 above, some of the automatically eligible participants fell into strata where there were no non-takers; for example there was one female participant between the ages of 8 and 17 who was automatically eligible; however, there were no non-takers with the same profile. Following this, it was impossible to exactly mirror the new selection with the non-takers, however this was done in the closest possible way (see Table 33 below): TABLE 33: NUMBER OF CASES PER STRATUM SAMPLED
Female Male
Non-takers
Automatically eligible
To sample
Sample to be drawn
Non-takers
Automatically eligible
To sample
Sample to be drawn
agegroup up to 3 2 0 2 0 0 1 -1 0
4 to 7 1 1 0 0 0 0 0 0
8 to 17 0 1 -1 0 1 1 0 0
18 to 24 0 1 -1 0 1 0 1 1
25 to 34 1 3 -2 0 1 1 0 0
35 to 44 2 0 2 2 1 0 1 1
45 to 54 2 0 2 2 1 1 0 0
55 to 64 3 0 3 3 3 0 3 3
65+ 4 0 4 2 2 0 2 1
Total 15 6 9 9 10 4 6 6

INNOVCare - Innovative Patient-Centred Approach for Social Care Provision to Complex Conditions
Technical note or random sampling and random allocation
- 37 -
As a next step a new stratifying varibale ‘combo’ was computed using the following formula: combo=100*sex+10*agegroup+replacement (‘sex’ took the values 1 for female and 2 for male; ‘agegroup’ ran from 1 [up to 3] to 9 [65+] and ‘replacement’ took the values of 0 [excluded due to being selected in first selection], 1 [possible replacements] and 2 [excluded due to not being possible matches to non-takers]). Then a completely random variable was computed and this variable was then ranked within the groups created by the variable ‘combo’. From each group or strata within the variable combo, the desired number of cases were then drawn (seeTable 34 below). TABLE 34: DEMONSTRATION OF THE ‘COMBO’ VARIABLE (MISSING THE CODES FOR ‘REPLACEMENT’: 0 AND 2)
Female [1] Male [2]
Combo variable for replacement
[1]: potential replacements
Sample to be drawn
Combo variable for
replacement [1]: potential
replacements Sample to be drawn
agegroup up to 3 [1] 111 0 211 0
4 to 7 [2] 121 0 221 0
8 to 17 [3] 131 0 231 0
18 to 24 [4] 141 0 241 1
25 to 34 [5] 151 0 251 0
35 to 44 [6] 161 2 261 1
45 to 54 [7] 171 2 271 0
55 to 64 [8] 181 3 281 3
65+ [9] 191 2 291 1
After this process, the new sample which includes the participants from the first selection that consented n=95 (n=120-n=25) and the new n=10 participants that were automatically eligible for the second selection as well as the n=15 randomly sampled in the second selection were checked for representativeness of the entire population of rare and complex disease patients in the county of Salaj.
3.1.1 Checking the representativeness of the sample
On the basis of the available variables (age, age group, gender, degree of disability, disease cluster and area), the new sample was checked for its representativeness of the whole population.

INNOVCare - Innovative Patient-Centred Approach for Social Care Provision to Complex Conditions
Technical note or random sampling and random allocation
- 38 -
3.1.1.1 Age
The new total sample selected has a lower mean (M=30.14, SE=2.138) than the remaining eligible population (M=31.96, SE=1.962). This difference of 1.822, 95% CI [-3.949, 7.592] was not significant t(281) = 0.621, p =.535 meaning that there is no statistically significant difference in the age distribution of the two groups. TABLE 35: INDEPENDENT T-TEST OF THE AGE VARIABLE ON THE ‘SELECTED’ VARIABLE (NEW COMPOSITION OF
INNOVCARE PARTICIPANTS VS. REMAINING ELIGIBLE POPULATION)
Group Statistics
New sample
N Mean
Standard
deviation
Standard error
of the mean
age Remaining
population
162 31.97 25.122 1.974
INNOVCare
participants
121 30.15 23.326 2.121
Independent Samples Test
Levene’s Test for
Equality of Variances T-Test for equality of means
F Significance T df
Sig. (2-
tailed)
Mean
difference
Standard
error of
the
difference
95% Confidence
interval of the
difference
Lower Upper
age Variances are equal 2.002 .158 .622 281 .535 1.820 2.928 -3.944 7.585
Variances are not equal
.628 268.0
42
.530 1.820 2.897 -3.883 7.524
3.1.1.2 Age group There is no significant difference in the distribution of the age groups between the selected participants and the remaining eligible population X2 (8) = 2.045, p =0.980.
TABLE 36: CHI-SQUARE TEST OF INDEPENDENCE OF THE ‘AGEGROUP’ VARIABLE BETWEEN THE NEW COMPOSITION OF
INNOVCARE PARTICIPANTS AND THE REMAINING ELIGIBLE POPULATION
Crosstab agegroup by newsample

INNOVCare - Innovative Patient-Centred Approach for Social Care Provision to Complex Conditions
Technical note or random sampling and random allocation
- 39 -
New sample
Total
Remaining
population
INNOVCare
participants
agegroup up to 3 Count 12 7 19
% Within New sample 7.4% 5.8% 6.7%
4 to 7 Count 22 18 40
% Within New sample 13.6% 14.9% 14.1%
8 to 17 Count 41 32 73
% Within New sample 25.3% 26.4% 25.8%
18 to 24 Count 5 5 10
% Within New sample 3.1% 4.1% 3.5%
25 to 34 Count 10 10 20
% Within New sample 6.2% 8.3% 7.1%
35 to 44 Count 12 9 21
% Within New sample 7.4% 7.4% 7.4%
45 to 54 Count 13 10 23
% Within New sample 8.0% 8.3% 8.1%
55 to 64 Count 26 20 46
% Within New sample 16.0% 16.5% 16.3%
65+ Count 21 10 31
% Within New sample 13.0% 8.3% 11.0%
Total Count 162 121 283
% Within New sample 100.0% 100.0% 100.0%

INNOVCare - Innovative Patient-Centred Approach for Social Care Provision to Complex Conditions
Technical note or random sampling and random allocation
- 40 -
Chi-Square Tests
Value df
Asymp. Sig.
(2-Tailed)
Pearson Chi-Square 2.442a 8 .964
Likelihood-Ratio 2.480 8 .963
Linear-by-Linear
Association
.303 1 .582
N of Valid Cases 283
3.1.1.3 Type of patient There is a significant difference in the distribution of the type of patient (NoRo’s patients, former NoRo patients and external patients) between the new composition of the INNOVcare pilot participants and the remaining eligible population X2 (2) = 103.685, p <0.0001. This is clear because all NoRo and fomer NoRo patients are automatically eligible and are included in the sample. The remaining eligible population does not include any NoRo patients. TABLE 37: CHI-SQUARE TEST OF INDEPENDENCE OF THE ‘NORO’ VARIABLE BETWEEN THE NEW COMPOSITION OF
INNOVCARE PARTICIPANTS AND THE REMAINING ELIGIBLE POPULATION
Crosstab noro by newsample
New sample
Total
Remaining
population
INNOVCare
participants
noro NoRo
patients
Count 3 65 68
% Within New sample 1.9% 53.7% 24.0%
External
patients
Count 159 56 215
% Within New sample 98.1% 46.3% 76.0%
Total Count 162 121 283
% Within New sample 100.0% 100.0% 100.0%
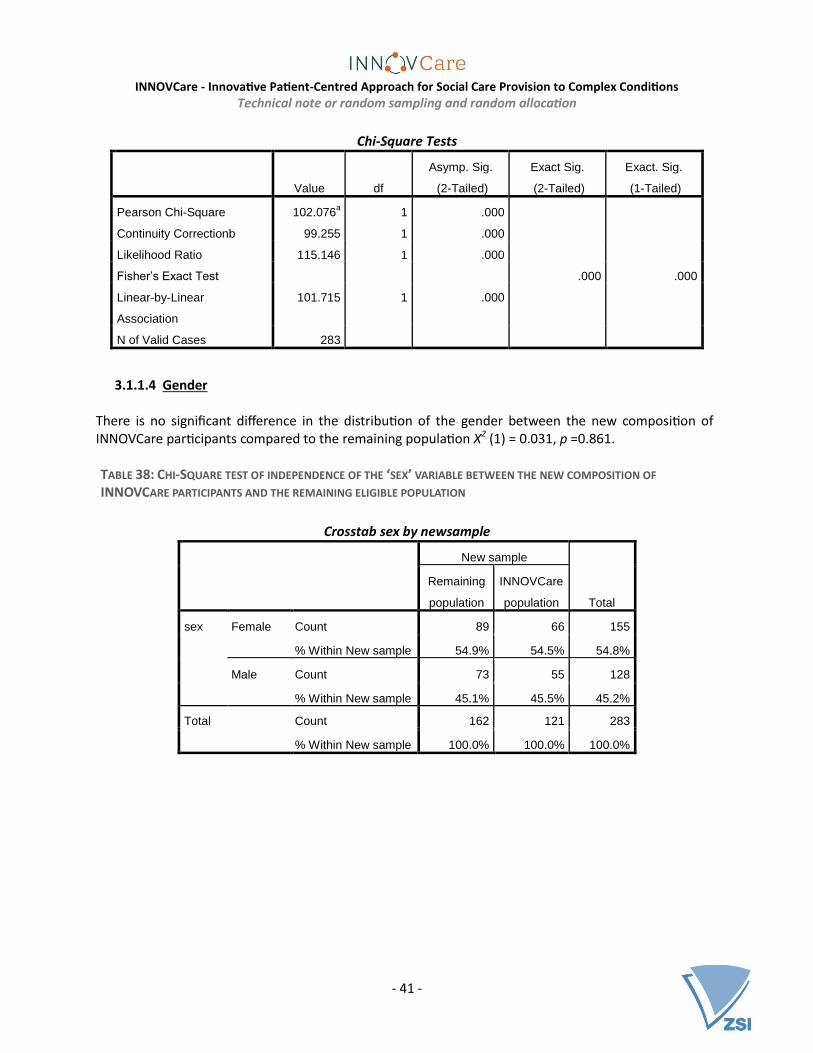
INNOVCare - Innovative Patient-Centred Approach for Social Care Provision to Complex Conditions
Technical note or random sampling and random allocation
- 41 -
Chi-Square Tests
Value df
Asymp. Sig.
(2-Tailed)
Exact Sig.
(2-Tailed)
Exact. Sig.
(1-Tailed)
Pearson Chi-Square 102.076a 1 .000
Continuity Correctionb 99.255 1 .000
Likelihood Ratio 115.146 1 .000
Fisher’s Exact Test .000 .000
Linear-by-Linear
Association
101.715 1 .000
N of Valid Cases 283
3.1.1.4 Gender
There is no significant difference in the distribution of the gender between the new composition of INNOVCare participants compared to the remaining population X2 (1) = 0.031, p =0.861. TABLE 38: CHI-SQUARE TEST OF INDEPENDENCE OF THE ‘SEX’ VARIABLE BETWEEN THE NEW COMPOSITION OF
INNOVCARE PARTICIPANTS AND THE REMAINING ELIGIBLE POPULATION
Crosstab sex by newsample
New sample
Total
Remaining
population
INNOVCare
population
sex Female Count 89 66 155
% Within New sample 54.9% 54.5% 54.8%
Male Count 73 55 128
% Within New sample 45.1% 45.5% 45.2%
Total Count 162 121 283
% Within New sample 100.0% 100.0% 100.0%

INNOVCare - Innovative Patient-Centred Approach for Social Care Provision to Complex Conditions
Technical note or random sampling and random allocation
- 42 -
Chi-Square Tests
Value df
Asymp. Sig.
(2-Tailed)
Exact Sig.
(2-Tailed)
Exact. Sig.
(1-Tailed)
Pearson Chi-Square .004a 1 .948
Continuity Correction .000 1 1.000
Likelihood Ratio .004 1 .948
Fisher’s Exact Test 1.000 .522
Linear-by-Linear
Association
.004 1 .948
N of Valid Cases 283
3.1.1.5 Area
There is a significant difference in the distribution of the area where the participants live between the new composition of INNOVCare participants and the remaining population X2 (1) = 18.946, p =<0.001. The significant difference of this variable between the two groups is as a result of the fact that about 91.7% of NoRo’s patients live in urban areas (see Table 16), all of which have automatic eligibility into the study. TABLE 39: CHI-SQUARE TEST OF INDEPENDENCE OF THE ‘AREA’ VARIABLE BETWEEN THE NEW COMPOSITION OF
INNOVCARE PARTICIPANTS AND THE REMAINING ELIGIBLE POPULATION
Crosstab area by newsample
newsample
Total
Remaining
population
INNOVCare
participants
area Urban Count 76 87 163
% Within New sample 46.9% 71.9% 57.6%
Rural Count 86 34 120
% Within New sample 53.1% 28.1% 42.4%
Total Count 162 121 283
% Within New sample 100.0% 100.0% 100.0%

INNOVCare - Innovative Patient-Centred Approach for Social Care Provision to Complex Conditions
Technical note or random sampling and random allocation
- 43 -
Chi-Square Tests
Value df
Asymp. Sig.
(2-Tailed)
Exact Sig.
(2-Tailed)
Exact. Sig.
(1-Tailed)
Pearson Chi-Square 17.707a 1 .000
Continuity Correctionb 16.699 1 .000
Likelihood Ratio 18.080 1 .000
Fisher’s Exact Test .000 .000
Linear-by-Linear
Association
17.645 1 .000
N of Valid Cases 283
3.1.1.6 Disease cluster
TABLE 40: CHI-SQUARE TEST OF INDEPENDENCE OF THE ‘DISEASE CLUSTER’ VARIABLE BETWEEN THE NEW COMPOSITION
OF INNOVCARE PARTICIPANTS AND THE REMAINING ELIGIBLE POPULATION
Crosstab cluster by newsample
New sample
Total
Remaining
population
INNOVCare
participants
cluster Autistic spectrum disorders Count 1 21 22
% Within New sample .6% 17.4% 7.8%
Congenital anomalies with
intelectual disabilities
Count 41 31 72
% Within New sample 25.3% 25.6% 25.4%
Epilepsies Count 9 11 20
% Within New sample 5.6% 9.1% 7.1%
Kidney disease Count 4 1 5
% Within New sample 2.5% .8% 1.8%
Metabolic diseases Count 10 1 11
% Within New sample 6.2% .8% 3.9%
Neurological diseases Count 81 49 130
% Within New sample 50.0% 40.5% 45.9%
Rare tumors Count 9 3 12
% Within New sample 5.6% 2.5% 4.2%
Skin and tissue complex Count 7 2 9

INNOVCare - Innovative Patient-Centred Approach for Social Care Provision to Complex Conditions
Technical note or random sampling and random allocation
- 44 -
disorders % Within New sample 4.3% 1.7% 3.2%
Congenital anomalies
without intellectual
disabilities
Count 0 2 2
% Within New sample .0% 1.7% .7%
Total Count 162 121 283
% Within New sample 100.0% 100.0% 100.0%
Chi-Square Tests
Value df
Asymp. Sig.
(2-Tailed)
Pearson Chi-Square 39.478a 8 .000
Likelihood-Ratio 45.283 8 .000
Linear-by-Linear
Association
12.407 1 .000
N of Valid Cases 283
3.1.1.7 Degree of disability There is no significant difference in the distribution of the degree of disability of the participants between the selected participants and the remaining eligible population X2 (5) = 5.789, p =0.327. TABLE 41: CHI-SQUARE TEST OF INDEPENDENCE OF THE ‘DISABILITY’ VARIABLE BETWEEN THE NEW COMPOSITION OF
INNOVCARE PARTICIPANTS AND THE REMAINING ELIGIBLE POPULATION
Crosstab disability by newsample
New sample
Total
Remaining
population
INNOVCare
participants
disability No disability Count 0 2 2
% Within New sample .0% 1.7% .7%
Severe functional deficiency
(without personal assistant)
Count 11 9 20
% Within New sample 6.8% 7.4% 7.1%
Marked functional deficiency Count 68 39 107
% Within New sample 42.0% 32.2% 37.8%

INNOVCare - Innovative Patient-Centred Approach for Social Care Provision to Complex Conditions
Technical note or random sampling and random allocation
- 45 -
Moderate functional
deficiency
Count 4 3 7
% Within New sample 2.5% 2.5% 2.5%
Mild functional deficiency Count 1 0 1
% Within New sample .6% .0% .4%
Severe functional deficiency
(with personal assistant)
Count 78 68 146
% Within New sample 48.1% 56.2% 51.6%
Total Count 162 121 283
% Within New sample 100.0% 100.0% 100.0%
Chi-Square Tests
Value df
Asymp. Sig.
(2-Tailed)
Pearson chi Square 6.075a 5 .299
Likelihood-Ratio 7.186 5 .207
Linear-by-Linear
Association
1.498 1 .221
N of Valid Cases 283
In conclusion the new composition of INNOVCare’s participants and the remaining eligible population are balanced on all the available variables tested except from ‘noro’ and ‘area’; both of which are related to the fact that NoRo’s patients were not randomly selected and therefore shows selectivity in terms of the location of the participants. 3.2 Procedure for randomisation of the 2nd selection In order to randomise the additional participants selected to replace the non-takers in the first phase of the experiment, the first step was to determine how the non-takers were distributed between the first two cohorts. TABLE 42: DISTRIBUTION OF THE NON-TAKERS BETWEEN THE 1ST
AND THE 2ND COHORTS
nontakers
Total Takers Non-takers
group 1st cohort 49 11 60
2nd cohort 46 14 60
Total 95 25 120

INNOVCare - Innovative Patient-Centred Approach for Social Care Provision to Complex Conditions
Technical note or random sampling and random allocation
- 46 -
To maintain consistency, the same blocking variables used in the first round of randomisation were used with the exception that the ‘type of patient’ was further differentiated by ‘NoRo’, ‘former NoRo’ and ‘external’ patients:
1. Type of patient (three levels: NoRo’s patients, former NoRo patients and external patients) 2. Age (three levels: Under 18, 18-64 and 65+) 3. Gender (two levels: Females and males) 4. Location of patients(two levels: Urban and rural)
3.2.1 Running the random allocation procedure on the 2nd
selection
3.2.1.1 Step 1: Splitting the dataset according ‘randvar’
The new selected 25 participants (15 of which were randomly selected as according to the procedure above and the rest that had automatic eligibility) were then classified according to the combination of the four blocking variable ‘randvar2’: TABLE 43: DISTRIBUTION OF THE NEW SELECTION (N=25) ACCORDING TO THE ‘RANDVAR’ (A COMBINATION OF THE
VARIABLES: ‘NORO’, ‘AGEGROUP2’, ‘SEX’ AND ‘AREA’)
randvar2: A combination of the variables: ‘noro’, ‘agegroup2’, ‘sex’ and ‘area’ Frequency Percentage
1 noro = 1 (NoRos patients) agegroup2 = 1 (Under 18) sex = 1 (Female) area = 1 (Urban) 2 8.0
2 noro = 1 (NoRos patients) agegroup2 = 1 (Under 18) sex = 2 (Male) area = 2 (Urban) 1 4.0
3 noro = 1 (NoRos patients) agegroup2 = 2 (18 to 64) sex = 1 (Female) area = 1 (Urban) 2 8.0
4 noro = 1 (NoRos patients) agegroup2 = 2 (18 to 64) sex = 2 (Male) area = 2 (Urban) 1 4.0
5 noro = 2 (External patients) agegroup2 = 1 (Under 18) sex = 2 (Male) area = 2 (Urban) 1 4.0
6 noro = 2 (External patients) agegroup2 = 2 (18 to 64) sex = 1 (Female) area = 1 (Rural) 3 12.0
7 noro = 2 (External patients) agegroup2 = 2 (18 to 64) sex = 1 (Female) area = 1 (Urban) 4 16.0
8 noro = 2 (External patients) agegroup2 = 2 (18 to 64) sex = 2 (Male) area = 2 (Rural) 2 8.0
9 noro = 2 (External patients) agegroup2 = 2 (18 to 64) sex = 2 (Male) area = 2 (Urban) 4 16.0
10 noro = 2 (External patients) agegroup2 = 3 (65+) sex = 1 (Female) area = 1 (Rural) 1 4.0
11 noro = 2 (External patients) agegroup2 = 3 (65+) sex = 1 (Female) area = 1 (Urban) 1 4.0
12 noro = 2 (External patients) agegroup2 = 3 (65+) sex = 2 (Male) area = 2 (Rural) 1 4.0
13 noro = 3 (Former NoRo beneficiaries) agegroup2 = 2 (18 to 64) sex = 1 (Female) area = 1 (Rural) 1 4.0
14 noro = 3 (Former NoRo beneficiaries) agegroup2 = 2 (18 to 64) sex = 1 (Female) area = 1 (Urban) 1 4.0
Total 25 100.0
The file was then split according to the variable randvar2, however the cells highlighted above each with one participant, were combined according to colour based on the agegroup2 variable. That means that row 2 and 5; 4, 13 and 14 and 10, 11 and 12 were combined for the randomisation process. At the end, there were therefore nine different files.

INNOVCare - Innovative Patient-Centred Approach for Social Care Provision to Complex Conditions
Technical note or random sampling and random allocation
- 47 -
3.2.1.2 Step 2: Random allocation One participant who was initially assigned to the second cohort needed be reallocated to the 1st cohort because s/he had a problem that needed to be resolved immediately as s/he was moving from the region in the autumn of 2017. Therefore, instead of allocating 11 and 14 participants each to the 1st and 2nd cohorts respectively according to the non-takers (see Table 42 above), instead 10 and 15 participants should be allocated to the 1st and 2nd cohort respectively. This participant would fall in the file containing the 2nd and 5th rows as shown in the Table 43 above. As a result, both participants included in this file were assigned to the 2nd cohort. As a next step each file was retrieved and a new completely random variable was computed. Each case in the dataset was assigned a random number between o and 1000. Due to the small sample size assigning values between 0 to 1000 reduces the chances of duplication of the random numbers. The file was then sorted according to the random numbers. In cases where the total number of cases in a stratum was a multiple of two, the first half of the cases were assigned to the 1st cohort while the second half were assigned to the 2nd cohort by generating a new variable called ‘group’ except for the second stratum for the reasons explained in the paragraph above. Because more participants needed to be assigned to the 2nd cohort compared to the 1st, in rest of the strata where the number of cases 3, the first case was assigned to the 1st cohort and the remaining two to the 2nd. Below, Table 44 details how the data was further split especially for those strata that didn’t have cases in multiples of two. TABLE 44: ALLOCATION OF PARTICIPANTS IN EACH STRATUM INTO THE 1ST
AND 2ND COHORT
Classification according to randvar2: A combination of the variables: ‘noro’, ‘agegroup2’, ‘sex’ and ‘area’
Total number
of cases
1st cohort
2nd cohort
1 2 1 1
2 and 5 2 0 2
3 2 1 1
4, 13 and 14 3 1 2
6 3 1 2
7 4 2 2
8 2 1 1
9 4 2 2
10, 11 and 12 3 1 2
Total 25 10 15
Furthermore, the cohort for two participants, who were included into the study the second time round because they were relatives to patients selected to participate into the study in the first round, were predefined. In order to ease the work of the case managers, they had to be included to the same group and assigned the same case manager as their relatives already included in the study. These cases were included in the files containing strata 11 and 14. Following the randomisation procedure, the case in the former file (containing strata 11) was assigned to the correct cohort by chance, in the other, following the procedure meant that the case was assigned to the 2nd cohort instead of the 1st which included

INNOVCare - Innovative Patient-Centred Approach for Social Care Provision to Complex Conditions
Technical note or random sampling and random allocation
- 48 -
his/her relative. As a result, in this stratum this participant was deliberately assigned to the 1st cohort and the remaining two cases to the 2nd cohort.
3.2.1.3 Step 3: Merging the different strata with allocated participants As a final step, all the 9 files as well as the file containingcontaining the different strata with the cases allocated to either the 1st cohort or the 2nd cohort were merged. A list of participant codes for each of the two cohorts was then generated. The original INNOVCare dataset with n=283 cases was then opened and for the n=25 new participants, a value to the variable ‘group’ was generated:
[if any(code, 'ext010', 'ext031', 'ext046', 'ext059', 'ext090', 'ext093', 'ext127', 'int061', 'int064', 'int066') group=1. if any(code,'ext002', 'ext025', 'ext035', 'ext048', 'ext060', 'ext085', 'ext086', 'ext118', 'ext131', 'ext183', 'ext216', 'ext217', 'int062', 'int063', 'int065') group=2.]
For the participant who was initially assigned to the second cohort but needed to be moved to the first, his/her value for the ‘group’ variable was changed accordingly: [if any(code,'int034') group=1.]
3.2.1.4 Step 4: Randomly assigning the participants to the case managers Due to the non-takers and consequently the new selected and the reallocation of cohorts of one participant, the distribution of cases to each case manager had to be reconsidered. Still in each phase, each case manager will be in charge of 15 patients and their families making a total of 30 patients and their families for each each case manager in the course of the intervention. Furthermore two participants in the first selection needed to be reassigned case managers: The first because there was a language barrier, s/he needed a Hungarian speaking case manager (case manager 3) and the second had to be reassigned case managers due to a conflict of interest. The two participants who were automatically eligible in the second selection because their relatives were already included in the study needed to be assigned the same case managers as their relatives. As a result, of these four cases, threehad predefined case managers (the exception is the case who that a conflict of interest with her case manager) making a total of n=241who still needed to be assigned case managers. These four cases were assigned a the predefined case manager as a first step:
[if any(code,'ext057') cm=3. if any(code,'ext127') cm=4. if any(code,'ext183') cm=3. recode cm (missing=0). if any(code,'int020') cm=0.]
1 (n=25 newly selected – n=2 with predefined case manager) + n=1 who needs to be reassigned → n=24

INNOVCare - Innovative Patient-Centred Approach for Social Care Provision to Complex Conditions
Technical note or random sampling and random allocation
- 49 -
TABLE 45: DISTRIBUTION OF THE NEW COMPOSITION OF INNOVCARE PARTICIPANTS ACCORDING TO CASE MANAGERS
Frequency To be assigned…
Not allocated 24
Case manager 1 26 4
Case manager 2 22 8
Case manager 3 25 5
Case manager 4 23 7
Total 120 24
Each participant in the dataset was then assigned a random number between 0 and 1000
(‘cmrandom2’). The cases were then sorted according to ‘innov2’ (Stand April 2017: NOT INNOVCare’s
participants (not sampled/non-taker), INNOVCare’s participant from 1st selection and INNOVCare’s participant from 2nd selection) ‘group’ (1st or 2nd cohort) and the random number ‘cmrandom2’. After this process, the n=24 participants who were selected to be in the study but had not yet been assigned a case manager, were assigned case managers according to the proportions displayed in Table 46 below. The assignment started with those in the first cohort starting in order of case manager and the number of cases to be assigned. After all the 9 cases in the first cohort had been assigned a case manager, the same process followed for those in the second cohort. TABLE 46: DISTRIBUTION OF THE NEW COMPOSITION OF INNOVCARE PARTICIPANTS ACCORDING TO CASE MANAGERS
AND COHORTS
group
1st
cohort to be assigned 2nd
cohort to be assigned
Not allocated 9 15
Case manager 1 14 1 12 3
Case manager 2 12 3 10 5
Case manager 3 12 3 13 2
Case manager 4 13 2 10 5
Total 60 9 60 15
After this process, a quick check was made to confirm that the two participants who were relatives of already selected participants were assigned to the sae case managers. Also, it was confirmed that the case that had to be reallocate case managers due to a conflict of interest, was not randomly allocated to the same case manager again. A list with the newly selected participants including the participant code, group and case managers were generated and sent to NoRo for recruitment. During enrollment of the participants into the study, ext086 requested to be moved to the first cohort although he was originally randomly allocated to the second cohort during the second randomisation procedure because he needed ‘urgent support’. In addition, in this process ‘ext021’ who had not been selected to take part in the study was automatically

INNOVCare - Innovative Patient-Centred Approach for Social Care Provision to Complex Conditions
Technical note or random sampling and random allocation
- 50 -
included because it was discovered during recruitment that she was the wife of ext118 who had been randomly sampled the second time round. These changes resulted in a total sample size of 121, 61 participants belonging to the first cohort and 60 to the second.

INNOVCare - Innovative Patient-Centred Approach for Social Care Provision to Complex Conditions
Technical note or random sampling and random allocation
- 51 -
3.2.2 Ex-post assessment of the randomisation procedure
The ex-post assessment of the randomisation procedure was carried out on the new composition of INNOVCare participants i.e. the n=95 selected in the first selection and who consented to taking part in the study and the n=25 who were chosen in the second selection.
3.2.2.1 Age
On average, the 2nd cohort has a slightly higher mean age (M=30.50, SE=2.989) than the 1st cohort (M=29.78, SE=3.083). This difference of -0.717, 95% CI [-9.220, 7.787] was not significant t(118) = -0.167, p =0.868 meaning that there is no statistically significant difference in the ages of the two groups. TABLE 47: INDEPENDENT T-TEST OF THE AGE VARIABLE ON THE ‘GROUP’ VARIABLE (1ST
COHORT VS. 2ND COHORT)
Group Statistics
group
N Mean
Standard
deviation
Standard error
of the mean
age 1st cohort 61 29.61 23.721 3.037
2nd cohort 60 30.70 23.104 2.983
Independent Samples Test
Levene-Test for
Equality of
Variances T-Test for equality means
F
Significa
nce T df
Sig. (2-
tailed)
mean
differenc
e
Standard
error of
the
differenc
ed
95% Confidence
interval of the
difference
Lower Upper
age Variance is
equal
.714 .400 -.257 119 .798 -1.093 4.258 -9.524 7.337
Variance is not
equal
-.257 118.9
89
.798 -1.093 4.257 -9.522 7.336

INNOVCare - Innovative Patient-Centred Approach for Social Care Provision to Complex Conditions
Technical note or random sampling and random allocation
- 52 -
3.2.2.2 Age group (children, adults in working age and pensioners) There is no significant difference in the distribution of the age groups (children, adults in working age and pensioners) between the 1st cohort and the 2nd cohorts X2 (2) = 0.577, p =0.749.
TABLE 48: CHI-SQUARE TEST OF INDEPENDENCE OF THE ‘AGEGROUP2’ VARIABLE BETWEEN THE 1ST
AND 2ND COHORTS
Crosstab agegroup2 by group
group
Total 1st cohort 2nd cohort
agegroup2 Under 18 Count 30 27 57
% within group 49.2% 45.0% 47.1%
18 to 64 Count 27 27 54
% within group 44.3% 45.0% 44.6%
65+ Count 4 6 10
% within group 6.6% 10.0% 8.3%
Total Count 61 60 121
% within group 100.0% 100.0% 100.0%
Chi-Square Tests
Value df
Asymp. Sig. (2-
Tailed)
Pearson Chi-Square .550a 2 .760
Likelihood Ratio .552 2 .759
Linear-by-Linear
Association
.433 1 .511
N of Valid Cases 121
a. 1 Cell 16.7%) have expected counts less than 5. The minimal
expected frequency is 4.96.

INNOVCare - Innovative Patient-Centred Approach for Social Care Provision to Complex Conditions
Technical note or random sampling and random allocation
- 53 -
3.2.2.3 Type of patient Unlike in the first selection where this variable had two levels, NoRo and external patients, in this analysis an extra level ‘former NoRo patients’ was included. There is no significant difference in the distribution of the type of patient (NoRo’s patients or external patients) between the 1st cohort and the 2nd cohorts X2 (2) = 2.161, p =0.339. TABLE 49: CHI-SQUARE TEST OF INDEPENDENCE OF THE ‘NORO’ VARIABLE BETWEEN THE 1ST
AND 2ND COHORTS
Crosstab noro by group
group
Total 1st cohort 2nd cohort
noro NoRos
patients
Count 33 32 65
% Within group 54.1% 53.3% 53.7%
External
patients
Count 28 28 56
% Within group 45.9% 46.7% 46.3%
Total Count 61 60 121
% Within group 100.0% 100.0% 100.0%
Chi-Square Tests
Value df
Asymp. Asymp.
Sig. (2-Tailed)
Pearson Chi-Square .007a 1 .933
Continuity Correctionb .000 1 1.000
Likelihood Ratio .007 1 .933
Fisher’s Exact Test
Linear-by-Linear
Association
.007 1 .933
N of Valid Cases 121
a. 0 cells (.0%) have expected counts less than 5. The minimal expected frequency is 27.77.
b. Computed only for a 2x2 table

INNOVCare - Innovative Patient-Centred Approach for Social Care Provision to Complex Conditions
Technical note or random sampling and random allocation
- 54 -
3.2.2.4 Gender There is no significant difference in the distribution of the gender between the 1st cohort and the 2nd cohorts X2 (1) = 0.302, p =0.583. TABLE 50: CHI-SQUARE TEST OF INDEPENDENCE OF THE ‘SEX’ VARIABLE BETWEEN THE 1ST
AND 2ND COHORTS
Crosstab sex by group
group
Total 1st cohort 2nd cohort
sex Female Count 31 35 66
% Within group 50.8% 58.3% 54.5%
Male Count 30 25 55
% Within group 49.2% 41.7% 45.5%
Total Count 61 60 121
% Within group 100.0% 100.0% 100.0%
Chi-Square-Tests
Value df
Asymp. Sig.
(2-Tailed)
Exact Sig.
(2-Tailed)
Exact. Sig.
(1-Tailed)
Pearson Chi-Square .689a 1 .407
Continuity Correctionb .419 1 .517
Likelihood Ratio .689 1 .406
Fisher’s Exact Test .467 .259
Linear-by-Linear Association .683 1 .409
N of Valid Cases 121
a. 0 cells have expected counts less than 5. The minimal expected frequency is 27.27.
b. Computed only for a 2X2 table

INNOVCare - Innovative Patient-Centred Approach for Social Care Provision to Complex Conditions
Technical note or random sampling and random allocation
- 55 -
3.2.2.5 Area
There is no significant difference in the distribution of the area (urban or rural) that the participants live between the 1st cohort and the 2nd cohorts X2 (1) = 0.042, p =0.838.
TABLE 51: CHI-SQUARE TEST OF INDEPENDENCE OF THE ‘AREA’ VARIABLE BETWEEN THE 1ST AND 2ND
COHORTS
Crosstab area by group
group
Total 1st cohort 2nd cohort
area Urban Count 45 42 87
% Within group 73.8% 70.0% 71.9%
Rural Count 16 18 34
% Within group 26.2% 30.0% 28.1%
Total Count 61 60 121
% Within group 100.0% 100.0% 100.0%
Chi-Square Tests
Value df
Asymp. Sig.
(2-Tailed)
Exact Sig.
(2-Tailed)
Exact. Sig.
(1-Tailed)
Pearson Chi-Square .213a 1 .645
Continuity Correctionb .067 1 .796
Likelihood Ratio .213 1 .644
Fisher’s Exact Test .689 .398
Linear-by-Linear
Association
.211 1 .646
N of Valid Cases 121
a. 0 cells have expected counts less than 5. The minimal expected frequency is 16.86.
b. Computed only for a 2X2 table.

INNOVCare - Innovative Patient-Centred Approach for Social Care Provision to Complex Conditions
Technical note or random sampling and random allocation
- 56 -
3.2.2.6 Disease cluster
TABLE 52: CHI-SQUARE TEST OF INDEPENDENCE OF THE ‘DISEASE CLUSTER’ VARIABLE BETWEEN THE 1ST AND 2ND
COHORTS Crosstab disease cluster by cohort
cohort
Total 1st cohort 2nd cohort
cluster Autistic spectrum disorders Count 9 12 21
% within group 14.8% 20.0% 17.4%
Congenital anomalies with
intelectual disabilities
Count 18 13 31
% within group 29.5% 21.7% 25.6%
Epilepsies Count 5 6 11
% within group 8.2% 10.0% 9.1%
Kidney disease Count 0 1 1
% within group .0% 1.7% .8%
Metabolic diseases Count 1 0 1
% within group 1.6% .0% .8%
Neurological diseases Count 22 27 49
% within group 36.1% 45.0% 40.5%
Rare tumors Count 2 1 3
% within group 3.3% 1.7% 2.5%
Skin and tissue complex
disorders
Count 2 0 2
% within group 3.3% .0% 1.7%
Congenital anomalies
without intellectual
disabilities
Count 2 0 2
% within group 3.3% .0% 1.7%
Total Count 61 60 121
% within group 100.0% 100.0% 100.0%

INNOVCare - Innovative Patient-Centred Approach for Social Care Provision to Complex Conditions
Technical note or random sampling and random allocation
- 57 -
Chi-Square Tests
Value df
Asymp. Sig.
(2-Tailed)
Pearson Chi-Square 8.162a 8 .418
Likelihood Ratio 10.491 8 .232
Linear-by-Linear
Association
.230 1 .631
N of Valid Cases 121
a. 10 cells (55.6%) have expected counts less than 5. The minimal
expected frequency is 50.
3.2.2.7 Degree of disability
There is no significant difference in the distribution of the degree of disability of the participants between the 1st cohort and the 2nd cohorts X2 (4) = 3.817, p =0.431.
TABLE 53: CHI-SQUARE TEST OF INDEPENDENCE OF THE ‘DEGREE OF DISABILITY` VARIABLE BETWEEN THE 1ST AND 2ND
COHORTS
Crosstab disability by group
group
Total 1st cohort 2nd cohort
disability No disability Count 0 2 2
% Within group .0% 3.3% 1.7%
Severe functional deficiency
(without personal assistant)
Count 5 4 9
% Within group 8.2% 6.7% 7.4%
Marked functional deficiency Count 18 21 39
% Within group 29.5% 35.0% 32.2%
Moderate functional
deficiency
Count 1 2 3
% Within group 1.6% 3.3% 2.5%
Severe functional deficiency
(with personal assistant)
Count 37 31 68
% Within group 60.7% 51.7% 56.2%
Total Count 61 60 121
% Within group 100.0% 100.0% 100.0%

INNOVCare - Innovative Patient-Centred Approach for Social Care Provision to Complex Conditions
Technical note or random sampling and random allocation
- 58 -
Chi-Square Tests
Value df
Asymp. Sig.
(2-Tailed)
Pearson Chi-Square 3.197a 4 .525
Likelihood Ratio 3.977 4 .409
Linear-by-Linear
Association
1.019 1 .313
N of Valid Cases 121
a. 6 cells (60.0%) have expected counts less than 5. The minimal
expected frequency is.99.
In conclusion the 1st and 2nd cohort of the new composition of INNOVcare participants are balanced on all the available variables.

INNOVCare - Innovative Patient-Centred Approach for Social Care Provision to Complex Conditions
Technical note or random sampling and random allocation
- 59 -
REFERENCES Aker. J.. 2012. How do we Randomize?. [Online]
Available at: https://www.google.at/url?sa=t&rct=j&q=&esrc=s&source=web&cd=3&cad=rja&uact=8&ved=0ahUKEwi5sNiGqMjOAhVDORQKHThXAr4QFgguMAI&url=http%3A%2F%2Fcega.berkeley.edu%2Fassets%2Fcega_learning_materials%2F137%2FLecture_4_How_to_Randomize_Agriculture.pptx&usg=AFQjCN [Accessed 17 August 2016].
Field. A. & Hole. G.. 2003. How to Design and Report Experiments. Wiltshire: SAGE Publications Ltd. Glennerster. R. & Takavarasha. K.. 2013. Running randomized evaluations: a practical guide. New Jersey:
Princeton University Press. Kumar. R.. 2005. Research methodology: A step-by-step guide for beginners. Second ed. Malaysia: Sage
Publications. Inc.. Shadish. W. R.. Cook. T. D. & Campbell. D. T.. 2002. Experimental and quasi-experimental designs for
generalized causal inference. Unites States of America: Wadsworth Cengage Learning. Verma. J. P.. 2016. Repeated measures design for empirical researchers. New Jersey: Wiley.