Embed Size (px)
Citation preview
Wound Areas by Computerized Planimetry of DigitalImages: Accuracy and Reliability
Harvey N. Mayrovitz, PhD, and Lisa B. Soontupe, RN, MA
INTRODUCTIONTracking and documenting changes in the patient’s wound
area are important parts of the overall treatment and as-
sessment process.1 – 9 Several methods have been used to
estimate a wound’s area, and some of them have been assessed
with respect to their utility and reliability.10– 16 Some re-
searchers have combined standard photography with trans-
parency tracings,15 whereas others have compared the use
of video camera recordings with tracing methods.17 Perhaps
the simplest method is to measure wound length (L) and
width (W) and to multiply these to get an estimate of area.
Results obtained with this approach, when applied to di-
abetic wounds and venous ulcers in comparison to areas ob-
tained using planimetry of wound tracings, showed overall
agreement if a suitable multiplying constant was used in the
area calculations.18–20 However, significant individual differ-
ences between these L � W area determinations could occur
principally related to wound shape and its change with
treatment and time. This fact suggests that simple L � W
measurements may be useful indicators under certain con-
ditions,21,22 but they are not suitable for situations in which
more accurate assessments of area change are needed, such as
to estimate healing rates.
When determining the rate at which a wound is healing,
both the manner by which such a rate is calculated and the
initial area of the wound may influence the calculated healing
rate. For example, it has been reported that healing rates,
calculated as change in wound area per day, were significantly
and independently affected by the wound’s initial area and
other wound geometric factors.5 In contrast, when the ratio of
the wound’s surface area (S) to its perimeter (P) was used as an
index of healing, there was no dependence on initial wound
area.5 Several investigators have suggested that use of the
S/P ratio is a useful method to characterize wound healing
rates.5,23 – 26 Changes in this parameter are a measure of the
change in a wound’s effective radius, which is an index of the
movement of a wound’s margin toward the center for healing
or away from the center in the case of wound enlargement.
Thus, if a wound were shaped like a circle, then twice the S/P
ratio would be exactly equal to its radius. For other wound
shapes, the S/P value can be viewed as an effective radius. The
S/P ratio has been used to assess healing rates in venous ul-
cers and has been reported to be a suitable indicator of lin-
ear healing per day.5,27 It has also been used to predict time to
ADVANCES IN SKIN & WOUND CARE & VOL. 22 NO. 5 222 WWW.WOUNDCAREJOURNAL.COM
ORIGINAL INVESTIGATION
Harvey N. Mayrovitz, PhD, is Professor, College of Medical Sciences; and Lisa B. Soontupe, RN, MA, is Associate Professor, College of Allied Health and Nursing, Department of Nursing,
Nova Southeastern University, Ft Lauderdale, Florida.
ABSTRACT
BACKGROUND: Tracking wound size is an essential part of
treatment. Because a wound’s initial size may affect apparent
healing rates, its surface area (S) and its surface area-to-perimeter
(S/P) ratio are useful to document healing. Assessments of these
parameters can be made by computerized planimetry of digital
images using suitable software.
OBJECTIVE: Because different caregivers often evaluate wounds
and because measurement time is important, the objective of this
study was to determine accuracy, repeatability, and measurement
time of S and S/P from measurements of images recorded by
digital photography.
METHODS: Six wound images of various complexities with known
areas were measured in triplicate by 20 senior nursing students
during 2 sessions 1 week apart. Images included an ellipse,
2 traced venous ulcers, and photographs of a pressure, diabetic
plantar, and venous ulcer. Area error was determined as the
percentage difference between known and planimetry measured
areas. Reliability was assessed from test-retest coefficient of
variations (CV%) from which the smallest meaningful percentage
change (SMPC) was determined.
RESULTS: Area errors (meanF SD) ranged from �2.95%F 7.01%
to +2.32%F 6.04%. For well-defined image margins, area and S/P
SMPC values were all less than 3.2%. For borders that were not as
well defined, SMPCs were larger, ranging between 6.2% and
10.8%. Wound measurement time decreased from 93.4 F 35.1
seconds at session 1 to 67.7 F 24.4 at session 2 (P < .001).
CONCLUSIONS: Results based on the specific software used
and on the outcomes of the study group indicate that simple
computer-based planimetry of digital images can provide rapid,
accurate, and reliable estimates of wound area and S/P ratios.
ADV SKIN WOUND CARE 2009;22:222 – 9
9Copyright @ 200 Lippincott Williams & Wilkins. Unauthorized reproduction of this article is prohibited.
wound closure based on a nonlinear delayed exponential
model of healing,23,24 which seems to offer some predictive
features.25
Whether wound healing progression is judged on changes
in the absolute area, changes in the area relative to initial area,
or changes in the S/P ratio depends on a suitably accurate
and reliable method to determine the wound’s area. The use
of digital photography, which is now widely available for
wound documentation, offers several benefits to other more
complex methods. It can be done cheaply and quickly, and
perhaps more important, it requires no contact with the wound
bed in contrast to various wound-tracing methods. After ob-
taining the digital image, the wound area will need to be de-
termined from the digitized image if it is going to be used for
means other than simple visual documentation. Computerized
planimetry can outline the margins of a wound, as depicted on
the digitized image, on a computer screen, and automati-
cally determine the enclosed area using a suitable software
algorithm.
Because individual wounds are often treated and evaluated
by different nurses, therapists, and other caregivers, it is
important to have an estimate of the accuracy and reliability of
this process. Although certain aspects of this question have
been studied by determining intrarater and interrater reliability
of various methods,1,10,12,14,16,17,28 most studies have used only
a few raters, thereby limiting the ability to generalize the
results. Furthermore, few studies have addressed the issue of
absolute accuracy. A notable exception is a study in which a
group of nurses and student nurses evaluated 3 differently
shaped plaster-of-paris wound models of known area.14
Models were measured by several methods, including directly
measured L � W of the model, planimetry of tracings of the
model, and computerized stereophotogrammetry using a
commercial system. It was reported that the smallest measure-
ment error resulted with the computerized area determination
and that only this method had a sufficiently high single-tester
reliability to justify its use for clinical measurements. However,
the reported percentage error, even with the clearly defined
margins of the models used, was 14.9% in the best case using
the stereophotogrammetry system for area determinations.
The goal of the present study was to focus on both accuracy
and reliability issues associated with using simple digital
photography combined with computerized planimetry. The
study used a group of 20 nursing students as raters, who
performed computerized area determination tasks on 6 differ-
ently shaped images that had known areas. The goal of this
research was to determine the accuracy and repeatability of area
measurements achieved by this representative group of student
nurses who were at the time 6 months from graduation.
METHODSParticipantsThe group consisted of 20 nursing students who were in their
senior year of a 4-year bachelor of science in nursing program
at Nova Southeastern University, Ft Lauderdale, Florida.
ImagesSix test images of various complexities having areas known
to within F0.15 cm2, as determined by methods described in
the next section, were subsequently measured in triplicate
by planimetric methods by the 20 student nurses during 2
sessions, 1 week apart. Images (Figure 1) included an ellipse
(image 1), 2 traced venous ulcers (images 2 and 3), photographs
of a sacral pressure ulcer (image 4), a diabetic plantar ulcer
(image 5), and a venous leg ulcer (image 6). To obtain test
images 1 through 3, the shapes and the horizontal calibration
bars were drawn with a computer and then printed on heavy
photographic paper. To obtain test images 4 through 6, a cali-
bration bar was placed on a photograph of the ulcers and then
printed. All 6 printed images with their embedded calibration
bars were then photographed with a digital camera (Sony
Cyber-shot) at a resolution of 1024 � 768 pixels. The calibration
bars would subsequently be used by the raters to calibrate the
linear dimensions of the images for area determinations using
the area software. Lengths of the calibration bars were verified
with a micrometer accurate to F0.1 mm. Photographs were
taken with a 90-degree angle between the camera’s line of
sight and the plane of the image being photographed. The
physical distance of the camera image sensor to the target was
about 30 cm, and the camera’s zoom was used if necessary to
render the captured image, including the embedded calibration
marker, to occupy at least 75% of the available viewing area.
Image AreasUsing a scalpel, the entire perimeter margin of each shape was
carefully scored to produce a cutout of the target shape inside
area. The shapes were then weighed on a scale accurate to
0.0001 g. To determine actual areas, weight (Wi) of each target
shape was compared with a computer-generated and drawn
square of known area (AK) that was printed on the same paper
as the target shape. The square was cut out from the paper, and
its weight (WK) was determined in the same way as the target
shape. Areas (Ai) were determined as Ai = (Wi / WK) � AK.
Weight measurements were done in triplicate, and the average
value was used for the calculation. To test the accuracy of the
weight method for determining areas, a series of circular shapes
with areas spanning the range of the target images were
computer drawn, printed, and then cut out in the exact manner
as the target images. The weight-determined areas were then
ADVANCES IN SKIN & WOUND CARE & MAY 2009223WWW.WOUNDCAREJOURNAL.COM
ORIGINAL INVESTIGATION
9Copyright @ 200 Lippincott Williams & Wilkins. Unauthorized reproduction of this article is prohibited.
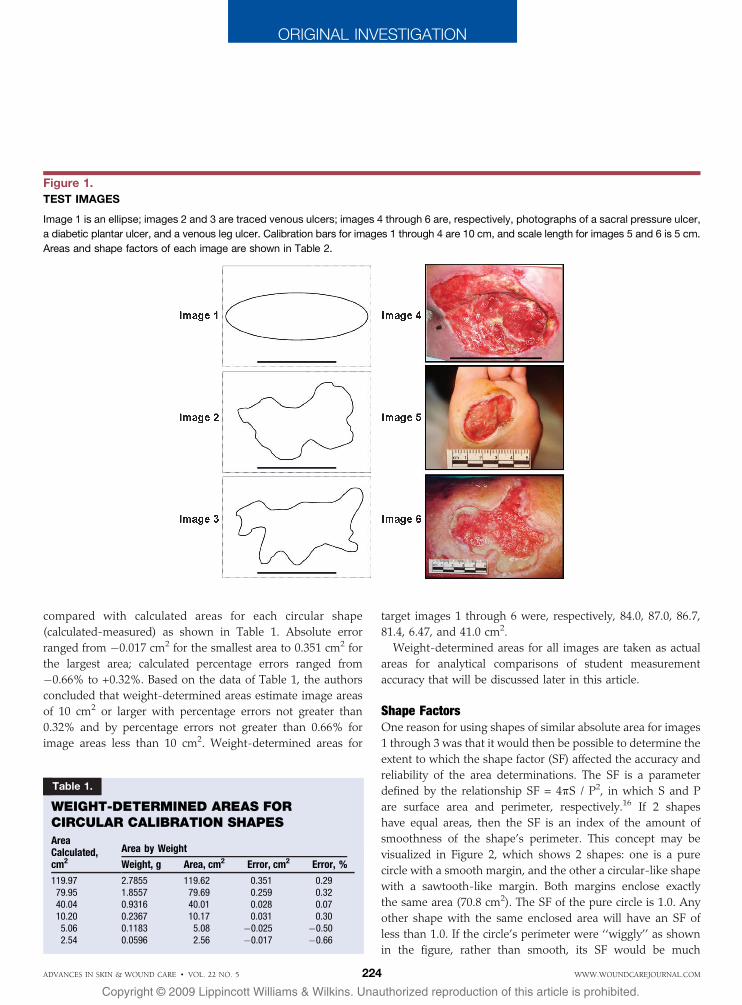
compared with calculated areas for each circular shape
(calculated-measured) as shown in Table 1. Absolute error
ranged from �0.017 cm2 for the smallest area to 0.351 cm2 for
the largest area; calculated percentage errors ranged from
�0.66% to +0.32%. Based on the data of Table 1, the authors
concluded that weight-determined areas estimate image areas
of 10 cm2 or larger with percentage errors not greater than
0.32% and by percentage errors not greater than 0.66% for
image areas less than 10 cm2. Weight-determined areas for
target images 1 through 6 were, respectively, 84.0, 87.0, 86.7,
81.4, 6.47, and 41.0 cm2.
Weight-determined areas for all images are taken as actual
areas for analytical comparisons of student measurement
accuracy that will be discussed later in this article.
Shape FactorsOne reason for using shapes of similar absolute area for images
1 through 3 was that it would then be possible to determine the
extent to which the shape factor (SF) affected the accuracy and
reliability of the area determinations. The SF is a parameter
defined by the relationship SF = 4kS / P2, in which S and P
are surface area and perimeter, respectively.16 If 2 shapes
have equal areas, then the SF is an index of the amount of
smoothness of the shape’s perimeter. This concept may be
visualized in Figure 2, which shows 2 shapes: one is a pure
circle with a smooth margin, and the other a circular-like shape
with a sawtooth-like margin. Both margins enclose exactly
the same area (70.8 cm2). The SF of the pure circle is 1.0. Any
other shape with the same enclosed area will have an SF of
less than 1.0. If the circle’s perimeter were ‘‘wiggly’’ as shown
in the figure, rather than smooth, its SF would be much
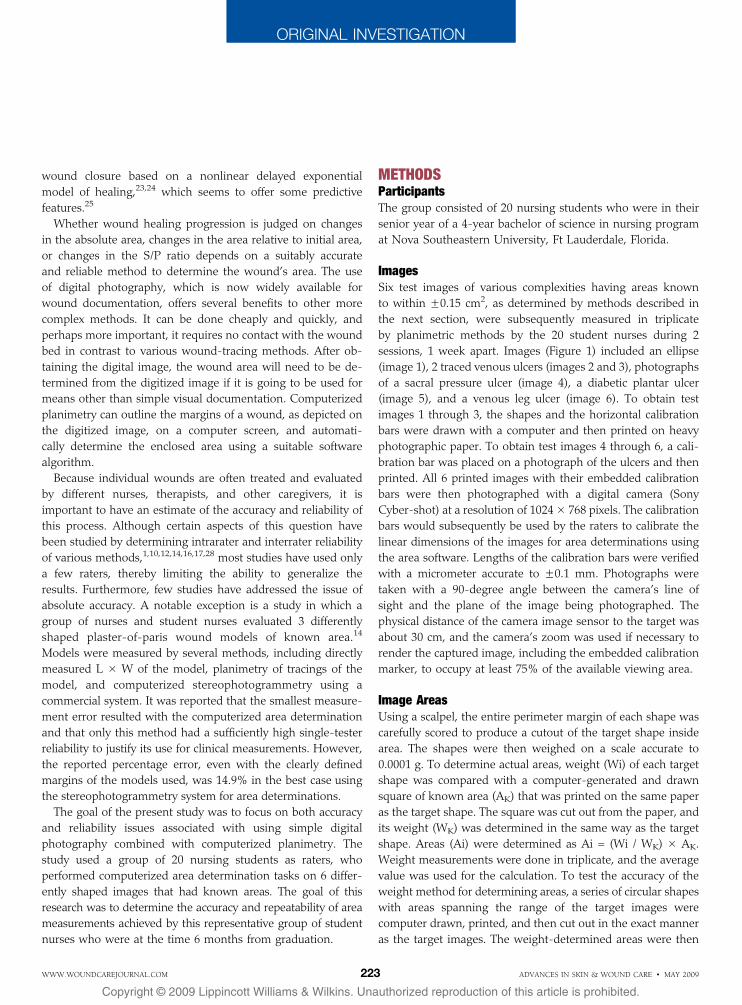
Figure 1.
TEST IMAGES
Image 1 is an ellipse; images 2 and 3 are traced venous ulcers; images 4 through 6 are, respectively, photographs of a sacral pressure ulcer,
a diabetic plantar ulcer, and a venous leg ulcer. Calibration bars for images 1 through 4 are 10 cm, and scale length for images 5 and 6 is 5 cm.
Areas and shape factors of each image are shown in Table 2.
Table 1.
WEIGHT-DETERMINED AREAS FORCIRCULAR CALIBRATION SHAPES
AreaCalculated,cm2
Area by Weight
Weight, g Area, cm2 Error, cm2 Error, %
119.97 2.7855 119.62 0.351 0.2979.95 1.8557 79.69 0.259 0.3240.04 0.9316 40.01 0.028 0.0710.20 0.2367 10.17 0.031 0.305.06 0.1183 5.08 �0.025 �0.502.54 0.0596 2.56 �0.017 �0.66
ADVANCES IN SKIN & WOUND CARE & VOL. 22 NO. 5 224 WWW.WOUNDCAREJOURNAL.COM
ORIGINAL INVESTIGATION
9Copyright @ 200 Lippincott Williams & Wilkins. Unauthorized reproduction of this article is prohibited.
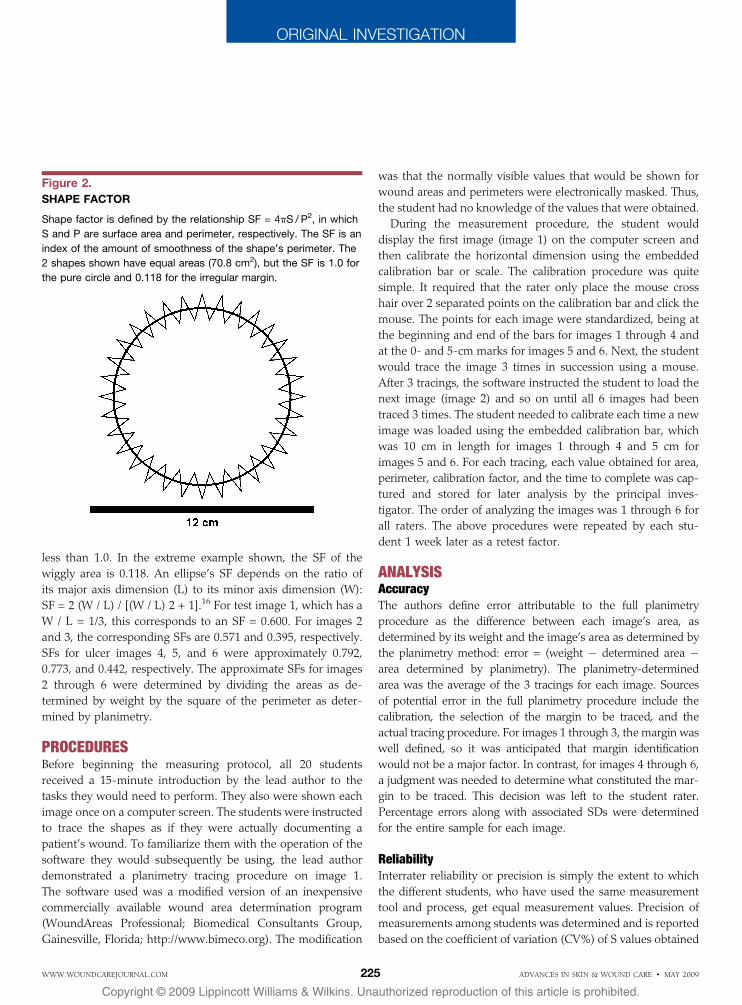
less than 1.0. In the extreme example shown, the SF of the
wiggly area is 0.118. An ellipse’s SF depends on the ratio of
its major axis dimension (L) to its minor axis dimension (W):
SF = 2 (W / L) / [(W / L) 2 + 1].16 For test image 1, which has a
W / L = 1/3, this corresponds to an SF = 0.600. For images 2
and 3, the corresponding SFs are 0.571 and 0.395, respectively.
SFs for ulcer images 4, 5, and 6 were approximately 0.792,
0.773, and 0.442, respectively. The approximate SFs for images
2 through 6 were determined by dividing the areas as de-
termined by weight by the square of the perimeter as deter-
mined by planimetry.
PROCEDURESBefore beginning the measuring protocol, all 20 students
received a 15-minute introduction by the lead author to the
tasks they would need to perform. They also were shown each
image once on a computer screen. The students were instructed
to trace the shapes as if they were actually documenting a
patient’s wound. To familiarize them with the operation of the
software they would subsequently be using, the lead author
demonstrated a planimetry tracing procedure on image 1.
The software used was a modified version of an inexpensive
commercially available wound area determination program
(WoundAreas Professional; Biomedical Consultants Group,
Gainesville, Florida; http://www.bimeco.org). The modification
was that the normally visible values that would be shown for
wound areas and perimeters were electronically masked. Thus,
the student had no knowledge of the values that were obtained.
During the measurement procedure, the student would
display the first image (image 1) on the computer screen and
then calibrate the horizontal dimension using the embedded
calibration bar or scale. The calibration procedure was quite
simple. It required that the rater only place the mouse cross
hair over 2 separated points on the calibration bar and click the
mouse. The points for each image were standardized, being at
the beginning and end of the bars for images 1 through 4 and
at the 0- and 5-cm marks for images 5 and 6. Next, the student
would trace the image 3 times in succession using a mouse.
After 3 tracings, the software instructed the student to load the
next image (image 2) and so on until all 6 images had been
traced 3 times. The student needed to calibrate each time a new
image was loaded using the embedded calibration bar, which
was 10 cm in length for images 1 through 4 and 5 cm for
images 5 and 6. For each tracing, each value obtained for area,
perimeter, calibration factor, and the time to complete was cap-
tured and stored for later analysis by the principal inves-
tigator. The order of analyzing the images was 1 through 6 for
all raters. The above procedures were repeated by each stu-
dent 1 week later as a retest factor.
ANALYSISAccuracyThe authors define error attributable to the full planimetry
procedure as the difference between each image’s area, as
determined by its weight and the image’s area as determined by
the planimetry method: error = (weight � determined area �area determined by planimetry). The planimetry-determined
area was the average of the 3 tracings for each image. Sources
of potential error in the full planimetry procedure include the
calibration, the selection of the margin to be traced, and the
actual tracing procedure. For images 1 through 3, the margin was
well defined, so it was anticipated that margin identification
would not be a major factor. In contrast, for images 4 through 6,
a judgment was needed to determine what constituted the mar-
gin to be traced. This decision was left to the student rater.
Percentage errors along with associated SDs were determined
for the entire sample for each image.
ReliabilityInterrater reliability or precision is simply the extent to which
the different students, who have used the same measurement
tool and process, get equal measurement values. Precision of
measurements among students was determined and is reported
based on the coefficient of variation (CV%) of S values obtained
Figure 2.
SHAPE FACTOR
Shape factor is defined by the relationship SF = 4kS / P2, in which
S and P are surface area and perimeter, respectively. The SF is an
index of the amount of smoothness of the shape’s perimeter. The
2 shapes shown have equal areas (70.8 cm2), but the SF is 1.0 for
the pure circle and 0.118 for the irregular margin.
ADVANCES IN SKIN & WOUND CARE & MAY 2009225WWW.WOUNDCAREJOURNAL.COM
ORIGINAL INVESTIGATION
9Copyright @ 200 Lippincott Williams & Wilkins. Unauthorized reproduction of this article is prohibited.

for each image. The CV% was calculated as the SD of values
obtained among students divided by the mean: CV% = 100 �(SD / mean). First- and second-week values of CV% were
calculated separately.
Intrarater reliability or repeatability in the present context is
the extent to which student raters replicated the measured
values on the 2 separate occasions. The lower the repeat-
ability, the greater the amount of change that must occur to
confidently accept a change as real. This minimum amount of
change is calculable from the method error (ME),29 which can
be expressed as ME = SDdiff /ffiffiffi
2p
, in which SDdiff is the SD of
differences between the 2 separate measurement sessions.30 A
group test-retest coefficient of variation (CV12%) that includes
both sessions 1 and 2 measurements can then be determined
as CV12%= 100 � (ME / M12) in which M12 is the overall mean
value of sessions 1 and 2 measurements. The utility of CV12% is
that, in 95% of paired repeated measurements, the percentage
difference between the values obtained is expected to be less
than 1.96ffiffiffi
2p
CV12%.31 From a practical point of view, this
implies that if measurements are made by any rater on the first
session and made by any different rater on the second session,
then the smallest meaningful percentage change (SMPC)
needs to be greater than 2.77 CV12%. SMPC is determined
for both S and S/P.
An alternative, but less robust, approach is to consider
differences in values obtained by the same rater at the 2
different measurement sessions. To provide such a comparative
estimate, the percentage differences between area values
obtained on the first and second sessions for each image and
rater were determined, and the average among raters was
calculated.
Shape Factor DependenceSF dependence was analyzed by determining if there was a
significant correlation between the SMPC and the SF. This was
done by linear regression analysis of SMPC on SF, with a
significance level of <.05 taken as significant.
Time FactorsTime factors were analyzed based on the time to complete
each image measurement procedure during session 1 (T1) and
during session 2 (T2). T1 and T2 were determined as the
average of the 3 measurements done for each image at each
session. Questions of whether there was a change in mea-
surement time with session and whether measurement time
depended on image were analyzed using a general linear
model for repeated measures, with time as the repeated
measure.
RESULTSAccuracy results using the digital planimetry method are
summarized in Table 2. The main result shows that the mean
area error is less than 3% for all images of both test sessions.
The larger errors, and those having the larger SDs, are those
associated with measurements of the plantar and venous ulcer
photographic images. For the venous ulcer, the mean area
determined by planimetry is slightly greater than the weight-
determined area, whereas for the plantar ulcer, the mean
planimetry area is slightly less than the weight-determined
area. Paired t tests for possible differences between sessions in
planimetry-determined areas and for area errors show these to
be not significant for any image (P > .2). Combining first- and
second-session errors yields the overall combined percent area
errors listed in the last column of the table. This area error
shows no defined relationship to either SF (P > .5) or absolute
value of the various areas (P > .5).
Repeatability results for area, perimeter, and calibration
factor measurements are summarized in Table 3. For areas and
perimeters, the CV% among raters were similar for both test
sessions and were less than 2.5% for images 1 through 4.
Measurements of the plantar and venous ulcer photographic
image yielded the largest variation among raters, with the
largest variation associated with the plantar ulcer, which was
the smallest of the areas measured. Area CV% for these 2
images ranged from 6.72% to 7.56% over both measurement
Table 2.
AREA PARAMETERS AND MEASUREMENT ACCURACY ESTIMATES
Image SFArea (S) byWeight, cm2
Area (S) by Planimetry, cm2 Area Error, %
Test 1 Test 2 Test 1 Test 2 Combined
(1) Ellipse 0.600 84.0 F 1.0% 83.5 F 2.1 83.4 F 1.9 0.31 F 2.50 0.75 F 2.30 0.53 F 2.38(2) Venous ulcer 0.571 87.0 F 0.15 85.4 F 1.2 84.9 F 1.9 1.87 F 1.41 2.44 F 2.24 2.16 F 1.87(3) Venous ulcer 0.395 86.7 F 0.15 86.4 F 1.7 86.0 F 1.1 0.33 F 1.96 0.75 F 1.27 0.54 F 1.64(4) Sacral ulcer 0.792 81.4 F 0.15 81.4 F 1.3 81.9 F 1.8 0.01 F 1.55 �0.53 F 2.21 �0.28 F 1.90(5) Plantar ulcer 0.773 6.47 F 0.15 6.38 F 0.29 6.26 F 0.47 1.40 F 4.43 3.25 F 7.31 2.32 F 6.04(6) Venous ulcer 0.442 41.0 F 0.15 42.5 F 2.9 41.9 F 2.9 �3.80 F 6.98 �2.11 F 7.12 �2.95 F 7.01
Planimetry values are meanF SD. SF is the shape factor of the measured area. Tests 1 and 2 data are for values obtained 1 week apart. Neither planimetry areas nor errors differed significantly
between tests 1 and 2. Data in the column labeled ‘‘Combined’’ include tests 1 and 2 errors.
ADVANCES IN SKIN & WOUND CARE & VOL. 22 NO. 5 226 WWW.WOUNDCAREJOURNAL.COM
ORIGINAL INVESTIGATION
9Copyright @ 200 Lippincott Williams & Wilkins. Unauthorized reproduction of this article is prohibited.
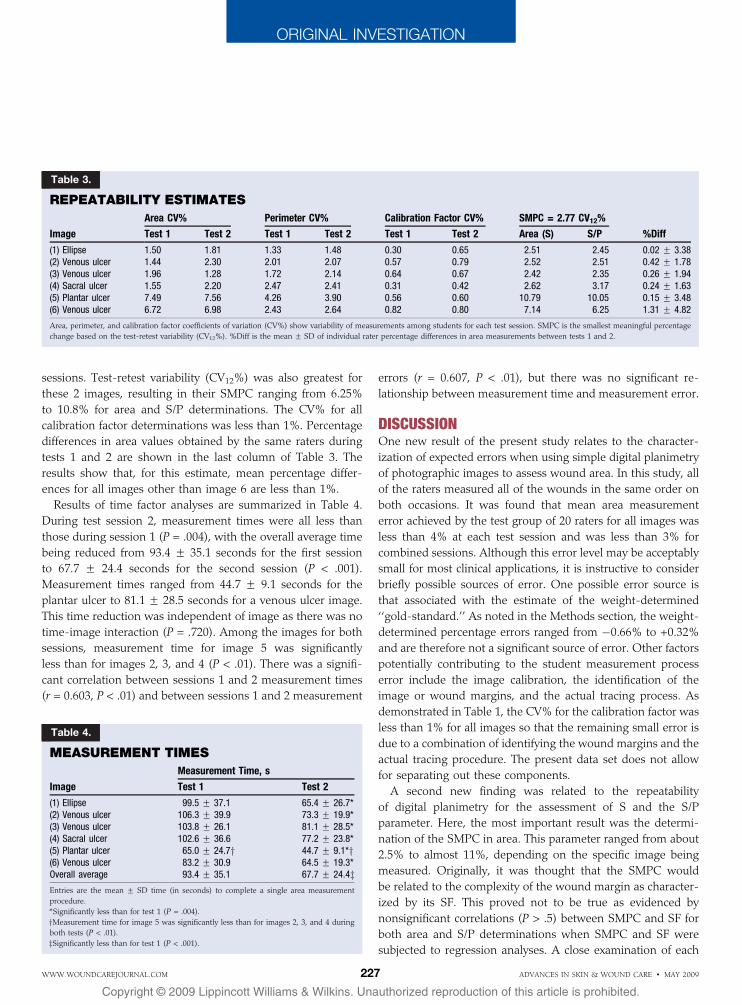
sessions. Test-retest variability (CV12%) was also greatest for
these 2 images, resulting in their SMPC ranging from 6.25%
to 10.8% for area and S/P determinations. The CV% for all
calibration factor determinations was less than 1%. Percentage
differences in area values obtained by the same raters during
tests 1 and 2 are shown in the last column of Table 3. The
results show that, for this estimate, mean percentage differ-
ences for all images other than image 6 are less than 1%.
Results of time factor analyses are summarized in Table 4.
During test session 2, measurement times were all less than
those during session 1 (P = .004), with the overall average time
being reduced from 93.4 F 35.1 seconds for the first session
to 67.7 F 24.4 seconds for the second session (P < .001).
Measurement times ranged from 44.7 F 9.1 seconds for the
plantar ulcer to 81.1 F 28.5 seconds for a venous ulcer image.
This time reduction was independent of image as there was no
time-image interaction (P = .720). Among the images for both
sessions, measurement time for image 5 was significantly
less than for images 2, 3, and 4 (P < .01). There was a signifi-
cant correlation between sessions 1 and 2 measurement times
(r = 0.603, P < .01) and between sessions 1 and 2 measurement
errors (r = 0.607, P < .01), but there was no significant re-
lationship between measurement time and measurement error.
DISCUSSIONOne new result of the present study relates to the character-
ization of expected errors when using simple digital planimetry
of photographic images to assess wound area. In this study, all
of the raters measured all of the wounds in the same order on
both occasions. It was found that mean area measurement
error achieved by the test group of 20 raters for all images was
less than 4% at each test session and was less than 3% for
combined sessions. Although this error level may be acceptably
small for most clinical applications, it is instructive to consider
briefly possible sources of error. One possible error source is
that associated with the estimate of the weight-determined
‘‘gold-standard.’’ As noted in the Methods section, the weight-
determined percentage errors ranged from �0.66% to +0.32%
and are therefore not a significant source of error. Other factors
potentially contributing to the student measurement process
error include the image calibration, the identification of the
image or wound margins, and the actual tracing process. As
demonstrated in Table 1, the CV% for the calibration factor was
less than 1% for all images so that the remaining small error is
due to a combination of identifying the wound margins and the
actual tracing procedure. The present data set does not allow
for separating out these components.
A second new finding was related to the repeatability
of digital planimetry for the assessment of S and the S/P
parameter. Here, the most important result was the determi-
nation of the SMPC in area. This parameter ranged from about
2.5% to almost 11%, depending on the specific image being
measured. Originally, it was thought that the SMPC would
be related to the complexity of the wound margin as character-
ized by its SF. This proved not to be true as evidenced by
nonsignificant correlations (P > .5) between SMPC and SF for
both area and S/P determinations when SMPC and SF were
subjected to regression analyses. A close examination of each
Table 4.
MEASUREMENT TIMES
Image
Measurement Time, s
Test 1 Test 2
(1) Ellipse 99.5 F 37.1 65.4 F 26.7*(2) Venous ulcer 106.3 F 39.9 73.3 F 19.9*(3) Venous ulcer 103.8 F 26.1 81.1 F 28.5*(4) Sacral ulcer 102.6 F 36.6 77.2 F 23.8*(5) Plantar ulcer 65.0 F 24.7y 44.7 F 9.1*y(6) Venous ulcer 83.2 F 30.9 64.5 F 19.3*Overall average 93.4 F 35.1 67.7 F 24.4zEntries are the mean F SD time (in seconds) to complete a single area measurement
procedure.
*Significantly less than for test 1 (P = .004).
yMeasurement time for image 5 was significantly less than for images 2, 3, and 4 during
both tests (P < .01).
zSignificantly less than for test 1 (P < .001).
Table 3.
REPEATABILITY ESTIMATES
Image
Area CV% Perimeter CV% Calibration Factor CV% SMPC = 2.77 CV12%
%DiffTest 1 Test 2 Test 1 Test 2 Test 1 Test 2 Area (S) S/P
(1) Ellipse 1.50 1.81 1.33 1.48 0.30 0.65 2.51 2.45 0.02 F 3.38(2) Venous ulcer 1.44 2.30 2.01 2.07 0.57 0.79 2.52 2.51 0.42 F 1.78(3) Venous ulcer 1.96 1.28 1.72 2.14 0.64 0.67 2.42 2.35 0.26 F 1.94(4) Sacral ulcer 1.55 2.20 2.47 2.41 0.31 0.42 2.62 3.17 0.24 F 1.63(5) Plantar ulcer 7.49 7.56 4.26 3.90 0.56 0.60 10.79 10.05 0.15 F 3.48(6) Venous ulcer 6.72 6.98 2.43 2.64 0.82 0.80 7.14 6.25 1.31 F 4.82
Area, perimeter, and calibration factor coefficients of variation (CV%) show variability of measurements among students for each test session. SMPC is the smallest meaningful percentage
change based on the test-retest variability (CV12%). %Diff is the mean F SD of individual rater percentage differences in area measurements between tests 1 and 2.
ADVANCES IN SKIN & WOUND CARE & MAY 2009227WWW.WOUNDCAREJOURNAL.COM
ORIGINAL INVESTIGATION
9Copyright @ 200 Lippincott Williams & Wilkins. Unauthorized reproduction of this article is prohibited.
image’s features suggests that a more important aspect is the
level of ambiguity with which the wound margin could be
determined. For the ellipse, the 2 drawn venous ulcers, and for
the sacral ulcer image, the location of the margin was well
defined. Measurements of these resulted in the lowest SMPC,
with area SMPC values tightly distributed between 2.42% and
2.62%. In contrast, measurement of the plantar and venous
ulcer photographic images required the students to make
judgments as to what constituted the actual wound margin.
Measurements of these images resulted in considerably larger
SMPC values. Consequently, the authors suspect that the larg-
est source of variability, and therefore the main determinant of
a wound-specific SMPC, is the ambiguity of the wound margin
selection among evaluators. The percentage difference in area
values obtained by the same raters on the 2 separate evaluation
sessions (Table 3) suggests that better repeatability results for
more complex wound margins would be obtained when the
same rater evaluated the wounds on both occasions.
The present study results apply strictly to the outcomes
achieved using the software algorithms used and to the specific
group of raters who participated. Although all the raters had
been trained in the principles of wound care and completed
rotations through wound care–related clinics, their wound
care experience was limited. Thus, the goal to include a large
enough sample to provide a reasonable generalization of study
results was probably only partially met, in the sense that the
results generalize to student nurses with similar training. It would
be expected that, at least for those measurements associated with
the less-defined wound margins, more experienced wound care
specialists would achieve as good an outcome. An investigation
into this aspect requires further research.
CONCLUSIONSPressure ulcers are a significant problem in hospitalized
patients, as well as in those receiving treatment in skilled
nursing facilities and home healthcare settings. Nurses and
therapists in various areas of practice encounter patients with
wounds of various types, shapes, and sizes. Throughout entry-
level (prelicensure) and other programs, students are provided
with content regarding the care of patients with alterations
in skin integrity, including those with wounds. Careful and
accurate assessment is stressed as an essential component to
treatment decisions and modifications. It is emphasized that
information obtained during baseline and ongoing assess-
ments of a wound provides the healthcare team with data on
which the progression or regression of wound healing can be
closely monitored. Because multiple members of the healthcare
team may be involved in assessing a wound for change over
time, the need for an objective means of assessment is sub-
stantially increased. For the first-line professional involved in
wound assessments, it is beneficial to have a means to objectify
and report assessment data. Clear, understandable, relevant,
and comprehensive documentation helps to ensure continuity
and ultimately better patient outcomes.
The results of this study, compiled in a limited sample,
support the use of computerized planimetry software as an
objective method for the ongoing assessment of wounds in
clinical practice. Repeatability results and interrater reliability
support the clinical applicability when multiple practitioners
are required to assess the wounds of a given patient. Further
research is warranted using graduate nurses, as well as certified
wound care specialists.
In summary, the study suggests that computerized planim-
etry of digitized wound photographs using the present soft-
ware is an accurate and reliable way to measure and document
wound areas and an associated wound closure parameter,
defined as the ratio of wound surface area to perimeter.&REFERENCES
1. Bohannon RW, Pfaller BA. Documentation of wound surface area from tracings of wound
perimeters. Clinical report on three techniques. Phys Ther 1983;63:1622-4.
2. Charles H. Wound assessment: measuring the area of a leg ulcer. Br J Nurs 1998;
7:765-8, 770, 772.
3. Flanagan M. Improving accuracy of wound measurement in clinical practice. Ostomy
Wound Manage 2003;49(10):28-40.
4. Flanagan M. Wound measurement: can it help us to monitor progression to healing?
J Wound Care 2003;12(5):189-94.
5. Gorin DR, Cordts PR, LaMorte WW, Manzoian JO. The influence of wound geometry on
the measurement of wound healing rates in clinical trials. J Vasc Surg 1996;23:524-8.
6. Grey JE, Enoch S, Harding KG. Wound assessment. BMJ 2006;332:285-8.
7. Haghpanah S, Bogie K, Wang X, Banks PG, Ho CH. Reliability of electronic versus
manual wound measurement techniques. Arch Phys Med Rehabil 2006;87:1396-402.
8. Harding KG. Methods for assessing change in ulcer status. Adv Wound Care 1995;8(4):
S37-42.
9. Shaw J, Hughes CM, Lagan KM, Bell PM, Stevenson MR. An evaluation of three wound
measurement techniques in diabetic foot wounds. Diabetes Care 2007;30:2641-2.
10. Gethin G, Cowman S. Wound measurement comparing the use of acetate tracings and
Visitrak digital planimetry. J Clin Nurs 2006;15(4):422-7.
11. Griffin JW, Tolley EA, Tooms RE, Reyes RA, Clifft JK. A comparison of photographic and
transparency-based methods for measuring wound surface area. Phys Ther 1993;73:
117-22.
12. Hayward PG, Hillman GR, Quast MJ, Robson MC. Surface area measurement of pres-
sure sores using wound molds and computerized imaging. J Am Geriatr Soc 1993;41:
238-40.
13. Johnson JD. Using ulcer surface area and volume to document wound size. J Am Podiatr
Med Assoc 1995;85(2):91-5.
14. Langemo DK, Melland H, Hanson D, Olson B, Hunter S, Henly SJ. Two-dimensional
wound measurement: comparison of 4 techniques. Adv Wound Care 1998;11:337-43.
15. Lucas C, Classen J, Harrison D, De H. Pressure ulcer surface area measurement using
instant full-scale photography and transparency tracings. Adv Skin Wound Care 2002;
15(1):17-23.
16. Wunderlich RP, Peters EJ, Armstrong DG, Lavery LA. Reliability of digital videometry and
acetate tracing in measuring the surface area of cutaneous wounds. Diabetes Res Clin
Pract 2000;49(2-3):87-92.
17. Thawer HA, Houghton PE, Woodbury MG, Keast D, Campbell K. A comparison of
computer-assisted and manual wound size measurement. Ostomy Wound Manage
2002;48(10):46-53.
ADVANCES IN SKIN & WOUND CARE & VOL. 22 NO. 5 228 WWW.WOUNDCAREJOURNAL.COM
ORIGINAL INVESTIGATION
9Copyright @ 200 Lippincott Williams & Wilkins. Unauthorized reproduction of this article is prohibited.
18. Mayrovitz HN. Shape and area measurement considerations in the assessment of
diabetic plantar ulcers. Wounds 1997;9:21-8.
19. Mayrovitz HN, Smith J, Ingram C. Geometric, shape and area measurement considera-
tions for diabetic neuropathic plantar ulcers. Ostomy Wound Manage 1997;43(9):58-64.
20. Mayrovitz HN, Smith J, Ingram C. Comparisons of venous and diabetic plantar ulcer
shape and area. Adv Wound Care 1998;11:176-83.
21. Kantor J, Margolis DJ. Efficacy and prognostic value of simple wound measurements.
Arch Dermatol 1998;134(12):1571-4.
22. Thomas AC, Wysocki AB. The healing wound: a comparison of three clinically useful
methods of measurement. Decubitus 1990;3(1):18-20, 24-5.
23. Cukjati D, Rebersek S, Karba R, Miklavcic D. Modelling of chronic wound healing
dynamics. Med Biol Eng Comput 2000;38(3):339-47.
24. Cukjati D, Rebersek S, Miklavcic D. A reliable method of determining wound healing rate.
Med Biol Eng Comput 2001;39:263-71.
25. Cukjati D, Robnik-Sikonja M, Rebersek S, Kononenko I, Miklavcic D. Prognostic factors in
the prediction of chronic wound healing by electrical stimulation. Med Biol Eng Comput
2001;39(5):542-50.
26. Gilman TH. Parameter for measurement of wound closure. Wounds 1990;2(3):95-101.
27. Margolis DJ, Gross EA, Wood CR, Lazarus GS. Planimetric rate of healing in venous
ulcers of the leg treated with pressure bandage and hydrocolloid dressing. J Am Acad
Dermatol 1993;28:418-21.
28. Majeske C. Reliability of wound surface area measurements. Phys Ther 1992;72:138-41.
29. Portney L, Watkins M. Statistical Measures of Reliability. Englewood Cliffs, NJ: Prentice
Hall; 1993.
30. Lexell JE, Downham DY. How to assess the reliability of measurements in rehabilitation.
Am J Phys Med Rehabil 2005;84:719-23.
31. Bland M, Altman D. Measurement error. BMJ 1996;313(7059):744.
Get fast news updates on thelatest developments in theskin and wound care field.
Sign up for our free monthly eNews andwe’ll send you cutting edge information onwhat’s new in skin and wound care, pluswe’ll include free links to Bonus Contentand CME articles.
It’s easy and it’s free.To register, visithttp://www.nursingcenter.com/aswcenews
Advances in
eNEWSSKIN&WOUND CARESKIN&WOUND CARE
If you perform wound care or work with diabetic or high-risk patients…
APWCA...is your link to information, education, and more!
Join APWCA today! Benefits include:Information on advances and trends in wound care, via:
a subscription to the peer-reviewed, MEDLINE-indexed journal, Advances in Skin & Wound Carenewsletters, e-mail updates, and moreconsultation for difficult cases
Pacesetting education at meetings throughout the year, including the APWCA National Conference
Networking with leaders and your peers in the field
Representation to address insurance and governmental issues that affect your ability to provide quality patient care.
Council for Medical Education and Testing (CMET) is now offering certification in wound care specifically for Physicians (MD, DO, DPM). For more information visit www.CouncilMET.org or call 215.364.4100.
Join APWCA TODAY!For more information about APWCA…
Visit www.apwca.orgEmail [email protected] 215-364-4100
The American Professional Wound Care Association [APWCA] welcomes members of ALL clinical disciplines (MD, DO, DPM, RN, NP, PT, PhD, RD, etc.) committed to excellence in clinical wound care and research.
215-364-4100 • www.apwca.org
Attend APWCA’s Review Course:“The Essentials — A Comprehensive Review Course on Wound Care Management and Intervention”
September 12–13, 2009 Philadelphia, PA
Contact APWCA TODAY for details!
ORIGINAL INVESTIGATION
ADVANCES IN SKIN & WOUND CARE & MAY 2009229WWW.WOUNDCAREJOURNAL.COM
9Copyright @ 200 Lippincott Williams & Wilkins. Unauthorized reproduction of this article is prohibited.