Embed Size (px)
Citation preview

11
2017The Nordic’s Most Attractive Employers
Students

2
AGENDA
Nordic rankings methodology
Agenda
123
3
Nordic rankings & trends
Summary
Targeting the right potential candidates
Rationalising your creative spend
Building brand awareness and equity
Enhancing your pulling power
The cost benefits of a strong Employer Brand
2017
Hiring good people for less
Reducing unwanted attrition.
1 2 3
4 5 6
3Source: ‘Employer Brand Management’ by Richard Mosley
Cost savings derive from a number of factors...
You are less likely to waste money attracting the wrong kind of candidates when being clear
about who you are targeting
A consistent approach and focusing on a single creative framework with a selection of creative assets will save costs
A positive brand image generates a brand ‘halo’ that brings
beneficial effects (and cost savings) to every aspect of
marketing activity
In addition to more cost effective ‘push’ marketing, a strong
employer brand image will ‘pull’ a much higher proportion of unsolicited applications
The stronger your employer brand is, the less salary increase
will be required when trying to convince a candidate to leave an
organization and join yours
If you’re clear in your messaging towards your target group and deliver on your employer brand
promises, you’re likely to enjoy a lower level of employee turnover
4
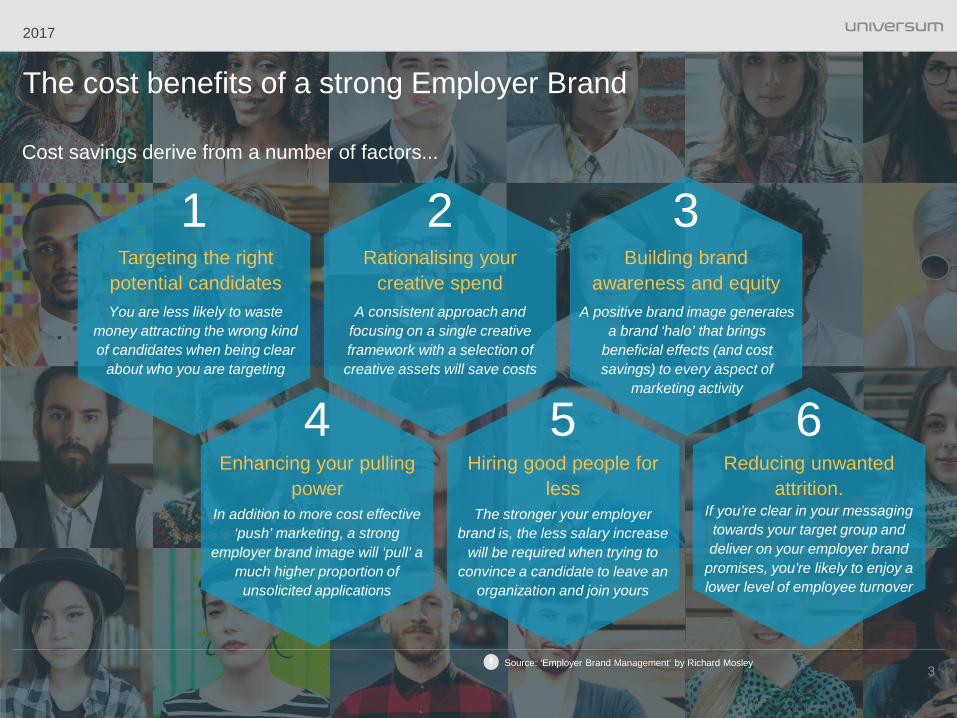
Summary of insights | Nordic rankings 20174
Business trends• Auditing and Accounting together with Banking remain on top of
the Nordic student industry ranking.• The top 3 in the Nordic ranking remain stable, however, Nordea
lost its fourth place position to McKinsey & Company. • FMCG is the most represented industry among Nordic business
students, followed by Management Consulting and Banks.
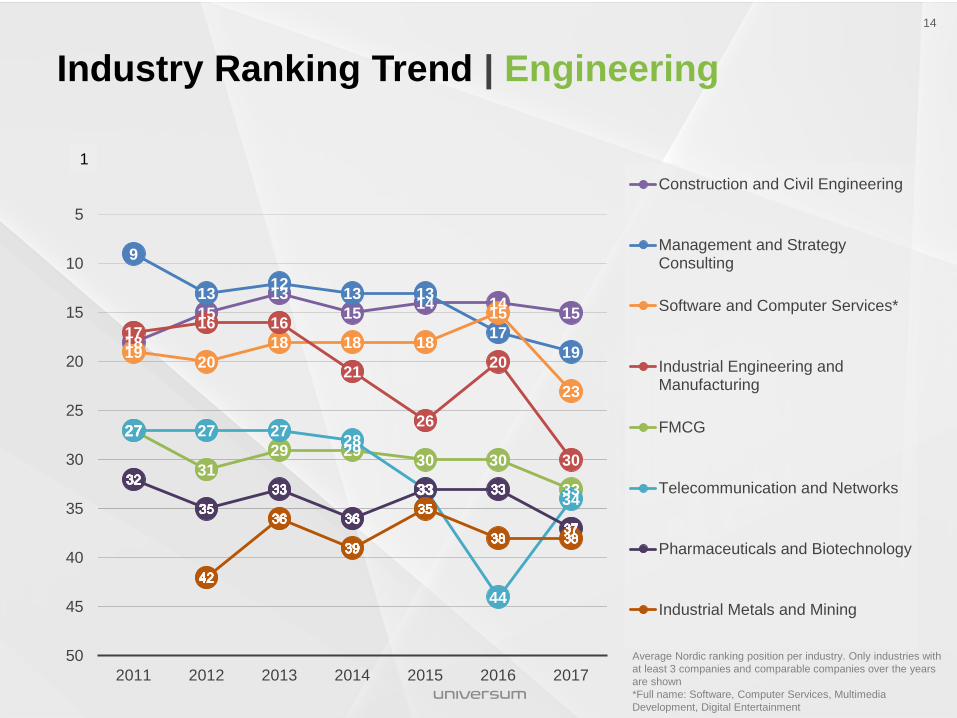
Engineering trends• The rise in interest of Telecommunication & Services has led it
to become the most attractive industry for Nordic engineering students to work for. Industrial Engineering, Manufacturing and Software & Computer Services industry have dropped the most in the rankings.
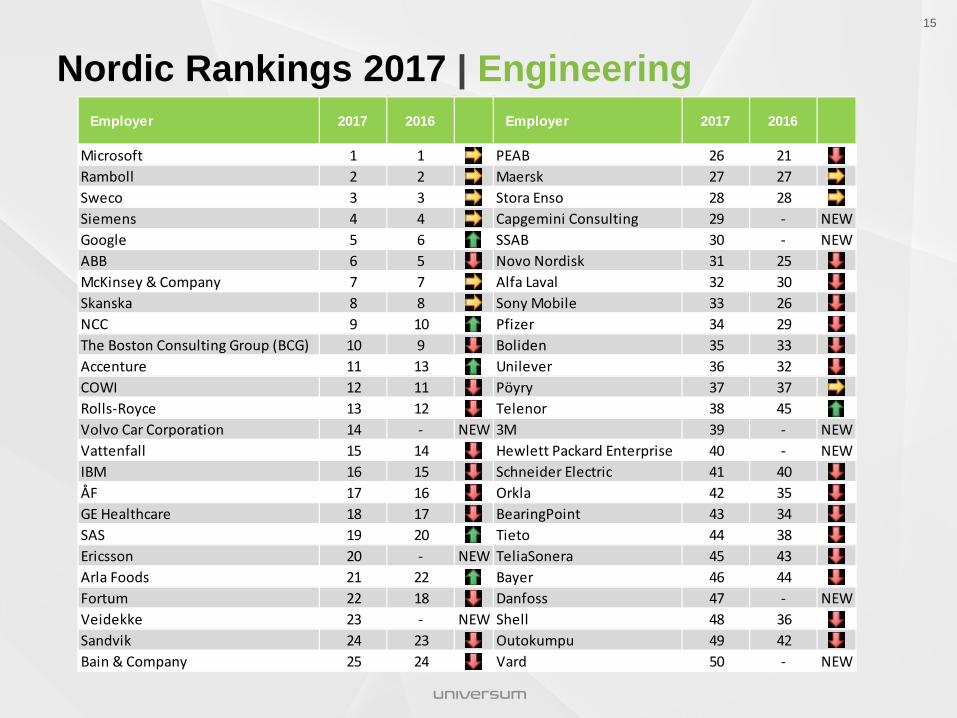
• Significant stability among the top 10 ideal Nordic employers. Google managed to increase their standing over ABB, while BCG lost their 9th place position to NCC.
• There are a total of 9 new companies on the Nordic engineering ranking, the most successful newcomer is Volvo Car Corporation, making its debut in 14th place.
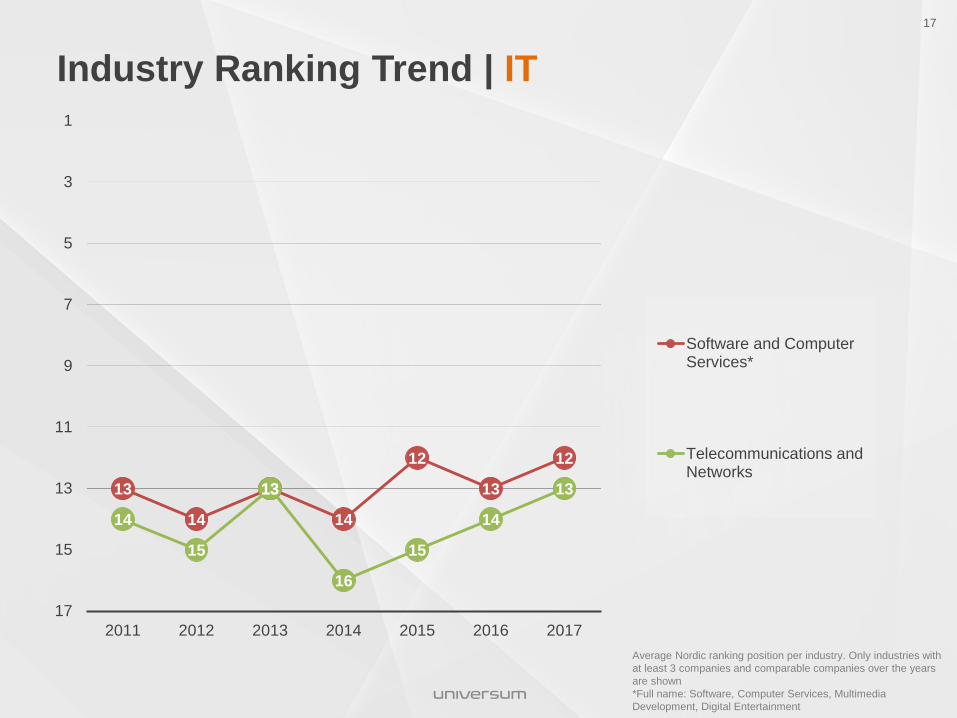
IT trends• There are no changes to the top 5 employers since 2016, while
Visma entered the top 10 for the first time.• Software & Computer Services is the most represented industry
and now outranks Telecommunications & Networks in the Nordic ranking.
• SAS Institute gained 7 places in the Nordic ranking 2017 among IT students, while Hewlett Packard Enterprise are dropped 3 positions and are no longer in the top 10.
Career Goals• “Work/life balance” is the top career goal in Sweden and Finland
and the second most important in Norway and Denmark.• All Nordic students want “to be competitively or intellectually
challenged” – they chose it as their third most important career goal.
• The career goals are unchanged in Norway and Sweden since 2016 but “to be dedicated to a cause or to feel that I am serving a greater good” has become more important in Denmark.
Preferences• With the exception of Sweden, all Nordic Engineering students
have “a friendly work environment” among their top two preferences.
• With the exception of Sweden, all Nordic business students chose “Leadership opportunities” among their top 3 preferences.
• For IT students, “high future earnings” are a top 3 preference in all markets except in Finland.
Preferred Industries• Management Consulting is becoming a more popular industry in
the Nordic business ranking.• Successful newcomers have created movement in the Nordic
engineering ranking, however Construction and Civil Engineering remains as the most popular industry.
5
SWEDEN
5
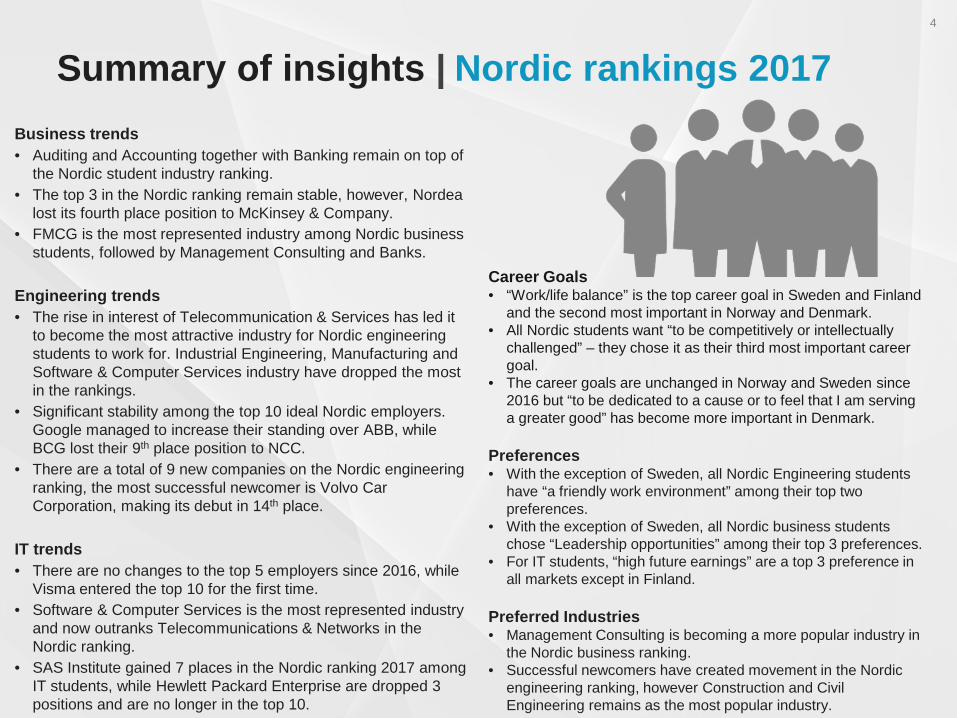
Top 3 Career Goals
1. To have work/life balance2. To be secure or stable in my job3. To be competitively or intellectually
challenged
Top 3 Career Goals1. To have work/life balance2. To be dedicated to a cause or to feel
that I am serving a greater good3. To be competitively or intellectually
challengedTop 3 Career Goals
1. To be secure or stable in my job2. To have work/life balance3. To be competitively or intellectually
challenged
Top 3 Career Goals1. To be dedicated to a cause or to feel that I am
serving a greater good2. To have work/life balance3. To be competitively or intellectually challenged
2017 Nordic rankings Top Career Goals for Business, Engineering & IT students

6
AGENDA
Nordic rankings methodology
Agenda
123
3
Nordic rankings & trends
Summary
77
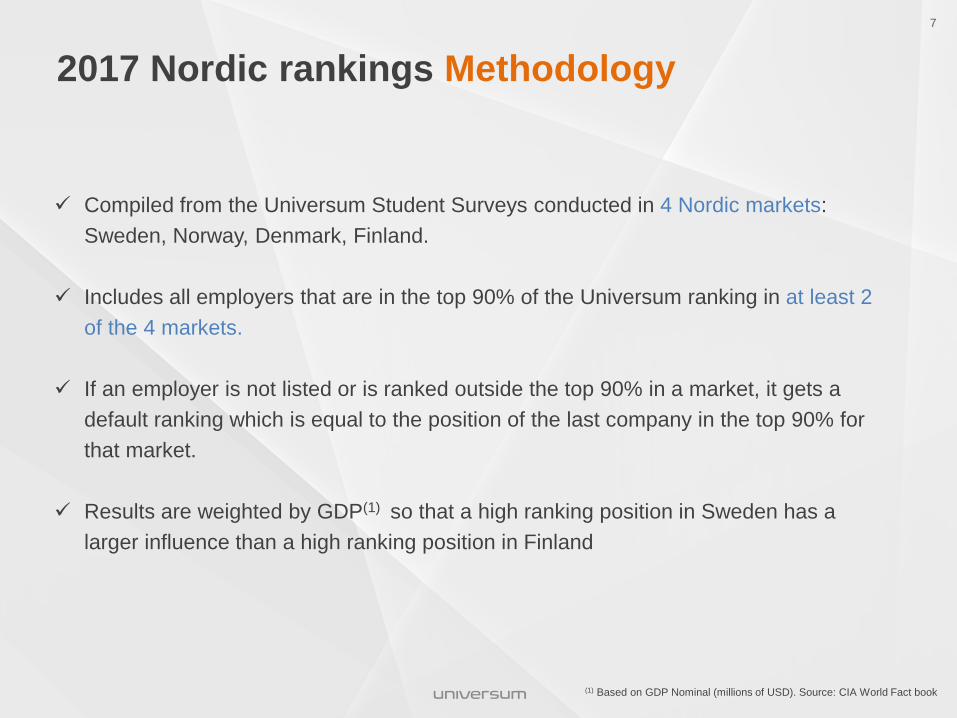
Compiled from the Universum Student Surveys conducted in 4 Nordic markets: Sweden, Norway, Denmark, Finland.
Includes all employers that are in the top 90% of the Universum ranking in at least 2 of the 4 markets.
If an employer is not listed or is ranked outside the top 90% in a market, it gets a default ranking which is equal to the position of the last company in the top 90% for that market.
Results are weighted by GDP(1) so that a high ranking position in Sweden has a larger influence than a high ranking position in Finland
2017 Nordic rankings Methodology7
(1) Based on GDP Nominal (millions of USD). Source: CIA World Fact book
88
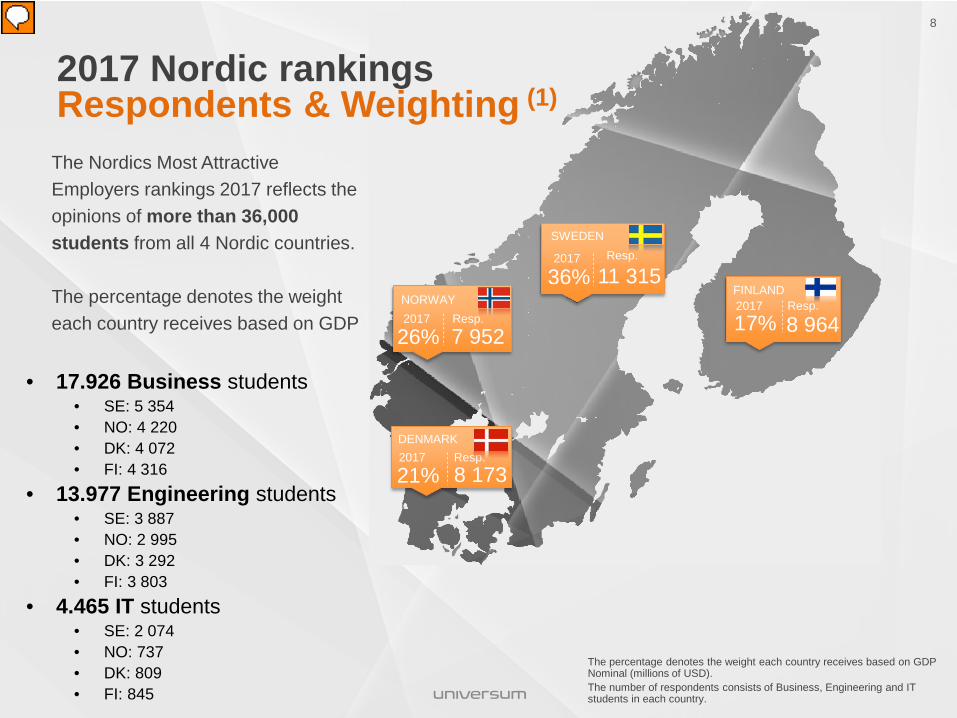
2017 Nordic rankings Respondents & Weighting (1)
SWEDEN
36%2017
FINLAND
17%2017
8 964Resp.NORWAY
26%2017
7 952Resp.
DENMARK
21%2017
8 173Resp.
8
The percentage denotes the weight each country receives based on GDP Nominal (millions of USD). The number of respondents consists of Business, Engineering and IT students in each country.
Resp.
The Nordics Most Attractive Employers rankings 2017 reflects the opinions of more than 36,000 students from all 4 Nordic countries.
The percentage denotes the weight each country receives based on GDP
• 17.926 Business students• SE: 5 354• NO: 4 220• DK: 4 072• FI: 4 316
• 13.977 Engineering students• SE: 3 887• NO: 2 995• DK: 3 292• FI: 3 803
• 4.465 IT students• SE: 2 074• NO: 737• DK: 809• FI: 845
11 315
9
AGENDA
Nordic rankings methodology
Agenda
123
3
Nordic rankings & trends
Summary
1010
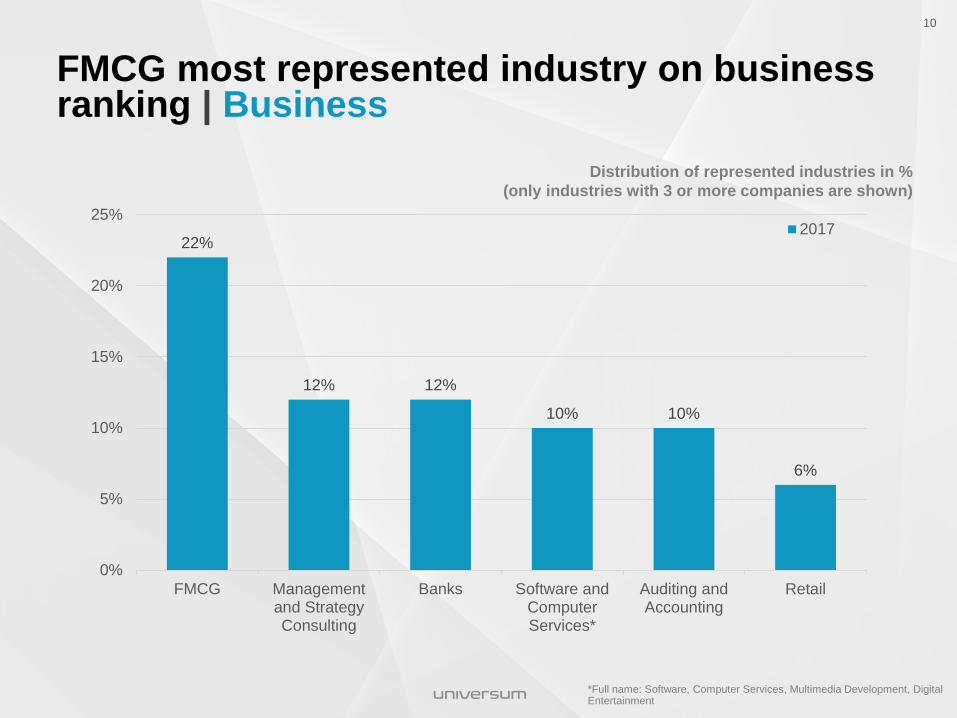
FMCG most represented industry on business ranking | Business
10
22%
12% 12%
10% 10%
6%
0%
5%
10%
15%
20%
25%
FMCG Managementand StrategyConsulting
Banks Software andComputerServices*
Auditing andAccounting
Retail
2017
Distribution of represented industries in %(only industries with 3 or more companies are shown)
*Full name: Software, Computer Services, Multimedia Development, Digital Entertainment

1111
Industry ranking trend | Business11
1211
1210
9
4
1818
14
111113
2223
242323
222121
17
2425
26
22
18
21
292927
242323
0
5
10
15
20
25
30
35201720162015201420132012
Auditing and Accounting
Banks
Retail
Management and StrategyConsulting
Software and Computer Services*
FMCG
1
Average Nordic ranking position per industry. Only industries with at least 3 companies and comparable companies over the years are shown *Full name: Software, Computer Services, Multimedia Development, Digital Entertainment
121212
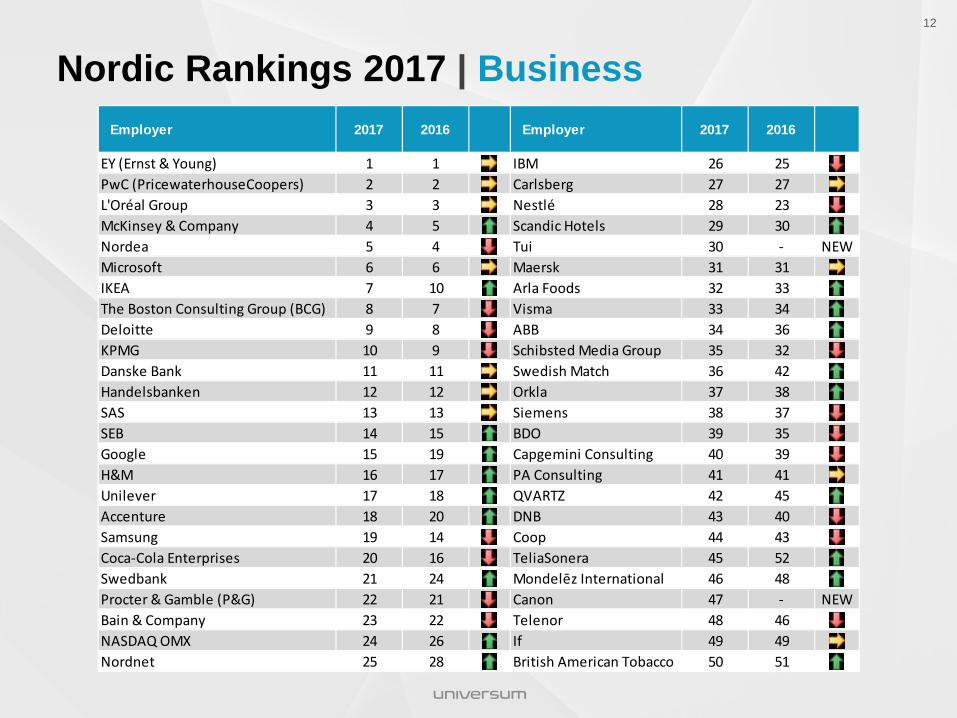
Nordic Rankings 2017 | BusinessEmployer 2017 2016 Employer 2017 2016
EY (Ernst & Young) 1 1 IBM 26 25PwC (PricewaterhouseCoopers) 2 2 Carlsberg 27 27L'Oréal Group 3 3 Nestlé 28 23McKinsey & Company 4 5 Scandic Hotels 29 30Nordea 5 4 Tui 30 - NEWMicrosoft 6 6 Maersk 31 31IKEA 7 10 Arla Foods 32 33The Boston Consulting Group (BCG) 8 7 Visma 33 34Deloitte 9 8 ABB 34 36KPMG 10 9 Schibsted Media Group 35 32Danske Bank 11 11 Swedish Match 36 42Handelsbanken 12 12 Orkla 37 38SAS 13 13 Siemens 38 37SEB 14 15 BDO 39 35Google 15 19 Capgemini Consulting 40 39H&M 16 17 PA Consulting 41 41Unilever 17 18 QVARTZ 42 45Accenture 18 20 DNB 43 40Samsung 19 14 Coop 44 43Coca-Cola Enterprises 20 16 TeliaSonera 45 52Swedbank 21 24 Mondelēz International 46 48Procter & Gamble (P&G) 22 21 Canon 47 - NEWBain & Company 23 22 Telenor 48 46NASDAQ OMX 24 26 If 49 49Nordnet 25 28 British American Tobacco 50 51

1313
Construction is the most represented industry | Engineering
13
18%16%
12%10%
6% 6% 6% 6%
0%2%4%6%8%
10%12%14%16%18%20%
2017
Distribution of represented industries in %(only industries with 3 or more companies are shown)
*Full name: Software, Computer Services, Multimedia Development, Digital Entertainment and Industrial Engineering and Manufacturing **Full name: Industrial Engineering and Manufacturing**
1414
Industry Ranking Trend | Engineering14
1514141513
15
18 1917
13131213
9
23
15
1818182019
30
20
26
21
161617
33
3030292931
27
34
44
33
28272727
0
5
10
15
20
25
30
35
40
45
502017201620152014201320122011
Construction and Civil Engineering
Management and StrategyConsulting
Software and Computer Services*
Industrial Engineering andManufacturing
FMCG
Telecommunication and Networks
Pharmaceuticals and Biotechnology
Industrial Metals and Mining
1
Average Nordic ranking position per industry. Only industries with at least 3 companies and comparable companies over the years are shown *Full name: Software, Computer Services, Multimedia Development, Digital Entertainment
151515
Nordic Rankings 2017 | EngineeringEmployer 2017 2016 Employer 2017 2016
Microsoft 1 1 PEAB 26 21Ramboll 2 2 Maersk 27 27Sweco 3 3 Stora Enso 28 28Siemens 4 4 Capgemini Consulting 29 - NEWGoogle 5 6 SSAB 30 - NEWABB 6 5 Novo Nordisk 31 25McKinsey & Company 7 7 Alfa Laval 32 30Skanska 8 8 Sony Mobile 33 26NCC 9 10 Pfizer 34 29The Boston Consulting Group (BCG) 10 9 Boliden 35 33Accenture 11 13 Unilever 36 32COWI 12 11 Pöyry 37 37Rolls-Royce 13 12 Telenor 38 45Volvo Car Corporation 14 - NEW 3M 39 - NEWVattenfall 15 14 Hewlett Packard Enterprise 40 - NEWIBM 16 15 Schneider Electric 41 40ÅF 17 16 Orkla 42 35GE Healthcare 18 17 BearingPoint 43 34SAS 19 20 Tieto 44 38Ericsson 20 - NEW TeliaSonera 45 43Arla Foods 21 22 Bayer 46 44Fortum 22 18 Danfoss 47 - NEWVeidekke 23 - NEW Shell 48 36Sandvik 24 23 Outokumpu 49 42Bain & Company 25 24 Vard 50 - NEW
1616
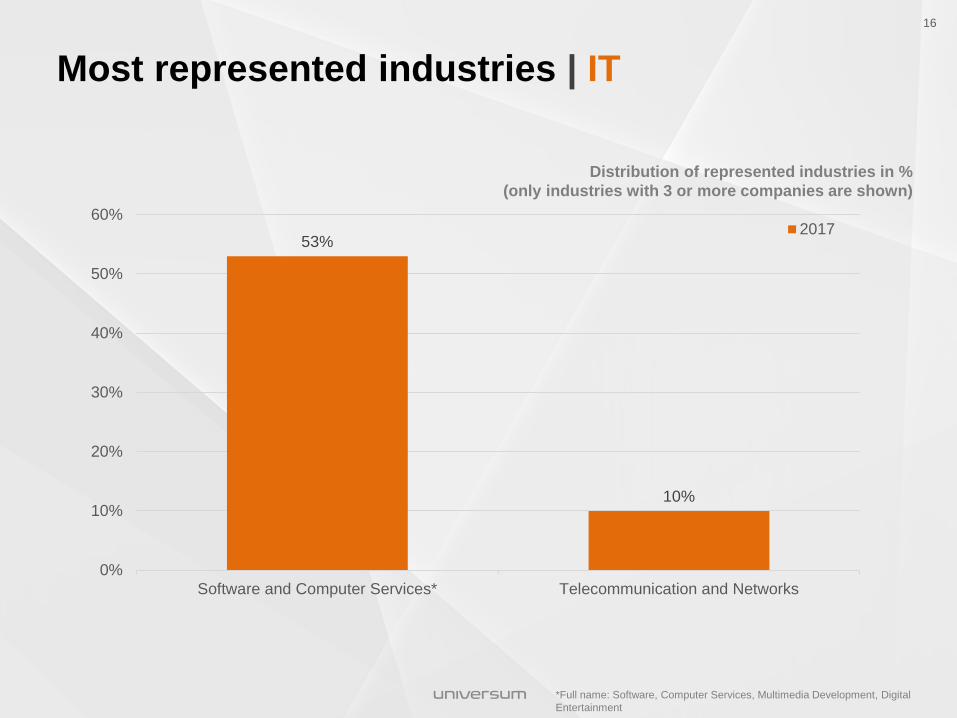
Most represented industries | IT16
53%
10%
0%
10%
20%
30%
40%
50%
60%
Software and Computer Services* Telecommunication and Networks
2017
Distribution of represented industries in %(only industries with 3 or more companies are shown)
*Full name: Software, Computer Services, Multimedia Development, Digital Entertainment
1717
Industry Ranking Trend | IT17
12
13
12
14
13
14
13 13
14
15
16
13
15
14
1
3
5
7
9
11
13
15
172017201620152014201320122011
Software and ComputerServices*
Telecommunications andNetworks
Average Nordic ranking position per industry. Only industries with at least 3 companies and comparable companies over the years are shown *Full name: Software, Computer Services, Multimedia Development, Digital Entertainment
181818
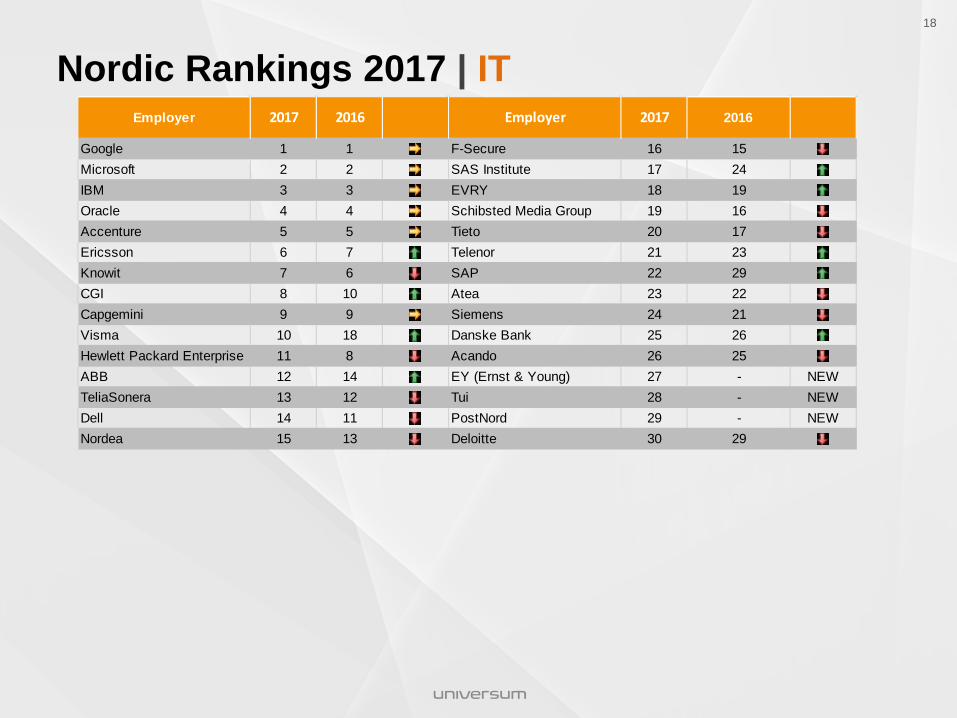
Nordic Rankings 2017 | IT
Google 1 1 F-Secure 16 15Microsoft 2 2 SAS Institute 17 24IBM 3 3 EVRY 18 19Oracle 4 4 Schibsted Media Group 19 16Accenture 5 5 Tieto 20 17Ericsson 6 7 Telenor 21 23Knowit 7 6 SAP 22 29CGI 8 10 Atea 23 22Capgemini 9 9 Siemens 24 21Visma 10 18 Danske Bank 25 26Hewlett Packard Enterprise 11 8 Acando 26 25ABB 12 14 EY (Ernst & Young) 27 - NEWTeliaSonera 13 12 Tui 28 - NEWDell 14 11 PostNord 29 - NEWNordea 15 13 Deloitte 30 29
2017Employer 20162017 2016 Employer
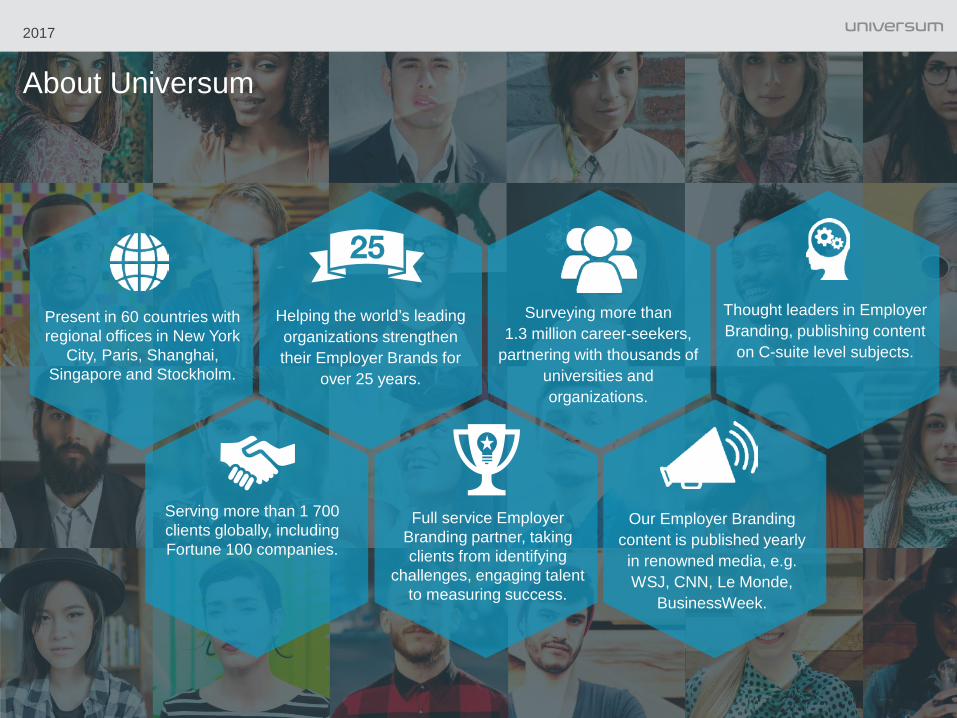
Present in 60 countries with regional offices in New York
City, Paris, Shanghai, Singapore and Stockholm.
Serving more than 1 700 clients globally, including Fortune 100 companies.
Full service Employer Branding partner, taking clients from identifying
challenges, engaging talent to measuring success.
Helping the world’s leading organizations strengthen their Employer Brands for
over 25 years.
Surveying more than 1.3 million career-seekers,
partnering with thousands of universities and organizations.
Thought leaders in Employer Branding, publishing content
on C-suite level subjects.
Our Employer Branding content is published yearly in renowned media, e.g. WSJ, CNN, Le Monde,
BusinessWeek.
About Universum
2017

Are you ready to take the next step in your Employer Branding journey?