Embed Size (px)
Citation preview

www.frost.com
World Intrusion Detection and Prevention Systems
Markets
N22B-74

#N22B-74 © 2007 Frost & Sullivan www.frost.com
Frost & Sullivan takes no responsibility for any incorrect
information supplied to us by manufacturers or users.
Quantitative market information is based primarily on
interviews and therefore is subject to fluctuation.
Frost & Sullivan reports are limited publications con-
taining valuable market information provided to a select
group of customers in response to orders. Our customers
acknowledge when ordering that Frost & Sullivan reports
are for our customers’ internal use and not for general
publication or disclosure to third parties.
No part of this report may be given, lent, resold, or
disclosed to non-customers without written permission.
Furthermore, no part may be reproduced, stored in a
retrieval system, or transmitted in any form or by any
means, electronic, mechanical, photocopying, recording,
or otherwise, without the permission of the publisher.
For information regarding permission, write:
Frost & Sullivan
2400 Geng Road, Suite 201
Palo Alto, CA 94303-3331
United States

Table of Contents
C h a p t e r 1
Executive Summary
Executive Summary 1-1
Market Overview and Definitions 1-1
Market Definitions 1-2
Key Market Drivers and Restraints 1-3
Ability for IDS/IPS Technology to Serve Network Monitoring and Diagnostics
Functions Creates Value Added 1-4
Key Findings and Conclusion 1-4
Network IDS/IPS Appliances 1-5
Network IDS/IPS Software 1-6
Host IDS/IPS 1-6
C h a p t e r 2
Total Intrusion Detection and Prevention Systems Market
Market Drivers and Restraints 2-1
Market Overview and Introduction 2-1
Market Drivers 2-3
Government Legislation Imposes Regulations Requiring Increased Security Levels 2-3
Increased Budgets For IDS/IPS Products 2-4
Increasingly Complex Attacks, Increased Incidents, and Negative Publicity
Perpetuate Demand for Sophisticated Security Solutions 2-4
Increasing Deployment Opportunities for Host IDS/IPS 2-5
Incessant System Vulnerabilities and Software Patches Create a Need for a Safety Net 2-5
Maturing Security Market Emphasizes Layered Security Architectures 2-5
IDS/IPS Solutions Enable Network Forensics Upon Attack 2-6
Geographical Market Expansion Increases Addressable Market 2-6
#N22B-74 © 2007 Frost & Sullivan www.frost.com iii

Market Restraints 2-6
Political and Organizational Dynamics Stall Deployments 2-7
Demand for On-Site Trials Increasing Sales Cycles 2-7
Organizations Looking at Alternate Enforcement Technologies 2-7
Other Higher Priority Items Reduce Spending on IDS/IPS 2-8
High Level of Expertise Required for IDS/IPS Solution Maintenance Increase TCO 2-8
Historical Problems With IDS Technology Has Damaged the Market’s Reputation 2-8
Competition From Inexpensive Open Source Alternatives Reduces
Demand for Commercial Solutions 2-9
Continued Use of Legacy Servers and Applications Create an Installed Base
that is Not Interoperable With Host Based Solutions 2-9
Lack of a Quantifiable ROI 2-9
Market Trends and Forecasts 2-10
Market Engineering Measurements 2-10
Market Stage 2-11
Number of Competitors 2-11
Degree of Technical Change 2-11
Customer Satisfaction 2-12
Market Concentration 2-12
Revenue Forecasts 2-12
Network IDS/IPS Hardware Appliances 2-13
Network IDS/IPS Software 2-15
Host IDS/IPS Software 2-16
Geographic Trends 2-19
North America 2-20
EMEA 2-21
APAC 2-21
Latin America 2-21
Vertical Market Analysis 2-22
Financial Markets 2-23
Government Markets 2-24
Technology and Telecom Based Businesses 2-24
Healthcare Markets 2-25
Utilities Markets 2-25
Other Markets 2-26
#N22B-74 © 2007 Frost & Sullivan www.frost.com iv

Technology Trends 2-26
Intrusion Detection versus Intrusion Prevention 2-26
Vulnerability Assessment 2-27
HIPS Options 2-27
Signatures, Anomalies, and Policies 2-28
All In One Security Devices 2-28
Management Versus Sensors 2-29
Standards 2-30
IPv6 2-30
Distribution Channel Analysis 2-30
MSSPs 2-31
Pricing Analysis 2-32
Legislation Impacting the IDS/IPS Market 2-35
Legislation 2-35
Payment Card Industry (PCI) Data Security Standard 2-35
HIPAA 2-35
Gramm-Leach-Bliley (GLB) Act 2-36
California Security Breach Information Act (SB 1386) 2-36
Sarbanes-Oxley Act (Sarb-Ox) 2-37
Homeland Security 2-37
European Legislation 2-37
Basel II 2-38
U.K. Companies (Audit, Investigations and Community Enterprise) Bill 2-38
IDS/IPS Certification 2-38
NSS Labs 2-38
NSS Tested 2-39NSS Approved 2-39NSS Gold 2-39
ICSA Certification 2-40
Common Criteria Certification 2-41
Vendor Certifications 2-41
Competitive Analysis 2-42
Market Structure 2-42
Network IDS/IPS Appliances and Software 2-43
Host IDS/IPS 2-43
#N22B-74 © 2007 Frost & Sullivan www.frost.com v

Market Share Analysis 2-46
IDS/IPS Market Share 2-46
Market Leader 2-48
IBM ISS 2-48Market Challengers 2-49
Cisco Systems 2-49McAfee 2-49
Market Contenders 2-50
Juniper Networks 2-50Symantec 2-50Sourcefire 2-50TippingPoint 2-51
Market Specialists 2-51
Arbor Networks 2-51Check Point 2-51MazuNetworks 2-52
Niche Players 2-52
TrustWave 2-52DeepNines 2-52ForeScout 2-53Intoto 2-53Nitro 2-53Radware 2-53Reflex Security 2-53StillSecure 2-54Stonesoft 2-54Top Layer 2-54
#N22B-74 © 2007 Frost & Sullivan www.frost.com vi

List of Figures
C h a p t e r 1
Executive Summary
1-1 Total IDS/IPS Market:
Unit Shipment and Revenue Forecasts (World), 2003-2013 1-4
C h a p t e r 2
Total Intrusion Detection and Prevention Systems Market
2-1 Total IDS/IPS Market:
Market Drivers Ranked in Order of Impact (World), 2007-2013 2-3
2-2 Total IDS/IPS Market:
Market Restraints Ranked in Order of Impact (World), 2007-2013 2-6
2-3 Total IDS/IPS Market:
Unit Shipment and Revenue Forecasts (World), 2003-2013 2-12
2-4 Total IDS/IPS Market:
Network Appliances Unit Shipment and Revenue Forecasts (World), 2003-2013 2-14
2-5 Total IDS/IPS Market:
Network Software Unit Shipment and Revenue Forecasts (World), 2003-2013 2-15
2-6 Total IDS/IPS Market:
Host Software Unit Shipment and Revenue Forecasts (World), 2003-2013 2-17
2-7 Total IDS/IPS Market:
Percent of Revenues by Product Type (World), 2003-2013 2-18
#N22B-74 © 2007 Frost & Sullivan www.frost.com vii

2-8 Total IDS/IPS Market:
Revenues by Geographic Region (World), 2003-2013 2-19
2-9 Total IDS/IPS Market:
Revenues by Vertical Market (World), 2003-2013 2-22
2-10 Total IDS/IPS Market:
Network IDS/IPS Appliance Average of Throughput
per Price Band (World), 2006 2-33
2-11 Total IDS/IPS Market:
Network IDS/IPS Appliances Average Price per Megabitper
Second (Mbps) (World), 2006 2-34
2-12 Total IDS/IPS Market:
Competitive Structure (World), 2006 2-44
2-13 Total IDS/IPS Market:
Key Industry Participants by Product Type (World), 2006 2-45
2-14 Total IDS/IPS Market:
Market Share Analysis (World), 2004-2006 2-46
2-15 Total IDS/IPS Market:
Market Share Analysis for the Network Hardware
Segment (World), 2004-2006 2-47
2-16 Total IDS/IPS Market:
Market Share Analysis for the Host Software
Segment (World), 2004-2006 2-47
#N22B-74 © 2007 Frost & Sullivan www.frost.com viii

#N22B-74 © 2007 Frost & Sullivan www.frost.com ix
List of Charts
C h a p t e r 2
Total Intrusion Detection and Prevention Systems Market
2.1 Total IDS/IPS Market:
Market Engineering Measurements (World), 2006 2-10
2.2 Total IDS/IPS Market:
Revenue Trends (World), 2003-2013 2-13
2.3 Total IDS/IPS Market:
Percent of Revenues by Product Type (World), 2003-2013 2-19
2.4 Total IDS/IPS Market:
Percent of Revenues by Geographic Region (World), 2003-2013 2-20
2.5 Total IDS/IPS Market:
Percent of Revenues by Vertical Market (World), 2003-2013 2-23
2.6 Total IDS/IPS Market:
Network IDS/IPS Appliance Average of Throughput
per Price Band (World), 2006 2-33
2.7 Total IDS/IPS Market:
Network IDS/IPS Appliances Average Price per Megabit
per Second (Mbps) (World), 2006 2-34
2.8 Total IDS/IPS Market:
Competitive Landscape (World), 2006 2-48

1Executive Summary
E x e c u t i v e S u m m a r y
Market Overview and Definitions
During 2006 and the first half of 2007, the World Intrusion Detection and Prevention
Systems (IDS/IPS) market has seen significant product expansion and acquisitions for a
variety of vendors. The largest acquisition the space was the acquisition of ISS by IBM for
$1.30 billion. Other acquisitions include NFR by Check Point for $20.0 million and the
acquisition of Lucid by AbironTrustWave in June 2006. In June 2007, 3COM announced that
the TippingPoint division will IPO into a separate publicly traded company, a surprising
move in light of the price paid for the company in December 2004. All these activities and
other product changes—such as the dropping of hardware devices (and therefore IDS/IPS) by
Symantec, and the addition of very high and low end devices by TippingPoint and IBM
ISS-only show the continued maturity of this space.
The two main functions of IDS/IPS technologies are identification of malicious traffic, and a
corresponding action. Whether that action is merely to log the occurrence, generate an alarm,
terminate a session, reconfigure a firewall policy, or more proactively drop the packets in
real-time, depends on the capabilities of the product and its configuration. As organizations
continue to become more comfortable with inline blocking, more options related to remedia-
tion are becoming common place. Because of the nature of these technologies—inspecting
every packet flowing through the network and the machine—many vendors have begun to
incoporate content filtering and protection against other attack vectors (such as IM and
VOIP) directly into the platform.
This research will be segmented by network intrusion detection/prevention appliances,
network intrusion detection/prevention software and host-based intrusion detection/preven-
tion systems. Throughout the text, distinctions between the technologies will be made where
appropriate, however, the market is generally referred to in total as the IDS/IPS market, or
the intrusion market.
#N22B-74 © 2007 Frost & Sullivan www.frost.com 1-1

Network IDS/IPS technologies attempt to compliment firewall technologies by establishing
sensors running on independent hardware platforms throughout the network. These sensors
monitor the traffic that progresses through them, and attempt to identify the traffic as mali-
cious or benign.
Host IDS/IPS technologies serve a similar purpose as their network counterparts, but reside
as software on a host machine (server or client) present within the network. Host IDS/IPS
technologies are increasing in popularity as a number of current attack vectors target the
actual host machine. Additionally, there are many compliance issues that can only be meas-
ured by an agent on the host.
In addition to the deployment options of IDS there are a variety of detection mechanisms in
use on IDS/IPS platforms in 2006:
■ Signature-based detection, where the traffic is compared to a list of known attacks and
action is taken upon finding a match. The signature databases are frequently updated to
protect against known threats and distributed to the user base periodically.
■ Identification of malicious traffic can also occur through anomaly (behavior) based
detection, where sensors and their corresponding management consoles establish a
profile of normal network performance, activities and traffic type. When traffic is found
that does not fit the established profile (based on the type of traffic, the destination of the
traffic, the rate of the traffic, etc), action is taken by the device.
■ Policy-based detection, which establishes a list of functions that can be executed, and
takes action against traffic that attempts to act beyond the pre-established functions.
M a r k e t D e f i n i t i o n s
Recently, an increasing amount of IDS/IPS capabilities have been bundled in with other tech-
nologies on the same platform. UTM platforms which traditionally bundled firewall and
VPN functionality, have been gaining more and more functionality. The majority of products
in the IDS/IPS market remain as independent point products. Those that bundle IDS/IPS tech-
nologies with other security technologies often do so through a simplification of the IDS/IPS
technology’s capability. Due to the difficulty associated with the quantification of the value
of bundled technologies, Frost & Sullivan will track only those independent point products
for the purposes of this research.
Revenue earned by distributors or reselling agreements has been excluded in order to avoid a
double count of the value of the technology. In the quantification of market size,
Frost & Sullivan has also omitted revenue earned from professional services, such as installa-
tion and technical support, and maintenance agreements, in order to accurately measure the
value of the IDS/IPS technology itself.
#N22B-74 © 2007 Frost & Sullivan www.frost.com 1-2

Vendors are increasingly using vulnerability assessment capabilities to increase the effective-
ness of their IDS/IPS solutions. A few vendors have positioned vulnerability assessment
technologies as independent products. For the purposes of this research, stand alone vulnera-
bility assessment products and services have been excluded from quantification, although the
use of this technology is discusses in the Technology Trends section of this research. Readers
interested in Vulnerability Management should reference Frost & Sullivan Vulnerability
Management research #N06E. An emerging concern for many companies is the increased
deployment of Voice Over IP (VOIP) and how that deployment changes their security
posture. VOIP presents many unique security problems that are not specifically addressed in
this research. Readers interested in VOIP should reference Frost & Sullivan VOIP Security
research #6A14.
All service related revenue, including professional services, managed services, and subscrip-
tion services have been excluded from the revenue calculations.
IDS/IPS products can be sold either as a software product or as a hardware solution. For
network based IDS/IPS products sold as stand alone software, customers subsequently
purchase appliances to load the software onto. Where hardware products are offered from
the vendor, the value of the platform is merged with the value of the software. For stand
alone products, however, Frost & Sullivan does not quantify the revenues generated by the
subsequent purchase of the hardware platform in order to more tightly focus on the value of
the IDS/IPS product, not its compliments.
Finally, all IDS/IPS solutions work in conjunction with a management console. While the
features, price, and market contribution from management consoles are discussed separately
in the research, the revenue contribution from these consoles has been bundled into the value
of the sensors or agents.
Key Market Drivers and Restraints
The key market drivers for the IDS/IPS market are:
■ Government Legislation Imposes Regulations Requiring Increased Security Levels
■ Increased Budgets For IDS/IPS Products
■ Increasingly Complex Attacks, Increased Incidents, and Negative Publicity Perpetuate
Demand for Sophisticated Security Solutions
■ Increasing Deployment Opportunities for Host IDS/IPS
#N22B-74 © 2007 Frost & Sullivan www.frost.com 1-3

A b i l i t y f o r I D S / I P S T e c h n o l o g y t o S e r v e N e t w o r k
M o n i t o r i n g a n d D i a g n o s t i c s F u n c t i o n s C r e a t e s V a l u e
A d d e d
The key market restraints to the IDS/IPS market are:
■ Political and Organizational Dynamics Stall Deployments
■ Demand for On-Site Trials Increasing Sales Cycles
■ Organizations Looking at Alternate Enforcement Technologies
■ Other Higher Priority Items Reduce Spending on IDS/IPS
Key Findings and Conclusion
Figure 1-1 shows the Total IDS/IPS Market: Unit Shipment and Revenue Forecasts (World),
2003-2013.
Note: All figures are rounded; the base year is 2006. Source: Frost & Sullivan
F i g u r e 1 - 1
Total IDS/IPS Market: Unit Shipment and Revenue Forecasts (World), 2003-2013
Unit Revenue
Units Growth Rate Revenues Growth Rate
Year (Thousands) (%) ($ Million) (%)
2003 132.8 --- 343 ---
2004 147.6 11.1 542 58.1
2005 168.7 14.3 658 21.4
2006 226.0 34.0 777 18.0
2007 276.7 22.4 932 20.0
2008 345.9 25.0 1,117 19.8
2009 430.1 24.3 1,330 19.1
2010 532.3 23.8 1,566 17.7
2011 635.7 19.4 1,821 16.3
2012 744.1 17.1 2,076 14.0
2013 849.1 14.0 2,340 12.7
Compound Annual Growth Rate (2006-2013): 17.1%
#N22B-74 © 2007 Frost & Sullivan www.frost.com 1-4

As illustrated in Figure 1-1, the World IDS/IPS market grew just over 17 percent to
$776.6 million in base year 2006. Although IDS/IPS is a market with strong growth, there
are still hurdles to overcome. Some customers still have a bad taste in their mouths from the
early days of high TCO, high numbers of false positives and an overwhelming amount of
information. Most customers still feel that a lot of improvement is necessary. The sheer
number of vendors in the market and the variety of different detection techniques have
customers acting very cautiously to implement any solution. Despite these problems, the
market is being driven by a number of factors. Legislative pressures have moved security
spending to the forefront for many companies. As the workforce becomes more mobile,
customers are finding their perimeters to be quickly changing and a layered approach to secu-
rity is being adopted by necessity. New attack methodologies such as spyware and phishing
have customers constantly re-evaluating their security posture.
N e t w o r k I D S / I P S A p p l i a n c e s
The market has seen a transition from signature based Network IDS (NIDS) to IPS solutions
incorporating signatures, anomaly detection, and vulnerability assessment. The inaccuracies
and maintenance intensive nature of network-based solutions previously frustrated users and
prevented the market from expanding. However, legislative pressures, the reality of
continued attacks, and improved usability have driven the sales of new appliances. Integra-
tion of multiple attack detection mechanisms and vulnerability assessment scanners are
helping to alleviate the tarnished reputation of many systems, but customers are taking much
more time to effectively evaluate systems before installing into the network infrastructure.
The majority of the growth in the market has come from IPS products, while more traditional
IDS technology sales have been flat or declining. This is not to say that IDS is dead or is no
longer in use. Most organizations have found that it is only possible to actively block on a
limited subset of signatures. Blocking on too many signatures puts a strain on systems and
has the potential to block potentially legitimate traffic, completely unacceptable to an organ-
ization who derives significant revenues from online activities. As a result, many
organizations have found that the best way to implement IDS/IPS solutions is a balance of
both technologies. There are certain attacks that are definitely attacks and need to be
blocked. There are also certain attacks or types of traffic which warrant an alert and further
investigation.
#N22B-74 © 2007 Frost & Sullivan www.frost.com 1-5
N e t w o r k I D S / I P S S o f t w a r e
The software market continued the downward trend started in 2004 as most customers
continued to show their preference of appliances. Hardware appliances have a value proposi-
tion that software alone cannot seem to match. With many systems moving towards in-line,
active blocking, the speeds required can only be achieved by specialized hardware. All in one
appliances are seen as easier to harden, easier to configure, easier to maintain, and many
customers consider hardware appliances to have a much lower overall TCO. From a vendor
perspective selling a preconfigured box allows for easier maintenance and the ability to have
a consistent product. In the situation where the customer is responsible for installing the soft-
ware on independent hardware, a whole host of problems can creep up, and in the end it is
the software vendor that ends up providing support and suffering the negative feedback when
configuration or hardware issues occur. Even if the box is an off the shelf Dell server, the
ability to control the exact specifications of the hardware and make the proper adjustments
up front is a huge plus for the vendor.
While a very limited number of vendors are even choosing to continue to sell a software only
solution as part of their product mix, this market declined significantly in 2005 and is
expected to continue decreasing. However, a limited number of customers prefer a software
product, especially if tied to an existing contract or in an environment where software
running on standard hardware has been the norm. As IDS/IPS technology moves deeper into
the small-medium sized business (SMB) market Frost & Sullivan believes that some
customers will still choose a software solution, if for no other reason but for the lower price
point and the ability to use a spare server and not buy more hardware.
The recently announced Intel virtualization technology could have a positive effect on the
software market. The possibility for a single machine with a high speed network card, prein-
stalled with IDS/IPS software could be an attractive proposition to organizations. However,
there are many unknowns with the Intel technology and the effectiveness of the technology
has yet to be determined by the market.
H o s t I D S / I P S
The Host IDS/IPS market has continued on a steady growth path, though not nearly as
aggressively as the hardware appliance segment of the market. Legislative pressures focused
on tracking policy changes and a trend to add specific protection for mission critical servers
within a network has pushed growth in this market. Organizations are often reluctant to
place a hardware appliance in front of each server that needs protection, but want an extra
layer of security and a host based solution is attractive for that situation.The increasingly
mobile workforce, the shrinking perimeter, and the proliferation of mission critical servers
and applications being available on the corporate network all make for huge potential for the
host market. The increase in deployment of SSL-VPN solutions in many organizations is
driving adoption of host based products as traditional network based products cannot
decrypt the traffic on the line and the potential for certain attacks is passed to the host
directly.
#N22B-74 © 2007 Frost & Sullivan www.frost.com 1-6

Deployment of Host IDS/IPS systems is still hindered by organizational politics and the diffi-
culties faced by managing a large deployment of sensors. Many vendors have started
addressing these issues and Frost & Sullivan sees this market as a steadily growing market
with high growth potential. IDS/IPS vendors would need to ramp up their management capa-
bilities to address these desktop IPSs as well as other issues, but the potential for host IDS/IPS
is bright.
#N22B-74 © 2007 Frost & Sullivan www.frost.com 1-7

2Total Intrusion Detection and Prevention
Systems Market
M a r k e t D r i v e r s a n d R e s t r a i n t s
Market Overview and Introduction
The IDS/IPS market has come a long way from its checkered past, moving from a clumsy and
unreliable technology to being one of the primary layers of security in all organizations.
From the proclamations of “IDS is dead” to the staggering large sums paid for TippingPoint
and ISS, IDS/IPS is a market that has beaten, bruised, and yet still continues to surpass all
expectations.
Frost & Sullivan looks at this market in three distinct segments. The first segment is Network
IDS/IPS and includes hardware appliances intended to sit in the network infrastructure. Since
2004 this segment has been the deployment of choice for most organizations. Factors such as
speed, ease of maintenance and the compatibility with other solutions in the infrastructure
drove impressive growth rates in this segment and all but a few software solutions even exist,
and are primarily intended for the most price conscious SMBs.
#N22B-74 © 2007 Frost & Sullivan www.frost.com 2-1

The software IDS/IPS segment is a segment that has been on a steep decline since 2003 and is
currently responsible for a small amount of revenues in this space. However, that it not to say
that this segment is insignificant. When looking at open source deployments, software based
solutions are the most prevalent deployment in existence. While it is difficult to gauge the
number of open source deployments, it is well known that the first step towards an IDS/IPS
solution is through an open source product and numerous organizations rely on these deploy-
ments for security. Frost & Sullivan is also beginning to see the start of innovation in this
segment for another reason—virtualization. As virtualization becomes more prevalent in the
enterprise, the need to protect these virtual networks increases. The jury is still out as to how
to best secure virtualized networks and many vendors are discussing software IDS/IPS prod-
ucts as part of their possible future roadmaps.
The third segment Frost & Sullivan examines is the Host IDS/IPS segment. Since 2004 this
segment has been steadily increasing in size, but at nowhere near the pace of the appliances.
However, with ever increasing threats targeting the desktop specifically increased use of
encryption, and the ever mobile workforce, host based solutions have become popular.
Vendors have gone to great lengths to shrink the footprints of agents and to improve the
manageability of host based solutions and network administrators are beginning to take
notice.
Primarily because of companies such as TippnigPoint and IBM ISS, IPS technology has gained
more and more acceptance as a real working technology. While most organizations do not
block a large number of signatures, the fact that traffic blocking is turned on at all is strong
indication of the improved accuracy of the technology. Additionally, IPS continues to find
itself marked for doing the heavy lifting in Network Access Control (NAC) deployments.
Vendors such as TippingPoint, StillSecure, and ForeScout have begun offering policy control
in addition to their existing functionality. Frost & Sullivan believes that IPS will become the
new enforcement point for the infrastructure and will continue to operate in conjunction
with policy enforcement.
Also inline with the enforcement theme, are the many partnerships with Security Information
Management (SIM) products in the market and the leveraging of SIM technology to improve
the real-time reaction capabilities of IPS devices. The detection component of IDS/IPS is still
prevalent in organizations as well. Organizations may not block every questionable piece of
traffic, but those same organizations are alerting administrators to potential trouble. The
detection capabilities of these systems are also being used to validate compliance objectives
and to auditably prove that attacks were stopped. In addition, IDS/IPS are finding increased
use in monitoring insider threats, tracking users that are touching things they should not.
#N22B-74 © 2007 Frost & Sullivan www.frost.com 2-2

Frost & Sullivan believes that while 2005 saw a great deal of development in detection capa-
bilities, speeds and manageability, 2006 was a year of deployment. Many organizations are
finally going out and testing some of the features of IDS/IPS that have been in place, but
which administrators have been hesitant to add.
Market Drivers
Figure 2-1 presents the market drivers ranked in order of impact in the World IDS/IPS market
for the period 2007-2013.
Source: Frost & Sullivan
G o v e r n m e n t L e g i s l a t i o n I m p o s e s R e g u l a t i o n s R e q u i r i n g
I n c r e a s e d S e c u r i t y L e v e l s
The effects of government legislation, discussed in detail in later sections, has driven the IDS/IPS market strongly since 2005. Legislation such as the Payment Card Industry (PCI) DataStandard and Sarbanes-Oxley are forcing many organizations to enhance their securitysystems in order to comply with the legislation. This type of legislation has previously hadlukewarm effects in other security technologies markets, as users have deferred purchasesuntil they more fully understand the requirements for compliance. As deadlines areapproaching or have been exceeded, momentum is increasing as clients seek the aid of IDS/IPS vendors and other security vendors to help them meet these legislative requirements. Thisdriver is expected to remain a significant motivator of IDS/IPS deployments throughout theforecast period, as companies continue to deploy, upgrade and maintain IDS/IPS solutions inconjunction with the legislation.
F i g u r e 2 - 1
Total IDS/IPS Market: Market Drivers Ranked in Order of Impact (World), 2007-2013
Rank Driver 1-2 Years 3-4 Years 5-7 Years
1 Government legislation imposes regulations requiring increased
security levels
Very High High High
2 Increased budgets for IDS/IPS products High High High
3 Increasingly complex attacks, increased incidents, and negative
publicity perpetuate demand for sophisticated security solutions
High High High
4 Increasing deployment opportunities for host IDS/IPS High High Medium
5 Incessant system vulnerabilities and software patches create a
need for a safety net
High High Medium
6 Maturing security market emphasizes layered security
architectures
Medium High Medium
7 IDS/IPS solutions enable network forensics upon attack Medium High Medium
8 Geographical market expansion increases addressable market Medium Medium Medium
#N22B-74 © 2007 Frost & Sullivan www.frost.com 2-3

The PCI Data Security standard, Basel II and others are inclusive of companies that have not
traditionally been covered by security standards in the past. These new companies are green-
field customers for security vendors and typically do not have an existing security
infrastructure to deal with. These new customers have added an interesting dynamic to the
market because they are usually willing to try new technology and do not have many existing
security relationships in place.
I n c r e a s e d B u d g e t s F o r I D S / I P S P r o d u c t s
Due to the increased publicity of security incidents, increased education of executives and
growing legislative pressures, many companies have increased budgets for security. Beyond
that, many companies have dedicated a portion of their security budgets specifically for IDS/
IPS systems, showing the importance that these devices have gained in the security architec-
ture. The increasing number of devices deployed close to the core of the network show the
results of the shrinking perimeter as the mobile workforce and increased access to the
internal network continues to be a trend. Companies are realizing that an IDS/IPS solution at
the perimeter is not enough and are spending the money to ensure that proper security inside
the network is realized.
I n c r e a s i n g l y C o m p l e x A t t a c k s , I n c r e a s e d I n c i d e n t s , a n d
N e g a t i v e P u b l i c i t y P e r p e t u a t e D e m a n d f o r
S o p h i s t i c a t e d S e c u r i t y S o l u t i o n s
In the ever-evolving cat and mouse game of security versus hackers, today’s attacks have
become increasingly sophisticated and complex. The continually increasing number of
hacking attempts has spurred demand for security solutions that add higher levels of assur-
ance against a network’s compromise. The last several years have seen consecutive increases
in annual reported hacking incidents. There is also a new trend towards financial motivation
for hacking attacks, through sales of zombie armies, extortion, or theft and sale of personal
information or corporate intellectual property. This trend will continue to drive the number
of attacks.
A number of recent high profile data loss cases such as DSW Shoes and Lexis-Nexis have
prompted an interest in having effective security measures in place. The cost of having to
inform clients about potential losses along with the immeasurable cost from loss of public
image are causing several companies to look closer at their security posture. While this may
be related to a fear factor, it is still driving growth.
#N22B-74 © 2007 Frost & Sullivan www.frost.com 2-4

I n c r e a s i n g D e p l o y m e n t O p p o r t u n i t i e s f o r H o s t I D S / I P S
Specific to the host IDS/IPS market, customers are realizing the opportunity to deploy
host-based solutions on servers and machines that they had previously not considered. The
initial host deployments were largely limited to DMZs and Web Servers. Currently, customers
are expanding deployment scenarios to include all mission critical application and data
servers, wireless access points, VPN access points, and remote machines. This increased
deployment capability increases the potential market and deployment size of host based solu-
tions. This is a critical driver for the host based market, as an expanded deployment
opportunities could theoretically stretch to include all servers within a network, which would
increase the potential market exponentially. For this reason, this driver maintains a high
degree of influence on the market throughout the forecast period.
I n c e s s a n t S y s t e m V u l n e r a b i l i t i e s a n d S o f t w a r e P a t c h e s
C r e a t e a N e e d f o r a S a f e t y N e t
The seemingly endless stream of vulnerability discoveries and corresponding software
patches has created an immense burden on the network administrator. Aggravating the
problem is the fact that many of these patches should be tested before implementation to
ensure their effectiveness and avoid creation of further vulnerabilities or conflicts. Adminis-
trators of large complex environments are seldom able to keep completely current on fixing
the vulnerabilities that are simultaneously broadcasted to malicious hackers. The time
between vulnerability announcement and repair creates a window of opportunity for mali-
cious hackers to expose weaknesses. While IDS/IPS products are not positioned as a complete
remedy to the problem, these technologies are an effective means of reducing the risks
created by the aforementioned window of opportunity. This driver is expected to remain
considerable throughout the forecast period as little hope is given to significantly reduce the
number or the rate of new vulnerabilities and patches.
M a t u r i n g S e c u r i t y M a r k e t E m p h a s i z e s L a y e r e d S e c u r i t y
A r c h i t e c t u r e s
As administrators awakened to the necessity of network security, it is being realized that
securing the network perimeter is simply not sufficient. The growing internal threat, the more
mobile workforce, more critical servers being placed on the network, and more attacks
coming in on common ports have exploited flaws in a firewall centric security solution. A
more mature and enlightened market is evolving towards the notion of layered security solu-
tions. This movement is evident in the growth of other security technologies, such as
endpoint security solutions and authentication solutions. This driver is the key motivator of
IDS/IPS deployments, which essentially alert to or prevent attacks that have permeated the
first layer of network defense. Consequently, this driver is considered of critical importance
throughout the forecast period.
#N22B-74 © 2007 Frost & Sullivan www.frost.com 2-5

I D S / I P S S o l u t i o n s E n a b l e N e t w o r k F o r e n s i c s U p o n A t t a c k
The logs that are created by IDS and IPS solutions provide valuable forensics capabilities inthe case of a network’s compromise. The ability to re-trace the steps that were taken leadingto the compromise allows administrators to understand how vulnerabilities were exploited,and seal those weaknesses. Equally important is the ability to accurately assess the damagethat was caused in order to efficiently repair systems and understand the full degree ofdamage created by a security breach. With legislation such as California SB1386 and otherstates’ version of the same legislation the ability to quickly identify what damage was done isbecoming more critical.
G e o g r a p h i c a l M a r k e t E x p a n s i o n I n c r e a s e s A d d r e s s a b l e M a r k e t
While most of the IDS/IPS market’s opportunity has historically been found within the US,other countries are ramping up demand for IDS/IPS products. While the US is often viewed asa technological pioneer, other countries follow suit as they increase their use and adoption ofIT in all facets of life. As demand for IDS/IPS technologies increases outside of the US,vendors are finding an increased addressable market which logically increases sales. Thisdrivers looks to have an increasing impact on the market through the forecast period.
Market Restraints
Figure 2-2 presents the market restraints ranked in order of impact in the World IDS/IPSmarket for the period 2007-2013.
Source: Frost & Sullivan
F i g u r e 2 - 2
Total IDS/IPS Market: Market Restraints Ranked in Order of Impact (World), 2007-2013
Rank Restraint 1-2 Years 3-4 Years 5-7 Years
1 Political and organizational dynamics stall deployments Very High High Medium
2 Demand for on-site trials increasing sales cycles High High Medium
3 Organizations looking at alternate enforcement technologies High Medium Low
4 Other higher priority items reduce spending on IDS/IPS High Medium Low
5 High level of expertise required for IDS/IPS solution maintenance increase TCO
Medium Medium Low
6 Historical problems with IDS technology has damaged the market’s reputation
High Medium Low
7 Competition from inexpensive open source alternatives reduces demand for commercial solutions
Medium Medium Medium
8 Continued use of legacy servers and applications create an installed base that is not interoperable with host based solutions
Medium Low Low
9 Lack of a quantifiable ROI Low Low Low
#N22B-74 © 2007 Frost & Sullivan www.frost.com 2-6
P o l i t i c a l a n d O r g a n i z a t i o n a l D y n a m i c s S t a l l D e p l o y m e n t s
In many organizations in the past, the security group had the ability to purchase and manageIDS/IPS systems largely without affecting network performance. Now, with the move toinline devices performing active blocking, the network infrastructure group is required to beinvolved at a much greater level than before. Within larger organizations, those responsiblefor network security are often separate from those responsible for the network infrastructureand maintenance. The same problems also exist when host deployments are desired. Mosttimes the group responsible for servers is a different group than the applications group.Many different groups with very different agendas have to work together to determine thebest course of action to take. This has affected host based IDS/IPS deployments the most andslows other deployments due to the increased level of interaction between groups. Addition-ally, some corporations have attempted to standardize the applications and configurations ofnetwork servers. Getting approval and changing corporate standards lengthens the sales cyclefor host IDS/IPS deployments. Host based players such as McAfee and Cisco are examples ofmarket participants directly affected by this restraint.
D e m a n d f o r O n - S i t e T r i a l s I n c r e a s i n g S a l e s C y c l e s
As IDS/IPS technology moves towards being more active and more devices are placed inlineto the network as opposed to off a spanning port, the potential for performance issues on thenetwork increases. Sales cycles are increasing as much as three to six months as bench-marking and evaluations are performed with actual demonstration devices running in thenetwork infrastructure. This additional level of evaluation increases the amount of resourcesrequired by vendors in order to sell a product with some demonstrations requiring dedicatedengineers during the trial period. This restraint will have a serious effect until the vendorscan catch up with the required demonstration units and expertise.
Customers are essentially distrustful of IPS technology and are very concerned aboutblocking legitimate traffic. This coupled with a large number of vendors in the marketplaceall making similar claims have confused the market and this demand for extended trials is asa direct result of customers sifting through the noise.
O r g a n i z a t i o n s L o o k i n g a t A l t e r n a t e E n f o r c e m e n t T e c h n o l o g i e s
While IDS/IPS technology has a foothold in many organizations, it is not always the singlechoice throughout the enterprise. Many organizations are looking towards solutions such asNetwork Access Control (NAC) and Unified Threat Management (UTM) to address problemsthroughout the enterprise. With a changing threat landscape that includes threats such aswireless, unmanaged users, and trying to secure remote offices, IDS/IPS is not always theclear winner. Many organizations are choosing the combined functionality of either NAC orUTM devices. When looking at remote offices, UTMs in particular tend to have a distinctprice advantage at the low end compared to comparable IDS/IPS devices. Other organizationslike the granular policy enforcement capabilities they get from a NAC appliance. Availabilityof IPS at the sub-100 Mbps range has been a challenge to the market as well.
#N22B-74 © 2007 Frost & Sullivan www.frost.com 2-7

With TippingPoint and IBM ISS both releasing IPS devices geared at remote office protection,
it will be interesting to see if customers are interested in IPS technology or if the combined
technology is a better value proposition.
O t h e r H i g h e r P r i o r i t y I t e m s R e d u c e S p e n d i n g o n I D S /
I P S
In 2006 data protection was at the top of every CIO’s list. As the attack vectors have shifted
from attacks directed at the network to more targeted phishing attacks, the countermeasures
being chosen have shifted. Frost & Sullivan has seen increased spending on content filtering
and desktop security products. While this increased spending does contribute to increased
spending on HIPS products, many organizations do not appear to be purchasing new IDS/IPS
products at the same rate as they did even a year ago.
H i g h L e v e l o f E x p e r t i s e R e q u i r e d f o r I D S / I P S S o l u t i o n
M a i n t e n a n c e I n c r e a s e T C O
The key to an effective IDS/IPS solution is the ability to tune the system to respond to valid
security breaches. This can be an extremely difficult and time consuming task in large
complex environments, and few IT professionals posses the knowledge and experience to
tune IDS/IPS systems effectively. Moreover, highly skilled security professionals are needed to
understand the output of the IDS/IPS systems. The high level of complexity surrounding the
maintenance and support of intrusion solutions creates a correspondingly high TCO for
companies that must pay top dollar for limited number of security professionals that are
capable of performing this function. This restraint is likely to diminish as vendors incorpo-
rate better rule sets, behavior based detection, and improved reporting.
H i s t o r i c a l P r o b l e m s W i t h I D S T e c h n o l o g y H a s D a m a g e d
t h e M a r k e t ’ s R e p u t a t i o n
False positives, inadequate performance, difficult deployment, weak management, lack of
standards, high total cost of ownership, and the voluminous amounts of data generated are
areas in which the IDS/IPS market had made little improvement until 2004 and 2005.
Improvements such as vulnerability scanners and multiple attack recognition capabilities
have created a much more useable and marketable products. However, many administrators
still view the technology as cumbersome, inaccurate, and expensive, and changing these opin-
ions will take time. Meanwhile, the market suffers from a poor reputation, which prevents
many from investing in IDS/IPS technology.
#N22B-74 © 2007 Frost & Sullivan www.frost.com 2-8

C o m p e t i t i o n F r o m I n e x p e n s i v e O p e n S o u r c e A l t e r n a t i v e s
R e d u c e s D e m a n d f o r C o m m e r c i a l S o l u t i o n s
The SNORT open source IDS has evolved as a competitor to commercial IDS/IPS technology.
The large population of open source technology fans have, to their credit, established an
effective and inexpensive IDS solution that is widely deployed in the marketplace. While
some vendors have taken advantage of SNORT and SPADE by releasing commercial enhance-
ments to these products, the large install base of users of this open source platform has
limited potential sales of commercial solutions thus reducing the market’s size. Based on the
sustained popularity of open source IDS alternatives, this restraint will remain in effect
throughout the forecast period. SNORT is also a popular alternative for companies wanted
to "dip their toes in the water" in terms of an IDS/IPS system.
C o n t i n u e d U s e o f L e g a c y S e r v e r s a n d A p p l i c a t i o n s
C r e a t e a n I n s t a l l e d B a s e t h a t i s N o t I n t e r o p e r a b l e
W i t h H o s t B a s e d S o l u t i o n s
Many enterprises continue to leverage their existing legacy applications and servers. These
applications and servers usually do not support the host based IDS/IPS solutions on the
market. In time, these systems will eventually be upgraded, thereby expanding the address-
able market. However as enterprises continue to leverage their existing legacy systems, the
addressable market is limited.
L a c k o f a Q u a n t i f i a b l e R O I
Unlike a few other security products, it is challenging to quantify the ROI of IDS/IPS tech-
nology. The difficulty of associating a cost to a security breach has challenged the security
market since inception. Often, the cost of being hacked is multiplied by the cost of restoring
the network, correcting the security problem, the value of proprietary information lost,
subsequent forensic investigations and litigation, as well as the tarnished reputation. Unfor-
tunately, the costs of these effects are not tracked, are difficult to quantify, or are logically
impossible to tabulate. The challenges in tabulating the costs of insecurity make it difficult to
illustrate the fiscal value of the IDS/IPS, and create roadblocks in the quest for budget alloca-
tions. The effects of this restraint are expounded by economic conditions, where ROI is more
closely scrutinized. Many vendors are working to counter this through improved reporting
methods built into the systems themselves and many vendors have management consoles
available in order to help justify the ROI of IDS/IPS systems.
#N22B-74 © 2007 Frost & Sullivan www.frost.com 2-9

M a r k e t T r e n d s a n d F o r e c a s t s
Market Engineering MeasurementsChart 2.1 details the Total IDS/IPS Market: Market Engineering Measurements (World),2006.
C h a r t 2 . 1
Total IDS/IPS Market: Market Engineering Measurements (World), 2006
Market Engineering Drives Market
Strategy and Planning
MarketEngineer
ChallengeIdentification
MarketResearch
MarketEngineering
System
Implementation
MarketPlanning
MarketStrategy
Note: All figures are rounded. Source: Frost & Sullivan
Measurement Name Measurement Trend
Market stage Entering a second growth stage
Revenues $776.6 million Increasing
Potential revenues (maximum future market size) $2304.1 million
Base year revenue growth rate 18% Increasing
Forecast period revenue growth rate 17.1%
Units 276,785 Increasing
Potential units (maximum future market size) 849,165
Base year unit growth rate 22.4% Decreasing
Forecast period unit growth rate 20.8%
Weighted average vendor price (network based appliance) $27,600 Decreasing
Weighted average vendor price (network based software) $7,145 Decreasing
Weighted average vendor price (host based) $923 Decreasing
Price range $455-$188,995 Decreasing
Price sensitivity Medium Increasing
Competitors (active market competitors in base year) Over 20 Increasing
Degree of competition High Increasing
Degree of technical change High Increasing
Customer satisfaction Medium Increasing
Customer loyalty Medium Stable
Market concentration (percent of base year market controlled by top three competitors) 55.9% Increasing
#N22B-74 © 2007 Frost & Sullivan www.frost.com 2-10

M a r k e t S t a g e
While the IDS/IPS market is a well established market, it has faced a tumultuous ride. Initial
technologies were moderately effective at best, and a greater focus on other security technol-
ogies such as anti-virus, firewalls, and IPSec VPN kept market revenues, and consequently
development dollars, in check. Most organizations felt that the open source versions of IDS
technologies were adequate enough. Even as late as 2003, customers had seen little product
evolution, development, or improvement. The problems of false positives and poor perform-
ance were considered acceptable disadvantages by vendors and customers alike. Since this
time,, the market has witnessed an influx of new competitors determined to break the mold
and improve IDS technology. The resulting improvements in accuracy, and performance
through appliances, as well as improved management spurred incumbents to improve their
products as the market began to grow in size. The development and deployment of IPS
became widespread and vendors tightened up their performance. With all the recent acquisi-
tions, the market is entering a consolidation stage.
N u m b e r o f C o m p e t i t o r s
In 2005 there were over forty vendors in the IDS/IPS space. A number of these vendors are
small companies with niche products or new technologies. Some small vendors such as Reflex
Security and StillSecure are bringing new iterations of technology to the market and are
having some measure of success with these technologies.
D e g r e e o f T e c h n i c a l C h a n g e
The rate of technology evolution in the IDS/IPS market is extremely high as incumbents race
to match the technologies brought to market by the aforementioned startups. Multiple attack
recognition capabilities in behavioral and anomaly based detection are being implemented in
varying degrees by many companies. Vulnerability assessment scanners are being imple-
mented to improve the accuracy and relevance of alerts. High speed platforms and ASIC
based architectures are being used to improve performance. Regulatory compliance has
vendors adding advanced reporting functions to their products to address audit requirements.
#N22B-74 © 2007 Frost & Sullivan www.frost.com 2-11

C u s t o m e r S a t i s f a c t i o n
As mentioned earlier, many technologies exhibited sparse developments for a good portion ofthe market’s history. Many customers are completely dissatisfied with their existing solu-tions, and are eager to replace them with newer technologies. Some customers have evenreported the removal of their solutions because of the difficulties associated with using thetechnology. Many new entrants initially implemented a strategy of acquiring greenfieldcustomers, but have since learned that there is plenty of market opportunity among theinstalled base. As a result, customer satisfaction and customer loyalty are reported as low.However, vendors who are willing to go "the extra mile" seem to be able to hold ontocustomer loyalty and satisfaction more than vendors who simply just propose a solution andleave installation and tuning up to the customer. In fact, it appears that customers arelooking for a vendor who will guide them through the trial, acquisition, and implementationof an IPS system and that those vendors who provide that level of support will hold on tocustomers.
M a r k e t C o n c e n t r a t i o n
The amount of market share held by the three leading vendors has dropped from 63 percentin 2003 to 46 percent in 2005. This trend also illustrates the success of the newer marketentrants and the threat they are posing to incumbent vendors.
Revenue Forecasts
Figure 2-3 shows the Total IDS/IPS Market: Unit Shipment and Revenue Forecasts (World),2003-2013.
Note: All figures are rounded; the base year is 2006. Source: Frost & Sullivan
F i g u r e 2 - 3
Total IDS/IPS Market: Unit Shipment and Revenue Forecasts (World), 2003-2013
Unit Revenue
Units Growth Rate Revenues Growth Rate
Year (Thousands) (%) ($ Million) (%)
2003 132.8 --- 43.1 ---
2004 147.6 11.1 542.3 58.1
2005 168.7 14.3 658.2 21.4
2006 226.0 34.0 777.6 18.0
2007 276.7 22.4 932.0 20.0
2008 345.9 25.0 1,116.9 19.8
2009 430.1 24.3 1,330.4 19.1
2010 532.3 23.8 1,566.5 17.7
2011 635.7 19.4 1,821 .5 16.3
2012 744.1 17.1 2,076.2 14.0
2013 849.1 14.0 2,340 .1 12.7
Compound Annual Growth Rate (2006-2013): 17.1%
#N22B-74 © 2007 Frost & Sullivan www.frost.com 2-12
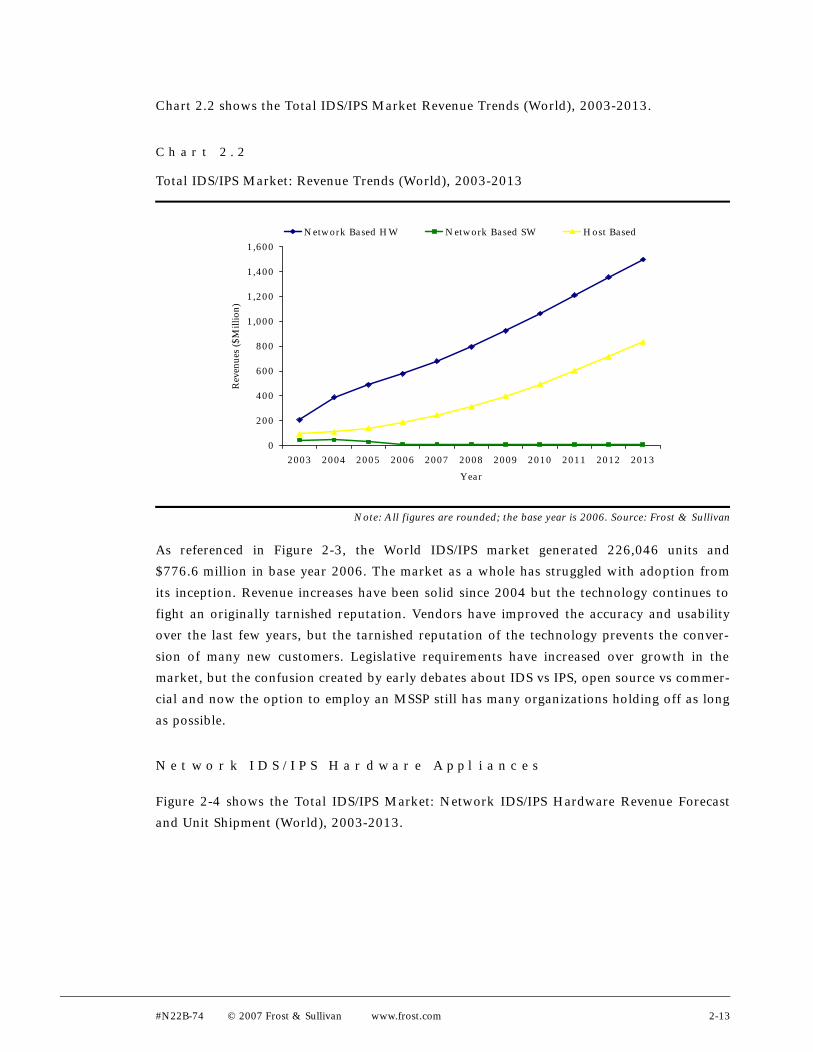
Chart 2.2 shows the Total IDS/IPS Market Revenue Trends (World), 2003-2013.
C h a r t 2 . 2
Total IDS/IPS Market: Revenue Trends (World), 2003-2013
Note: All figures are rounded; the base year is 2006. Source: Frost & Sullivan
As referenced in Figure 2-3, the World IDS/IPS market generated 226,046 units and
$776.6 million in base year 2006. The market as a whole has struggled with adoption from
its inception. Revenue increases have been solid since 2004 but the technology continues to
fight an originally tarnished reputation. Vendors have improved the accuracy and usability
over the last few years, but the tarnished reputation of the technology prevents the conver-
sion of many new customers. Legislative requirements have increased over growth in the
market, but the confusion created by early debates about IDS vs IPS, open source vs commer-
cial and now the option to employ an MSSP still has many organizations holding off as long
as possible.
N e t w o r k I D S / I P S H a r d w a r e A p p l i a n c e s
Figure 2-4 shows the Total IDS/IPS Market: Network IDS/IPS Hardware Revenue Forecast
and Unit Shipment (World), 2003-2013.
0
200
400
600
800
1,000
1,200
1,400
1,600
2003 2004 2005 2006 2007 2008 2009 2010 2011 2012 2013
Year
Rev
enue
s ($
Mill
ion)
Network Based HW Network Based SW Host Based
#N22B-74 © 2007 Frost & Sullivan www.frost.com 2-13

Note: All figures are rounded; the base year is 2006. Source: Frost & Sullivan
The network IDS/IPS appliance market generated 21,000 units, or $578.6 million in 2006.
This segment’s growth over 2005 was a solid 18 percent. The entire market has been carried
by this subsegment’s growth since 2003, but in 2006 that trend is changing.
Technological advancements are certainly an important driver in 2006 and beyond. Perform-
ance improvements have manifested themselves in the introduction of gigabit sensor
technology, while usability improvements have been made through the sensor’s ability to
interoperate with other networking devices and through enhanced management interfaces.
Improved accuracy through the leveraging of vulnerability assessment scanners and the
combination of multiple attack recognition methods (from signature only to a combination
of policy, protocol, and anomaly based detection) reduces false positives and improves the
accuracy of the technology. Market growth later in the forecast period is also driven by
increased demand in geographical regions outside the US, and slow, albeit increasing demand
from medium sized businesses.
F i g u r e 2 - 4
Total IDS/IPS Market: Network Appliances Unit Shipment and Revenue Forecasts (World),
2003-2013
Unit Revenue
Units Growth Rate Revenues Growth Rate
Year (Thousands) (%) ($ Million) (%)
2003 8.7 --- 206.2 ---
2004 12.1 38.9 387.7 87.6
2005 16.4 35.2 490.4 26.8
2006 21.0 28.0 579.6 18.0
2007 25.7 22.6 679.7 17.3
2008 31.5 22.6 794.1 17.0
2009 39.0 23.9 924.3 16.4
2010 48.3 23.9 1,063.0 15.0
2011 56.2 16.2 1,210.8 13.8
2012 65.1 15.9 1,355.6 12.0
2013 73.2 12.5 1,498.4 10.6
Compound Annual Growth Rate (2006-2013): 14.6%
#N22B-74 © 2007 Frost & Sullivan www.frost.com 2-14

The market expansion to smaller-scale environments will have a significant impact on the
unit forecast. Because the lower end markets are more price sensitive, prices will be lowered
considerably. Coupling this pricing pressure with the higher number of small and medium
sized networks will increase the number of units sold at a greater rate than it will increase the
revenues generated. As a result, the market’s revenue CAGR is 14.6 percent, while the
market’s unit CAGR is at a higher 19.6 percent.
Towards the end of the forecast period, sales to small and medium business are expected to
become more important. In this market, customers are likely to consider unified threat
protection (UTM) type devices or other appliances with multiple security applications
running on a single appliance. This trend is expected to moderate growth to a certain extent
over the long term.
N e t w o r k I D S / I P S S o f t w a r e
Figure 2-5 shows the Total IDS/IPS Market: Network Software Unit Shipment and Revenue
Forecasts (World), 2003-2013.
Note: All figures are rounded; the base year is 2006. Source: Frost & Sullivan
F i g u r e 2 - 5
Total IDS/IPS Market: Network Software Unit Shipment and Revenue Forecasts (World),
2003-2013
Unit Revenue
Units Growth Rate Revenues Growth Rate
Year (Thousands) (%) ($ Million) (%)
2003 5.2 --- 44.0 ---
2004 5.4 4.7 46.1 4.6
2005 3.7 (32.0) 28.6 (38.0)
2006 1.4 (62.0) 10.0 (65.0)
2007 1.3 (5.0) 9.7 (3.0)
2008 1.2 (7.0) 9.2 (5.0)
2009 1.2 (7.0) 8.8 (5.0)
2010 1.1 (7.0) 8.3 (5.0)
2011 1.0 (7.0) 7.9 (5.0)
2012 0.9 (7.0) 7.5 (5.0)
2013 0.9 (7.0) 7.1 (5.0)
Compound Annual Growth Rate (2006-2013): (6.7)%
#N22B-74 © 2007 Frost & Sullivan www.frost.com 2-15

Network IDS/IPS software posted another huge loss percent from 2005. This loss follows a
32 percent loss from 2004 and brings the market to $10 million as illustrated in Figure 2-5.
The message and original advantages associated with selling IDS/IPS software and allowing
the customer the ability to pick the hardware has lost its appeal. Customers appear more
than willing to pay the price for a pre-installed system and many vendors that used to sell
software solution either offer an preloaded appliance in addition to the software offering, or
have stopped offering the software-only solution all together. The trend towards an appliance
based product offering has resonated throughout other areas in the security market such as
the IPSec VPN/firewall market. The same motivating factors of ease of installation and
reduced requisition difficulties are present in both IPSec VPN/firewall and IDS/IPS markets.
Some customers will continue to update current systems, most of the market will continue to
demand an appliance solution. Optimizations in gigabit speed sensors require the purchase of
accelerators in addition to the server platform, furthering the trend towards appliance based
solutions. Finally, as the SMB market increases its demand of IDS/IPS technology, many of
these businesses do not have the resources to spend on integration of a software solution
onto a hardware platform. Ease of installation and management is key in these smaller envi-
ronments, and therefore casts further votes for the appliance model. This market’s growth
will continue to decline throughout the forecast period, as the IDS/IPS hardware market
continues to be dominant.
There may be a saving grace ahead for software based solutions. Some vendors recognize the
growing need for IDS/IPS solutions for the SMB market. Thus far, the large vendors have not
adequately addressed that market and some smaller vendors such as Intoto are offering soft-
ware based products aimed specifically at the SMB. Vendors might have some success with
software based products targeted specifically at the low end.
H o s t I D S / I P S S o f t w a r e
Figure 2-6 shows the Total IDS/IPS Market: Host Software Unit Shipment and Revenue Fore-
casts (World), 2003-2013.
#N22B-74 © 2007 Frost & Sullivan www.frost.com 2-16

Note: All figures are rounded; the base year is 2006. Source: Frost & Sullivan
The host IDS/IPS market is full of interesting dynamics. In base year 2006, this market gener-
ated 203,700 units and $188 million in revenue. The 35 percent growth over 2005 was the
highest of any of the segments and was driven by increased legislative pressures to maintain
policy and change tracking. Little product development was found through the market, as
vendors focused R&D spending on network based solutions. There are already indications by
vendors that there are high expectations from this segment in 2006. Many vendors have
focused R&D on management and integration with network based solutions which has been
considered a huge problem in most host deployments. In 2006 and beyond, the market begins
to grow again as some of the spotlight will be shifted away from network based products.
During this timeframe marketing and development dollars will be reallocated, as legacy
applications and servers are upgraded, and as security becomes a more pervasive force
throughout the enterprise.
F i g u r e 2 - 6
Total IDS/IPS Market: Host Software Unit Shipment and Revenue Forecasts (World),
2003-2013
Unit Revenue
Units Growth Rate Revenues Growth Rate
Year (Thousands) (%) ($ Million) (%)
2003 118.9 --- 92.9 ---
2004 130.1 9.4 109.5 17.9
2005 148.7 14.3 139.3 27.1
2006 203.7 37.0 188.0 35.0
2007 249.8 22.6 243.6 29.6
2008 313.2 25.4 313.6 28.7
2009 389.9 24.5 397.3 26.7
2010 483.0 23.9 494.2 24.4
2011 578.6 19.8 603.0 22.0
2012 678.7 17.3 713.9 18.4
2013 775.1 14.2 834.6 16.9
Compound Annual Growth Rate (2006-2013): 23.7%
#N22B-74 © 2007 Frost & Sullivan www.frost.com 2-17

This segment of the market is still challenged by the separation of those responsible for
network security from those responsible for network servers; the later often denying security
administrators’ requests to deploy host sensors. Additional resistance from corporate policies
that dictate standardization of server applications will continue to be problematic for the
technology. Finally, the market is technologically fragmented. While multiple attack recogni-
tion capabilities are an improvement, most vendors currently offer only one or two of the
technologies. Substantial market opportunity exists for vendors who are able to unite all
methods of attack recognition in a single, lightweight sensor.
Figure 2-7 illustrates the Total IDS/IPS Market: Percent of Revenues by Product Type
(World), 2003-2013.
Note: All figures are rounded; the base year is 2006. Source: Frost & Sullivan
Chart 2.3 visually illustrates the Total IDS/IPS Market: Percent of Revenues by Product Type
(World), 2003-2013.
F i g u r e 2 - 7
Total IDS/IPS Market: Percent of Revenues by Product Type (World), 2003-2013
NIDS HW NIDS SW HIDS SW
Year (%) (%) (%)
2003 60.1 12.8 27.1
2004 71.3 8.5 20.2
2005 74.5 4.3 21.2
2006 74.5 1.3 24.2
2007 72.8 1.0 26.1
2008 71.1 0.8 28.1
2009 69.5 0.7 29.9
2010 67.9 0.5 31.6
2011 66.4 0.4 33.1
2012 65.3 0.4 34.4
2013 64.0 0.3 35.7
#N22B-74 © 2007 Frost & Sullivan www.frost.com 2-18

C h a r t 2 . 3
Total IDS/IPS Market: Percent of Revenues by Product Type (World), 2003-2013
Note: All figures are rounded; the base year is 2006. Source: Frost & Sullivan
Geographic Trends
Figure 2-8 is the Total IDS/IPS Market: Revenues by Geographic Region (World), 2003-2013.
Note: All figures are rounded; the base year is 2006. Source: Frost & Sullivan
F i g u r e 2 - 8
Total IDS/IPS Market: Revenues by Geographic Region (World), 2003-2013
North America EMEA APAC Latin America
Year ($ Million) ($ Million) ($ Million) ($ Million)
2003 250.5 48.0 41.2 3.4
2004 385.1 81.4 69.2 5.4
2005 421.3 118.5 111.4 6.6
2006 442.7 183.2 139.8 7.8
2007 512.6 228.2 177.1 18.6
2008 580.8 277.2 234.5 22.3
2009 651.9 316.9 319.3 39.9
2010 767.1 352.1 407.0 47.0
2011 855.6 393.3 491.5 72.8
2012 975.8 432.2 581.3 83.0
2013 1,076.4 477.7 702.0 93.6
0%
20%
40%
60%
80%
100%
Rev
enue
s
2003 2004 2005 2006 2007 2008 2009 2010 2011 2012 2013
NIDS HW NIDS SW HIDS
#N22B-74 © 2007 Frost & Sullivan www.frost.com 2-19
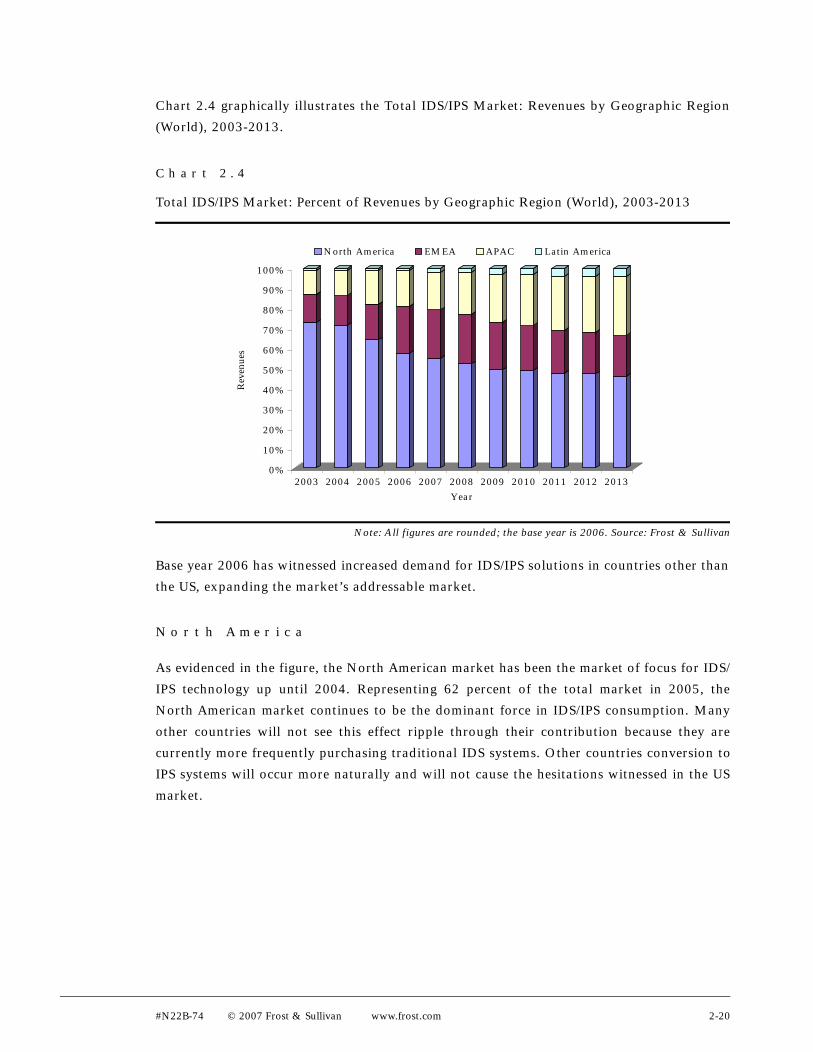
Chart 2.4 graphically illustrates the Total IDS/IPS Market: Revenues by Geographic Region
(World), 2003-2013.
C h a r t 2 . 4
Total IDS/IPS Market: Percent of Revenues by Geographic Region (World), 2003-2013
Note: All figures are rounded; the base year is 2006. Source: Frost & Sullivan
Base year 2006 has witnessed increased demand for IDS/IPS solutions in countries other than
the US, expanding the market’s addressable market.
N o r t h A m e r i c a
As evidenced in the figure, the North American market has been the market of focus for IDS/
IPS technology up until 2004. Representing 62 percent of the total market in 2005, the
North American market continues to be the dominant force in IDS/IPS consumption. Many
other countries will not see this effect ripple through their contribution because they are
currently more frequently purchasing traditional IDS systems. Other countries conversion to
IPS systems will occur more naturally and will not cause the hesitations witnessed in the US
market.
0%
10%
20%
30%
40%
50%
60%
70%
80%
90%
100%
Rev
enue
s
2003 2004 2005 2006 2007 2008 2009 2010 2011 2012 2013
Year
North America EMEA APAC Latin America
#N22B-74 © 2007 Frost & Sullivan www.frost.com 2-20

E M E A
The EMEA market is commonly considered to be about 9 months behind the adoption cycle
of the US market. The EMEA market is heavily regulated like the US market, but the EMEA
market often looks to the US for guidelines for best practices. Generally, EMEA buyers are
less frequently early adopters, which means that they are also less acquiescent to product
limitations such as bugs and delayed development paths. EMEA customers want a product
that does what it says it is going to do and are less interested in partnering with a vendor or
buying into a development roadmap. As such, EMEA customers are more frequently
consumers of appliances which are more simple to install and have fewer conflicts with
regard to OS interoperability, etc.
A P A C
Regulations in Japan centered around privacy and the conservative nature of buyers in China
create a market that is generally accepted as being 12 months behind the US adoption cycles.
Similar to EMEA buyers APAC buyers are less tolerant of the development glitches of new
IDS/IPS technologies. In general, APAC buyers comprise a more appliance based purchaser.
APAC’s contribution to the IDS/IPS market is ramping up quickly, with a 14 percent contri-
bution to the total market in base year 2004.
There has been a significant change in APAC revenue contributions since 2002. There are a
number of reasons for this change. First, there are a number of vendors in APAC that have
made significant revenues, usually in government deals. However these vendors such as LG
Nsys and Venustech only operate in specific APAC countries and do not contribute that
revenue to other regions. Frost & Sullivan has made a concentrated effort to include informa-
tion gathered from our global analysts in APAC. Readers wanting more information about
Frost & Sullivan’s global content should reference Frost & Sullivan’s Asia Pacific Network
Security Market Research.
L a t i n A m e r i c a
Latin American countries are generally considered to be 18-24 months behind US adoption
cycles. The LatAm area is improving their telecommunications infrastructure, and increas-
ingly relying on IT in business and personal lifestyles. However, IDS/IPS technology is a very
advanced technology, and is not currently an area of focus for most IDS/IPS vendors. In this
consideration, the LatAm region is probably even further behind US IDS/IPS adoption cycles
than the 18-24 months noted for most security technologies. The contribution of the LatAm
region rises to 7 percent by the end of the forecast period. At first glance, this contribution
may seem excessively small, but the market’s size by year 2010 keeps the LatAm contribution
in check.
#N22B-74 © 2007 Frost & Sullivan www.frost.com 2-21

Vertical Market Analysis
Because of the complexities associated with using IDS/IPS solutions, the vertical market
representation is more concentrated among industries with large enterprise networks and
those that are heavily regulated with regards to information security. As the market matures
and evolves, more vertical markets are expected to adopt the technology.
Figure 2-9 is the Total IDS/IPS Market: Revenues by Vertical Market (World), 2003-2013.
Note: Other includes retail, manufacturing and other verticals not specified
Note: All figures are rounded; the base year is 2006;. Source: Frost & Sullivan
Chart 2.5 is a graphical representation of the Total IDS/IPS Market: Revenues by Vertical
Market (World), 2003-2013.
F i g u r e 2 - 9
Total IDS/IPS Market: Revenues by Vertical Market (World), 2003-2013
Finance Gov’t Tech/Telecom Health Utilities Other
Year ($ Million) ($ Million) ($ Million) ($ Million) ($ Million) ($ Million)
2003 133.8 106.4 37.7 27.5 0.0 37.7
2004 189.8 141.0 70.5 59.7 10.8 70.5
2005 230.4 164.6 92.1 65.8 13.2 92.1
2006 225.2 170.9 132.0 108.7 46.6 93.2
2007 261.0 167.8 177.1 139.8 74.6 111.8
2008 312.7 156.4 234.5 178.7 89.3 145.2
2009 359.2 186.3 279.4 226.2 106.4 172.9
2010 391.4 219.2 344.4 266.1 125.2 219.2
2011 436.9 273.1 382.3 291.3 145.6 291.3
2012 477.5 290.7 436.0 311.4 124.6 436.0
2013 538.2 304.2 491.4 304.2 117.0 585.0
#N22B-74 © 2007 Frost & Sullivan www.frost.com 2-22

C h a r t 2 . 5
Total IDS/IPS Market: Percent of Revenues by Vertical Market (World), 2003-2013
Note: All figures are rounded; the base year is 2006. Source: Frost & Sullivan
F i n a n c i a l M a r k e t s
Financial markets are always the early adopters of security technologies. In markets such as
firewalls, PKI, and authentication, the world’s banks and insurance agencies are always
targeted over other verticals. There are several motivating factors behind this trend.
The first reason financial markets are early adopters of security technologies is simple arith-
metic. Banking transaction costs drop substantially by moving into an electronic realm, from
a few dollars per transaction made personally in a bank’s branch to a few cents for
processing electronic transactions. However, in order to convince customers to conduct their
financial business online, customers must feel completely comfortable with the security of
their transaction. The high return on investment that the financial industry realizes with the
transition to electronic banking easily justifies the implementation of extensive security
technologies.
Other reasons for the stability of the financial vertical include the fact that the industry is
one of the more wealthy industries. Even in the rare instance that a bank lacks the cash to
invest in security technologies, they are able to secure enviable loan rates. Couple this with
the fact that the size of financial networks demand large rollouts and high end equipment,
and the reasons for success in the financial vertical become clear. Finally, the effects of legis-
lation such as the GLBA (discussed in detail in the Legislation Trends section of this report)
will drive implementations of security technologies.
0%
10%
20%
30%
40%
50%
60%
70%
80%
90%
100%
Rev
enue
s
2003 2004 2005 2006 2007 2008 2009 2010 2011 2012 2013
Year
Financial Government Tech/Telecom Healthcare Utilities Other
#N22B-74 © 2007 Frost & Sullivan www.frost.com 2-23

The financial market begins the analysis period as the largest representation of IDS/IPS reve-
nues with a 39 percent contribution in 2002, and remains the largest market throughout the
forecast period. The relative size of the financial markets decline steadily throughout the
forecast period, as other markets recognize the value of the technology and are prodded by
legislation and economics to invest in the market.
G o v e r n m e n t M a r k e t s
Government markets consistently run a close second to the opportunity in the financial
markets. The government itself drives the development of many security technologies, then
drives decisive and substantial implementations of successful technologies. The government
markets will be driven by the legislation that the government has imposed upon itself.
Discussed in detail in the Legislative Trends section, there are many laws that require the
government to operate in secure environments.
As threats of terrorism ramp up, and the US government moves forward with the Department
of Homeland Security, security expenditures will be stimulated from the US government
sector. The government market may exceed the financial market size in units, but with the
discounts given to government customers, the market size is restrained compared to commer-
cial markets by the end of the forecast period. As an early adopter, the government markets
represent 31 percent of the IDS/IPS market in 2002. The government market’s contribution
to the IDS/IPS market declines quickly in the face of commercial uptake, which pays higher
prices for IDS/IPS equipment. By 2012, the government market represents just 13 percent of
the total market, as other vertical markets increase their contribution to the total market.
T e c h n o l o g y a n d T e l e c o m B a s e d B u s i n e s s e s
Ramping up slightly after the dot com bust, technology-based businesses are expected to
make a comeback late in the market’s forecast as technology continues to permeate all facets
of all businesses. Emerging from recessionary climates, telecom and service providers began
increasing their spending on IDS/IPS technologies in 2004 and this increase spending is
expected to increase through the forecast period.
Technology businesses will represent the second largest segment, with a stable 21 percent of
the market by 2012.
#N22B-74 © 2007 Frost & Sullivan www.frost.com 2-24

H e a l t h c a r e M a r k e t s
Like many of the most promising trends, healthcare implementations have been stalled over
the last several years. The esoteric nature of the HIPAA legislation itself has created contro-
versy regarding what compliance really means and until recently has created a
"wait-and-see" disposition. The effects of HIPAA on IDS/IPS markets has not been as strong
as it has in other markets, but this sector is definitely making a notable contribution. As
healthcare institutions complete their investments in other fundamental security technolo-
gies, budgets are expected to turn towards IDS/IPS in an increasing fashion.
Unfortunately, even with HIPAA deadlines having past, there is still a huge amount of confu-
sion concerning compliance in this market. Though spending has increased and will likely
increase, the uncertainty in the market has tempered the high growth originally expected out
of this market. This market’s contribution jumps in 2005 to 15 percent from 10 percent in
2002. Strong contributions from this vertical continue through 2007 as the aforementioned
understanding of compliance is more accurately defined and other deadlines pass. After-
wards, a stark drop in contribution from this segment will be the result of a market
approaching saturation. The market slows substantially thereafter, supported mostly by
continued expansion of healthcare facilities and networks, to 13 percent of the market in
2010.
U t i l i t i e s M a r k e t s
The utilities vertical has not been a notable contributor of revenues in the past, representing
2 percent in 2001 and 2002, but is an area of increasing focus as vendors are ramping up
sales in this market. Utilities have historically relied on private networks and esoteric
networking protocols for protection. Increasingly, utilities are using public networks to
communicate with their assets and are taking advantage of common networking technologies
such as IP communications. As utilities networks start to look much more like a standard
enterprise network their risk increases substantially. Threats of terrorist activity on utility
infrastructures have piqued the interest of this vertical. Successful hacking efforts in
Australia causing the pollution of urban water supplies have also caused increased interest.
Since 2003 was the first year of considerable sales to this segment, this market’s specific
contribution is expected to increase in coming years to 8 percent. The market holds a stable
8 percent contribution through the majority of the forecast period as IDS/IPS systems
increasingly become a best practice among utilities. Although the contribution percentage is
stable, being stable through a market growth cycle represents annual increases in spending
that mirror the total IDS/IPS market’s growth rate.
#N22B-74 © 2007 Frost & Sullivan www.frost.com 2-25

O t h e r M a r k e t s
The "other" category includes some of the less technically savvy businesses, such as transpor-
tation and manufacturing. These markets will be the latest adopters of IDS/IPS technology,
representing a weaker contribution to the total market until later in the forecast period.
These businesses will become more interested as networking and communication become
more important to their operations. This trend is illustrated in the growth of the "others"
category to 25 percent of total revenues in 2010.
Technology Trends
I n t r u s i o n D e t e c t i o n v e r s u s I n t r u s i o n P r e v e n t i o n
Probably the most definitive technological trend in the market in 2005 is the shift from intru-
sion detection to intrusion prevention. This trend has sparked controversial strategies and
positioning from competitors as the market develops. Initially, NIDS capabilities were limited
to alerting when traffic matched a database of signatures. While signature based recognition
is fairly effective against known threats it is unable to stop attacks that have not yet been
discovered. Aggravating the problem of signature detection is the fact that, by default, signa-
tures are written to include many different scenarios which increases the number of false
positives. The tuning of a signature based system is an ongoing and difficult process, and has
reduced the usability of the technology. Fundamentally the problem remains in the reactive
nature of the technology. Merely alerting to the fact that an attack has occurred leaves
administrators with the task of researching to determine the extent of damage and then
repairing if necessary.
A greater value proposition has evolved in intrusion prevention, yet this model is not without
it’s own flaws. The number of false positives generated by traditional IDS systems have
aroused a level of distrust from customers regarding the effectiveness of the technology.
Customers are therefore wary of allowing an ineffective technology to make decisions
regarding which traffic is allowed to progress through a network. The potential blocking of
legitimate traffic would create an equally undesirable result, and customers are therefore
hesitant to allow an IDS/IPS system to make such decisions. Here, the value of traditional
IDS systems is reinstated, alerting administrators to a potential problem yet allowing them to
make the ultimate decision regarding the legitimacy of traffic.
#N22B-74 © 2007 Frost & Sullivan www.frost.com 2-26

Before IDS/IPS systems can be trusted to make allow/deny decisions, they must evolve to a
higher level of accuracy and instill trust in the technology. Recently many vendors have
attempted to strike a balance between the two schools of thought, by blocking known
attacks, and sounding alarms for traffic that looks suspicious but are not positively identifi-
able as malicious. Many vendors even try to classify certain behaviors and assign a
probability index.
V u l n e r a b i l i t y A s s e s s m e n t
In the quest to improve the effectiveness of IDS/IPS technology and reduce false positives,
vendors such as Sourcefire and TippingPoint have begun to implement vulnerability assess-
ment capabilities to their solutions. The technology periodically scans a network and
maintains a database of existing operating systems, applications, platforms, service packs,
and the like. This information is cross referenced when malicious traffic is detected to deter-
mine the relevance of the attack. With this technology, administrators are spared the time
and inconvenience of responding to an alarm for attacks on services or equipment that do not
reside on the network, because they are effectively benign.
H I P S O p t i o n s
A unique identifier of IDS and IPS technology is the plethora of various host IDS/IPS technol-
ogies on the market today. Host IDS/IPS technology has grown to encompass many different
technologies that are all designed for the same purpose: to protect the host. These technolo-
gies include file integrity, DDoS protection, log analysis, policy management, and OS
hardening. With the continued development of host intrusion technologies, the ability to
marry these technologies together will present considerable opportunity for companies
endeavoring to offer a more complete and secure product to customers. Currently however,
the youth of the technologies commands a significant level of attention and development by
independent companies, and therefore remains largely as independent products.
As mentioned in other sections of this research, drawbacks of host based options include
incompatibility with legacy servers and applications, and the difficulties associated with
getting security administrators and application or server administrators to work together.
However, improvements in unified management consoles that can control the policies of both
network and host based solutions from a single management station are expected to boost
sales of both technologies.
#N22B-74 © 2007 Frost & Sullivan www.frost.com 2-27

S i g n a t u r e s , A n o m a l i e s , a n d P o l i c i e s
The various methods of detection and prevention discussed in this section and in the Market
Overview and Definitions section of this study have been one of the best evolutions of IDS/
IPS technology over the last few years. Whereas the market was introduced with only signa-
ture based detection, the market has in many ways reinvented itself with these additional
methods of detection, adding multiple strategies to the identification of malicious traffic.
While signatures protect only against known threats, anomaly and policy based detection
have added a level of capability to detect against unknown threats as well. Currently, even
veteran vendors such as Cisco and ISS are beginning to implement a combination of signature
based detection with another form of detection. These market leaders have been spurred to
improve their technologies with multiple attack recognition methods that were pioneered by
the market’s smaller startups. Since each of these technologies employs a different strategy
for protection against different types of threats, no one technology will ever replace another.
Rather, each of these technologies will increasingly be used in conjunction with the other as
the market continues to develop. Some newer companies such as MazuNetworks have
created technologies that are 100 percent behavioral based. Time will tell how well these
technologies fare in the market, but the leveraging of multiple attack recognition methodolo-
gies is currently considered a best practice in IDS/IPS product development.
A l l I n O n e S e c u r i t y D e v i c e s
The natural evolution of security technology is to bundle an increasing amount of function-
ality into a single device. This trend has manifested itself in the security market with the
combination of VPN, firewall, IDS/IPS, and anti-virus technology all on a single appliance.
With the movement to inline IDS/IPS sensors, the intrusion system can provide real-time
blocking of traffic that is deemed malicious. The logical progression then, is the bundling of
this technology with firewall technology, since both technologies are providing similar func-
tions. This trend has already begun to emerge with competitors such as Check Point,
Fortinet, Juniper, and SonicWALL are building IDS/IPS technology into their firewall prod-
ucts. This trend is currently at a very early stage of development, with only minimal IDS/IPS
functionality built into firewalls and only minimal firewall functionality built into IDS/IPS
systems. The next few years will witness tighter integration of management and policy capa-
bilities as full NIPS technology becomes part of full firewall technology and vice versa.
#N22B-74 © 2007 Frost & Sullivan www.frost.com 2-28

Advantages of multiple services running on single devices include lower cost, centralized
management, a more "intelligent" system, and ease of use. Historically, the lack of techno-
logical development of each individual technology and the lack of performance from
platforms have prevented this trend from emerging successfully in the marketplace. Large
enterprise customers have been more concerned with high-performance, best of breed tech-
nologies, and demanded the development capabilities of separate vendors for each
technology. With improved processing power and more efficient software, the performance
problem of multiple services on a single platform has been negated to a certain extent. As the
technologies have developed more fully, they have experienced a slight degree of commoditi-
zation which has reduced the advantages of best of breed strategies for everyone but the
largest and most sophisticated networks. Finally, new software and ASIC architectures allow
multiple types of code including firewall, anti-virus and VPN to inspect the traffic simultane-
ously instead of having each module inspect code separately.
Running multiple services on single platforms is not without its disadvantages. Initial
customer acceptance has been slower due to the historical mentality of customers demanding
best of breed technologies discussed previously. More importantly, multiple services on a
single device provides a single point of failure, which contradicts the layered approach to
security that a separate IDS/IPS system provides. These disadvantages are more important to
the large enterprise class of customers, and as the intrusion market expands towards the SMB
market, the disadvantages become less important. SMB customers are more price sensitive,
and more concerned with simplistic setup and management of devices, even if they provide
slightly lower grades of protection than multiple point products.
M a n a g e m e n t V e r s u s S e n s o r s
Continually increasing in importance is the ability to centrally control, configure, and
comprehend the actions of the sensors. With improved management comes scalability, ease of
use, lower TCO, and tighter security through intuitive interfaces that reduce configuration
errors. All of these improvements are, of course, needed in the IDS/IPS space, but most of the
development of the technology has been aimed at the sensors. These developments will
include improved performance, greater correlation capabilities, more adaptive technology,
and integration of signature, policy and anomaly based detection mechanisms. Vendors are
beginning to focus development on management consoles that can control both host and
network IDS/IPS solutions from a single console, which will boost sales of both types of IDS/
IPS systems. Additionally, as IDS/IPS technology becomes more mature and integrated into
the network infrastructure, sensors are being replaced by devices that act more as switched
and are capable of monitoring traffic on entire segments of the network.
#N22B-74 © 2007 Frost & Sullivan www.frost.com 2-29

S t a n d a r d s
An impediment to the development and market acceptance of IDS/IPS technologies has been
the lack of standards in the industry. Standardization in technology provides advantages that
are hard to argue against. Specifically in the IDS/IPS space, the ability to further analyze,
process, or correlate the output generated by IDS/IPS technologies is limited with a lack of
standardization. Additionally, the ability for IDS/IPS products to interoperate is a major
hindrance to the development of the market caused by a lack of standards.
The creation of standards is an arduous and inherently frustrating process, mainly because
every vendor believes that their technology is the best and therefore endeavors for market
standardization on their format. Getting so many vendors to agree on how to best do some-
thing is also difficult, because some will have greater difficulty in standard adherence than
others. Additionally, the development of standards takes a long time. Ambitious companies
looking to seize market opportunities are unwilling to wait for the market to develop stand-
ards; they would prefer to move the market.
Given the reality that standardization is a distant hope at best, vendors have begun to build
interoperability and hooks into each other’s equipment on an ad hoc basis. This strategy has
been especially prevalent in the plethora of new competitors that have entered the market in
recent years. Cisco has worked to release such standards, but the rest of the market has yet
to endorse these standards.
I P v 6
IPv6 was designed to address the problem of running out of IP addresses. IPv6 has numerous
features built in, including encryption and Quality of Service (QoS). Worldwide, Europe and
Asia have begun to deploy IPv6 networks while North America has just started to look at
IPv6. The United Stated Department of Defense and Federal Government have mandated that
all their networks will support IPv6 by 2008. Even though most vendors have not seen
customer demand for IPv6, most IDS/IPS vendors seem to agree that IPv6 should be on the
roadmap, and several vendors have started supporting IPv6 in their products. It is difficult at
this point to determine the extent that IPv6 will have an effect on the IDS/IPS market due to
the lack of deployment at this point, but it is a technology to be watching in the future.
Distribution Channel Analysis
An analysis of the progression of distribution channels usually provides a key metric in the
assessment of the development of a security technology market. Within the IDS/IPS market,
distribution channels are far from mature, but are improving. At time of writing, the
majority of the market is distributed through more direct channels than indirect channels.
Vendors reach much of the market through their in-house sales forces.
#N22B-74 © 2007 Frost & Sullivan www.frost.com 2-30

VARs and SIs have played a crucial role in the development of the market, as many customers
rely heavily on the expertise and recommendations of these technology implementers. Often
during implementation, vendors will provide their own on-site consultants to aid in the
deployment of network intrusion technologies. This hands-on vendor interaction with
customers is characteristic of the network intrusion space because of the complexity of
deploying and tuning network intrusion systems.
As IDS/IPS technology continues to mature and improve its simplicity of deployment, it is
becoming a more attractive solution to more customers, especially in the SMB space.
Currently however, the complexity of the networks that the IDS/IPS technology is attempting
to protect dictate custom deployment scenarios. Also complicating deployments are the legis-
lative requirements that are driving deployment of IDS/IPS systems for large enterprises. The
requirements imposed on companies for legislative compliance vary widely depending on the
nature of the customer, resulting in highly customized deployment scenarios which prevent
large scale distribution from evolving.
Another inhibitor of ease of IDS/IPS deployment is the lack of standards for data output.
Discussed in detail in the Technology Trends section of this research, the capabilities of data
manipulation and interoperability are stifled by the fact that each vendor’s output is in a
proprietary format. If IDS/IPS technology can standardize among vendors, interoperability
will improve and the market will move closer to mass distribution methods. In the meantime,
the high degree of customized deployment hinders distribution channel evolution.
Difficulty with IDS/IPS deployment creates the need for security specialists and has influ-
enced the VARs and SIs with which vendors seek to partner. When security was a young
market, any networking reseller or integrator was a potential partner. Many VARs and SIs
have evolved to become security specialist resellers and integrators as a means of differentia-
tion. This new breed of reseller has become an attractive alternative to vendors that rely on
the expertise of the resellers and integrators to install and configure their equipment correctly
(which, in turn reflects well on the vendors equipment). Especially in the more complicated
markets such as IDS/IPS, vendors have become increasingly selective of their reseller and inte-
grator partners. These security specialist resellers and integrators offer more value to vendors
through their ability to not only sell, but install, configure, maintain, and service equipment,
as well as train customers and even help vendors position their products more successfully.
M S S P s
MSSPs provide a key method for bringing IDS/IPS technology to the market. These organiza-
tions posses the technical expertise to properly configure IDS/IPS solutions, and add value by
assuming such roles. MSSPs have not brought as much success to the IDS/IPS market as was
once hoped. Intrusion vendors remain optimistic regarding the opportunity residing in
managed security services, and look forward to the further development of the MSSP market
to turn those opportunities into revenue figures.
#N22B-74 © 2007 Frost & Sullivan www.frost.com 2-31

Pricing Analysis
Pricing in the IDS/IPS marketplace has remained fairly stable. In the network IDS/IPS appli-
ance market, the success of new IPS appliance vendors such as TippingPoint and McAfee
have increased the weighted ASP for these technologies. The IPS value proposition and higher
performance from these vendors is creating slightly higher pricing points and margins. As the
more traditional network IDS appliance vendors shifted their positioning from IDS to IPS,
average prices grew in 2004 before beginning to decline slightly in 2005. In 2006,
Frost & Sullivan saw stability in pricing as many vendors increase the functionality of their
devices, but prices stay relative flat.
The stability of IDS/IPS prices have mainly been a function of continued development in the
capabilities of products and the lack of market saturation. Management consoles have
improved significantly, adding usability and effectiveness to the entire system. This effective-
ness and usability has begun to expand the addressable market beyond the large enterprise
adopters. With an expanding addressable market, competition is more relaxed and allows
vendors to avoid pricing wars.
Since gigabit speed capabilities have been introduced to the market, prices of those products
have fallen slightly as more competitors released similar products. Initially high pricing
premiums were commanded from this new technology, but competing product releases have
brought prices of gigabit speed IDS/IPS sensors down.
Initially, open source IDS/IPS alternatives were expected to create pricing pressure for IDS/
IPS technology. Thus far however, IDS/IPS technology has mainly been targeted at the large
enterprise market, which is fundamentally less price sensitive. The large enterprise customer
base recognizes the importance of network security, and is therefore willing to pay higher
prices to implement technologies that are easier to use and provide technical support, serv-
ices, and warranties. While a significant number of open source deployments exist, this
particular market dynamic has had little effect on prices of commercial products.
As the market expands down the scale to address the SMB and eventually SOHO markets,
prices will face increasing pressure in the long term. Currently however, the capabilities and
combinations of technologies still have significant room for development and the SMB and
SOHO markets still seem focused on UTM type devices as opposed to dedicated IPS. IBM
and TippingPoint have released IPS devices in the 50 Mps range, but the prices are still higher
than most SMB or SOHOs are willing to spend.
#N22B-74 © 2007 Frost & Sullivan www.frost.com 2-32

Figure 2-10 illustrates the Total IDS/IPS Market: Network IDS/IPS Appliance Average of
Throughput per Price Band (World), 2006.
Note: All figures are rounded; the base year is 2006. Source: Frost & Sullivan
Chart 2.6 graphically illustrates the Total IDS/IPS Market: Network IDS/IPS Appliance
Average of Throughput per Price Band (World), 2006.
C h a r t 2 . 6
Total IDS/IPS Market: Network IDS/IPS Appliance Average of Throughput per Price Band
(World), 2006
Note: All figures are rounded; the base year is 2006. Source: Frost & Sullivan
F i g u r e 2 - 1 0
Total IDS/IPS Market: Network IDS/IPS Appliance Average of Throughput per Price Band
(World), 2006
Throughput Average Price ($)
10 Mbps 4,995
50 Mbps 4,995
100 Mbps 11,898
400 Mbps 36,662
600 Mbps 34,995
1 Gbps 57,997
2 Gbps 87,495
5+ Gbps 141,246
0
20,000
40,000
60,000
80,000
100,000
120,000
140,000
160,000
Pric
e ($
)
10 Mbps 50 Mbps 100Mbps
400Mbps
600Mbps
1 Gbps 2 Gbps 5+ Gbps
#N22B-74 © 2007 Frost & Sullivan www.frost.com 2-33

Figure 2-11 illustrates the Total IDS/IPS Market: Network IDS/IPS Appliances Average Price
per Megabit per second (Mbps) (World), 2006.
Note: All figures are rounded; the base year is 2006. Source: Frost & Sullivan
Chart 2.7 graphically illustrate the Total IDS/IPS Market: Network IDS/IPS Appliances
Average Price per Megabit per second (Mbps) (World), 2006.
C h a r t 2 . 7
Total IDS/IPS Market: Network IDS/IPS Appliances Average Price per Megabit per Second
(Mbps) (World), 2006
Note: All figures are rounded; the base year is 2006. Source: Frost & Sullivan
F i g u r e 2 - 1 1
Total IDS/IPS Market: Network IDS/IPS Appliances Average Price per Megabit per Second
(Mbps) (World), 2006
Throughput Average Price per Mbps ($)
10 Mbps 499.50
50 Mbps 99.90
100 Mbps 118.98
400 Mbps 91.65
600 Mbps 58.33
1 Gbps 58.00
2 Gbps 43.75
5+ Gbps 28.25
0
50
100
150
200
250
300
350
400
450
500
Pric
e ($
)
10 Mbps 50 Mbps 100Mbps
400Mbps
600Mbps
1 Gbps 2 Gbps 5+ Gbps
#N22B-74 © 2007 Frost & Sullivan www.frost.com 2-34

Legislation Impacting the IDS/IPS Market
L e g i s l a t i o n
There are several pieces of legislation that have had a positive impact on the security market
in general. The following are examples of legislation encouraging the development of
securing both Federal and private sector information systems.
P a y m e n t C a r d I n d u s t r y ( P C I ) D a t a S e c u r i t y S t a n d a r d
To establish common industry standards, Visa and MasterCard have produced the Payment
Card Industry (PCI) Data Security Standard—a common set of industry requirements to
ensure the safe handling of Cardholder information. The PCI standards have been developed
to set a 'minimum standard' in the marketplace with regards to the protection of cardholder's
sensitive account and transaction information. The standard required that vendors perform
the following actions:
■ Build and maintain a secure network
■ Protect cardholder data
■ Maintain a vulnerability management program
■ Implement strong access control measures
■ Regularly monitor and test networks
H I P A A
The Health Insurance Portability and Accountability Act (HIPAA) was signed into law on
August 21, 1996. The main goals of the HIPAA are 1) to guarantee health insurance coverage
of workers during job transitions 2) protect privacy of patient records 3) promote national,
uniform security standards for the secure electronic transmission of health information. As
organizations conform to HIPAA compliance regulations, a host of security solutions are
being experimented with and implemented by hospitals, doctors, pharmacies, and insurance
companies.
While firewalls are a given in the protection of healthcare networks, SECC systems are not
necessarily considered critical for compliance. Almost unanimously, vendors are finally
reporting traction from this highly anticipated legislation. In 2000, this particular piece of
legislation was expected to be a significant boost to several security markets, SECC included.
The industry has been a somewhat disappointed in the effects of this legislation to date. The
law itself has left those affected by it unsure as to exactly what is required to be in compli-
ance, and have therefore delayed implementations. Many practitioners are of the opinion
that the specifics of what does and does not equate to compliance will be decided through a
series of court rulings as lawyers and judges nail down the interpretation of the legislation.
#N22B-74 © 2007 Frost & Sullivan www.frost.com 2-35

With the April 14, 2004 deadline having passed, many healthcare institutions have been
conducting internal audits to improve their security policy. Industry best practices are
commonly being referred to and implemented, with a focus on auditing and logging capabili-
ties with networks. Even though the deadline is upon the market, HIPAA-related sales of
SECC systems grew strongly through 2004 before slowing to a more moderate pace for
2005 and beyond.
G r a m m - L e a c h - B l i l e y ( G L B ) A c t
The Gramm-Leach-Bliley Act is also known as the Financial Services Modernization Act.
This Act is targeted at the financial market, and has many implications regarding the affilia-
tion among banks, securities firms, and insurance companies. The Act also address the
privacy of consumer data and its exchange.
Given the sensitivity of financial information, the financial sector has needed little
convincing of the need for securing their communications. Financial institutions are always
considered early adopters of security technologies, because of the size of their networks, the
sensitivity of the data on the network, and their large budgets. While GLB is a considerable
driver of the integration of security within financial networks, this industry has already
invested considerably, and is expected to continue to invest in security technologies; so a
salient spike in sales directly attributable to GLB will not be found. However, the financial
markets are expected to continue to be a large contributor to the market throughout the fore-
cast period.
C a l i f o r n i a S e c u r i t y B r e a c h I n f o r m a t i o n A c t ( S B 1 3 8 6 )
Effective July, 2003, this law requires anyone doing business in California to notify anyone
whose personal information has been attained by an unauthorized party. Essentially, this law
requires businesses to make public any security breach that results in the compromise of
personal information. By holding entities responsible for disclosing security breaches, those
entities will be more motivated to prevent such security breaches, thus stimulating demand
for SECC. As a result of this law, the last year has seen a startling increase in the reporting of
security breaches and potential data thefts from a variety of companies, most notably the
Veterans Administration and TJX.
Arkansas, Georgia, Indiana, Montana, Washington, and Illinois have all passed laws similar
to California SB 1386, and many other states are following suit.
#N22B-74 © 2007 Frost & Sullivan www.frost.com 2-36

S a r b a n e s - O x l e y A c t ( S a r b - O x )
This legislation sets and enforces standards for corporate financial accountability. Intended
to reduce fraud and conflicts of interest, this legislation mandates that CEOs, CFOs, and
auditing firms attest to the validity of financial records and audits, establishes management’s
responsibility for internal control and financial reporting, and requires enterprises to report
material changes in financial conditions or operations on a rapid and current basis.
H o m e l a n d S e c u r i t y
The Homeland Security strategy has the primary purpose of mobilizing and organizing the
United States to secure the U.S. homeland from terrorist attacks and reduce the vulnerabili-
ties to terrorism, as well as coordinate efforts after terrorism occurs. At the federal level
critical infrastructure needs to share information, and to streamline information sharing
among law enforcement and intelligence. Also there are plans to improve extradition
personnel, military organizations, and the organization of the departments that are involved
in national security and fighting terrorism. The President has outlined plans to create a new
Department of Homeland Security that would bring together twenty-two different entities
that all currently play a role in homeland security actions.
The division of funding to the various government levels is yet to be determined and is in the
preliminary stages. Funding will focus on infrastructure, first response, and information
sharing between federal agencies (horizontally) and between federal, state and local levels
(vertically). This will create major changes in the level of participation at the federal level.
While the dollar amount at the federal level will hinge on the President and the new Depart-
ment’s decision on the dissemination of funding, this legislation has increased awareness and
demand for security equipment and services.
E u r o p e a n L e g i s l a t i o n
The European Union is still lagging behind in the implementation of adequate IT security
policies. European governments want to implement new laws on issues such as dealing with
Internet crime and network vandalism, but have little experience and are clearly lagging
behind the U.S. government initiatives. In addition, there seems to be country by country
laws that make universal agreements difficult to attain.
However, the implementation of adequate legislation on these issues would help improve IT
security in the European Union. Nonetheless, security vendors are in most cases compliant
with US regulation and even though the EU is very vague on these issues, the security prod-
ucts are already delivered to US standards. As such, there are several pieces of legislation that
have had a positive impact on the European security market in general. Legislation such as
the EU Electronic Signature Directive of 1998, the EU Data Protection Directive and from the
US the HIPAA, the Gramm-Leach Bliley (GLB), the Computer Security Enhancement Act of
2001 and the Federal Information Processing Standard (FIPS) 140-1 have all had positive
effects on the quality of European security.
#N22B-74 © 2007 Frost & Sullivan www.frost.com 2-37

B a s e l I I
Basel II is a round of deliberations by central bankers from around the world, under the
auspices of the Basel Committee on Banking Supervision (BCBS) in Basel, Switzerland, aimed
at producing uniformity in the way banks and banking regulators approach risk management
across national borders. The Basel II deliberations began in January 2001, driven largely by
concern about the arbitrage issues that develop when regulatory capital requirements diverge
from accurate economic capital calculations. Basel II recommends "three pillars"—risk
appraisal and control, supervision of the assets & monitoring of the financial market—to
bring stability to the financial system.
U . K . C o m p a n i e s ( A u d i t , I n v e s t i g a t i o n s a n d C o m m u n i t y
E n t e r p r i s e ) B i l l
Similar to Sarbanes-Oxley, this legislation is designed to enforce standards in U.K. compa-
nies' auditing, accounting, and reporting. This legislation mandates that directors comply
with auditing tasks, and facilitates investigations for those companies suspected of with-
holding information from auditors.
IDS/IPS Certification
N S S L a b s
Established in 1991, NSS Labs (http://www.nss.co.uk/) has emerged as a reliable, third party
verification for both IDS and IPS products. Many vendors acknowledge the NSS certifica-
tions as a legitimate validation of products and many customers are looking towards NSS as
being a comprehensive testing body for IDS and IPS products. All products submitted for
testing by NSS undergo the same testing procedure. All vendors pay the same fee for testing,
based on lab setup and time required to perform testing. Vendors cannot sponsor tests, nor
can vendors choose which parts of the test are applied to their products. Vendors are allowed
to keep the test results private should they fail provided that they agree to fix the faults
found and re-submit for testing at a later date.
There are three levels of certification awarded by NSS:
■ NSS Tested
■ NSS Approved
■ NSS Gold
#N22B-74 © 2007 Frost & Sullivan www.frost.com 2-38

NSS Tested
Indicated that a product underwent testing by the group.
NSS Approved
Awarded to all products which successfully complete all of the NSS tests to the required
standard as specified in the testing criteria.
NSS Gold
An award given to products that not only pass the required testing requirements but which
NSS feel are of exceptional value.
NSS looks at a wide range of criteria in its testing. For IPS testing, the following categories
are considered:
■ Performance
■ Latency and User Response Times
■ Stability and Reliability
■ Detection Accuracy and Breadth
■ Resistance to Evasion Techniques
■ Stateful Operation
■ Usability
Similarly, for IDS, the following criteria are considered:
■ Attack Recognition
■ Resistance to False Positives
■ Evasion
■ Stateful Operation
■ Performance Under Load
■ Stability and Reliability
■ Management and Configuration
#N22B-74 © 2007 Frost & Sullivan www.frost.com 2-39

I C S A C e r t i f i c a t i o n
ICSA Labs began a certification program in July, 2002 for the certification of network intru-
sion detection systems. The enterprise community has come to rely on ICSA certification as a
method of validation of the level of security for most commercial security products. The
ability for a credible research organization to effectively test the capabilities of security tech-
nologies will help to establish a baseline of standards and quality that can be referenced by
enterprises who do not have the time or resources to critique a wide variety of products.
However, this certification is less important in the IDS/IPS market than in many other secu-
rity technology markets. At time of writing, Cisco, Fortinet, and Sourcefire are the only
companies to have achieved ICSA intrusion detection certification.
ICSA Certification can be earned for the following technologies:
■ Antivirus
■ Firewall
■ Secure Internet Filtering
■ PC Firewall
■ Cryptography
■ Intrusion Detection
■ IPSec VPN
■ Wireless LAN
■ SSL-TLS
Acquisition of ICSA certification is accomplished by sending the product to ICSA’s laborato-
ries along with all documentation. The product is then put through a testing process based on
the type of certification applied for. IDS products can be certified at three levels based on the
speed of the connection (T1, T3, and Gigabit). Certification at all three levels of speed costs
$40,000. Certification for a single speed threshold costs $25,000. These rates apply to single
products. If a product family runs the same code base on hardware platforms provided by the
vendor, then a nominal additional fee can be charged to certify those additional product
lines. If the product runs on various brands of platforms, each platform must be certified
independently.
#N22B-74 © 2007 Frost & Sullivan www.frost.com 2-40

If the product passes, ICSA Certification is granted, and the test results are provided. If the
product fails, reasons for failure are given, and the product may be resubmitted after further
development. Virtually all products submitted fail the certification process the first time. One
common reason for failure are false positives. A whitepaper is provided at the ICSA Labs
website outlining important considerations for IDS technologies. The average testing time for
an IDS product is 60-90 days. More information can be found at http://www.icsalabs.com.
ICSA notes that one of their clients is the Industrial Technology Research Institute (ITRI).
This organization was founded by the Taiwanese government to attend to the technological
needs of Taiwan’s industrial development. The ITRI has worked closely with ICSA to develop
a single code base for technologies that meet the requirements of the ICSA Certification
program. This code base is distributed to security organizations in Taiwan who want to base
a product on this ICSA certified code base. Those Taiwanese security companies imple-
menting this code have a headstart in providing ICSA certified technologies.
C o m m o n C r i t e r i a C e r t i f i c a t i o n
Common Criteria Evaluation under the National Information Assurance Partnership (NIAP)
program whose certification is rapidly increasing in popularity. NIAP is a joint effort estab-
lished by the National Institute of Standards and Technology (NIST) and the National
Security Agency (NSA) to evaluate IT product conformance to international standards. Offi-
cially known as the NIAP Common Criteria Evaluation and Validation Scheme for IT
Security (CCEVS), this program is a partnership between the public and private sectors. The
goal of Common Criteria is to help customers select commercial-off-the-shelf IT products
that meet their security requirements and to help manufacturers of those products gain
acceptance in the global marketplace.
Products wishing to receive certification must be sent to any of several worldwide CC testing
facilities, and will be put through a series of tests depending on the level of certification
desired. Products can be certified at Evaluation Assurance Levels (EAL) 1, 2, 3, or 4 (higher
assurance levels guarantee more stringent levels of security). All security-relevant informa-
tion and documentation produced during the IT product development process shall be
included in the deliverables supplied to the CCTL conducting the evaluation.
V e n d o r C e r t i f i c a t i o n s
Vendor specific certifications have grown increasingly important in security technology
markets as well. These certifications not only illustrate their interoperability with other secu-
rity technologies, but serve as validation for the market acceptance of certified technologies,
through partner vendor endorsements. Partnerships with firewall market leaders Check Point
and Cisco increase the value of IDS/IPS products that are guaranteed to interoperate with the
large installed base of these vendors’ firewalls.
#N22B-74 © 2007 Frost & Sullivan www.frost.com 2-41

Looking forward, a new breed of management consoles temporarily dubbed enterprise secu-
rity event correlation engines will become increasingly important in the future. This software
will be able to receive data from multiple vendors security devices, normalize the data, and
understand the relationships between firewall events, IDS/IPS events, network performance,
antivirus technology, and other inputs to give administrators a more clear understanding of
the network’s security status. Currently, this technology is extremely immature, but compa-
nies such as ArcSight, e-Security (now Novell), Micromuse (now IBM), Intellitactics and
Network Intelligence will need to interoperate with IDS/IPS products in order to receive,
normalize, and correlate the data from these devices.
C o m p e t i t i v e A n a l y s i s
Market Structure
The IDS/IPS market has witnessed incredible growth with a large number of competitors with
technologies and products that cover the entire spectrum of customers and methodologies.
Fueled by legislation, increasing attacks, and an increasing awareness of the problem and the
necessity to respond to it, many vendors find that customers have allocated healthy budgets
specifically for IDS/IPS products. However, all this competition has led to lots of noise in the
market. Customers education and differentiation were the primary challenge sited by vendors
and the market is poised for a shake-out in the near future.
The majority of the market’s growth has been attributable to newer market entrants with
powerful IPS appliances. Competitors such as Arbor Networks, Sourcefire, Juniper
Networks, McAfee and TippingPoint have ramped up sales significantly in 2004 while the
majority of remaining players have been flat. These companies still represent a smaller
portion of total market share, but are winning large portions of market share from incum-
bents such as Cisco and ISS. However, the larger incumbents have started to react to
customer demands and have introduced products and focused marketing efforts designed to
compete directly against many of the smaller vendors.
The market is divided among three tiers of competition. The first tier, comprised of ISS and
Cisco controls 45 percent of the market. The second tier, comprised of players such as
McAfee, Tripwire, TippingPoint and Symantec, competes directly with the first tier. Compa-
nies such as Arbor Networks, Juniper Networks and Sourcefire are also part of this second
tier even though their 2004 market share is 5 percent or less each. All other players comprise
the third tier of competition.
#N22B-74 © 2007 Frost & Sullivan www.frost.com 2-42

N e t w o r k I D S / I P S A p p l i a n c e s a n d S o f t w a r e
For years the market favored passive IDS devices running out-of-band. The technology was
not accurate enough or powerful enough to run inline. Vendors with inline prevention prod-
ucts had a difficult time overcoming the negative connotations of IDS systems. In 2004 and
2005 these same vendors have positioned themselves as superior evolutions of traditional
NIDS technology by touting effective prevention and inline deployment. The market has
begun to embrace the notion of inline protection, and even though most devices are being
deployed in alert mode initially, customers want the ability to eventually migrate to inline
protection. As evolved network IDS/IPS technologies prove their accuracy and capabilities,
inline preventative solutions are becoming a more attractive option.
The technological capabilities of these new players have spurred the incumbents to improve
the development of their technology to make sure they don’t lose customers. Unfortunately
many traditional NIDS players reacted later than they should have, which has given the new
competitors a jump on the competition.
Network hardware appliances accounted for 67.4 percent of the revenues in 2004 and the
trend towards hardware appliances is expected to continue for the foreseeable future. The
appliances cannibalized a large percentage of sales from software IDS/IPS solutions as
customers found hardware appliances enticing for a number of reasons. Hardware appliances
are often seen as faster, easier to install, configure, maintain, upgrade, and vendors are
successfully proving reduced TCO for appliances versus software systems.
H o s t I D S / I P S
Even as host IDS/IPS technology began to gain consideration in the minds of customers, it
was largely overshadowed by its more visible network based counterpart. However, increased
legislative pressure on policy auditing and change tracking is again bringing host based tech-
nology to the forefront.
With Cisco, McAfee, ISS and Symantec all boasting both host and network based products,
there are a limited number of host intrusion technology players to partner with. Because this
market has been flat in the past few years, partnering with host players has been less impor-
tant to network players. The importance of partnerships between pure play network players
and host technologies will increase in the future as the network market improves its growth
rates later in the forecast period. Host technologies still have a bad reputation from a deploy-
ment and management point of view, but many vendors have begun increased development in
the host area and are working hard to counter the problems that have plagued host tech-
nology in the past.. Also, as the layered security approach gains acceptance, customers are
going to be looking closer at host products. Interoperability is going to be an important issue
for customers. Host products are going to have to work well with existing network IDS/IPS
systems. Host deployments, if properly integrated with network based solutions have the
potential to grow just as strong as their network based counterparts.
#N22B-74 © 2007 Frost & Sullivan www.frost.com 2-43

Figure 2-12 shows key metrics of the competitive structure of the World IDS/IPS market
during the forecast period.
Source: Frost & Sullivan
F i g u r e 2 - 1 2
Total IDS/IPS Market: Competitive Structure (World), 2006
Number of Companies in the Market Over 20
Types of Competitors Security pure plays
Network equipment vendors
Network device management competitors
Distribution Structure Predominately direct, although slowly shifting to indirect with
improved deployment and usability features and international
market development
Tiers of Competition Tier I: Cisco, ISS and McAfee controlling over 50% of the market
Tier II: Arbor, Juniper, McAfee, Sourcefire, Symantec,
TippingPoint and Tripwire controlling 40% of the market
Tier III: Others controlling 11% of the market
Notable Acquisitions, Mergers Check Point Acquires NFR
Trustwave acquires Lucid
Key End-User Groups Scaled network environments
Large enterprise, financial, government, healthcare, and education
Market beginning to move towards medium enterprises
Competitive Factors Multiple detection methods
Ability to offer both HIDS and NIDS solutions
Ability to offer desktop HIDS products
Management capabilities
Multiple deployment options
Price
Performance
Ease of installation, use, and maintenance
Corporate financial stability
Unified management for host and network solutions
Accuracy
Ability to run in either prevention or detection mode
#N22B-74 © 2007 Frost & Sullivan www.frost.com 2-44

Figure 2-13 lists the market participants and the markets they compete in during 2006.
Source: Frost & Sullivan
F i g u r e 2 - 1 3
Total IDS/IPS Market: Key Industry Participants by Product Type (World), 2006
Network Network Host
Company IDS/IPS HW IDS/IPS SW IDS/IPS
Arbor Networks, Inc. ■
Check Point Software Technologies ■
Cisco Systems, Inc. ■ ■ ■
Computer Associates International, Inc. ■
DeepNines Inc. ■
eEye Digital Security ■
Enterasys Networks, Inc. ■ ■
ForeScout Technologies, Inc. ■
Internet Security Systems, Inc. ■ ■ ■
Intoto Inc. ■
Juniper Networks, Inc. ■
Lancope ■
MazuNetworks ■
McAfee Technology, Inc. ■ ■
NFR Security ■
Nitro Security ■
Reflex Security, Inc. ■ ■
Radware ■
Sourcefire, Inc. ■
Symantec Corporation ■ ■
TippingPoint Technologies, Inc. ■
Trustwave
Top Layer Networks ■
Tripwire, Inc. ■
#N22B-74 © 2007 Frost & Sullivan www.frost.com 2-45

Market Share Analysis
I D S / I P S M a r k e t S h a r e
Figure 2-14 details the market share allocation of the total IDS/IPS market
Note: Others include Arbor Networks, Inc., Check Point Software Technologies, CA International, Inc., DeepNines Inc., Inc., Enterasys, eEye Digital Security, ForeScout Technologies, Inc., Intoto Inc., Juniper Networks, Inc., Lancope, MazuNetworks, Nitro Security, Reflex Security, Inc. StillSecure, Sourcefire, Top Layer Networks, and Trustwave.
Note: All figures are rounded; the base year is 2006. Source: Frost & Sullivan
2-15 detail the market share allocation of the total IDS/IPS network appliance market
F i g u r e 2 - 1 4
Total IDS/IPS Market: Market Share Analysis (World), 2004-2006
2004 2005 2006
Company (%) (%) (%)
ISS 29 21 22
Cisco 16 14 21
McAfee 13 13 13
TippingPoint 7 9 11
Juniper --- --- 5
Others 35 43 28
TOTAL 100 100 100
#N22B-74 © 2007 Frost & Sullivan www.frost.com 2-46

Note: Others include Arbor Networks, Inc., Check Point Software Technologies, CA International, Inc., DeepNines Inc., Inc., Enterasys, eEye Digital Security, ForeScout Technologies, Inc., Intoto Inc., Juniper Networks, Inc., Lancope, MazuNetworks, Nitro Security, Reflex Security, Inc. StillSecure, Sourcefire, Top Layer Networks, and Trustwave.
Note: All figures are rounded; the base year is 2006. Source: Frost & Sullivan
2-16 detail the market share allocation of the total host IDS/IPS market.
Note: Others include eEye, ThirdBrigade
Note: All figures are rounded; the base year is 2006. Source: Frost & Sullivan
F i g u r e 2 - 1 5
Total IDS/IPS Market: Market Share Analysis for the Network Hardware Segment (World),
2004-2006
2004 2005 2006
Company (%) (%) (%)
ISS 24 21 21
Cisco 18 13 16
TippingPoint 10 16 15
McAfee 13 13 12
Juniper 5 5 6
Other 30 32 30
TOTAL 100 100 100
F i g u r e 2 - 1 6
Total IDS/IPS Market: Market Share Analysis for the Host Software Segment (World),
2004-2006
2004 2005 2006
Company (%) (%) (%)
Cisco 22 22 26
ISS 24 24 24
McAfee 15 15 16
Symantec 11 11 11
Others 28 28 23
TOTAL 100 100 100
#N22B-74 © 2007 Frost & Sullivan www.frost.com 2-47

Chart 2.8 illustrates the market placement of the major market participants and their move-
ment in 2007.
C h a r t 2 . 8
Total IDS/IPS Market: Competitive Landscape (World), 2006
Source: Frost & Sullivan
In this chart, the horizontal axis, Market Penetration, is a quantifiable representation of total
market share. The horizontal axis, Ability to Execute, is a more qualitative measurement of
each competitor’s potential for growth with consideration of factors such as brand name
recognition, long term vision, strategic direction, product scope, product features and
competitive differentiators.
M a r k e t L e a d e r
IBM ISS
The acquisition of ISS by IBM in 2006 was a bold move by IBM. IBM has a reputation as a
strong IT integrator and services organization and the acquisition of ISS gave IBM a market
leading product line as well. The acquisition led to a great deal of speculation by many
industry analysts as to the future of the IDS/IPS product line and many competitors took
advantage of some of this uncertainty to launch campaigns aimed directly against the IBM
ISS product line. However, Frost & Sullivan research has shown that for 2006, the leadership
position of IBM ISS has held firm. Additionally, there has been no indication that IBM ISS
has any plans for the product line other than innovation and improvement. The launch of
both high and low end IPS products show the IBM ISS commitment to product development.
High
High
Low
Low
ChallengerSpecialist
Contender Market Leader
Niche Player
M arket Penetration
Ability to
Deliver
McAfee
Tripwire
Top Layer
ISS
Juniper
SourcefireTipping
Point
DeepNines
Arbor
Cisco
MazuNetwors
Check Point
ForeScoutReflex
Radware
Trustwave
Nitro Security
Stonesoft Intot
Symantec
StillSecure
#N22B-74 © 2007 Frost & Sullivan www.frost.com 2-48

Although IBM ISS’s market share has slipped from 41 percent in 2001 to just over 20 percent
in 2006, the company has retained their market domination. The margin by which IBM ISS
leads the market has slipped annually, however, the new sales channels gained through the
acquisition may buck this trend in 2007. By coupling the ISS product line with IBM’s Global
Services organization, the possibility of new sales into previously untapped geographic
regions becomes highly likely.
IBM ISS also has an advantage in being the one of the few vendor to offer network, host, and
anomaly detection based products. With the increased focus on data loss by numerous organ-
izations, Frost & Sullivan believes that more and more customers are going to be seeking out
vendors who can provide all three prevention technologies.
M a r k e t C h a l l e n g e r s
Cisco Systems
Cisco faces similar challenges to IBM ISS, being an early entrant into IDS/IPS and a later
convert to IPS technology. Cisco seems to finally be embracing the IPS message, but has been
slow in development and deployment of the technology. Cisco’s strategy in most security
markets is a fairly reactive one. Now that Cisco has embraced the IPS message, Cisco looks
to be proceeding more strongly than before.
As in other markets, Cisco’s product scope beyond security devices, massive installed base,
and deep penetrating distribution channels bring in many customers despite tardy product
feature sets. 2006 brought slightly higher market share numbers as the adoption of blade
servers combined in the firewall is becoming an embraced option worldwide. Cisco seems to
be much more focused on host deployments with their CSA product, and also has begun
more marketing and integration with network based appliance. Cisco, along with several
other vendors such as Juniper are working on increased integration of IPS products with
Network Access Control (NAC) technology. With vendors ranging from Cisco to Microsoft
throwing their weight behind NAC deployments and IPS being the technology that is often
used to enforce NAC compliance, it is easy to see that increased gains in NAC sales should
drive IPS sales.
McAfee
McAfee has built its security line out of numerous acquisitions, and has had a great deal of
success with its network IPS solution extensively, and is beginning to focus on its host IPS
product. The acquisition of Founstone indicates a movement toward integrated vulnerability
assessment technology, a must in today’s market. The company has done quite well, ramping
up quickly to become the third largest IDS/IPS vendor by leveraging distribution channels
and extensive advertising.
#N22B-74 © 2007 Frost & Sullivan www.frost.com 2-49

Since 2004, McAfee has offered a unified management console for both host and network
based solutions. In addition to this, a 2005 announcement of USB device control in the host
product shows the commitment to development of that product line. McAfee is also one of
the few IPS vendors that performs SSL acceleration/inspection. Through a combination of
technical innovation, product integration, and aggressive marketing McAfee should continue
to be a challenger in this market.
M a r k e t C o n t e n d e r s
Juniper Networks
Juniper was one of the first of the large networking vendors to start promoting an inline IPS
solution which has given them an advantage amongst the large networking companies.
Juniper is set to position themselves as a competitor that can meet the scope of Cisco’s
product lines head on. The company’s ASIC based architectures initially slowed integration,
but those pains are largely behind them. With a full range of market leading security solu-
tions (including the increasingly popular IPS appliances) and networking equipment
solutions, Juniper has increasingly hit impressive growth targets and has begun touting inte-
gration of its IPS technology into its Unified Access Control solution.
Symantec
In June 2006, Symantec made the move of dropping its appliance line of products completely,
including its IPS product. Symantec originally stated that the move would enable Symantec to
focus on host software development and they would partner with other vendors to provide
network appliances. In September 2006, Symantec announced a partnership with Juniper,
making Juniper the provider of appliances such as IPS to Symantec customers. Since that
time, Frost & Sullivan has seen much less than expected uptake of Juniper devices based on
Symantec customers.
Symantec still has a strong host offering, and with the combination of its Sygate acquisition
for policy enforcement, Frost & Sullivan believes that Symantec is really focuses on NAC and
the endpoint, where its strengths have been in the past.
Sourcefire
Some of the challenges to Sourcefire are awareness of the brand. So many customers are
familiar with the Snort IDS product that differentiation from the free product still proves to
be a challenge for Sourcefire Many customers have not investigated the wide variety of
options that Sourcefire offers. Sourcefire had announced that the company was to be
acquired by Check Point and after some delays from the US government, the deal was with-
drawn. The proposed acquisition no doubt pulled resources and energy away from other
areas and Sourcefire is going to have to move quickly to make sure that no ground was lost in
the interim.
#N22B-74 © 2007 Frost & Sullivan www.frost.com 2-50

TippingPoint
TippingPoint appears to have picked a winning direction in high performance IPS appliances,
again demonstrating significant growth and customer wins in 2005. TippingPoint expected to
continue strong growth through 2006. The acquisition by 3Com has provided TippingPoint
with the distribution and marketing channels needed for growth in this market.
The value propositions of TippingPoint’s technology are resonating well with customers.
Being wholly focused on high-end, network IPS might have been seen as a limitation in the
past, but the market’s embracing of hardware based IPS solutions has proven that Tipping-
Point was focusing on the right technology. TippingPoint has focused on agentless endpoint
security through their IPS. While many other vendors focus on host based protection through
agents on the desktop, TippingPoint contention is that the same job can be done at the
network level without the management headaches provided by a host solution.
M a r k e t S p e c i a l i s t s
Arbor Networks
Originally designed as software to help protect against DDOS and worm attacks, Arbor’s
technology has found a home in the IDS/IPS market. Arbor’s technology understands normal
types of communication between internal LAN devices and alerts to anomalistic behavior.
Arbor is seen as a unique technology and has grown quickly by leveraging worm protection
along with traffic management capabilities. Arbor is one of the vendors that has had success
with profiling and behavior based technologies. Customers with a bad taste in their mouths
from traditional IDS systems are eagerly seeking out new approaches and companies like
Arbor have benefited from this trend.
The recently announced partnership with ISS is positive validation of behavioral based tech-
nology that Arbor has developed. Arbor has traditionally had a strong history and presence
with service providers and the ISS partnership should help Arbor break further into enter-
prise markets.
Check Point
The failed merger between Check Point and Sourcefire was a setback for Check Point in this
space. Check Point’s InterSpect product has had a difficult time competing against other
internal security devices in the market such as those from Arbor and Mazu Networks.
Acquiring Sourcefire probably would have provided a much needed improvement in IDS/IPS
technology and the support of the open source community.
#N22B-74 © 2007 Frost & Sullivan www.frost.com 2-51

Check Point has marched on since, acquiring NFR Security. This acquisition was quite a bit
smaller than the proposed acquisition of Sourcefire (only costing Check Point $20 million),
however, Frost & Sullivan believes that this acquisition was very positive for both
companies.
Check Point has been able to quickly integrate the technology gained from NFR into their
existing product line. The IPS-1 product is already being offered to customers and will surely
been seen as an attractive complement to the successful firewall product line.
MazuNetworks
Focusing purely on a behavior based approach technology that monitors network behavior
over a certain time period and then looks for abnormalities, MazuNetworks has been
successful in providing a technology that can alert administrators about a variety of suspi-
cious behaviors. Many network administrators also appreciate the highly detailed picture
that MazuNetworks provides of their network. MazuNetworks is one of the vendors that has
had success with an IDS/IPS message that is different from the mainstream market.
Depending on the success of this trend MazuNetworks could be in a very strong market posi-
tion in the next few years.
N i c h e P l a y e r s
TrustWave
TrustWave acquired Lucid Security in June, 2006. TrustWave have made ipAngel an integral
product offering in their IPS Managed Security suite. While TrustWave focuses their IPS
efforts on MSSP, ipAngel is still available for purchase. TrustWave is moving in the right
direction by offering devices that move easily into MSSP mode. ISS was doing similar things
before they were acquired by IBM and Frost & Sullivan believes that this trend will continue.
DeepNines
DeepNines has a unique message in security. Deep Nines’ technology is meant to be posi-
tioned in front of a network’s edge router. This is a unique approach in the IDS/IPS market.
Integrating anti-virus, firewall, and IDS/IPS on a single device, the DeepNines approach also
provides a more logical place to thwart denial of service attacks and router attacks. Although
the company is very small, 2004 saw notable growth for DeepNines. In 2005, DeepNines
announced their Infection Free Networking (IFN) technology, an entirely agentless solution
that solves some problems that many vendors previously addressed through host based
solutions.
#N22B-74 © 2007 Frost & Sullivan www.frost.com 2-52

ForeScout
The Forescout ActiveScout device is a signatureless-IPS device that looks for patterns of
reconnaissance and closes connections before an attack occurs. The increasing number of
vendors touting a partial or fully behavioral based solution gives merit to the approach.
Forescout is unique in promoting a strictly behavioral approach on the perimeter.
Frost & Sullivan believes this is a difficult proposition for many customers to accept, and
may be a challenging message to convey. Forescout has seen some traction from the integra-
tion of its NAC solution and IPS and that may be the key to Forescout’s success.
Intoto
Intoto has taken an interesting approach to the IPS, focusing on a software IPS product
targeted primarily at the home user. Using a model similar to Snort and the open source
community, Intoto has chosen to focus on offering a freely available product to end users.
Contrary to the open source IPS implementations, Intoto has chosen to focus on making their
product easy to use and plans to make revenue on the signature subscription revenue.
Nitro
NitroSecurity is a provider of high-performance enterprise security solutions that deliver an
integrated network + security monitoring, analysis, and protection system. Nitro is one of the
first security companies to capitalize on the idea of IPS and security management.
Frost & Sullivan believes the combination of IPS and security management will be a driving
factor in the future and few companies are positioned to take advantage of this trend.
Radware
Radware comes from a history focused in the application delivery market. In late 2005,
Radware completed the acquisition of Israeli owned V-Secure. V-Secure was known for it
behavioral based technology and Radware has already begun introducing behavioral detec-
tion methodologies into its Defense Pro appliance. Frost & Sullivan believes that the
integration of behavioral based technology will become more prevalent as the interest in
securing the inside network becomes a priority. Being one of the vendors to provide this inte-
gration early on is definitely an advantage for Radware.
Reflex Security
Reflex offers a hardened linux appliance that integrates asset detection and quarantining
technologies into one. Reflex security has products designed to meet bandwidth requirements
ranging from 10 Mbps-5 Gbps. Reflex has also incorporated the management console and
correlation capabilities directly into the appliance. Frost & Sullivan believes that Reflex
Security’s device is indicative of acceptance of IPS into organizations other than large enter-
prises. By incorporating a great deal of functionality into a single appliance Frost & Sullivan
believes that Reflex Security is well positioned to continue growth in this market.
#N22B-74 © 2007 Frost & Sullivan www.frost.com 2-53

StillSecure
StillSecure is another IDS/IPS vendor who has shifted to more of a focus in the NAC market.
StillSecure was one of the early IDS/IPS vendors to combine vulnerability management into
their IDS/IPS offering. StillSecure is now supporting the Cobia open source development plat-
form, a UTM platform that will allow end users to choose their security module and offer
subscription support.
There are numerous challenges ahead for StillSecure. The open source model is challenging
for vendors to jump into. NAC is not well defined and many customers shy away. The IDS/
IPS market is requiring vendors to offer both host and network based products. StillSecure is
doing some interesting things, but Frost & Sullivan believes may be spreading itself too thin.
Stonesoft
Founded in 1990, Stonesoft Corporation is a global company with Corporate headquarters in
Helsinki, Finland and Americas headquarters in Atlanta, Georgia. Stonesoft has seen a great
deal of success in Europe and is steadily building a strong customer base in North America
and South America with its suite of IPS, firewall, VPN and SSL VPN solutions all centrally
managed with the StoneGate Management Center. The Stonesoft IPS product is very mature
and includes enterprise class features such as high availability and multigigabit throughput
speeds.
Top Layer
Top Layer’s product line operates multi-gigabit performance levels. Originally an IDS
company, Top Layer has shifted its positioning and marketing messages to capitalize on the
growing importance of its IPS capabilities. Top Layer’s product is unique in that it operates
as a network switch. Many in the industry feel that this is a natural evolution of IPS tech-
nology but the technology has not matured to that point yet. Top Layer is also unique in that
it looks for traffic rates in addition to some of the more tell tale signs of an attack. Top Layer
is also one of the first IPS companies to integrate with a firewall. Frost & Sullivan will be
keeping a close eye on Top Layer in the future.
#N22B-74 © 2007 Frost & Sullivan www.frost.com 2-54