Embed Size (px)
Citation preview

Satellite Earth Observation and Disaster Risk
World Bank - European Space Agency Collaboration in using EO for Disaster Risk Assessment
Anna Burzykowska –World Bank

Strategic Pillars of DRM at the World Bank(1) Post- Disaster Needs Assessment
• large-scale emergency recovery programs
(2)Disaster risk mitigation and related climate investment programs
• risk mitigation programs, including those focusing on
climate related hazards
(3) Innovation and application of new technologies
• remote sensing and geospatial analysis for mapping risks
(4)Global knowledge solutions and building access to data
• cutting-edge knowledge products, global knowledge
sharing through high-level events such as the
Understanding Risk Conference or the 2011 World
Reconstruction Conference
(5)Partnership development and donor coordination
• Strategic and operational alliances with technical and
political leaders in the DRM field

• 15 pilot projects implemented across the Sustainable Development Network:
- Disaster Risk Management
- Urban Development
- Agriculture and Forest Management
- Water Resources Management
- Coastal Zones Management
- Marine Environment Management
- Climate Change Adaptation
www.worldbank.org/earthobservation
Collaboration with ESA - Background

- ESA-WB collaboration (Phase1):
• Collecting precise, tailored information requirements to assist the World Bank projects
• Primarily based on European satellite missions (ENVISAT, ERS, RapidEye, SPOT5, TerraSAR-X, Cosmo-Skymed, etc.)
• Specialist EO providers delivering mature, validated and operational information services
• Concentrating on EO component which combined with other data sources can be a very powerful tool (end-to-end product)
• Utility assessment to measure the impact
• Financing & technical oversight by ESA
- ESA-WB collaboration (Phase2): larger scale activities in priority areas
• Urban Development, Disaster Risk Management, Oceans, Forestry, Fragile States, +…
Collaboration with ESA - Background
Meeting with users, Port Moresby,
Papua New Guinea
Oil spill monitoring utility
assessment, Washington DC
Training in small reservoirs
mapping, Lusaka, Zambia

Demonstration of the added value of using satellite EO to:
(1) Hazard mapping
(2) Exposure/Asset mapping and modeling
Collaboration with ESA in Disaster Risk Management

Collaboration with ESA in Urban Disaster Risk Management
Main Results:
- A variety of Disaster Risk Management products developed :
• DEMs and DEM-derived slope maps
• Maps of urban infrastructure & buildings
• Precise terrain motion mapping
• Landslide inventories
• Historical Flood mapping
• Flood simulations
- Strong involvement of local partners but the need for EO capacity building highlighted
- Adequate spatial data infrastructure and other IT tools

Case Study: Analysis of Land Subsidence in Jakarta
Figure (left): The map of Land subsidence in Jakarta during the period 1974-2010 based on levelling, GPS, extensometers and groundwater level measurements and PSI (ERS-2 1996-1998, Envisat 2007-2009 and ALOS PALSAR 2007-2010). Credit: Deltares2011.
Figure (right): The map of subsidence derived from 3 millions of measurements points using PInSAR technique and generated in the framework of the EOWorldproject and derived from the analysis of ALOS PALSAR data (2007-2011). Credit: EOWorldproject/Altamira Information, 2011 for ESA, World Bank.
Precise terrain motion mapping

Case Study: Analysis of Land Subsidence in Jakarta
Precise terrain motion mapping
Figure (right). Deformation map in Jakarta Bay and harbor derived from the PSI analysis of VHR COSMO-SkyMed data (Oct. 2010 –Apr. 2011). Color scale between -75 (red) and 75 (blue) mm/year. Credit: EOWorldproject/Altamira Information for ESA, World Bank.
Figure (left): The map of subsidence derived from the analysis of ALOS PALSAR data (2007-2011). Credit: EOWorldproject/Altamira Information, 2011 for ESA, World Bank.

Rio de Janeiro, 2007-2011
Jakarta, 2004-2007/2011
Ho Chi Minh City, 2007-2011
Georgetown, 2011 Alexandria, 1992-2009Tunis, 1992-2009
Yogyakarta, 2003-2011
Precise terrain motion mapping
Figures: Example of different precise motion products delivered in the framework of EOWorldprojects. Credit: Altamira Information (Georgetown, Alexandria, Jakarta, Ho Chi Minh City, Yogyakarta), TRE (Tunis), Hansje Brinker (Rio de Janeiro) for ESA, World Bank. Data used: ERS, ENVISAT, ALOS, COSMO SkyMed, TerraSAR-X.

Maps of urban infrastructure & buildingsfor Assets Exposure
Case Study: Developing Multi hazard City Risk Index Yogyakarta
Figures: Example of different land use classes of the urban map of Yogyakarta derived from VHR SPOT5 data. Based on European Urban Atlas Methodology. Credit: EOWorld project/Eurosense for ESA, World Bank.

Historical Flood mappingCase Study: Building Exposure Maps of Households, Infrastructure
and Rice Crops in the Mekong River Basin
- Flood extent map for 2001 flood event
Permanent water
Flood extent
Figure: The map of flood extent in Mekong River Basin. Credit: EOWorldproject/Geoville for ESA, World Bank.
31 August 2001 (close to flood peak)
09 November 2001 (end of flood
period)

Historical Flood mapping
Credit: EOWorld project/Geoville for ESA, World Bank.
Exposure of urban infrastructure & rice paddies to floods
76,1% 78,8%88,3%
0%
10%
20%
30%
40%
50%
60%
70%
80%
90%
100%
Buildings* Settlements Roads
Non-flooded
Flooded
- Facts:
Under 2001 flood conditions,
- 79% of the settlement area,
- 88% of the road network, and
- more than 90% of the cropland
would be affected by high water levels
Settlement areas under 2001 flood conditions
Rice cultivation areas under dry & flood conditions (2001)

Case Study: Vulnerability Assessment in Rio de Janeiro (Flood Scenarios)
Flood simulations
Mapping of buildings and infrastructure, including slope maps
Flood scenarios based on the past floods occurring in Rio Grande watershed
Figure (up): Rio de Janeiro urban land use map. Credit: EOWorldproject/Critical Software for ESA, World. SPOT5DEM © SpotImage.
Figures (left): Rio Grande/Rio Anil flood simulation scenarios. Credit: EOWorld project/Hidromod for ESA, World Bank.
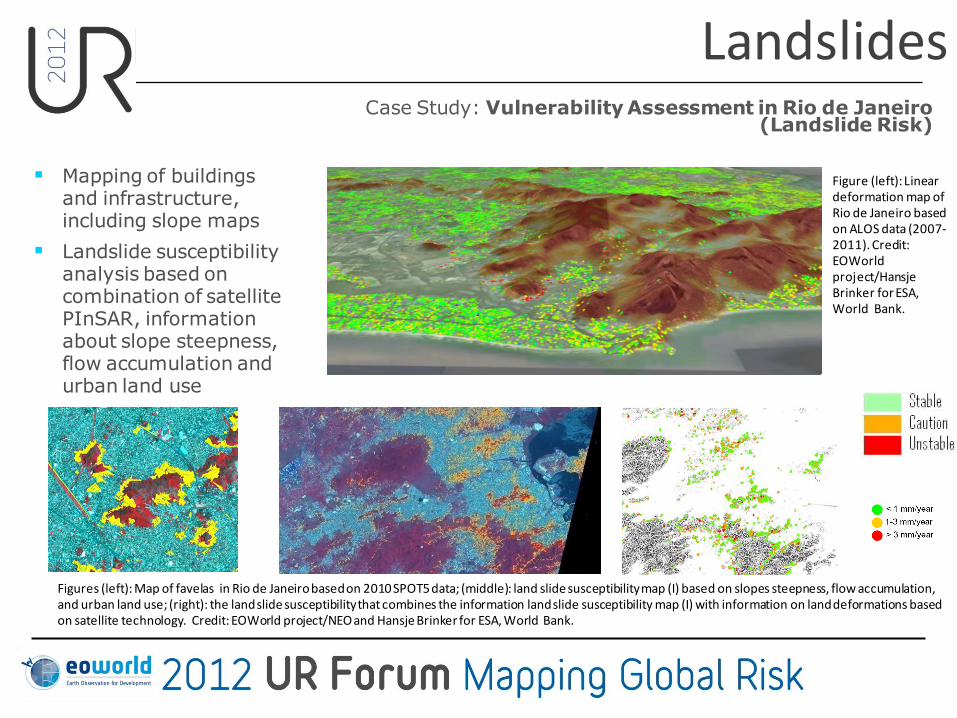
Case Study: Vulnerability Assessment in Rio de Janeiro (Landslide Risk)
Landslides
Mapping of buildings and infrastructure, including slope maps
Landslide susceptibility analysis based on combination of satellite PInSAR, information about slope steepness, flow accumulation and urban land use
Figures (left): Map of favelas in Rio de Janeiro based on 2010 SPOT5 data; (middle): land slide susceptibility map (I) based on slopes steepness, flow accumulation, and urban land use; (right): the land slide susceptibility that combines the information land slide susceptibility map (I) with information on land deformations based on satellite technology. Credit: EOWorld project/NEO and Hansje Brinker for ESA, World Bank.
Figure (left): Linear deformation map of Rio de Janeiro based on ALOS data (2007-2011). Credit: EOWorldproject/HansjeBrinker for ESA, World Bank.

- Access to information and sharing data is a important step to reducing risk
- The need to work with countries to enable them manage and share their data
Data and Information Sharing