Embed Size (px)
Citation preview

World agriculture:towards 2030/2050
Interim report
Prospects for food, nutrition, agriculture and major commodity groups
Global Perspective Studies UnitFood and Agriculture Organization of the United Nations
Rome, June 2006


World agriculture: towards 2030/2050
Interim report
Prospects for food, nutrition, agriculture and major commodity groups
Global Perspective Studies UnitFood and Agriculture Organization of the United Nations
Rome, June 2006

This interim report presents an update, revision and extension to 2050 of Chapters 2 and 3 of the FAO Study World agriculture: towards 2015/2030, an FAO Perspective, published in 2003 (Bruinsma, 2003). It is mainly meant to disseminate interim results and to solicit comments, as an intermediate step in the preparation of a more complete report.
Comments can be send to:
Chief, Global Perspective Studies UnitFood and Agriculture Organization of the UNViale delle Terme di Caracalla00100 Rome / Italye-mail: [email protected]
Further information on the work of the Unit can be found on the following website: http://www.fao.org/es/ESD/gstudies.htm
Acknowledgement: This report was prepared by Nikos Alexandratos in collaboration with Jelle Bruinsma, Gerold Bödeker, Josef Schmidhuber, Sumiter Broca, Prakash Shetty and Maria Grazia Ottaviani.
The designations employed and the presentation of the material in this information product do not imply the expression of any opinion whatsoever on the part of the Food and Agriculture Organization of the United Nations concerning the legal status of any country, territory, city or area or of its authorities, or concerning the delimitation of its frontiers or boundaries.
In the presentation of statistical material, countries are, where appropriate, aggregated in the following main economic groupings: “Developed countries” (including the developed market economies or ‘Industrial countries’ and the Transition countries) and “Developing countries”. The designation “developed” and “developing” economies is intended for statistical convenience and does not necessarily express a judgement about the stage of development reached by a particular country.
All rights reserved. Reproduction and dissemination of material in this information product for educational or other non-commercial purposes are authorized without any prior written permission from the copyright holders provided the source is fully acknowledged. Reproduction of material in this information product for resale or other commercial purposes is prohibited without written permission of the copyright holders. Applications for such permission should be addressed to the Chief, Publishing Management Service, Information Division, FAO, Viale delle Terme di Caracalla, 00100 Rome, Italy or by e-mail to [email protected]
© FAO 2006
ii

Contents
Chapter 1 Overview 1 1.1 Why the new outlook to 2050 1 1.2 Mainfindings 3 1.3 Conclusions 7
Chapter 2 Prospects for food and nutrition 8 2.1 Thebroadpicture:historicaldevelopmentsandpresentsituation 8 2.2 Theoutlookforfoodandnutritionto2015,2030and2050 16 2.3 Structuralchangesinthecommoditycompositionoffoodconsumption 22 2.4 Concludingremarks
Chapter 3 Prospects for agriculture and major commodity groups 30 3.1 Aggregateagriculture:historicaltrendsandprospects 30 3.2 Cereals 36 3.3 Livestockcommodities 45 3.4 Oilcrops,vegetableoilsandproducts 52 3.5 Roots,tubersandplantains 58 3.6 Sugar 60 3.7 Concludingremarks 64
Appendix: Countriesandcommodities 66
References 69
iii

List of TablesTable2.1 Percapitafoodconsumption(kcal/person/day) 8Table2.2 Populationlivingincountrieswithgivenpercapitafoodconsumption 10Table2.3 Prevalenceofundernourishment,developingcountries 14Table2.4 Populationdataandprojections 16Table2.5 Incomegrowthassumptions 17Table2.6 Estimatesandprojectionsof$1poverty,WorldBank 19Table2.7 Changesinthecommoditycompositionoffoodconsumptionbymajorcountrygroups 25Table2.8 Changesinthecommoditycompositionoffoodconsumption,developingregions 26Table3.1 Growthratesofaggregatedemandandproduction 33Table3.2 Cerealbalances,worldandmajorcountrygroups 39Table3.3 Cerealbalances,developingregions 40Table3.4 Wheat,riceandcoarsegrains:Demandandproduction 41Table3.5 Wheat,riceandcoarsegrains:Nettradebalances 44Table3.6 Worldcerealstrade:Matchingnetbalancesofimportersandexporters 44Table3.7 Meat:Aggregateproductionanddemand 47Table3.8 Milkanddairyproducts 50Table3.9 Oilcrops,vegetableoilsandproducts,productionanddemand 53Table3.10 Sourcesofincreasesinworldproductionandconsumptionofoilcrops 54Table3.11 Nettradebalancesforoilseeds,oilsandproducts 55Table3.12 Majoroilcrops,worldproduction 56Table3.13 Sugar(rawsugarequivalent) 62
List of BoxesBox2.1 Indianparadox:Nearstagnantaveragefoodconsumptioninmidstofrapideconomicgrowth 11Box2.2 Measuringtheprevalenceofundernourishment:thekeyroleoftheestimatesoffoodavailable fordirecthumanconsumption 14Box2.3 Countrieswithhighpopulationgrowthfor50yearsandlimitedagriculturalresources: Anuntenablecombination 17Box3.1 Measuringchangeinagriculturalaggregates 31Box3.2 UncertaintiesconcerningChina’scerealsconsumptionandstocks 38
List of FiguresFigure2.1 Percapitafoodconsumption,developingcountrieswithover100millionpopulationin2000. 9Figure2.2 Evolutionofapparentfoodconsumption/capitainrelationtoincomepercapita:three countrytypologies 9Figure2.3 Developingcountrieswithunder2200kcalin1999/01.Highestandlowest5-yearaverage kcalrecordedduring1961-2001 13Figure2.4 GrowthratesofpercapitaGDP,1980s,1990sand2001-15 18Figure2.5 Countrieswithundernourishedover40percentin1999/01 22Figure3.1 Netagriculturaltradebalance:Developingcountries,1961-2004 32Figure3.2 DevelopingcountriesexcludingBrazil,nettradebalancesbymajorcommoditygroups, 1984-2004 34Figure3.3 Developingcountries,netexportsofcoffee 35Figure3.4 Worldcerealsproduction:Growthratesinsuccessive10-,20-,30-,and40-yearperiods 37Figure3.5 China:Production,stocksandtwoviewsonconsumption;aggregateofwheat,maize, riceandbarley 38Figure3.6 Percapitaconsumption(alluses)ofindividualcereals 42Figure3.7 Coarsegrains:Foodandnon-fooduse 42Figure3.8 Cereals:Importersandexporters 45Figure3.9 Meat:Nettrade,majorimporter/exportercountrygroups 48Figure3.10 Dairynettrade:DevelopingcountriesandEU15 49Figure3.11 Sugar:Nettradepositions,1970-2002 60Figure3.12 Industrialuseofsugar(Brazilandrestofworld)and(Brazilonly)alcoholproduction 61
iv

1
1.1 Why the new outlook to 2050
Thisisanupdatedversion,withextensionofprojectionsto2050,oftwoofthekeychapters(Chapters2and3)ofthestudyWorld Agriculture: Towards 2015/30completedin 2002 and published in 2003 (Bruinsma, 2003). Chapter 2 presents prospective developments in fooddemandandconsumptionandpossibleimplicationsfornutrition and undernourishment. Chapter 3 deals withproduction,consumptionandtrade,intermsofthemaincommoditysectorsandaggregateagriculture.
This updating and extension is undertaken for anumber of reasons, in addition to the need to take onboard more recent data and historical ones that have beenrevised.
The firsthas todowithdemography.Futureworldpopulationmaybe lower than theprojectionsavailableatthetimeoftheearlierstudyindicated.Forthisreason,food requirements in the future may be lower thanprojected in the earlier study. In addition, longer-termprojections suggest that the end of world populationgrowthmaybewithinsightbythemiddleofthiscentury,asworldpopulationmaypeakat9.2billionaroundtheyear 20751. In practice,much of the increase betweenthe6.1billionof2000andthepeakwillhaveoccurredby2050whenworldpopulationmayreach8.9billion.It
followsthatoverthenext50yearsworldagriculturemaybetransitingtoafuturewhenglobalpopulationgrowthwill no longer be the major driving force for furthergrowthinworldfooddemandandproduction.Thishasconsequencesfortherateatwhichfurtherpressuresonlandandwaterresourcesandthewiderenvironmentwillbebuildingup.
In this context, of particular interest is thequestion:will the eventual cessationofworldpopulationgrowthimply that the classical Malthusian concerns (theprospect that population growth will run ahead of thepotentialofagriculturetoincreasefoodproduction,anditscorollary– food insecurityattributedpredominantlytoproductionconstraints),willnolongerberelevant?Weattempttoestimatethemagnitudesinvolved,buttheshort answer is that theseconcernswillprobably retain theirfullrelevancewellbeyond2050,asexplainedinSection1.2 below.
The second reason is that the growing tightness ofenergy markets and associated rising oil prices mayexert some important effects on food and agriculturethat have to be taken into account.At the time of theearlier projections, theWorldBank’s price outlook foroilwas that itcoulddeclinefromtheUS$28/barrelof2000 to US$ 21/barrel in 2015 in current dollars andevenmore inconstantdollarsof19902.Theoutlook is
Overview
1CHAPTER
1 UN (2004), medium variant projection.2 From US$ 29 to US$ 17, World Bank (2002): Tables A2.12-A2.13.

2
quitedifferentintheBank’slatestassessmentinviewof the recent sharp price rises – to a 2005 average ofUS$ 53.4/barrel. Thus, “the World Bank has adopteda technicalassumption for the futurepathofoilpricesbased on a slow decline towardUS$ 40 per barrel by2010”3.
High energy prices affect the food and agriculturesector in several ways. Besides the classical ones(via macroeconomic effects affecting all aspects ofproduction,consumptionandtrade,andthemoredirectonesonproductionagricultureviatheeffectsonthecostsof the energy-intensive inputs like fertilizer and fuel)theycanimpactagriculturebycreatingnewmarketsforthoseproductswhichcanbeusedasbiomassfeedstocksfor the production of biofuels as substitutes for thepetroleum-basedfuels(petrol,diesel)intransport4. The caseofBrazilwhich,afteraperiodofshrinkageduringthe1990swhenoilpriceswerelow,hasnowrevertedtousingsome50percentofitssugarcaneoutputtoproducefuelethanol,bothfordomesticuseandexport,istelling.EthanolinBrazilisconsideredtobecompetitivevis-à-vistraditionalfossilfuelsatoilpricesofUS$35-40/barrel,although thisfigurewillvarywith thedollar exchangerate.AlsowellknownisthegrowinguseofmaizeintheUSA(inthiscasewithsubsidies)toproducefuelethanol.TherenewablefuelprovisionsintheEnergyPolicyActof2005willfurtherpromotesuchuse:by2015,itmaybecomemoreimportantthanexportsandcouldaccountforsome23percentofthecountry’smaizeoutput5,withimportantimpactsonworldmarkets.
Again with subsidies, the use of vegetable oils toproducebiodieselisexpandingincertainEUcountries,whiletheEUhasatargetofa5.75percentmarketshareofbiofuelsinthepetrolanddieselmarketin2010.Thelatestprojections of the European Commission foresee that 1.5milliontonnes6ofgrainandsome10milliontonnesofoilseedsmaybeusedtoproducebioenergyin2012.Thereis growing interest in the countries with abundant, orpotentiallyso,productionpotentialofsuitablefeedstocks(likepalmoil forbiodiesel inMalaysia and Indonesia,cassavaandsugarcaneforethanolinThailand)forgoingthe way of producing biofuels, both for domestic use andexport.
Althoughatpresentthepromotionofbiofuelsisoftenusedinseveralindustrializedcountriesasameanstorelaxthedemandconstraints facingagriculture, in the futureit can have far-reaching effects on world agricultureas it can offer novel development opportunities forcountries with significant agricultural resources, ifbarriers to trade of biofuels were eased or removed.Africa, with its significant sugar cane productionpotential,isoftencitedasaregionthatcouldprofitfromBrazil’s experience and technology7, though obstaclesto realizing it (infrastructure, institutional, etc.) shouldnot be underestimated.Eventually, the competitivenessof biofuels may be further enhanced if the savings ofgreenhouse gas emissions resulting from substitutingethanolforgasolineweretobemonetizedintheformoftradable carbon credits (Certified EmissionReductionsof greenhouse gases) through the Clean DevelopmentMechanismundertheprovisionsoftheKyotoProtocol.
Itistooearlytodealfullywiththisimportantsubject,giventheuncertaintiesaboutfutureoilprices.However,theissueofalternativeenergysourcesisveryaliveandquestions are increasingly asked about the potentialof world agriculture to become a significant sourceof feedstocks and in particular the food security andenvironmental implications, e.g. further deforestationfromtheeventualexpansionoflandunderthefeedstockcrops (oil palm, soybeans, sugar cane, etc). Ourconventionalprojectionsto2050areafirstandnecessarystepinaddressingthisissue:theycanhelpestablishhowmuchmore food and related agricultural resources theworld may need and in which countries – a valuableinput into any evaluation of the potential for divertingagricultural resources to other uses andwhat thismayimplyforfoodsecurity.Theadvancementoftechnologyinconvertinglignocellulosicbiomass(fromcropresidues,grassesandwood)toproduce“cellulosic”ethanolmaycontribute tomitigating eventual pressures on the landwithfoodcropproductionpotential.
Athirdreasonisthatnearlytenyearsintotheperiodto2015,thedatebywhichtheinternationalcommunitycommitted itself in the 1996 World Food Summit tohalvinghungerandundernutrition(halvingthenumbersundernourished), not much progress has been made
3 World Bank (2006):15.4 They can also raise the competitiveness of agricultural products, e.g. cotton or natural rubber, that compete with oil-based synthetics whose cost rises with the price of oil.5 USDA (2006).6 Tonnes are metric tonnes throughout this paper; mt = million tonnes.7 Feature story on the World Bank President’s visit to Brazil, 20 December 2005 (http://web.worldbank.org/wbsite/external/news/ 0,,contentMDK:20764365~menuPK:34457~pagePK:34370~piPK:34424~theSitePK:4607,00.html). .

3
andtheprospectsthatthetargetwillbeattainedarenotencouraging. The significant progress made by somecountriesisbeingcompensatedbyseveresetbackssufferedbyothercountries.Thelattertendtobethosewithhighpopulationgrowthrates,hencefailurestoincreasefoodconsumptionper capita are translated into increases ofthenumbersundernourished.Forthoseamongthemwithpooragriculturalresourcesandhighdependenceonthemfortheirfoodsecurityandoveralldevelopment,thetaskofachievingintheforeseeablefuturethequantumjumpsinfoodconsumptionrequiredformeetingthetargetmayproveveryarduousindeed.Longertermprojectionscanhelpdrivehomethe issue thatevenif theglobal targetforreducingundernutritionwereachieved,therewillstillbe several countrieswith unacceptably high incidence.The need to plan ahead interventions to copewith thepersistence of high undernutritionwill likely remain aliveissueformanyyearstocome.
1.2 Main findings
Continued growth of world agriculture even after the end of world population growth
Themain reason is that zero population growth at thegloballevelwillbethenetresultofcontinuingincreasesinsomecountries(e.g.bysome31millionannually in2050 inAfrica and South andWesternAsia together)compensated by declines in others (e.g. by some 10millionannuallyinChina,JapanandEuropetogether)8. Nearly all the further population increases will beoccurringincountriesseveralofwhichevenin2050maystill have inadequate food consumption levels, hencesignificant scope for further increases in demand. Thepressuresforfurtherincreasesoffoodsuppliesinthesecountrieswillcontinue.Muchofitwillhavetobemetbygrowing localproductionor,as ithappened in thepastandisstillhappeningcurrently,itmaynotbefullymet–atypicalcaseofproduction-constrainedfoodinsecurity.Thecreationof slack in somecountrieswithdecliningpopulation(e.g. the transitioneconomies,whengrowthofaggregatedemandwillhavebeenreducedtoatrickle-.01percentp.a.inthefinaltwodecades2030-50)willnotnecessarilybemadeavailabletomeetthestillgrowingdemandincountrieswithrisingpopulation,e.g.demandgrowthat2.0percentp.a.insub-SaharanAfrica.
In conclusion, zero population growth at theglobal level will not automatically translate into zerogrowth in demand and cessation of the building-upof pressures on resources and the wider environment.The need for production to keep growing in severalcountries will continue to condition their prospectsfor improvednutrition. In thoseamong them thathavelimitedagriculturalpotential,theproblemofproduction-constrained food insecurity and significant incidenceofundernourishmentmaypersist,eveninaworldwithstationary population and plentiful food supplies (orpotential to increase production) at the global level.Nothingnewhere:thissituationprevailsatpresentandit will not go away simply because population stopsgrowingatthegloballevel.Projectionsto2050provideabasisforthinkingaboutthispossibleoutcome.
Food and nutrition
Thehistoricaltrendtowardsincreasedfoodconsumptionper capita as a world average and particularly in thedevelopingcountrieswill likelycontinue,butatslowerratesthaninthepastasmoreandmorecountriesapproachmedium-high levels. The average of the developingcountries,thatrosefrom2110kcal/person/day30yearsagotothepresent2650kcal,mayrisefurtherto2960kcalinthenext30yearsandonto3070kcalby2050.Bythemiddleofthecenturythegreatbulkoftheirpopulation(90percent)mayliveincountrieswithover2700kcal,upfrom51percentatpresentandonly4percent threedecadesago.As in thepast, thegreat improvements inChinaandafewotherpopulouscountrieswillcontinuetocarryasignificantweightinthesedevelopments.
However, not all countries may achieve foodconsumption levels consonant with requirements forgood nutrition. This may be the case of some of thecountries which start with very low consumption(under2200kcal/person/day in1999/01),high ratesofundernourishment, high population growth rates, poorprospects for rapideconomicgrowthandoftenmeagreagricultural resources. There are 32 countries in thiscategory, with rates of undernourishment between 29 percent and 72 percent, an average of 42 percent,YemenandNigeramongthem.Theirpresentpopulationof 580million is projected to grow to 1.39 billion by2050,thatofYemenfrom18millionto84millionand
8 Other reasons include the likely continuation of changes in the structure of consumption towards more livestock products following growth in incomes and urbanization, particularly in the developing countries.
Overview

4
thatofNigerfrom11millionto53million.Theircurrentaverage food consumption of 2000 kcal/person/day isactuallyalittlebelowthatof30yearsago.Despitethedismalhistoricalrecord,thepotentialexistsforseveralofthesecountriestomakegainsbyassigningprioritytothedevelopmentoflocalfoodproduction,asothercountrieshave done in the past. Under this fairly optimisticassumption,theaverageofthegroupmaygrowto2450kcalinthenext30years,thoughthiswouldstillnotbesufficient for good nutrition in several of them.Hencetheconclusionthatreducingundernourishmentmaybeaveryslowprocessinthesecountries.
Notwithstanding the several countries with poorprospectsformakingsufficientprogress,thedevelopingcountriesasawholewouldrecordsignificantreductionsintherelativeprevalenceofundernourishment(percentof population affected). However, these will not betranslated into commensurate declines in the numbersundernourishedbecauseofpopulationgrowth.Reductionin theabsolutenumbers is likely tobea slowprocess.Numberscoulddeclinefromthe810millionin1999/01to580millionin2015,to460millionin2030andtojustover290millionby2050.Thismeansthatthenumberofundernourishedindevelopingcountries,whichstoodat823millionin1990/92(the3-yearaverageusedas thebasisfordefiningtheWorldFoodSummittarget),isnotlikelytobehalvedby2015.However,theproportionofthepopulationundernourishedcouldbehalvedby2015–from20.3percentin1990/92to10.1percentin2015andonto6.9in2030andto3.9by2050.Itisnotedthatthe UNMillennium Development Goals (MDG) refernottohalvingthenumbersundernourishedbutrathertoatargetto“halve,between1990and2015,theproportionof people who suffer from hunger”. In this sense, theMDGgoalmaybeachieved.
Despite this slow pace of progress in reducing theprevalenceofundernourishment,theprojectionsdoimplyconsiderable overall improvement. In the developingcountries the numbers well-fed (i.e. not classified asundernourishedaccordingtothecriteriausedhere)couldincreasefrom3.9billionin1999/01(83percentoftheirpopulation) to 5.2 billion in 2015 (90 percent of thepopulation), to 6.2 billion (93 percent) in 2030 and to7.2billion(96percent)by2050.Thatwouldbenomeanachievement.Fewercountries thanatpresentwillhavehighincidenceofundernourishment,noneoftheminthemostpopulousclass.Theproblemofundernourishmentwill tend to become smaller in terms of both absolutenumbers affected and, even more, in relative terms(proportionofthepopulation),henceitwillbecomemore
tractable through policy interventions, both national andinternational.
Theprogressinraisingpercapitafoodconsumptionto3000+kcal/person/dayinseveraldevelopingcountriesis not always an unmixed blessing. The related diettransitions often imply changes towards energy-densediets high in fat, particularly saturated fat, sugar andsaltandlowinunrefinedcarbohydrates.Incombinationwith lifestyle changes, largely associated with rapidurbanization, such transitions, while beneficent inmany countries with still inadequate diets, are oftenaccompaniedbyacorrespondingincreaseindiet-relatedchronicNon-CommunicableDiseases(NCDs).Inmanycountries undergoing this transition, obesity-relatedNCDs tend to appearwhen health problems related toundernutrition of significant parts of their populationsarestillwidelyprevalent.Thetwoproblemsco-existandthesecountriesareconfrontedwitha“doubleburdenofmalnutrition”resultinginnovelchallengesandstrainsintheirhealthsystems.
Growth of agriculture and main commodity sectors
Aggregate agriculture: World agriculture (aggregate value of production, all food and non-food crop andlivestock commodities) has been growing at rates of2.1-2.3percentp.a.inthelastfourdecades,withmuchof the growth originating in the developing countries(3.4-3.8percentp.a.).Thehighgrowthratesofthelatterreflected, among other things, developments in somelargecountries - foremostamong themChina.WithoutChina, the rest of the developing countries grew at 2.8-3.0percentp.a.Theyalsoreflectedtherisingshareofhighvaluecommoditieslikelivestockproductsinthetotalvalueofproduction:intermsofquantities(whethermeasuredintonnageorcaloriecontent),thegrowthrateshavebeenlower(seeBox3.1).
The future may see some drastic decline in thegrowthofaggregateworldproduction,to1.5percentp.a.in thenext threedecades andon to 0.9 percent p.a. inthesubsequent20yearsto2050.Theslowdownreflectsthelowerpopulationgrowthandthegradualattainmentofmedium-high levels of per capita consumption in agrowingnumberofcountries.The latterfactorrestrictsthe scope for further growth in demand per capita inseveralcountrieswhichhadveryhighgrowthinthepast,foremost among them China. In contrast, developingcountriesthatexperiencedslowgrowthinthepast(andasresultstillhavelowpercapitaconsumption-lessthan

5
2700kcal/person/day)andpotentialforfurthergrowth,should not experience any slowdown but rather someacceleration. Increasingly, world agriculture will haveto depend on non-food uses of commodities if growthrates are not to be sharply lower compared with thepast.As noted, the biofuels sector may provide somescope,perhapsasignificantone,forrelaxingthedemandconstraintsrepresentedbythedecliningratesofincreaseinhumanconsumption.
Cereals: All the major commodity sectors shouldparticipate in the deceleration of agricultural growth.Thecerealssector(sumofwheat,milledriceandcoarsegrains) has already been in such downward trend forsometimenow,withthegrowthratehavingfallenfrom3.7percentp.a.insixties,to2.5percent,1.4percentand1.1percentp.a.inthesubsequentthreedecadesto2001.Inthislatteryearworldproductionstoodatjustunder1.9billiontonnes.Ithasgrownfurthersincethentosome2billiontonnesin2005(preliminaryestimate).Weprojectincreasestosome3billiontonnesby2050andthiswouldaffordsomeincrease inworldpercapitaavailability toaround 340 kg (for all food and non-food uses), some 10percentoverpresentlevels.Itisnotedthatthecurrentlevelofpercapitaconsumption(309kg in1999/01) islowerthanwhatwasachievedinthepastmainlyduetothesharpdeclinesinthetransitioneconomies(theformersocialistcountriesoftheUSSRandEasternEurope)inthe 1990s. Recovery in their consumption as well ascontinuedgrowthinthedevelopingcountriesshouldraisetheworldaveragetolevelsithadattainedinthepast(inthemid-80s).Agoodpartoftheincreaseinworldcerealsconsumption should be for animal feed (mostly coarsegrains), with the bulk of such consumption increasesoriginating in the developing countries to support theexpansionoftheirlivestockproduction.
Thedecline in thegrowth ratenotwithstanding, theabsoluteincreasesinvolvedshouldnotbeunderestimated:an increase ofworld production by another 1.1 billiontonnes annually will be required by 2050 over the 1.9 billion tonnes of 1999/01 (or 1 billion tonnes overthe2billionof2005).Achievingitshouldnotbetakenforgranted,as landandwater resourcesarenowmorestretchedthaninthepastandthepotentialforcontinuedgrowthofyieldismorelimited.
Not all countries will be able to increase cerealsproductionpari passuwiththeirconsumption.Therefore,
past trends of ever growing net cereal imports of thedevelopingcountriesshouldcontinueandgrowtosome300milliontonnes9by2050a2.7-foldincreaseoverthe112milliontonnesof1999/01.Thisisamuchlowerrateofincreasecomparedwiththepastwhentheyhadgrownmorethan5-foldin40years.Thenovelelementintheprojectionsisthattransitioneconomiesaretransformingthemselvesfromthelargenetimportersofcerealstheywere up to the early 1990s (net imports of 43milliontonnes in1993) tonetexporters (18million tonnesnetexports annual average in 2002-04). Such net exportscould increase further in the future and, therefore, thetraditional cereal exporters (NorthAmerica,Australia,the EU and the developing exporters) would not have to produce the full surplus needed to cover thisgrowingdeficit.
Livestock:Productionandconsumptionofmeatwillalsoexperienceagrowthdecelerationcomparedwiththehighgrowthratesof thepast, thoughthemilksectorshouldaccelerate,mainlybecauseofgrowthinthedevelopingcountries demand. The growth of the meat sector hadbeendecisivelyinfluencedupwardsbytherapidgrowthof production and consumption in China, and to asmallerextentalsoBrazil.Thisupwardinfluenceontheworld totals was counterbalanced in the 1990s by thedrasticshrinkageofthelivestocksectorinthetransitioneconomies, leading to a growth rate in the decade of 2.1percentp.a.vs.3.1percentifthetransitioneconomiesdataareexcludedfromtheworldtotals.Theseinfluenceswillnotbepresentwiththesameforceinthefuture-withtheexceptionofcontinuedrapidgrowthofproductioninBrazil(mainlyforexport).ThedeclineinthetransitioneconomieshasalreadybeenreversedwhilethegrowthofmeatconsumptioninChina,whichgrewfrom9kgpercapitatomorethan50kginthelastthreedecades,cannotobviouslycontinueatthesamehighratesformuchlonger(see,however,Chapter3foruncertaintiesconcerningthereliabilityofthelivestockdataofChina).
Therestofthedevelopingcountriesstillhassignificantscopeforgrowth,giventhattheirannualpercapitameatconsumptionisstillamodest16kg.Someofthisgrowthpotentialwillmaterializeaseffectivedemandandtheirpercapitaconsumptioncoulddoubleby2050,i.e.fasterthaninthepast.Itisunlikelythatothermajordevelopingcountrieswill replicate theroleplayedbyChina in thepast in boosting the world meat sector. In particular,
9 To 380 million tonnes if we exclude from the developing countries the traditional exporters among them - Argentina, Thailand and Vietnam.
Overview

6
India’smeatconsumptiongrowthmaynotexertanythinglike the impactChina had in the past, notwithstandingitshugepopulationandgoodincomegrowthprospects.The countrymay still have low levels of consumption(though significantly above the current 5 kg) for theforeseeablefuture.
Vegetable oils:Thesectorhasbeeninrapidexpansion,fuelledbythegrowthoffoodconsumptionandimportsofthedevelopingcountries.Thegrowthofthenon-fooduses (including in recent years for the production ofbiofuelsinsomecountries)wasalsoamajorfactorinthebuoyancyofthesector,aswastheavailabilityofampleexpansionpotentialoflandsuitableforthemajoroilcrops-mainlysoybeansinSouthAmericaandtheoilpalminSouth-EastAsia.Indeed,oilcropshavebeenresponsibleforagoodpartoftheincreasesintotalcultivatedlandinthedevelopingcountriesandtheworldasawhole.Thesetrends are likely to continue as the food consumptionlevelsofthedevelopingcountriesarestillfairlylowandtheincomeelasticityofdemandforvegetableoilsisstillhighinmostcountries.Inparallel,thegrowinginterestinusingvegetableoilsintheproductionofbiofuelsmayprovideasignificantboost.Inthisrespect,concernshavebeen expressed that the rapid expansion of land areasunderoilcropscanhave significantadverse impactsonthe environment, mainly by favouring deforestation.This is just another example of the trade offs betweendifferentaspectsofsustainability thatoftenaccompanydevelopment:benefitsintermsofreducedemissionsofgreenhouse gases when biofuels substitute petroleum-based fuels in transport vs. the adverse impacts of landexpansion.
Sugar: Thereareanumberoffeaturesthatcharacterizetheevolutionofthesectoranddeterminefutureprospects:(a) rapidly rising food consumption in the developingcountries (3.2percentp.a. in the last30years); (b) theemergenceofseveralofthemasmajornetimporters(netimports of the deficit developing countries rose from10 million tonnes to 29 million tonnes over the sameperiod);(c)thegrowingdominanceofBrazilasthemajor low-cost producer and exporter (production rose from7.5milliontonnesto32milliontonnes10andnetexportsfrom1milliontonnesto11milliontonnesoverthesameperiod);(d)thegrowinguseofsugarcaneasfeedstockfortheproductionofbiofuels(ethanol,mainlyinBrazil,
whichnowusessome50percentofcaneproductionforthispurpose);and(e)theprospectthataftermanyyearsofheavyprotectionismofthesugarsectoranddecliningnetimportsintheindustrialcountries(whichturnedintonetexportersfromthemid-80s,mainlyduetotheprotectionofthesectorintheEUandthesubstitutionofcorn-basedsweetenersforsugarintheUSA),thestagemaybesetforareversalofsuchtrendsandtheresumptionofgrowthintheirimports.
Many developing countries, including China, havestill low or very low sugar consumption per capita (28 countries have less than 10 kg p.a. and another 18 have 10-20 kg). Therefore, the potential exists forfurthergrowthinconsumption,thoughitwillnotbeasvigorousasinthepastwhen60developingcountrieshadlessthan20kgin1969/71.Dependingontheevolutionofpetroleumprices,sugarcaneuseasfeedstockfortheproduction of biofuels may keep growing in severalproducing countries (or those that have the resourcepotential to becomemajor producers).Already severalcountries have plans to do so. It is possible that thisdevelopmentwouldcontributetokeepingthegrowthrateofworldaggregatedemand(foralluses)andproductionfromdeclininginlinewiththedecelerationinthedemandforfooduses.
Roots, Tubers and Plantains:Theseproductsplayanimportantroleinsustainingfoodconsumptionlevelsinthemanycountriesthathaveahighdependenceonthemandlowfoodconsumptionlevelsoverall.Manyofthesecountries are in sub-SaharanAfrica. In some countries(e.g.Nigeria,Ghana,Benin,Malawi)gainsinproductionfollowing the introduction of improved cultivarshave been instrumental in raising the per capita foodconsumption levels.There is scope for other countriesin similar conditions to replicate this experience. Thisprospect, together with the growing consumption ofpotatoesinmanydevelopingcountries,shouldleadtoareversalofthetrendforpercapitafoodconsumptionoftheseproductstodecline–atrendthatreflectedlargelythe decline of food consumption of sweet potatoes inChina. In addition, the potential use of cassava in theproduction of biofuels (actively pursued in Thailand)wouldfurthersustainthedemandgrowthforthissector.
10 Raw sugar equivalent of sugar cane production.

7
Agricultural trade of the developing countries
The growing imports of, mainly, cereals, livestockproducts,vegetableoils and sugarofmanydevelopingcountries has resulted in the group of the developingcountries as a whole turning from net agriculturalexporters tonet importers inmostyearsafter theearly1990sreachingadeficitofUS$12billionin2000,beforerecoveringinsubsequentyearsto2004.Therecoveryofrecent years reflected above all the explosive growthof Brazil’s agricultural exports, including oilseeds andproducts,meat,sugar,etc.WithoutBrazil,thedeficitoftherestofthedevelopingcountries,alreadypresentfromthelate1980sonwards,grewfurtherfromUS$20billionin 2000 to US$ 27 billion in 2004. Their traditionalexportcommodities(tropicalbeverages,bananas,naturalrubber,etc)didnotexhibitsimilardynamismandforlongperiodsstagnatedoroutrightdeclined(invalue terms),withtheexceptionofthegroupfruitandvegetables.
The structural factors underlying these trends arelikely to continue. The growing food demand in thedeveloping countries will continue to fuel the growthofimportrequirementsofbasicfoodsinmanyofthem,whilethescopeislimitedforgrowthofconsumptionandimportsoftheirtraditionalexportablestothedevelopedcountries. If anything, the growing competition amongthedevelopingexporterstosupplythosenearlysaturatedmarketswill continue to put pressure on prices (levelsand instability) and lead to shifts in market shares atthe expense of the weakest exporters among them, asithappenedwithcoffee in recentyears. Itmayhappenwith sugar if the preferences protecting the weakestdevelopingexportersweretobediminishedoroutrightremovedunderthethrustoftradereforms.Whatwillbesomewhatdifferent from thepast is that the traditionaldichotomydeveloped(net importers)–developing(netexporters) will be further blurred: the markets facingthe major developing exporters will be increasinglythose of the importer developing countries, as it isalreadyhappeningwithcommoditiessuchassugarand vegetableoils.
1.3 Conclusions
The slowdown in world population growth and theattainmentofapeakoftotalpopulationshortlyafterthemiddleofthiscenturywillcertainlycontributetoeasingthe rate atwhich pressures aremounting on resourcesand the broader environment from the expansion andintensificationofagriculture.However,gettingfromheretotherestillinvolvesquantumjumpsintheproductionofseveralcommodities.Moreover,themountingpressureswill be increasingly concentrated in countries withpersistinglowfoodconsumptionlevels,highpopulationgrowth rates and often poor agricultural resourceendowments.Theresultcouldwellbeenhancedriskofpersistent food insecurity for a long time to come in anumberofcountriesinthemidstofaworldwithadequatefoodsuppliesandthepotentialtoproducemore.
Theslowdowninthegrowthofworldagriculturemaybemitigatediftheuseofcropbiomassforbiofuelswereto be further increased and consolidated.Were this tohappen,theimplicationsforagricultureanddevelopmentcould be significant for countries with abundant landandclimateresourcesthataresuitableforthefeedstockcrops;assuming,ofcourse,thatimpedimentstobiofuelstradedonotstandontheway.SeveralcountriesinLatinAmerica, South-East Asia and sub-Saharan Africa,including some of the most needy and food-insecureones,couldbenefit.Whetherandtowhatextentthiswillhappenisveryuncertain,buttheissuedeservesseriousanalysis and evaluation11. Of particular interest are (a)possibleadverseeffectson the food securityof thepoor and the food-insecure if food priceswere to risebecauseofresourcediversiontowardstheproductionoffeedstockcropsforbiofuels;and(b) theenvironmentalimplications of cultivated land expansion intopasturelandsandforestedareas.Asnoted,thisisatypicalcaseofpossible trade-offsbetweendifferentaspectsofthe environment and sustainability: benefits from thereduction in greenhouse gas emissions when biofuelssubstitute fossil fuels in transport and adverse effectsfromtheexpansionandintensificationofagriculture.
11 Work is underway in the Global Perspective Studies Unit at FAO.
Overview

8
2.1 The broad picture: historical developments and present situation
2.1.1 Progress made in raising food consumption per person
Food consumption, in terms of kcal/person/day, is thekey variable used for measuring and evaluating theevolution of the world food situation1. The world hasmadesignificantprogressinraisingfoodconsumptionperperson.Inthethreedecadesto1999/01,itincreasedfrom
anaverageof2400kcal/person/daytoalmost2800kcal/person/day(Table2.1).Thisgrowthwasaccompaniedbysignificantstructuralchange.Dietsshiftedtowardsmorelivestock products, vegetable oils, etc. and away fromstaplessuchasrootsandtubers(Tables2.7and2.8).Theincrease inworld average kcal/person/daywould havebeen even higher but for the declines in the transitioneconomiesinthe1990s.
Thegainsintheworldaveragereflectedpredominantlythoseofthedevelopingcountries,giventhattheindustrialcountries and the transition economies had fairly highlevelsofpercapitafoodconsumptionalreadyinthepast.
Prospects for food and nutrition
2CHAPTER
Table 2.1 Per capita food consumption (kcal/person/day)
1969/71 1979/81 1989/91 1999/01 2015 2030 2050
World 2411 2549 2704 2789 2950 3040 3130 Developing countries 2111 2308 2520 2654 2860 2960 3070 sub-Saharan Africa 2100 2078 2106 2194 2420 2600 2830 - excluding Nigeria 2073 2084 2032 2072 2285 2490 2740 Near East / North Africa 2382 2834 3011 2974 3080 3130 3190 Latin America and Caribbean 2465 2698 2689 2836 2990 3120 3200 South Asia 2066 2084 2329 2392 2660 2790 2980 East Asia 2012 2317 2625 2872 3110 3190 3230 Industrial countries 3046 3133 3292 3446 3480 3520 3540 Transition countries 3323 3389 3280 2900 3030 3150 3270
Note: See Appendix for country classifications
1 The more correct term for this variable would be “national average apparent food consumption or availability”, since the data come from the national Food Balance Sheets rather than from food consumption surveys (see Box 2.2). The term “food consumption” is used in this sense in this report.

9
2800
3200
2400
2600
3000
2200
2000
1800
1600
1999/011989/911979/811969/71
Mexico Brazil China Indonesia Nigeria Pakistan India Bangladesh
(Kca
l/per
son/
day)
This overall progress of the developing countries hasbeendecisivelyinfluencedbythesignificantgainsmadebythemostpopulousamongthem.Therearecurrently8developingcountrieswithapopulationof100millionormore.Ofthem,onlyBangladeshremainsatverylowlevelsoffoodconsumption.China,Indonesia,BrazilandMexicohavemadethetransitiontofairlyhighlevels(intherange2900-3150kcal).Inmorerecentyears(fromthelate1980s)IndiaandPakistanalsomadesomeprogressandarenowapproachingmiddling levelsofpercapitafoodconsumptionafter longperiodsofnearstagnation(Figure2.1).Nigeria’sdatashowthatthecountryraised
per capita food consumption significantly to medium-highlevelsinthedecadestartinginthemid-eighties(butseeBruinsma,2003:37fordataproblemsinNigeria).
However,thedataonapparentfoodconsumptioninsomeoftheselargecountriesrevealsomecontradictoryevidencewhenconfrontedwiththosedepictingthebroadereconomicsituation.Precisely,andasFigure2.1shows,inIndiathegradualriseinapparentaverageconsumptioncametoavirtualstandstillinthe1990sandseemstohaveremainedstuckataround2400kcal/person/day.Yetitwasinthedecadeofthe1990sthatIndia’seconomicgrowthaccelerated andper capita incomes, or rather themore
Figure 2.1 Per capita food consumption, developing countries with over 100 million population in 2000
(Kca
l/per
son/
day)
Calories (Kcal/person/day) Calories (Index, 1979/81=100) HHCE/Capita (Index 1979/81=100)
Inde
x 19
79/8
1=10
0
300 3000
250
200
150
100
50
0
2500
2000
1500
1000
500
0
Korea, Rep. India Nigeria
Sources: Calories, Faostat FBSheets as of Aug. 04; Household Consumption Expenditure (HHCE in 1995$), World Bank (2004)
1962
2002
1972
1982
1992
1962
2002
1972
1982
1992
1962
2002
1972
1982
1992
Figure 2.2 Evolution of apparent food consumption/capita in relation to income per capita: three country typologies
Prospects for food and nutrition

10
relevantHouseholdConsumptionExpenditure (HHCE)percapita,grewmuchfasterthanbefore(3.3percentp.a.in1992-02,up from2percent in theprecedingdecadeand1.6percentinthedecadebefore).Ontheotherhand,thedata forNigeria, if correct,would seem to suggestevolutionoffoodconsumptionintheoppositedirection,i.e. fast growth in food consumption per capita in thedecade to the early 1990s, precisely when per capitaincomesandHHCEwereonapathoffastdecline.Gainsincassavaproductivityareoftencitedasamajorfactorexplaining the gains in food consumption in Nigeria(FAO,2000;Nweke,2004).The“paradoxes” for thesetwocountriesareshowninFigure2.2togetherwiththecase of Korea, Rep. which provides a benchmark ofwhatconstitutesamore“normal”evolutionarypath,i.e.food consumption growing fastwith economic growthandsubsequentlyslowingdown,andeventuallylevelingoff,ashighlevelsofaround3000kcal/person/daywereachieved.Acloserlookatthe“paradox”ofNigeriawasattemptedinBruinsma(2003:37)andisattemptedhereforIndia(Box2.1).
An alternativeway of looking at changes over thehistorical period is to observe the distribution of the
populationofthedevelopingworldwholiveincountrieshavinggiven levelsofkcal/person/day.This isa roughand far from perfect approximation to depicting adistributionpatternofworldfoodconsumption,usingthecountryaveragesastheunitofobservationintheabsenceofcomprehensivewithin-countrydistributiondata.TherelevantdataareshowninTable2.2.Thestarkchangesthattookplaceintherelativelyshortperiodof30yearsarevividlydepicted:thirtyyearsago,some2billion,or75percentofthe2.6billionpopulationofthedevelopingcountrieslivedin47countries,includingbothChinaandIndia,withunder2200kcal/person/day,more thanonehalf of them in countrieswith under 2000 kcal,Chinaamongthem.Onlysixdevelopingcountriesaccountingforamere100millionpopulationhadover2700kcal,a level that is roughly near a threshold for not havingsignificantprevalenceofundernutrition.
Thirtyyearsonthesituationhadchangeddramatically:“only” some 600 million (12 percent) of the greatlyincreased population (4.7 billion) of the developingcountries lived in the under 2200 kcal category,whileasubstantial2.4billion(51percent)hadshiftedintotheover 2700 kcal category. The gains made by some of
Table 2.2 Population living in developing countries with given per capita food consumption (million)1
kcal/person/day 1969/71 1999/01 2030 2050
Under 2200 Population (m.) 1962 584 29 Under 2200 Average kcal 1992 2001 2060 Under 2200 No countries 47 32 2
2200-2500 Population (m.) 438 1537 785 1282200-2500 Average kcal 2321 2403 2380 24602200-2500 No countries 40 26 17 3
2500-2700 Population (m.) 103 201 510 6182500-2700 Average kcal 2624 2547 2605 26252500-2700 No countries 8 14 23 12
2700-3000 Population (m.) 40 1925 2336 16222700-3000 Average kcal 2800 2933 2835 28702700-3000 No countries 4 16 31 42
Over 3000 Population (m.) 60 484 3049 5140Over 3000 Average kcal 3117 3174 3280 3200Over 3000 No countries 2 14 29 45
All Developing Population (m.) 2604 4731 6709 7509All Developing Average kcal 2111 2654 2960 3070All Developing No countries 101 102 102 102
1 Only countries with Food Balance Sheets

11
Box 2.1 Indian paradox: Near stagnant average food consumption in midst of rapid economic growth
As discussed later (section 2.3 and Chapter 3), much of the slowdown in global cereals consumption has been the result of developments in per capita food consumption of cereals in China and India, which between themselves account for 38 percent of world population. A major issue for the global projections is the extent to which recent developments in these two large countries are indicative of things to come or if these trends may change in the future. To address this issue we first note the significant differences existing in the historical developments in the two countries.
In China, the leveling off and subsequent decline in per capita cereals consumption occurred when the country had reached nearly 220 kg/person/year and consumption of all foods was providing 2600+ kcal/person/day. In parallel with the declines in cereals, the consumption of other foods was increasing leading to the present nearly 3000 kg/person/day (more on China’s cereals in Chapter 3, Box 3.2.). In contrast India’s per capita cereals consumption started stagnating/declining when it was still relatively low at around 170 kg and when consumption of all food was also low at around 2400 kcal/person/day (or 2150 kcal rural and 2070-2160 urban according to the national consumer expenditure surveys of 1993-94 and 1999-2000 – (Dev et al., 2004: tables 8-9). Somewhat higher levels are indicated by nutrition surveys proper, though these are measured in terms of consumption units rather than per capita, Shetty, 2002: tables 5-6). Moreover, the stagnation and/or decline in per capita cereals consumption was not accompanied by any significant increases in the consumption of total food calories, so that the national average is still in the area of 2450 kcal/person/day. The reduction of calories from cereals, and to a smaller extent pulses, was made up mainly by increases in the consumption of vegetable oils, milk, sugar and fruit and vegetables.
These developments are assumed to reflect both the influence of standard economic factors (e.g. inadequate growth of incomes of those that would consume more cereals if they could afford them, and prices) but also what goes by the name of “change in tastes and preferences”. Several authors emphasize the role of such shifts in tastes, e.g. Dev et al. (2004), Rao (2000), Sen (2005). However, we are still short of explanations why such widespread shifts, that would normally occur when national averages are at levels consonant with significantly reduced undernutrition, seem to occur in India at the very early stages of such nutritional transition when the prevalence of undernutrition is still high. The latter is estimated at 21 percent of the population or 220 million (FAO, 2004a). These estimates are not different from those circulating among national experts, e.g. Paroda (2001): “India still has the world’s largest number of poor people (around 250 million) who do not get two square meals a day”.
To judge from survey data of food intakes, the situation has been getting worse rather than improving, at least in terms of per capita calories consumed (Shariff and Malik, 1999), and this phenomenon is fairly widespread affecting all classes, rural and urban and those below and above the poverty threshold (Sen, 2005: table 5). Some authors (e.g. Saha, 2000) consider that the decline of cereals consumption is a sign of distress rather than of improving welfare favouring diet diversification, indicating that things are getting worse in the rural areas as people have to pay more than before for things like fuel and other basic necessities of life. Of course, this is saying that rural incomes have not improved at anything near the rates implied by the high overall economic growth rates, if at all. In which case, the near stagnant levels of national average food consumption may not be much of a paradox.
Overall, however, one should be careful in taking at face value the calorie data coming from the surveys (similar reservations apply, of course, to the FAO estimates of apparent food consumption based on the food balance sheets). Such surveys seem to consistently show significant underconsumption of the population groups at the bottom of the income distribution scale. For example, in ten of India’s 16 States the poorest (by expenditure) 20 percent of the population had in 1999-2000 calories in the range in the range 1300-1600. Worse, in 1983 the poorest 20 percent are shown as having had calories in the range 850-1360 in 3 States (Tamil Nadu, Kerala, Karnataka - Meenakshi and Vishwanathan, 2003, Table 6). Nutritionists would say these levels are hardly sufficient for survival and minimal activity if persons are permanently subjected to them even after accounting for differences among States in population characteristics (age/sex structures, body weight). Apparently this result reflects, inter alia, exclusion of the food consumed by employees in their employers’ households. In India’s National Sample Surveys such food is counted as part of the latters’ food consumption (Minhas, 1991). In conclusion, we should evaluate carefully the reliability of the survey data before drawing conclusions about developments in India’s food consumption levels.
Prospects for food and nutrition

12
theverypopulousdevelopingcountriesmentionedabovewere largely responsible for thismassive upgrading ofthefoodsituationofthedevelopingcountries.
2.1.2 Failures
A significant number of countries failed to participatein this general thrust towards increasing average foodconsumption levels.There are currently 32 developingcountrieswhere food consumption is under 2200kcal/person/day (Table 2.2). Figure 2.3 summarizes theirhistorical experience: present (average 1999/01) levelsarecomparedwiththehighestandlowestonesrecordedinany5-yearaverage(5-yearaveragesareusedtosmoothout distortions from yearly fluctuations) in the period1961-2002.Thefollowingcommentsmaybemadeaboutthese32countries:n Several among them (e.g. Iraq, Afghanistan, the
Central African Republic, Panama, Madagascar,Malawi) had achieved middling levels (over 2400kcal) or even high ones (Iraq) in at least one 5-yearaveragein thepast.Theywere in theunder-2200 kcal class in 1999/01 because they suffereddeclines, some particularly deep ones, Iraq,Afghanistan,CongoDR,Burundi andLiberia.Theimpactofwarorwar-likeconditionsisevident.
n Formost other countries in Figure 2.3, the highestlevel ever achieved was totally inadequate to startwith, yet they suffered further declines, some verysharp ones, e.g. Somalia, Burundi, Congo DR,Rwanda,Kenya,Ethiopia-cum-Eritrea6.
n Finally, a few countries did not suffer declinesbut have always had very low per capita foodconsumption.Thatis,theyhaveneverhadlevelsthatweresignificantlyabovetheverylowonestheyhavecurrently.HerebelongBangladesh,Niger,HaitiandMozambique.
Lookingat the regionalpicture, sub-SaharanAfricastands out as the only region which failed to makeany significant progress in raising per capita foodconsumption,astagnationevenmorepronouncedifweexcludeNigeriafromtheregionalaverages(Table2.1).Notallcountriesoftheregionareinthisdirefoodsecuritysituation.BesidesNigeria, anumberofothercountriesmadesignificantprogresstoover2400kcal/person/day(Mauritius,Mauritania,Ghana,Gabon,Benin,BurkinaFasoandLesotho)but theirweight in theregionis toosmall to have much effect on the total. The regionalaggregatepictureisdominatedbythefailuressufferedbythelargercountries.Ofthe12countrieswithpopulationofover15million,sixhavepercapitafoodconsumption
National income data can help us examine the issue in an international context. India’s per capita GDP in the year 2000 was 2220 PPP$ of 19952 (World Bank, 2004) when per capita apparent food consumption was 2410 kcal/person day. This relationship is not at all “abnormal” in a cross-country comparison: there are 11 developing countries3 with GDP in the neighbourhood of that of India (PPP$ 2200 plus/minus $500) and they all have kcal/person/day in the range 2000-2600, with India being right in the middle of the range. Going by analogy, in the future India should be somewhere near the middle of the range of countries with incomes in the neighbourhood of what India will have at that time. Assuming the growth rate of per capita GDP of the last 10 years (4.1 percent p.a.) were to apply also to the period to 2030, India’s per capita GDP should rise by 2030 to PPP$ 7400 of 1995. Countries that currently have incomes in range PPP$ 7400 plus/minus $10004, have kcal/person/day in the range 2700-3150. Therefore, India’s average national food consumption rising to around 2800 kcal by 2030 would not be out of place in the projections. Were this to happen, it would imply a significant reduction in undernutrition for the country and the world. To judge from survey data, Indians do move up the calorie scale as incomes increase: in six of India’s 16 States the richest (by expenditure) 20 percent of the population had over 3000 kcal/person/day while the bottom 20 percent had calories in the range 1713-2228 (Meenakshi and Vishwanathan, 2003, Table 6). As incomes rise and poverty is reduced5, those in the less well off segments of the population can be expected to behave vis-à-vis food more like those in the better-off groups currently.
6 The data used in Figure 2.3 refer to the aggregate Ethiopia and Eritrea, because there are no separate data before 1993 for making historical comparisons for the two countries separately.
2 PPP=PurchasingPowerParity(definitionin:http://web.worldbank.org/WBSITE/EXTERNAL/DATASTATISTICS/ICPEXT/ 0,,contentMDK:20118237~menuPK:62002075~pagePK:60002244~piPK:62002388~theSitePK:270065,00.html) 3 Cameroon,Pakistan,Angola,Ghana,Guinea,Vietnam,Lesotho,Bolivia,NicaraguaandHonduras(Zimbabweisnotincluded because it was in the middle of a severe food crisis).4 Brazil, Uruguay, Costa Rica, Mexico, Malaysia, Trinidad and Tobago and Chile (Botswana, with income in this range but only 2160 calories, is not included in the sample as being atypical and a clear outlier, probably because of the large weight of the diamond sector in total GDP). 5 See the World Bank’s projections of reductions in South Asia’s poverty (Table 2.6).

13
levelswhicharelowerthanwhattheyattainedinthepast-someofthemmuchlower,e.g.CongoDR,Madagascarand Tanzania. Only Nigeria and Ghana among theselargercountrieshaveshownpersistentgainsinpercapitafood consumption, apparently in both countries due tojumps in production of roots and tubers, as discussedlaterinthisChapter.
2.1.3 The prevalence of undernourishment– past and present
ThelatestFAOassessment,The State of Food Insecurity in the World 2004 (FAO, 2004a), estimates the totalprevalence of undernourishment in the developingcountriesat813millionpersonsin2000/02(17percentof their population - Table 2.3)7, when average foodconsumptionreached2650kcal/person/day.Thisestimateisnotsignificantlydifferentfromthatoftenyearsearlier,the3-yearaverage1990/92(823million),althoughthenitrepresentedahigherproportionoftheirtotalpopulation(20percent).The3-yearaverage1990/92was thebaseusedbythe1996WorldFoodSummit(WFS)insettingthetargetofhalvingthenumbersundernourishedinthedevelopingcountriesby2015atthelatest.
Thisslightdeclinerepresentsvirtuallynoprogressinthefirsttenyearsofthe25-yearperiodsetbytheWFSfor attaining the target. In practice, declines achievedin East Asia were compensated by increases in theothertworegionswiththehighestconcentrations-sub-SaharanAfricaandSouthAsia.Ifthesetrendscontinue,the halving target will certainly not be achieved andwhatever reductions take place will further accentuatethedividebetweencountriesmakingprogressandthosefallingbehind.
Changes in the prevalence of undernourishmentare close correlates of changes in food consumptionlevels (kcal/person/day), as explained in Box 2.2. ThehistoricaldatainTable2.1showthatfoodconsumptionlevels have improved greatly for most regions overthe last three decades. Such improvement must havebeen accompanied by a lowering of the prevalence ofundernourishmentalsoin theyearsbefore1990/92.Byimplication, undernourishment must have been muchhigherinthepast,e.g.in1969/71whentherewereonly2110kcal/person/dayon the average in thedevelopingcountries.Estimatesforthatperiodindicate960millionwhichwas37percentofthepopulation8.
Mon
golia
Bangla
desh
Pana
ma
Botswan
a
Guatem
ala
Mala
wiIra
qCha
dNige
r
Korea
-DPR
Kenya
Haiti
Mad
agas
car
Liberi
a
Zimba
bwe
Yemen
Cambo
dia
Congo
Angola
Moz
ambiq
ue
Centr.
Afr.Rep
.
Rwanda
Tanz
ania
Sierra
Leon
e
Zambia
Ethiop
ia
Afghan
istan
Somali
a
Congo
-DR
Burun
di
(Kca
l/per
son/
day)
1200
1400
1600
1800
2000
2200
2400
2600
2800
3000
3200
3400
3600
Average 1999/01 Highest five year average Lowest five year average
Figure 2.3 Developing countries with under 2200 kcal in 1999/01. Highest and lowest 5-year average kcal recorded during 1961-2001
7 The term “undernourishment” is used to refer to the status of persons whose food intake does not provide enough calories to meet their basic energy requirements. The term “undernutrition” denotes the status of persons whose anthropometric measurements indicate the outcome not only, or not necessarily,ofinadequatefoodintakebutalsoofpoorhealthandsanitation-conditionsthatmaypreventthemfromderivingfullnutritionalbenefitfrom what they eat (FAO, 1999: 6).8 Estimates in http://www.fao.org/faostat/foodsecurity/index_en.htm.
Prospects for food and nutrition

14
Box 2.2 Measuring the prevalence of undernourishment: the key role of the estimates of food available for direct human consumption9
The key data used for estimating the prevalence of undernourishment are those of food available for direct human consumption. These data are derived in the framework of the national Food Balance Sheets (FBS – explanations in http://faostat.fao.org/faostat/agricult/cbcp-e-e.htm). The latter are constructed on the basis of countries’ reports on their production and trade of food commodities. The part used as food is derived after deduction of estimates and/or allowances for non-food uses and for losses (excluding losses at the household or individual level10. Such losses can be considerable – see estimates for the USA in Kantor, 1998). The population data are used to express these food availabilities into per capita terms (kg/person/year, then converted to kcal/person/day). The resulting numbers are taken as proxies for actual national average food consumption. For many countries the thus estimated per capita food consumption of the different commodities are totally inadequate for good nutrition, hence the relatively high estimates of the prevalence of undernourishment reported for them.
This conclusion is inferred from a comparison of the estimated kcal/person/day shown in the FBS data with what would be required for good nutrition. The parameters for the latter are well known11, though not devoid of controversy. In the first place, there is the amount of food (or dietary) energy that is needed for the human body to function at rest (breathe, pump blood, etc.) even without allowing for movement or activity. This is the Basal or Resting Metabolic Rate (BMR or RMR). It is in the general range 1300-1700 kcal/day for adults in different physiological conditions (age, sex, height, bodyweight). Taking the age/sex structure and body-weights of the adult populations of the different countries, their national average BMRs for adults are estimated. These refer to the amount of energy as a national average per adult person that must be actually absorbed if all were in a state of rest and inactivity. For children, in addition to the BMR, an additional allowance needs to be made for the requirements for adequate growth and in the case of pregnant and lactating (nursing) mothers for the proper growth of the foetus and for the lactation needs of the growing infant.
9 Reproduced with amendments from FAO (1996a). 10 Work is currently underway to generate estimates for such losses.11 See discussion in FAO (2004b).
Table 2.3 Prevalence of undernourishment, developing countries
Percent of population
1990/92 2000/02 1999/01 2015 2030 2050
SOFI 04
Developing countries 20.3 17.0 17.2 10.1 6.9 3.9 sub-Saharan Africa 35.7 32.7 33.3 21.1 12.4 5.8 excl. Nigeria 40.8 38.3 39.0 25.2 14.7 6.8 Near East / North Africa 7.6 10.1 10.2 7.0 5.7 3.7 Latin America and Caribbean 13.4 10.2 10.7 6.6 3.9 2.6 South Asia 25.9 22.1 22.3 12.1 8.4 4.1 East Asia 16.5 11.5 11.6 5.8 3.9 2.9
Million
Developing countries 823 813 811 582 458 290 sub-Saharan Africa 170 203 201 179 140 88 excl. Nigeria 159 192 191 173 135 84 Near East / North Africa 24 40 39 36 36 29 Latin America and Caribbean 60 53 55 41 27 20
South Asia 291 301 299 203 166 90
East Asia 277 217 216 123 88 64
*The absolute numbers differ slightly from those published in FAO (2004a) because the latter include estimates for some small countries. SOFI 04 = State of World Food Insecurity in the World 2004 (FAO, 2004a)
15
When an allowance for light activity is added, estimated to be about 54 percent of the BMR, there results a range of between 1720 kcal and 1965 kcal person/day for the different developing countries given their population structures in 2000 (average: 1840). This will rise to 1820-1980 kcal by 2050 (average: 1913) when the demographic structure will be different, with a higher proportion of adults. It follows that population groups in which an average individual has habitually an intake below this level (the threshold) are undernourished because they do not eat enough to maintain health, body weight and to engage in light activity. The result is physical and mental impairment. Characteristics for the former are evidenced in nutritional anthropometric surveys. Estimating the prevalence of undernourishment means estimating the proportion of population with food intakes below these thresholds. It is noted that the notion, measurement and definition of thresholds of requirements are not devoid of controversy. For example, Svedberg (2001:12) considers that the thresholds used in the FAO measurement of undernourishment for the tropical countries are too high leading to overestimates of undernourishment12.
In principle, a country having national average kcal/person/day equal to the threshold would have no undernourishment problem provided all persons engage in only light activity and each person had access to food exactly according to his/her respective requirements. However, this is never the case; some people consume (or have access to) more food than their respective “light activity” requirements (e.g. because they engage in more energy-demanding work or have high household waste or simply overeat) and other people less than their requirement (usually because they cannot afford more). Thus, an allowance must be made for such unequal access. Empirical evidence suggests that the inequality measure used in these estimates – the coefficient of variation (CV) – ranges from 0.2 to 0.36 in the different countries (a CV of 0.2 means, roughly, that the average difference of the food intake of individuals from the national average - the standard deviation - is 20 percent of the national average). Even at the lowest level of inequality generally found in the empirical data (CV=0.2), the national average kcal/person/day must be well above the threshold if the proportion of population undernourished is to be very low. For example, a country with threshold 1800 kcal and CV=0.20, must have a national average of 2700 kcal/person/day if the proportion undernourished is to be only 2.5 percent, or 2900 if it is to be 1 percent. Naturally, if inequality were more pronounced, these requirements would be higher.
These numbers, or norms, are, therefore, a first guide to assessing the adequacy or otherwise of the national average food consumption levels in the FBS data and expressed in kcal/person/day. This latter number is the principal variable used to generate estimates of the prevalence of undernourishment as explained elsewhere (FAO, 1996b; more technical discussion in Naiken, 2003)13. Numerous countries fall below the national average energy level (kcal/person/day) required for undernourishment to be very low, in many cases they fall below by considerable margins. Therefore, even if one knew nothing more about the prevalence of undernourishment, the inevitable conclusion for these countries is that it must be significant, ranging from moderate to high or very high, even when inequality of access to food is moderate. It follows that progress towards reducing or eliminating undernourishment must manifest itself, in the first place, in the form of increased per capita food consumption. Naturally, this is not equivalent to saying that the food consumption shown in the FBS data is itself a variable which can be operated upon directly by policy. For it to rise, somebody must consume more food, and the food must come from somewhere – production or imports. The policies to raise national average consumption are those which enhance the purchasing power and more general access to food of those who would consume more if they had the means, for example, access to resources and technologies to improve their own food production capacities, access to non-farm employment, social policies, etc. The point made here is that changes in the national average kcal/person/day recorded in the FBS data do signal the direction and magnitude of movement towards improved or worsened food security status.
How reliable are the FBS data, since in many cases they show very low or very high levels of national average food consumption or sudden spurts or collapses? The answer is: they are as reliable as, mainly, the primary data on production and trade supplied by the countries, as well as the estimates made for non-food uses and losses of food commodities and the population data used to express them in per capita terms14. It is these data and estimates that are processed, in the form of the FBS, to derive the indicators of per capita food consumption as national averages used here. Given the primary data, the conclusion that many countries are in a difficult food security situation follows logically and inevitably.
12 Work is currently underway to revise the thresholds used in the estimation of undernourishment.13 These key variables (kcal/person/day and the CV) are used as parameters of the lognormal statistical distribution (with kcal/person/day as the mean) to estimate the percentage of population undernourished.14 In some cases the population data themselves are a prime source of errors in the estimates of food consumption per capita (for the case of Nigeria, see Bruinsma, 2003, Box 2.2).
Prospects for food and nutrition

16
2.2 The outlook for food and nutrition to 2015, 2030 and 2050
2.2.1 Demographics
ThepopulationdataandprojectionsusedherearethoseoftheUnitedNationsWorld Population Prospects-the 2002 Revision(UN,2003).Theprojectionsindicatethataratherdrasticslowdowninworlddemographicgrowthis in prospect.The data and projections are shown inTable2.4.Theworldpopulationof6071billionof2000is projected to grow to 8130 million in 2030 and to 8920 million in 2050. The growth rate of worldpopulation peaked in the second half of the 1960s at2.04 percent p.a. and had fallen to 1.35 percent p.a.by the second half of the 1990s. Further decelerationwill bring it down to 0.7 percent in 2025-30 and to 0.33percentby2045-50.
Despitethedrasticfallinthegrowthrate,theabsoluteannual increments continue to be large. Seventy ninemillion personswere added toworld population everyyear in the second half of the 1990s and the numberwillremainatover50millionp.a.untilthemid-2030s.Morerapiddeclinesafter2035shouldbringtheannualincrement down to 26 million by 2050. Practicallyall these increaseswill be in the developing countries.Within the developing countries themselves, therewill be increasing differentiation. EastAsia will haveshifted to negative demographic growth (-0.2 percentp.a.) in the last five years of the projection period.Attheotherextreme,sub-SaharanAfrica’spopulationwillstill be growing at 1.2 percent p.a. in the same period
2045-50, despite the drastic downward revision madein recent years in the region’s population projections.By 2050, 18million of the 26million added annuallyto world population will be in sub-Saharan Africa.Some countries, mostly in Africa, have demographicprojections suggesting that their populations in 2050wouldberathersizeablemultiplesoftheircurrentones.Thisprospectraisestheseriousissuewhethersignificantimprovementsinfoodconsumptionandnutritioncouldbeachievedintheforeseeablefuture(seediscussioninBox2.3).Inconclusion,rapidpopulationgrowthcouldcontinue to be an important impediment to achievingimprovements in foodsecurity insomecountries,evenwhenworldpopulationceasesgrowing.
2.1.2 Overall economy and poverty
The latestWorldBank assessment of global economicprospects published in late 2005 contains economicgrowth(GDPpercapita)projectionsfortheperiod2001-15(WorldBank,2006:Table1.2).Thesemedium-termprojectionsoftheWorldBankareshowninFigure2.4.HighergrowthratesinpercapitaGDPthaninthe1990sare foreseen for all regions and country groups withtheexceptionofEastAsia,whichhoweverremainstheregionwith thehighest rateofover5.0percentp.a. inper capita terms.Tonote in particular: (a) the reversalofdeclinesandrobustgrowthinthelow/middle-incomeEuropeandCentralAsia(comprisingintheWorldBank’sclassification the transition economies plus Turkey),and (b) the great contrast in the prospects of the two
Table 2.4 Population data and projections
Population (million) growth rates, percent per annum
1970 2000 2015 2030 2050 1970- 2000- 2030- 2000- 2000 2030 2050 2050
World (UN) 3692 6071 7197 8130 8919
World (countries with FBS) 3682 6048 7166 8091 8871 1.7 1.0 0.5 0.8
Developing countries 2603 4731 5802 6709 7509 2.0 1.2 0.6 0.9
sub-Saharan Africa 262 607 853 1134 1509 2.9 2.1 1.4 1.8
Near East/North Africa 183 392 521 643 774 2.6 1.7 0.9 1.4
Latin America and Caribbean 281 515 623 705 762 2.0 1.1 0.4 0.8
South Asia 708 1340 1685 1972 2208 2.2 1.3 0.6 1.0
East Asia 1169 1877 2119 2256 2256 1.5 0.6 0.0 0.4
Industrial Countries 727 905 965 1003 1019 0.7 0.3 0.1 0.2
Transition Countries 351 411 399 380 343 0.5 -0.3 -0.5 -0.4

17
Box 2.3 Countries with high population growth for 50 years and limited agricultural resources: An untenable combination?15
A key characteristic of the demographic outlook, which is not so evident in medium term projections but leaps to the eye in projections of 50 years ahead, is the prospect that a number of countries could have in 2050 populations which are large multiples of present ones. As shown in Table 2.4 world population is projected to be in 2050 47 percent above that of 2000 and that of the developing countries 59 percent. In contrast, the population of Niger (the country with the highest total fertility rate in the world of 8 children per woman at present and projected to still hold this record with 3.85 children in 2050) is projected to grow from 10.7 million in 2000 to 53 million in 2050, an almost 5-fold increase. In like manner, Yemen’s population would grow from 18 million to 84 million, Ethiopia’s from 65 to 170 million, Uganda’s from 23.5 to 103 million, and so on for a number of other countries. Almost all of these countries have been in nearly perennial food insecurity for several decades. The issue is therefore raised if and to what extent significant progress in development and food security can be achieved under the rapidly mounting population pressure implied by the demographic projections.
The issue is of paramount importance for those countries with large and growing rural populations and heavy dependence of their economies on their own agriculture for income, employment, food supplies and for providing the basis for their overall development. Countries falling in this category which also have agricultural resources that are limited in quantity and/or quality (e.g. predominantly semi-arid, little irrigation potential) and are not endowed with other resources (e.g. oil, mining) will find it much more difficult than other low-income countries to reduce poverty and make adequate progress in food security. The food and agriculture projections cannot avoid recognizing this prospect and highlight the possibility that food insecurity could continue to be a dominant characteristic in a number of countries for several decades to come. More generally, the demographic projections themselves (i.e. the underlying assumptions about fertility, mortality and migration) may have to be revisited and re-assessed in the light of prima facie incompatibilities between population growth and agricultural potentials in countries where the latter are of crucial importance for development. The just released (in early 2005) 2004 revision of the UN demographic projections (UN, 2005a) did modify the projections of the 2002 revision (used here) for some of these countries, but not always in the direction of making them more compatible with agricultural potentials. For example, Yemen’s 2050 population is now projected to be 59 million rather 84 million, but for Uganda the revision is in the opposite direction: 127 million in 2050, up from the 103 million of the 2002 projection; and Niger’s projection remains almost unchanged at 50 million in 2050.
Table 2.5 Income growth assumptions
15 A more complete discussion of the issues in this Box can be found in Alexandratos (2005).
Notes: Cols 1, 2, from World Bank (2004). GNI=Gross National Income, formerly named Gross National Product (GNP); Col. 3, based largely on World Bank projections to 2030 for World Bank (2005); Col. 4, Own assumptions. Cols 5-6 from World Bank (2006): Table 1.2; Cols 7-8, computed from Cols 1, 3, 4 and population projections in Table 2.4 *The country coverage of the World Bank groups is similar, though not identical to that in this study, e.g. Turkey is included in the group (low and middle income) Europe and Central Asia, South Africa in sub-Saharan Africa, while Korea Rep., Hong Kong and Taiwan (Province of China) are in the High-Income Countries (World Bank classification from World Bank, 2005: Table A.51).
Prospects for food and nutrition
GNI per Capita $ growth rates, percent per annum World Bank WB PPP Total GDP at Per capita GDP at Region* Atlas market prices market prices 2002 2002 2000 2030 1980 1990 2000 2030 -2030 -2050 -1990 -2000 -2030 -2050 1 2 3 4 5 6 7 8
World World total 5121 7848 3.1 3.2 1.3 1.2 2.1 2.7Developing countries 1077 3755 4.8 4.6 3.6 4.0Sub-Saharan Africa Sub Saharan Africa 450 1700 3.8 4.3 -1.1 -0.5 1.6 2.8Near East/North Middle East and 2240 5670 4.1 4.1 -1.1 1.0 2.4 3.1 Africa North AfricaLatin America and Latin America and 3280 6950 3.4 3.5 -0.9 1.6 2.3 3.1 the Caribbean the Caribbean South Asia South Asia 460 2460 6.0 5.5 3.3 3.2 4.7 4.9East Asia East Asia and Pacific 960 4280 6.0 5.0 5.8 6.3 5.3 5.0Industrial countries High income 26490 28480 2.5 2.5 2.5 1.8 2.2 2.4 countriesTransition countries Europe and 2160 6900 4.3 3.8 0.9 -1.8 4.5 4.3 Central Asia

18
regionswithhighrelativeconcentrationsofpovertyandfood insecurity,SouthAsia and sub-SaharanAfrica. Inthe former, a furtheraccelerationof the relativelyhighgrowthratesofthepastholdspromiseofpositiveimpacton poverty alleviation (see below). However, progressmay be very limited in sub-Saharan Africa, with percapita incomes growing at only 1.7 percent p.a. in theperiodto2015.Thisiscertainlymuchbetterthanthepastwhichwascharacterizedbydecliningincomes.However,itwillbefarfromsufficienttomakeasignificantdentonpovertyandfoodinsecurityinthemediumtermfuture.
TheseWorldBankprojectionsandextensionsto2030haveprovidedthebasisfordefiningtheGDPprojectionsused as exogenous assumptions in the present study.Projections for theperiod2030-50were formulatedbythe authors of this study, largely on the assumption ofcontinuationofthegrowthoftheperiodto2030,butwithsomeimportantexceptions.TheyareshowninTable2.5.Theexogenouseconomicgrowthassumptionsusedhere,together with the growth of population, are the majordeterminants of projected food consumption, thoughbynomeansaretheytheonlyones.Manyotherfactorsbesides population and averageGDP growth influencetheapparentlevelsandcommoditycompositionoffoodconsumption and have to be taken into account in theprocessofallphasesofanalyticalandevaluationworkconcerning consumption, production and trade (seemethodologicalnotes inBruinsma,2003,Appendix2).Asnoted(Figure2.2),thereareseveralcountrieswhere
theevolutionofaveragepercapitaincome(asrecordedin the national accounts data) seems to bear littlerelationshiptotheevolutionoftheaverageapparentfoodconsumption as revealed in the Food Balance Sheets.Forsomecountries,particularlythosewithseverefoodinsecurity problems, it is often the evolution of localfood production that dominates developments in foodconsumption(Bruinsma,2003:45-47).
One of the important questions we shall be askingbelowistheextenttowhichsuchprojectedfooddemandwill be associatedwith reductions in undernourishment.Since undernourishment is more often than not closelycorrelated with poverty, it is relevant to ask to whatextent the economic growth and development outlookwe use as exogenous assumptions are compatible withpovertyreduction.Wehavenowayofexploringpovertyimplicationsforthelongtermhorizonweuseinthisstudy.However,theempiricalevidencethateconomicgrowthiscorrelatedwithreductionofpoverty(definedasnumbersof people, or population proportions, living on e.g. US$1orUS$2adayorless)suggeststhatthepositivegrowthratesassumedhere(Table2.5)doimplypovertyreductions,thoughwecannotsaybyhowmuch.Someideaof themagnitudes involved in this relationship betweeneconomicgrowthandpovertyreductioncanbehadfromtheWorldBank’sprojectionsofpovertyassociatedwiththoseofthepercapitaGDPsto2015inFigure2.4.
TheirpovertyestimatesareshowninTable2.6.TheyrefertowhatiscommonlyknownasUS$1/daypoverty,
Source, World Bank (2006), Table 1.2 (see note in Table 2.5 for country coverage)
World total Sub SaharanAfrica
Middle East andNorth Africa
Latin Americaand the
Caribbean
South Asia East Asia andPacific
High incomecountries
Europe andCentral Asia
1980s 1990s 2001-157
6
5
4
3
2
1
0
-1
-2
Perc
ent p
.a.
Figure 2.4 Growth rates of per capita GDP, 1980s, 1990s and 2001-15

19
i.e. number of persons living in households with percapita expenditureunderUS$1/day,withUS$definedinunitsofPurchasingPowerParity-PPP.Thesepovertyprojectionsimplythat:n TheTargetsetbytheMillenniumDevelopmentGoals
ofhalvingby2015 the proportion (not the absolutenumbers)ofthepopulationofthedevelopingcountriesas awhole living inpoverty from thatprevailing in1990 may be achieved (the proportion falls from 31percentin1990to12.3percentin2015);
n Theabsolutenumbersinpovertymayalsobehalved.They are projected to decline from 1216million in1990to614millionin2015;
n MuchofthedeclineisduetoprospectivedevelopmentsinEastAsia,wherethehalvingofpoverty(from1990levels)hadalreadybeingachievedby2002.Furtherdeclineswould practically eliminate poverty (of theUS$1/daydefinition)intheregionby2015;
n South Asia is also projected to make great stridesin reducing significantly (though by no meanseliminating) poverty by 2015. Indeed these tworegions of Asia will account for the totality of furtherreductionsinpovertybetween2002and2015(200millioneach);
n Incontrast, theabsolutenumbers inpoverty in sub-SaharanAfricakept increasing in the1990sandareprojectedtocontinuetodosountil2015,thoughnotasfastasinthepast.Thetrendforthepercentageofpopulation inpoverty in this region toalso increasemaybereversed,butat38percentthispercentagewillstillbeveryhighin2015.
Thereisaparallelbetweentheseforeseendevelopmentsin the prevalence of poverty and those projected herefor the prevalence of undernourishment,which are thesubject of the following section. It is noted, however,that poverty and undernourishment are not identical concepts, in particular as concerns the settings of threshold levels for defining them (for discussion, seeFAO,2001:10).
2.2.3 Food security outcomes
Higher per capita food consumption in the future, but with significant exceptions
By2015,andevenmoreby2030,thekeyvariableweusetotrackdevelopmentsinfoodsecurity-percapitafoodconsumptionasdefinedabove-willhavegrownsignificantly.Theworldaveragewillbeapproaching3000kcal/person/dayin2015,willbejustover3000by2030andhigherin2050(Table2.1).Thesechangesinworldaverageswillreflectabovealltherisingconsumptionofthedevelopingcountries,whoseaveragewillhaverisenfromthepresent2650kcaltoover3000kcalin2050.Moreandmorepeoplewillbelivingincountrieswithmediumtohighlevelsofpercapitafoodconsumption.Forexample,by2050some90percentoftheincreasedpopulation of the developing countries will be living in countries with values of this variable exceeding 2700 kcal/person/day, up from 51 percent at presentandtheonly4percentthreedecadesago.Indeed,some 5 billion could be in countries exceeding 3000 kcal(Table2.2).
Table 2.6 Estimates and projections US$1 poverty, World Bank, baseline scenario
Million Percent of population
1990 2002 2015 1990 2002 2015
Developing countries 1216 1001 614 31.0 24.2 12.3 sub-Saharan Africa 227 303 336 44.6 46.4 38.4 Middle East and North Africa 6 5 3 2.3 2.4 0.9 Latin America and Caribbean 49 42 29 11.3 9.5 6.9 South Asia 462 437 232 41.3 31.3 12.8 East Asia and Pacific 472 214 14 29.6 14.9 0.9
Memo Items East Asia and Pacific, excl. China 97 34 2 21.1 10.8 0.4
Developing countries, excl. China 841 821 603 30.2 26.9 14.8
Source: Adapted from World Bank (2006), Table 1.3. See Table 2.5 for country coverage
Prospects for food and nutrition

20
These rises are not always an unmixed blessing asthediettransitionsexperiencedbymanycountriesimplychanges in diets towards energy-dense ones high infat,particularlysaturatedfat,sugarandsaltandlowinunrefined carbohydrates. In combination with lifestylechanges, largely associated with rapid urbanization,such transitions, while beneficent in many countrieswith still inadequate diets, are often accompaniedby a corresponding increase in diet-related chronicNon-Communicable Diseases (NCDs – WHO, 2003;Schmidhuber and Shetty, 2005; Alexandratos, 2006).In many countries undergoing this transition, obesity-related NCDs appear when health problems related toundernutrition of significant parts of their populationsarestillwidelyprevalent.Thetwoproblemsco-existandthesecountriesareconfrontedwitha“doubleburdenofmalnutrition”resultinginnovelchallengesandstrainsintheirhealthsystems.
Thesegainsnotwithstanding,therewillstillbeseveralcountriesinwhichthepercapitafoodconsumptionwillnot increasetolevelsallowingsignificantreductionsinthe numbers undernourished from the very high levelscurrentlyprevailing(seebelow).AsshowninTable2.2,in203012percentofthedevelopingcountrypopulation(810millionpeople)willstillbelivingincountrieswithlowlevelsoffoodconsumption(under2500kcal),andthenumberwill still be130million in2050.Asnoted(Box2.2),attheselevelsofnationalaverageconsumptionthe prevalence of undernourishment is bound to besignificant.
At the regional level, in 2030 sub-Saharan Africawillstillhaveonly2600kcal/person/day.Thedisparitybetweensub-SaharanAfricaandtheotherregionsisevenmorepronouncedifNigeriaisexcludedfromtheregionaltotal (Table2.1).Of the19countries still remaining in2030intheunder2500kcalcategory(Table2.2),14willbeinsub-SaharanAfrica.
Modest reductions in the numbers undernourished
The relatively high average consumption levels thatthe developing countries may attain in the future(Table2.1)couldleadonetoexpectthattheproblemofundernourishmentwillbesolvedorbewellonitswaytosolution, in the sense that thenumbers undernourishedshould show significant declines. This would be thecorollaryofwhatwassaidearlierabouttheimportanceofthepercapitafoodconsumptionasthemajorvariablethatisaclosecorrelateofthelevelofundernourishment.
Yet the estimates presented in Table 2.3 show thatreductionswould be rathermodest: the 810million of1999/01 (17.2 percent of the population)may become580millionin2015(10.1percent),460millionin2030(6.9percent)and290million(3.9percent)by2050.Forthedevelopingcountriesasawhole,wemayhavetowaituntil after 2030 before the numbers of undernourishedare reduced to the target set for 2015 by the WFS,i.e. one half of the 823million estimated for the baseperiodof1990/92. It is noted that theUNMillenniumDevelopmentTarget refers not to halving the numbersundernourishedbutrather to“halve,between1990and2015,theproportionofpeoplewhosufferfromhunger”(UN,2005b).Inthissense,theTargetmaybeachievedin2015,astheproportionfallsfromthe20.3percentin1990/92totheprojected10.1percentin2015.
These findings indicate that achieving significantdeclines in the prevalence of undernourishment mayprove to be more arduous than commonly thought.Acombinationofhighernationalaveragefoodconsumptionand reduced inequality (see below for assumptions)can have a significant impact on theproportion of the population undernourished.However,when populationgrowthisaddedin,suchgainsdonotnecessarilytranslateinto commensurate declines in the absolute numbers,becausethepopulationofthedevelopingcountrieswillhavegrownfrom4.7billionin2000to5.8billionin2015and7.5billionin2050(Table2.4).
The numbers of undernourished are expected todecreaselittleby2015insub-SaharanAfricaandtheywillstillbeabovethoseoftheWFSbasein1990/92.Asmalldecline isnodoubtan improvementover thehistoricaltrendofnearlystagnantfoodconsumptionpercapitainthe regionand risingnumbersofundernourished. It is,however,farfromwhatisneededtomeettheWorldFoodSummittargetofreducingthenumbersbyhalfbynolaterthan2015. Incontrast, rather significant reductionsareexpectedforEastAsiaandtoasmallerextentforSouthAsia,thetworegionsthatcontainthebulkoftheworld’sundernourishedpopulation.EastAsiaisexpectedtohavemorethanhalvedundernourishmentby2015frombase1990/92(ithadalreadyreduceditby22percent in theperiod1990/92-2000/02)andSouthAsiacouldachievethistargetshortlyafter2030.
In order to appreciatewhy these prospects emerge,let us recall briefly that future estimates are generatedbyapplying the samemethodFAOuses forestimatingpresentundernourishment.Theonlydifferenceisthatweusethefuturevaluesforthosevariablesforeachcountrythatweproject,orcanassume,tobedifferentfromthe

21
presentones.Asnoted(Box2.2),thevariableswhich,inourmethod,determinethenumbersundernourishedarethefollowing:n Theprojectedpopulation;
n The per capita food consumption in kcal/person/day, taken as a proxy for actual average nationalconsumption. Future values are derived from theprojections of per capita food consumption for each commodity discussed in detail elsewhere(Chapter 3) and summarized in Tables 2.7 and 2.8(major commodities) as well as in Table 2.1 (kcal/person/day);
n The threshold (or cut-off level) of food energy(kcal/day) a person must have in order not to beundernourished. This varies by country dependingonage/sexstructureof thepopulation.Therangeofvalues applicable to different developing countrieswas given in Box 2.2. It was noted that due to thechanging demographic structures (growing share ofadults in total population) the levels will be higherin the projection years than at present16. Therefore,this factor would tend to raise the prevalence ofundernourishment,ceteris paribus;
n Thecoefficientofinequality,asdescribedinBox2.2.Wehavenowayofknowinghowthisvariablemaychange in each country in the future. Ifwe appliedin the future the same values used for the currentundernourishment estimates, we would be ignoringtheprospectthatdecliningpovertyandrisingnationalaveragesoffoodconsumptionarenormallyassociatedwith more equal access to food. The World Bankprojections of declines in the prevalence of poverty(Table2.6)implythattheshareofpopulationbelowthepovertyline(hencealsoofpersonswithlowfoodconsumption levels) will be smaller in the futurecompared with the present. Given the nature offood consumption (it increases fast from low levelsas incomesrisebut then tends to leveloffashigherlevelsareattained)itisreasonabletoassumethatthereducedpovertyprojectedbytheBankandtherisingnationalaveragesoffoodconsumptionprojectedherewouldbeaccompaniedbyreducedinequalityinfoodconsumptionasmeasuredbythecoefficientofvariation(CV).We take this prospect on board by assumingthatcountrieswillhavelowerinequalityinthefuture.
Howmuchlowerdependsontheprogresstheymakein raising their average kcal/person/day17. The net effectoftheseassumptionsisthatthecoefficientsofvariation (CV) of the different developing countrieswhicharecurrentlyintherange0.21-0.36wouldbeintherange0.20-0.295in2050.TheestimatesoffutureundernourishmentpresentedinTable2.3arebasedonsuchassumptionsaboutchangesininequality.
One factor making for the slow decline in thenumbers of undernourished is the gradual rise in thethresholdforclassifyingapersonasundernourished.Asnoted,thisriseisduetothegrowingshareofadultsinthepopulation.The(simplearithmetic)averagethresholdofthe developing countries rises from1840 kcal in 2000to1875kcalin2030andto1913kcalin2050.Thisrisehas important implications for the futureprevalenceofundernourishment in countries with low average foodconsumption. It implies that consumptionmust rise byan equal proportion just to prevent the prevalence ofundernourishment (in percent of the population) fromincreasing,andbymore ifabsolutenumbersarenot torise.Ifthischangeintheagestructureofthepopulationandtheassociatedriseinthresholdrequirementshadnotintervened, the numbers undernourished estimated for2030wouldbe15percentlowerthanshowninTable2.3–390millionratherthan460million.
A second factor is to be found in the very adverseinitial conditions several countries start with. Forexample, 17 developing countries start with estimatedbase year undernourishment of over 40 percent18. The group’saveragepercapitafoodconsumptionis1835kcalandundernourishmentis54percentofthepopulationor146 million. The food consumption projections imply(accordingtothemethodusedhere)thattheproportion ofthepopulationaffectedwillfallto35percentby2015.This is a significant decline. However, the absolute numbers affected will fall little – to 134 million in2015,becauseof the relativelyhighgrowth rateof thegroup’spopulation,2.4percentp.a. in2000-2015.Theundernourishedmaystillbesome100million(19percentofthepopulation)in2030.
Areweperhapstoopessimistic?Readersmayjudgeforthemselvesonthebasisofthefollowingconsiderations.Thepercapitafoodconsumptionofthisgroupofcountrieshasmovedintherange1760-2070kcalinthepastfourdecades.Intheprojections,itgrowsfromthe1835kcal
16 As noted (Box 2.2) work is currently under way to revise the thresholds.17 Future CV = (present CV) times (present kcal/future kcal), subject to future CV=> 0.2018Theyare(indescendingorderofpercentundernourished):Eritrea,CongoDR,Burundi,Somalia,Afghanistan,SierraLeone, Zambia,Ethiopia,Mozambique,Haiti,Tanzania,Rwanda,CentralAfricanRepublic,Angola,Congo,LiberiaandZimbabwe.
Prospects for food and nutrition

22
in1999/01to2100kcalin2015to2350kcalin2030andto2650kcalin2050.Ifachieved,undernourishmentmayfalltotolerablelevelsbythefinalyearoftheprojections,to 7.5 percent.Taking into account population growth,aggregate demand for food (expressed in calories) isprojected togrowat3.3percentp.a. in the15years to2015.Thiscontrastswiththeexperienceofthepastfourdecadeswhen the highest growth rate achieved in any 15-yearperiod(1961-76,1962-77,…,1986-01,1987-02)was2.9percentp.a.(andthelowest1.6percent).Overall,therefore, the projections of food consumption and ofproduction,farfrombeingpessimistic,embodyadegreeofoptimism.ThisprojectedaccelerationisclearlyseeninFigure2.5which shows thehistoryandprojectionsforthisgroupofcountries.Theprojectedimprovementispartlyjustifiedbytheprospectofrecoveryofagriculturefollowingeventualcessationofwarorwarlikeconditionsthat are, or were recently, present in several countriesin thisgroup.Empiricalevidencesuggests that insuchsituationsbetterperformanceofagricultureisakeyfactorinmakingpossiblerapidincreasesinfoodconsumption(Bruinsma,2003:45-47).Similar considerations apply,mutatis mutandis, to other countries which start fromloworvery lowpercapita foodconsumptionandhighundernourishment andalsohave fairlyhighpopulationgrowthrates.
In conclusion, rapid reductions in the numbers ofundernourished require the creation of conditions thatwill lead to hefty increases in national average foodconsumption in countries starting with low levels, aswellastolowerinequalityofaccesstofood.Countries
with high population growth rates will need strongerdoses of policies in that direction than countries withslowergrowthrates.Theprojectionsofpopulationandtheoveralleconomicgrowthusedhere,andthederivedprojections of food demand and consumption, indicatethat in many countries the decline in the numbers ofundernourished will be a slow process. Moreover, inseveralcountrieswithhighpopulationgrowthratestheabsolute numbers of undernourished are projected toincreaseratherthandeclineby2015.Asnoted(Box2.3),the countries which, in addition to high demographicgrowth,alsohavelimitedagriculturalresourcesandhighdependenceonagriculture,willfind itmostdifficult toachievesignificantimprovements.
2.3 Structural changes in the commodity composition of food consumption
The growth in per capita food consumption wasaccompanied by significant change in the commoditycomposition, at least in the countries that experiencedsuchgrowth.TherelevantdataandprojectionsareshowninTables2.7and2.8.
Much of the structural change in the diets of thedeveloping countries concerned the rapid increases oflivestockproducts(meat,milk,eggs),vegetableoilsand,to a smaller extent, sugar, as sources of food calories.Thesethreefoodgroupstogethernowprovide29percentoftotalfoodconsumptionofthedevelopingcountries(in
1961
Kcal/person/d a y % Undernourished (Right scale) Million Undernourished (Right scale)
2800
2600
2400
2200
2000
1800
1600
1400
1200
1000
180
160
140
120
100
80
60
40
20
0
% U
ndernourished & M
illion Undernourished
Kca
l/per
son/
d a y
2050
19
65
1970
19
75
1980
19
85
1990
19
95
2000
20
05
2010
20
15
2020
20
25
2030
20
35
2040
20
45
Figure 2.5 Countries with undernourished over 40 percent in 1999/01

23
termsofcalories),upfrom20percentthreedecadesago.Their share isprojected to rise further to35percent in2030andto37percentin2050(intheindustrialcountriesthesharehasbeenaround48percentforseveraldecadesnow). However, structural change was not universalandwideinter-countrydiversityremainsintheshareofdifferentcommoditygroups in total foodconsumption.The major changes, past and projected, are brieflyreviewedbelow.Furtherdiscussionofdevelopments inthemaincommoditysectorsispresentedinChapter3.
Cereals continue to be by far the most importantsource of total food consumption in the developingcountries (their direct food consumption provides 54 percent of total calories) and theworld as awhole(50percent).Thereis,however,verywideinter-countrydiversity: direct food consumption of cereals providesonly15-30percentoftotalcaloriesinseveralcountriesranging from thosewith diets based predominantly onrootsandtubers(e.g.Rwanda,Burundi,thetwoCongos,Uganda,Ghana, etc.) to several high income countrieswith predominantly livestock-based diets (these lattercountriesconsume,ofcourse,largequantitiesofcerealsindirectlyintheformofanimalfeedfortheproductionofthelivestockproductstheyconsumeasfood).Attheotherextreme,countrieswithrice-baseddietslikeBangladesh,orthosewithdietsbasedoncoarsegrains(e.g.Lesotho,BurkinaFaso)continuetoderive70-80percentoftotalfoodcaloriesfromcereals.
Per capita food use of cereals19 seems to havepeakedintheearly1990s,andthisistruefortheworldas awhole (per capita apparent consumption fell from 171 kg/person/year in 1989/91 to 165 kg in 1999/01)aswellasfortheaggregateofthedevelopingcountries(from 174 kg to 166 kg). This of course raises thequestion why the average of the developing countriesshouldbelevelingoffwhensomanyofthemarefarfromhaving reached adequate levels of food consumption.Addressingthisquestionrequiresthatwelookinsomemoredetailattheexperiencesoftheindividualcountries.In practice, the peak and subsequent decline reflectsprimarily developments inChina and India. Per capitafoodconsumptionofcerealsdeclinedinChinainthelastfewyearswhile it stagnatedanddeclinedsomewhat inthe1990sinIndia.AcommentaryonIndiaisprovidedinBox2.1andonChinainChapter3(Box3.2)
These two large countries account for 38 percentof world population and for 48 percent of that of the
developing countries. Therefore trends in their valuesinfluence decisively the global totals. Excluding thesetwolargecountriesfromthetotals,theaveragesforboththeworldandthedevelopingcountrieskeptincreasinginthe1990s,albeitveryslowly.Thisveryslowgrowthinthemidstofstillsignificantundernutritionisacompositeof both positive and negative factors in operation. Onthenegativeside,therearetheexperiencesofthemanycountrieswhosedeclinesinfoodcerealsconsumptionispartofthebroaderpictureoffailuresinthefoodsecurityarea discussed in the preceding section. Countries inthis class include Iraq,Afghanistan,Rwanda,Burundi,Somaliaandseveralothers.Onthepositiveside,therearetheexperiencesofthosecountrieswhosedeclinesinfoodcerealsarebroadlypartandparcelofthewellestablishedpattern of diet diversification away from staples likecereals towardsmorepreferredfoods.Countries in thisclass include several of those in themiddle and uppermiddleincomeclasses,e.g.Taiwan(ProvinceofChina),Korea,Rep.,Turkey,Tunisia,Syria,etc.
Concerningthefuture,thedownwardpressurefromdevelopmentsinChinaandIndiaontheaveragesoftheworld and the developing countries will be attenuatedandonbalancethedeclinesintheseaveragesobservedin the last fewyearsmaybehaltedat least in thefirstsub-periodoftheprojectionsto2030beforeresumingaslowpaceofdeclineinthetwosubsequentdecades.Thislikelydevelopmentwillbetheneteffectofthecontrastingtrendsof,ontheonehand,dietdiversificationawayfromthe direct consumption of cereals in those countriesattainingmedium-highlevelsoffoodconsumption,andon theotherhand, increases inpercapitaconsumptionin those countries remaining at low levels of foodconsumption and/or diversifying towards cereals andawayfromotherstaples,e.g.rootsandtubers.Theshareofcereals in totalcalorieswillcontinue todecline,butvery slowly, falling for the developing countries from54 percent at present to 49 percent in 2030 and to 46percentin2050.Naturally,thepercapitaconsumptionofcerealsforalluses(includingfood,feedandothernon-fooduses,e.g.forseedandtheproductionofethanolorstarch)shouldkeepgrowingagainafter the reversalofthesharpdeclinesofthe1990sinthefeedsectorofthetransitioneconomies(Table2.7andChapter3).
Concerningthelikelydevelopmentsintheindividualcereals (wheat, rice, coarse grains) much of theslowdowninpercapitafoodconsumptionwillcontinue
19 Food use of cereals includes the grain equivalent of all cereals-based food products, including products like beer produced from barley and sugar-substitute sweeteners produced from maize, e.g. corn syrups.
Prospects for food and nutrition

24
tooriginateinthedeclinesinpercapitaconsumptionofrice,awellestablishedtrendinthemajorcountrieswithpredominantlyrice-baseddiets,particularlythoseintheEastAsia region. In contrast,wheat food consumptiongrewthefastestofallcerealsinthepastandwillcontinuetodosointhefuture.Suchgrowthinconsumptionwillbeaccompaniedbycontinuedgrowth inwheat importsinmanydevelopingcountries,particularlythosethatarenon-producers or minor producers for agro-ecologicalreasons(seeChapter3).
Foodconsumptionofcoarse grainshasdeclinedonaverage, but continues to be importantmainly in sub-SaharanAfrica(whereitaccountsfor70percentoffoodconsumptionofcereals,withsomecountriesdependingoverwhelmingly on maize – Zimbabwe, Zambia, etc.–andothersmostlyonmilletandsorghum–mostlythecountriesintheSudano-Sahelianzone)andtoasmallerextent in Latin America (42 percent, mostly maize).Thedecline inother regions,particularly inChina,hasbroughtdowntheaverageforthedevelopingcountries.Infuture,smallerdeclinesinAsiaandsomerecoveryinsub-SaharanAfricacouldhaltthetrendtowardsdeclineoftheaverageofthedevelopingcountries.Developmentsinmaizeusefortheproductionofsweeteners(whichinourdataappearsasfooddemandformaize)haveboostedthe foodconsumptionofcoarsegrains in the industrialcountries,mainlyintheUSA,whereHFCShasreplaceda good part of sugar. Aggregate demand for coarsegrainswillbeincreasinglyinfluencedbythedemandforanimal feed and, in somecountries, for theproductionof biofuels.As discussed inChapter 3, the developingcountrieswillbeplayingagrowingroleintheworldtotaldemandandtradeofcoarsegrains.
Wide inter-country differences in cereals foodconsumptionwill continue topersist.Several countrieshavepercapitafoodconsumptionofcerealsunder100kg/year,somebelow50kg(CongoDR,Burundi,Rwanda).These persistently low levels reflect a combination ofagroecological factors (favouring dependence of dietsonrootsandtubers,bananasandplantains,incountriesmainly in the humid tropics) as well as prevalence ofpovertyanddepressedlevelsoffoodconsumptionoverall.It isworth noting thatAfrica includes countries at the
twoextremesof thecerealsconsumptionspectrum:thecountrieswith thehighest foodconsumptionofcerealsarealsoinAfrica,namelythoseinNorthAfrica,butalsoNiger,BurkinaFasoandLesotho,withpercapitalevelsintherangefrom200to250kg.
Livestock products: The diversification of diet indevelopingcountrieshasbeenmostvisible in the shifttowardsmeat,milk and eggs.Here again there is verywide diversity between countries as regards both thelevelsofconsumptionachievedaswellasthespeedwithwhichthetransformationhasbeentakingplace.Severaldeveloping countries have traditionally had high meatconsumption,comparable to thelevelsof the industrialcountries.TheyincludethetraditionalmeatexportersofLatinAmerica (e.g.Argentina, Uruguay), but also theoccasionalcountrywithpredominantlypastoraleconomy,e.g.Mongolia.However,developmentsinthesecountriesarenotwhatcausedthestructuralchangeinthedietsofthedevelopingcountriestowardsmoremeat.Ifanything,they slowed it down as the per capita consumption inmanyofthemeitherremainedflatoractuallydeclined.TherealforcebehindthestructuralchangehasbeenrapidgrowthinconsumptionoflivestockproductsincountrieslikeChina19 (includingTaiwanProvinceand theHongKong SAR), Korea Rep., Malaysia, Chile, Brazil andseveral countries in theNearEast/NorthAfrica region.Indeed,asdiscussedinChapter3, theincreaseofmeatconsumption of the developing countries from 11 to 27kginthelastfourdecadeswasdecisivelyinfluencedby the rapid growth in China and Brazil. Excludingthemfromthetotals,theaverageoftheotherdevelopingcountries grew much less over the same period, from 11kgtoonly16kg20(Table2.7).Giventheuncertaintiessurrounding China’smeat statistics, it is perhaps a bitexaggeratedtospeakofa“meatrevolution”takingplaceinthedevelopingcountriesandtheworld.
Inthefuturewemaywitnessasignificantslowdownin thegrowthofdemandformeat,notwithstanding theprospectthatpercapitaconsumptioninthelattergroupofcountries(developingminusChinaandBrazil)couldgrow somewhat faster than in the past, rising from thepresent16kg to26by2030and to32kgby2050(Table 2.7). However the large weight in the world
19 The reliability of the meat sector data in China has been questioned (Ma et al., 2004). If the data actually overstate China’s meat production by a considerable margin, the country’s impact on the world meat economy and particularly the aggregates of the developing countries would have been more modest in the past, and could be more important in the future, than suggested here. 20 These data for meat consumption refer only to the traditional meats constituting the great bulk of aggregate consumption, i.e. bovine, ovine, pigmeat and poultry. Other meats (horse, camel, rabbit and game) are not included in the estimates given here. They add to the world average of 37.4 kg another0.8kg.However,theseothermeatsaresignificantfoodsourcesinanumberofcountries,e.g.theyadd24kgtothepercapitameat consumptioninMongolia,animportant5-10kginsomeAfricancountrieswhichsignificantlyincreasesthemeatconsumptionfromthemoretraditional animals. For sub-Saharan Africa, this other meat increases the regional average from the 9.5 kg shown in Table 2.8 to 11.1 kg. Several European countrieshavealsosignificantconsumption,e.g.ItalyandFrance(5-6kg),andanEU15averageof3.5kgaddedtothetraditionalaverageof88kg.

25
Table 2.7 Changes in the commodity composition of food by major country groups
kg / person / year 1969/71 1979/81 1989/91 1999/01 2030 2050
World
Cereals, food 148.7 160.1 171.0 165.4 165 162 Cereals, all uses 302.8 325.0 329.3 308.7 331 339Roots and tubers 83.7 73.4 64.5 69.4 75 75Sugar (raw sugar equiv.) 22.4 23.4 23.3 23.6 26 27Pulses, dry 7.6 6.5 6.2 5.9 6 6Vegetable oils, oilseeds and products (oil eq.) 6.8 8.3 10.3 12.0 16 17Meat (carcass weight) 26.1 29.5 33.0 37.4 47 52Milk and dairy, excl. butter (fresh milk eq.) 75.3 76.5 76.9 78.3 92 100Other food (kcal/person/day) 216 224 241 289 325 340Total food (kcal/person/day) 2411 2549 2704 2789 3040 3130
Developing countries
Cereals, food 146.3 161.7 173.7 165.7 166 163 Cereals, all uses 191.8 219.1 238.6 238.0 268 279Roots and tubers 78.8 69.6 60.1 67.0 75 77 (Developing minus China) 61.8 59.0 58.4 62.8 76 80Sugar (raw sugar eq.) 14.7 17.5 19.2 20.7 25 26Pulses, dry 9.2 7.8 7.3 6.7 7 7Vegetable oils, oilseeds and products (oil eq.) 4.9 6.5 8.6 10.4 14 16Meat (carcass weight) 10.7 13.7 18.2 26.7 38 44 (Developing minus China & Brazil) 10.7 12.5 13.6 15.9 26 32Milk and dairy, excl. butter (fresh milk eq.) 28.6 34.0 38.1 45.2 67 78Other food (kcal/person/day) 123 140 171 242 285 300Total food (kcal/person/day) 2111 2308 2520 2654 2960 3070
Industrial countries
Cereals, food 132.3 139.4 154.4 162.4 159 156 Cereals, all uses 531.1 542.0 543.7 591.8 641 665Roots and tubers 74.2 67.1 69.4 66.7 61 57Sugar (raw sugar eq.) 40.5 36.7 32.6 33.1 32 32Pulses, dry 3.4 2.8 3.2 3.6 4 4Vegetable oils, oilseeds and products (oil eq.) 13.2 15.7 18.5 21.5 24 24Meat (carcass weight) 69.7 78.5 84.3 90.2 99 103Milk and dairy, excl. butter (fresh milk eq.) 189.1 201.0 211.2 214.0 223 227Other food (kcal/person/day) 486 500 521 525 565 580Total food (kcal/person/day) 3046 3133 3292 3446 3520 3540
Transition countries
Cereals, food 200.5 189.2 179.1 168.7 164 158 Cereals, all uses 653.0 777.6 767.8 499.1 618 688Roots and tubers 140.2 118.4 97.1 103.3 99 94Sugar (raw sugar eq.) 41.9 45.9 43.4 36.5 39 41Pulses, dry 4.1 3.1 2.3 1.6 2 2Vegetable oils, oilseeds and products (oil eq.) 7.4 9.2 10.2 10.1 15 18Meat (carcass weight) 49.5 62.9 70.7 44.4 59 68Milk and dairy, excl. butter (fresh milk eq.) 185.7 181.3 177.2 160.2 179 193Other food (kcal/person/day) 331 372 333 317 365 390Total food (kcal/person/day) 3323 3389 3280 2900 3150 3270
Note: Cereals food consumption includes the grain equivalent of beer consumption and of corn sweeteners.
Prospects for food and nutrition

26
Table 2.8 Changes in the commodity composition of food, developing regions
1969/71 1979/81 1989/91 1999/01 2030 2050
sub-Saharan Africa
Cereals, food 115.3 114.3 118.8 123.3 142 155Roots and tubers 193.0 175.0 184.3 191.2 211 205 (sub-Sah. Afr. minus Nigeria and Ghana) 184.3 182.6 179.5 165.9 194 191Sugar (raw sugar eq.) 7.8 9.8 8.6 10.0 12 15Pulses, dry 11.0 9.7 8.9 9.8 12 14Vegetable oils, oilseeds and products (oil eq.) 8.0 8.4 8.5 8.9 12 13Meat (carcass weight) 10.2 10.5 9.8 9.5 14 18Milk and dairy, excl. butter (fresh milk eq.) 29.6 33.7 29.8 28.3 34 38Other food (kcal/person/day) 139 141 130 128 170 185Total food (kcal/person/day) 2100 2078 2106 2194 2600 2830
Near East / North Africa
Cereals, food 179.3 199.7 211.8 203.5 199 193Roots and tubers 16.6 26.5 31.8 33.7 33 33Sugar (raw sugar eq.) 20.4 28.0 28.2 27.7 29 30Pulses, dry 6.2 6.3 8.0 6.6 7 7Vegetable oils, oilseeds and products (oil eq.) 7.5 10.9 12.5 12.1 14 15Meat (carcass weight) 12.6 17.3 19.6 21.7 35 43Milk and dairy, excl. butter (fresh milk eq.) 68.1 84.1 75.0 73.2 90 101Other food (kcal/person/day) 224 277 298 333 370 385Total food (kcal/person/day) 2382 2834 3011 2974 3130 3190
Latin America and Caribbean
Cereals, food 118.7 130.1 130.1 132.6 140 139Roots and tubers 94.1 74.3 63.9 63.3 62 58Sugar (raw sugar eq.) 40.5 48.1 46.0 48.5 49 47Pulses, dry 14.2 12.6 10.5 11.2 11 10Vegetable oils, oilseeds and products (oil eq.) 6.8 10.1 12.1 11.8 15 16Meat (carcass weight) 33.5 40.5 42.8 58.5 79 90Milk and dairy, excl. butter (fresh milk eq.) 84.0 96.9 94.5 108.8 136 150Other food (kcal/person/day) 240 246 258 272 310 330Total food (kcal/person/day) 2465 2698 2689 2836 3120 3200
South Asia
Cereals, food 150.4 151.1 164.3 157.1 167 169Roots and tubers 16.9 19.9 18.7 23.5 31 36Sugar (raw sugar eq.) 20.3 20.6 23.7 25.6 30 32Pulses, dry 14.5 11.3 12.3 10.1 8 7Vegetable oils, oilseeds and products (oil eq.) 4.6 5.8 7.2 9.7 15 18Meat (carcass weight) 3.9 4.1 5.0 5.5 12 18Milk and dairy, excl. butter (fresh milk eq.) 37.0 41.6 55.1 67.6 106 129Other food (kcal/person/day) 84 89 104 141 180 200Total food (kcal/person/day) 2066 2084 2329 2392 2790 2980
East Asia
Cereals, food 152.2 181.4 199.5 186.7 176 162Roots and tubers 96.6 80.8 57.1 65.8 61 53Sugar (raw sugar eq.) 5.7 8.0 10.5 11.6 17 20Pulses, dry 4.8 4.3 2.6 2.0 2 2Vegetable oils, oilseeds and products (oil eq.) 3.5 4.7 7.8 10.6 15 17Meat (carcass weight) 9.2 13.2 22.6 39.8 62 73Milk and dairy, excl. butter (fresh milk eq.) 3.7 5.0 7.4 11.3 21 24Other food (kcal/person/day) 98 121 179 322 405 440Total food (kcal/person/day) 2012 2317 2625 2872 3190 3230
Note: Cereals food consumption includes the grain equivalent of consumption of beer and of corn sweeteners.

27
meattotalsofthedevelopedcountries,aswellassomemajordevelopingones(e.g.ChinaandBrazilandsomeothersmid-highincomecountrieswithmuchlessgrowthpotentialthantherestofthedevelopingcountriesgiventhe high or medium-high levels already achieved),together with the slower global population growth,means that aggregate world demand would grow atmuchlowerratesthaninthepast.Theprospectsareslimthatother largedevelopingcountriessuchasIndiawillemergeasmajormeatconsumers,duetoacontinuationoflowincomesandtheinfluenceofdietarypreferencesfavouringmeatlessthaninothersocieties.Thus,theboostgiveninthepasttoworldmeatconsumptionbythesurgeinChina(butseefootnote19)isunlikelytobereplicatedbyothercountrieswiththesameforceinthefuture.Themajorstructuralchangesthatcharacterizedthehistoricalevolution of theworld livestock economy, particularlyinthe1990s,arelikelytocontinue,thoughinsomewhatattenuated form. These changes are the growing roleof the poultry sector in totalmeat production, and thegrowingshareoftradeinworldoutputandconsumption(seeChapter3).
The other major commodity group with very highconsumptiongrowthinthedevelopingcountriesis thatof vegetable oils.The rapidgrowth inconsumption, incombinationwiththehighcaloriecontentofoilsandotheroilcrop products21, have been instrumental in bringingabout the increases in apparent food consumption(kcal/person/day) of the developing countries, thatcharacterized theprogress in food security achieved inthe past. Three decades ago, consumption of oilcropproducts(4.9kg/person/year,inoilequivalent)suppliedonly 136 kcal/person/day, or 6.5 percent of the totalavailabilityof2110caloriesofthedevelopingcountries.By1999/01consumptionpercapitahadgrownto10.4kgcontributing272kcaltototalfoodsupplies,or10percentofatotalwhichitselfhadrisento2650kcal.Inpractice,oneoutofeveryfourcaloriesaddedtotheconsumptionof the developing countries over this periodoriginatedin thisgroupofproducts (see furtherdiscussionof theoilcrops sector in Chapter 3). In the future, vegetableoils are likely to retain, and indeed strengthen, theirprimacyasmajorcontributorstofurtherincreasesinfoodconsumptionofthedevelopingcountries:38outofevery100additionalcaloriesmaycomefromtheseproductsintheperiodto2050.
Some important structural changesof thehistoricalperiod in the world oilcrops economy are likely tocontinue(seealsoChapter3).Theseare:n thegrowingshareoffouroilcropsinthetotaloilcrops
sector(oilpalm,soybeans,rape,sunflower);
n thecontinueddominanceofafewcountriesasmajorproducersandexporters;
n thegrowingroleofimportsinmeetingthefooddemandforvegetableoilsofmanydevelopingcountries.
n the growing role of soybeans as a source of highprotein feeds for the livestock sector and associatedgrowthintrade(seeChapter3);and
n the prospect that the biofuels sectormay open newavenuesforgrowthoftheoilcropssector(Chapter3).
Consumption ofpulses in the developing countriesstagnatedoverallandregistereddrasticdeclinesinseveralcountries,mainlyinAsiaandsub-SaharanAfrica.Thesetrendsreflectednotjustchangingconsumerpreferences,butalso,inseveralcountries,failuretopromoteproductionofthesecrops.Oftenthiswastheresultofpreferenceforincreasingproductionandself-sufficiencyincereals.AsEvenson(2004),referringmostlytoLatinAmerica,putsit“Becauseoflimitedgeneticimprovements,beanshaveeffectively been “crowded out” of productive areas bycropswithgreatergeneticimprovement,especiallycornandsoybeans”.Itisthoughtthatwherethesedeclinesinprotein-richpulseswere not accompaniedby increasesintheconsumptionoflivestockproducts,theresulthasbeenadeteriorationintheoverallqualityofdiets,evenwheredietaryenergy(kcal/person/day)increased(forthecaseofIndia,seeHopper,1999).Forthefuture,nomajorchangesareforeseeninpercapitaconsumptionofpulses,withtheaverageofthedevelopingcountriesremainingatabout7kg.
Roots, tubers and plantains:Thiscategoryofbasicfoods comprises a variety of products, the main onesbeingcassava,sweetpotatoes,potatoes,yams,taroandplantains22.Theyhavebeentraditionallythemainstayoffoodconsumptioninseveralcountrieswithlow-middlelevels of overall food consumption, mainly in sub-SaharanAfrica andLatinAmerica.Nineteencountries,allinsub-SaharanAfrica,dependontheseproductsforover20percentoffoodconsumptionintermsofcalories.These countries account for 60 percent of the region’s
21Thefiguresgivenhererefertotheconsumptionofoilsaswellasthatofoilcropsdirectly(soybeans,groundnuts,etc.)orintheformofderivedproducts other than oil, all measured in oil equivalent. This consumption of oilcrops in forms other than oil is particularly important in some countries. 22 Plantains are included along with the roots and tuber crops because “…Plantains and cooking bananas are grown and utilized as a starchy staple mainly in Africa…” (FAO, 1990).
Prospects for food and nutrition

28
population. In three of them, the dependence is over50 percent (Congo DR, Rwanda, Ghana). Most havelow overall per capita food consumption (13 of themhaveunder2200caloriesofwhichsixunder2000)and,consequently, high prevalence of undernourishment.Cereals,which in the developing countries as awholeprovide54percentoftotalfoodcalories,accountinthesecountriesformuchsmallerproportions,typically20-45percent, risingto justover50percentonly inTanzania(mostlymaize)andMadagascar(rice).Atthesametime,theregioncontainscountriesattheotherextremeofthespectrumwith onlyminimal consumptionof roots andtubers,e.g.Mali,Mauritania,Niger,Sudan,etc.
TheFoodBalanceSheetsdatashowthatinseveralofthecountrieswithhighdietarydependenceonrootsandtubers,whathappenstotheproductionofthesecropsisanimportantdeterminantofchangesinthenationalaveragefoodconsumption.AsinthecaseofNigeriamentionedearlier, other countries (Ghana, Benin, Malawi, Peru)also experienced significant increases in per capitafoodconsumptionwhichoriginatedtoa largeextent inthe increases of roots and tubers production. Despitethesecountryexamples, theevolutionover timeshowsdecliningpercapitafoodconsumptionofstarchyfoodsforthedevelopingcountriesandtheworldasawholeuptoaboutthelate1980s,followedbysomerecoveryinthe1990s(Table2.7).Thesedevelopmentswereduetotwomainfactors:n the rapid decline in food consumption of sweet
potatoesinChina(fromapeakofsome100kgthreedecadesagotothesome40kgatpresent),theparallelriseinthatofpotatoes,inbothChina(from14kgto36kg)andtherestofthedevelopingcountries(from9kgto16kg),and
n therapidriseoffoodconsumptionofalltheseproductsinafewcountries,e.g.Nigeria,Ghana,Malawi,etc,with Nigeria having a major weight in shaping theaggregateforsub-SaharanAfrica(Table2.8).
These trends are expected to continue, as will thehighdependenceofseveralcountriesonrootsandtubersasamajorsourceoffood.Percapitafoodconsumptionofallroots,tubersandplantainsindevelopingcountriesshouldincreaseslowly-fromthepresent67kgto75kgin2030andto77kgin2050(Table2.8).Muchof thedeclineinChina’spercapitafoodconsumptionofsweetpotatoeshasalreadyoccurredandinthefutureitwillnothavethedepressingeffectithadinthepastontotalrootsconsumptionofthedevelopingcountries.Potatoeswillcontinuetoshowrelativelyhighincomeelasticityinmost
developing countries, and average food consumptionisprojected to increase.Another factor thatcouldraiseconsumptionisthepotentialforproductivityincreasesintheotherrootcrops(cassava,yams).Itwillbepossiblefor more countries in sub-Saharan Africa to replicatetheexperiencesofcountrieslikeNigeria,Ghana,Benin,Malawi,and increase their foodconsumptionbasedonrapidproduction improvements in thesecrops (Nweke,2004;Babaleye,2005).
Sugar sharesmanyofthecharacteristicsofvegetableoils as regards food consumption and trade of thedeveloping countries: it is a fast-rising consumptionitemandamajorexportcommodityofseveralcountries(Brazil, Cuba, Thailand, etc.). In addition, severaldevelopingcountriesarebecominglargeandgrowingnetimporters(Egypt,Iran,KoreaRep.),makingupforthelackofgrowthof imports into the industrial countries.Thedevelopingcountries’averageconsumptionis21kg/personyear,butitishigher(26kg)ifChinaisexcluded- China has only 7 kg as it uses a lot of saccharine.About one half of the developing countries consumelessthan20kg,andaquarterunder10kg.Thescopeforconsumptiongrowthisstillconsiderableandtheaverageof the developing countries should keep increasing.China’scontributiontototalgrowthshouldbemorethanin thepastsince thecountrycouldbediscouraging theuseofsaccharine(seealsoChapter3).
2.4 Concluding remarks
Somebriefconclusionsmaybedrawn,asfollows:n There will be significant progress in raising food
consumption levels and improving nutrition. Therewillbesignificantreductionsintherelativeprevalenceofundernourishment(percentofpopulationaffected),but these will not be translated into commensuratedeclines in the numbers undernourished because ofpopulationgrowth.Reductionintheabsolutenumbersofundernourishedislikelytobeaslowprocess.
n The number of undernourished in the developingcountries is not likely to be halved by 2015 fromthe823millionof1990/92(the3-yearaverageusedas the basis for defining the World Food Summittarget). However, the proportion of the populationundernourishedmaybehalvedby2015anddeclinefurtherintherestoftheprojectionperiod.
n Theprojectedslowprogressinreducingundernourish-ment will reflect the inadequate progress of manycountries towards rapid economic development and

29
poverty reduction. However, empirical evidencesuggests that in the countrieswith high dependenceonagriculture,assigningprioritytothedevelopmentof food production holds promise of overcomingthe constraint to better nutrition represented byunfavourableoveralleconomicgrowthprospects.Thisprospectunderliestheprojectionthatthecountrieswithlonghistoriesofstagnantfoodconsumptionlevelsandhighundernourishmentcouldmakesomeprogressinthefuture.Pooragriculturalresourcesmayrepresenta serious obstacle to such prospects, particularly incountrieswithhighdemographicgrowth.
n Despite this slow pace of progress in reducing theprevalenceofundernourishment,theprojectionsimplyaconsiderableoverallimprovement.Inthedevelopingcountries thenumbersofwell-fed(i.e.notclassifiedasundernourishedaccordingtothecriteriausedhere)couldincreasefrom3.9billionin1999/01(83percentoftheirpopulation)to5.2billionin2015(90percentofthepopulation),to6.2billion(93percent)in2030andto7.2billion(96percent)by2050.Thatwouldbenomeanachievement.
n Inconclusion, inmanycountries, includingsomeofthe more populous ones, the relative prevalence ofundernourishment (percent of the population) willdeclinesignificantly.Fewercountriesthanatpresentwill have high levels of undernourishment, none ofthem in the most populous class. The problem ofundernourishment will tend to become smaller interms of both absolute numbers affected and, evenmore, in relative terms, hence it will becomemoretractable through policy interventions, both nationalandinternational.
Prospects for food and nutrition
30
This Chapter deals with the trends and future outlookof world food and agriculture in terms of the maincommodity sectors.A brief introduction to the subjectis given first presenting trends and prospects for totalagriculture (the aggregates of all crops and livestockproducts).
3.1 Aggregate agriculture: historical trends and prospects
Thehistoricalevidencesuggests that thegrowthof theproductivepotentialofglobalagriculturehassofarbeenmore than sufficient to meet the growth of effectivedemand. This is what the long-term term decline inthe real price of food suggests (World Bank, 2000).In practice, world agriculture has been operating in ademand-constrainedenvironment.Thissituationhasco-existedwithhundredsofmillionsoftheworldpopulationnothavingenoughfoodtoeat.Thissituationofun-metdemand1co-existingwithactualorpotentialplentyisnot,ofcourse,specifictofoodandagriculture.Itisfoundinothersectorsaswell,suchashousing,sanitation,healthservices,etc.
Limitsonthedemandsideatthegloballevelreflectedthreemainfactors:(a)theslowdowninpopulationgrowthfrom the late sixties onwards (see Chapter 2); (b) thefact thatagrowingshareofworldpopulationhasbeenattainingfairlyhighlevelsofpercapitafoodconsumption,beyondwhich the scope for further increases is ratherlimited (Table2.2),and (c) the fact that thosewhodidnothaveenoughtoeatweretoopoortoaffordmorefoodandcauseittobeproduced,ordidnothavetheresourcesandothermeanstoproduceitthemselves.
The first two factors will continue to operate alsoin the future. Their influence will be expressed aslower growth rates than in the past of demand and, atthe global level, also of production. The third factorwillalsocontinue toplaya role,given that theoveralleconomicoutlookindicatesthatpovertywillcontinuetobewidespreadinthefuture(Table2.6).Itfollowsthatforarathersignificantpartofworldpopulationthepotentialdemandforfoodwillnotbeexpressedfullyaseffective demand.Thus,thepasttrendsofdeceleratinggrowthofdemandwilllikelycontinueandperhapsintensify.
However, on the production side, there is noassurance that the past experience, when the world’sproductionpotentialevolvedandprovedtobemorethan
Prospects for agriculture and major commodity groups
3CHAPTER
1 The terms “demand” and “consumption” are used interchangeably. Both terms comprise all forms of use, i.e. food, feed, seed and industrial use as well as losses and waste. Demand for as well as supply from stocks, are disregarded in the projections. Given the long time horizon of the study, projections ofstockchangeswouldnotaddmuchtothemainquantificationswhileunnecessarilycomplicatingtheanalysis.

31
sufficienttomeetthegrowthofdemand,willcontinue,evenwhendemandgrowthwillbemuchlower thaninthepast.Thenaturalresourcesperheadofthegrowingpopulation (e.g. land and water resources per person)will certainly continue todecline and theyieldgrowthpotential ismore limited thanin thepast. It remains tobeseenwhethertheadvancesintechnologyandrelatedfactors (e.g. investment, education, institutions andimproved farmmanagement) thatunderpinned thepastgrowthofproductionwill continue tomore thanmakeupforthedecliningresourcesperperson.Thefuturemaybedifferentifwearenownearercriticalthresholds,e.g.yieldceilingsimposedbyplantphysiology,oravailabilityof water resources for maintaining and/or expandingirrigation. On the positive side, there are those whothinkthatbiotechnologyhasthepotentialofhelpingtoovercomeconstraints to further increases inproduction(Lipton,1999;Evenson,2002).
Wepresent in thissectionabriefoverviewofwhatwecanexpectintermsofincreasesofaggregatedemandfor,andproductionof,agriculturalproducts.Thefigureswe use refer to the aggregate volume of demand andproduction of the crop and livestock sectors.They areobtainedbymultiplyingphysicalquantitiesofdemandorproductiontimespriceforeachcommodityandsummingupover all commodities (eachcommodity isvaluedatthesameaverageinternationalprice2inallcountriesinallyears).Theresultingtimeseriesisanindexofvolume
changesovertimeofaggregatedemandandproduction,when the latter are aggregated as indicated above (seeBox3.1formorediscussiononwhatthesegrowthratessignify).Themovementsinthisaggregateindicatorarerarely sufficient for us to analyze and understand theforcesthatshapetheevolutionofagriculturalvariablesintheirdifferentdimensions.Thecommoditiesincluded(see list in the Appendix) are very diverse from thestandpointofwhatdeterminestheirproduction,demandandtrade.Forthisreason,thesubsequentsectionsofthisChapter analyze and present the historical experienceandprospectsofworldagricultureintermsofthemaincommoditysectors.Sections3.2-3.6dealwiththebasicfoodcommodities:cereals,livestockproducts,oilcrops,thegrouproots,tubersandplantains,andsugar.
TheoverallpicturefortotalagricultureispresentedinTable3.1.Attheworldlevel,thegrowthofdemandforallcropandlivestockproductsisprojectedtobelowerthaninthepast,1.5percentp.a.intheperiod1999/01-2030and0.9percentfor2030-50comparedwithratesinthearea2.1-2.3percentp.a. in thepreceding fourdecades.Thedifferenceisinpartduetothelowerpopulationgrowthofthefuturecomparedwiththepast.Thiscanbeseenwhenthegrowth is expressed in termsofdemandper capita(middlesectionofTable3.1).Itismainlytheslowdowninthegrowthofdemandinthedevelopingcountries,andinparticular inChina, that accounts for a largepartoftheglobaldeceleration.Whythisshouldbesoisshown
Prospects for agriculture and major commodity groups
Box 3.1 Measuring change in agricultural aggregates
When speaking of growth rates of aggregate agricultural production or consumption, it matters what units are used in the measurement of change, in particular whether quantities of the different commodities are just aggregated in physical units (e.g. tonnes – which can be done for commodity groups like cereals but not for summing up heterogeneous products such cereals, meat, oranges, pumpkins, coffee, cotton, etc.) or aggregated in terms of value after multiplying each of them by their respective prices (which makes it possible to aggregate them). With shifts in the commodity structure of production and consumption away from staples and towards higher value commodities, the price-based index of the volume of production or consumption grows faster than the aggregate in physical units (e.g. tonnes) or the index obtained when the same quantities are aggregated using as weights their calorie content. For example, China’s production of cereals grew in 1991-01 at 0.7 percent p.a., that of meat at 7.3 percent. Both together in tonnage terms grew at 1.5 percent, but they grew at 3.7 percent when aggregated on the basis of their prices – given that the price of meat is six times that of cereals in the price weights we use. Therefore, we should be aware that statements like “food production growth exceeded that of population” do not necessarily imply that the quantities available for consumption increased but that the aggregate value of production per capita increased. Similar considerations apply when food consumption quantities are aggregated using their calorie contents as weights. For example, China’s food consumption per capita measured by the price-based volume index increased 64 percent in the 1990s but by only 11 percent in terms of calories. Analogous, though less pronounced, developments have characterized food consumption changes in other countries, Brazil among them. In contrast, in countries with little (e.g. India) or virtually no (e.g. sub-Saharan Africa) diet diversification, the volume of consumption has grown at roughly the same rates in both measures.
2 International dollar prices, averages for 1989/91.

32
inthemoredetailedregionalnumbersofTable3.1.TheyshowthatthedecelerationofthegrowthofdemandpercapitainthedevelopingcountriesoutsideChinaisonlyslight(from0.8-0.9percentp.a.inthepastto0.7percentp.a.inthethreedecadesto2030),anexpectedoutcomegiven the operation of the factors mentioned earlier. A better idea about the roles of the above-mentionedfactors making for deceleration, in particular theslowdown as higher consumption levels are attained,canbehadfromthedataandprojectionspresentedinthememoiteminTable3.1. In it thedevelopingcountriesaregroupedintotwosets:thosethatstartin1999/01withfairlyhighpercapitafoodconsumption(over2700kcal/person/day) and, therefore, face less scope than beforeforincreasingconsumption,andalltherest,thatisthosewith1999/01kcalunder2700.
China carries a large weight in the former group,so its example can be used to illustrate why a drasticdecelerationisforeseenforthatgroupandthedevelopingcountriesasawhole.Chinahasalreadyattainedafairlyhigh level of per capita food consumptionof themaincommodities,atotalof2960kcal/person/dayin1999/01.In the projections, it increases further to 3300 kcal.This isnearly the levelof the industrial countries.Theincreaseof11percentin30yearscontrastswiththatof50percent in thepreceding30years.Thisexplains thedrasticslowdowninthegrowthratewhentheaggregatesaremeasuredin termsofcaloriecontent.However, the
trendforconsumptionstructuretochangetowardshighervalueproductswillcontinueandthiswillmakefortheprice-basedvolumeof consumption to grow faster (36percent)thanthe11percentwhenmeasuredincalories.This36percentinthenext30yearsisstillmuchlowerthanthe170percentincreaseofthepast30years,giventhatdietdiversificationtowardsthehigher-valueproductshasmuchlessscopecomparedwiththepastwhenChina’sfood consumption was heavily concentrated in cerealsand sweet potatoes and had little by way of livestockproducts.Inconclusion,whensuchdecelerationoccursinChinaandinafewotherlargedevelopingcountries,the whole aggregate of the developing countries, andindeedtheworld,willbeaffecteddownwards.
Incontrast, thegrowthofpercapitademand in theotherdevelopingcountries,thosewithunder2700kcal/person/dayin1999/01,isprojectednottodecelerateandactuallybehigherinthefuturecomparedwiththepast(Table3.1,memoitem).ThisgroupofcountriesincludesIndiawith itsonebillionpopulationoutof thegroup’s2.3billion.TheprospectthatIndiawillnotmovemuchtowardsmeatconsumption(seesection3.3)contributesto limit the growth rate of total demand for both foodand feed. In the past, the aggregate demand of thedevelopingcountrieswasgreatlyinfluencedbytherapidgrowth of apparent meat consumption in China (see,however,section3.3forpossibleoverestimationofmeatproductionandconsumptioninChina).Theprospectthat
1 6 9 1
Developing, All Brazil Developing excl. Brazil
30
) s e c i r p t n e r r u c ( n o i l l i b $ S U
3 0 0 2 3 6 9 1
7 6 9 1 9 6 9 1
1 7 9 1 3 7 9 1
5 7 9 1 7 7 9 1
9 7 9 1 1 8 9 1
3 8 9 1 5 8 9 1
7 8 9 1 9 8 9 1
1 9 9 1 3 9 9 1
5 9 9 1 7 9 9 1
9 9 9 1 1 0 0 2
5 6 9 1
20
10
0
-10
-20
-30
* all crop and livestock products, primary and processed, excl. fish and forestry products
5 0 0 2
Figure 3.1 Net agricultural trade balance: developing countries, 1961-2004

33
Table 3.1 Growth rates of demand and production, percent p.a.
1961 1971 1981 1991 1999/01 2030 -2001 -2001 -2001 -2001 -2030 -2050
Demand (all commodities - all uses), Total
World 2.3 2.2 2.1 2.2 1.5 0.9 Developing countries 3.6 3.7 3.7 3.8 2.0 1.1 idem, excl. China 3.2 3.2 3.0 2.8 2.2 1.3 sub-Saharan Africa 2.8 2.9 3.2 3.2 2.8 2.0 idem, excl. Nigeria 2.6 2.5 2.6 3.0 2.8 2.1 Near East/North Africa 3.8 3.6 2.7 2.7 2.2 1.4 Latin America and Caribbean 3.0 2.9 2.8 2.9 1.8 1.0 idem, excl. Brazil 2.6 2.4 2.2 2.8 1.9 1.0 South Asia 3.0 3.2 3.2 3.0 2.3 1.3 East Asia 4.3 4.6 4.7 4.9 1.7 0.6 idem, excl. China 3.6 3.4 3.1 2.4 1.9 1.1 Industrial countries 1.2 1.1 1.0 1.1 0.7 0.4 Transition countries 0.5 -0.7 -2.1 -2.9 0.5 0.1
Demand (all commodities - all uses), per capita
World 0.5 0.5 0.5 0.8 0.6 0.4 Developing countries 1.4 1.7 1.8 2.1 0.8 0.5 idem, excl. China 0.8 0.9 0.8 0.8 0.7 0.6 sub-Saharan Africa 0.0 0.1 0.4 0.6 0.7 0.5 idem, excl. Nigeria -0.2 -0.3 -0.2 0.4 0.7 0.6 Near East/North Africa 1.1 0.9 0.2 0.5 0.5 0.4 Latin America and Caribbean 0.8 0.9 1.0 1.2 0.8 0.6 idem, excl. Brazil 0.4 0.4 0.4 1.0 0.7 0.6 South Asia 0.7 1.0 1.1 1.1 1.0 0.7 East Asia 2.5 3.0 3.3 3.7 1.1 0.6 idem, excl. China 1.5 1.5 1.3 0.9 0.9 0.8 Industrial countries 0.4 0.4 0.3 0.4 0.3 0.4 Transition countries -0.2 -1.2 -2.4 -2.8 0.7 0.6 Memo items Developing countries with over 0.5 0.6 0.6 0.8 0.9 0.7 2700 kcal/person/day in 1999/01 idem, excl. China 2.1 2.4 2.6 2.9 0.9 0.6Developing countries with under 1.2 1.3 1.2 1.0 0.7 0.6 2700 kcal/person/day in 1999/01
Production (all food and non-food commodities)
World 2.3 2.2 2.1 2.3 1.5 0.9 Developing countries 3.4 3.6 3.7 3.8 1.9 1.1 idem, excl. China 2.9 3.0 2.9 2.8 2.2 1.4 sub-Saharan Africa 2.3 2.5 3.1 3.0 2.7 1.9 idem, excl. Nigeria 2.1 2.1 2.3 2.8 2.7 2.1 Near East/North Africa 3.0 3.0 2.8 2.4 2.2 1.4 Latin America and Caribbean 2.9 2.9 2.8 3.2 2.2 1.2 idem, excl. Brazil 2.4 2.3 2.2 2.9 2.1 1.2 South Asia 2.9 3.2 3.2 2.8 2.1 1.3 East Asia 4.2 4.5 4.6 4.8 1.6 0.6 idem, excl. China 3.3 3.2 2.8 2.4 1.9 1.2 Industrial countries 1.5 1.2 1.1 1.4 0.6 0.3 Transition countries 0.3 -0.8 -2.1 -3.1 0.5 0.2
Prospects for agriculture and major commodity groups

34
thisinfluenceofChinawillbemuchweakerinthefutureandthatitwillnotbereplacedbyasimilarboominotherlarge countries, is oneof themajor factorsmaking fortheprojecteddecelerationintheaggregatedemandofthedevelopingcountries.
At theworld level,productionequalsconsumption,sotheprecedingdiscussionaboutglobaldemandgrowthprospects applies also to that of global production. For the individual countries and country groups,however, the twogrowthratescandifferdependingonmovements in their net agricultural trade positions. Ingeneral,thegrowthratesofproductioninthedevelopingregionshavebeenalittlebelowthoseofdemand,astheiragriculturalimportshavebeengrowingfasterthantheirexports, leading to gradual erosion of their traditionalsurplusinagriculturaltrade(cropandlivestockproducts,primaryandprocessed,notincludingfisheryandforestryproducts).Thetrendhasbeenforthissurplustodiminishandtoturnintoanetdeficitinmostyearsinthe1990s.In the last fifteen years, the net balance reached apeakofUS$16billionsurplus in1986and troughsof US$12billiondeficitsin2000and2001,beforerecoveryin the subsequent years to 2004. The recent recoveryreflected above all the extraordinary performanceof Brazil’s exports (mainly oilseeds and livestock products) which generated a net agricultural surplusof US$ 23.6 billion in 2004, up from an average of
US$ 9.2 billion in the late 1990s. Excluding Brazil,the net balance of the other developing countries as awhole continued to precipitate fromnearly zero in thelate1980s to reachadeficitofUS$27billion in2004 (Figure 3.1). This prospect had been foreshadowed inourearlierprojections to2010frombaseyear1988/90(Alexandratos,1995,p.121).
Behindthesetrendsinthevalueofthenettradebalanceof agriculture have beenmovements in both quantitiesandpricesofthetradedcommoditiesandthepoliciesthatinfluencedthem.Severalfactors,oftenwidelydifferingamongcommodities,playedaroleinthesedevelopments.ThecommoditystructureofthenettradebalancesofthedevelopingcountriesotherthanBrazilisshowninFigure3.2.Growingnetimportsofcerealandlivestockproductshave been the dominant elements shaping this deficit,whileimportsofoilcropsandproductsbyseveralmajordeveloping countries (China, India, Mexico, Pakistan)have also assumed growing importance in shaping thegrowing deficit of agriculture notwithstanding rapidlyrisingnetexportsoftheseproductsfromotherdevelopingcountries, e.g. Malaysia, Brazil, Argentina, Indonesia(seeTable3.11).Ontheotherside,netexportsof fruitand vegetables are virtually the only significant itemwhich has shown consistent improvements. For sugar,thetraditionallargetradesurplus(invalueterms)ofthedevelopingcountriesasawholediminishedquicklyafter
4 8 9 1
40
5 8 9 1 7 8 9 1
8 8 9 1 9 8 9 1
0 9 9 1 1 9 9 1
2 9 9 1 3 9 9 1
4 9 9 1 5 9 9 1
6 9 9 1 7 9 9 1
8 9 9 1 9 9 9 1
0 0 0 2 1 0 0 2
2 0 0 2 3 0 0 2
6 8 9 1
10
-10
0
-20
-30
-50
30
20
-40
-60
All Crop/Livestock Products, Primary/processed
Other Crop/livestock products
Livestock (Meat,Dairy, Eggs, An. Fats, Live Animals)
Cereals and Preparations
Sugar
Fruit and Vegetables (fresh, processed, excl. bananas, cassava,pulses)
Bananas
Natural Rubber
Cocoa, Coffee, Tea, Spices
Oilcrop Products(Oilseeds,Oils, Cakes/meals)
4 0 0 2
US$
bill
ion
(cu
rren
t p
rice
s)
Figure 3.2 Developing countries excluding Brazil, net trade balances by major commodity groups, 1984-2004

35
theearly1990sdespitea surge inexports fromBrazil,asseveraldevelopingcountriesbecamemajorimporters(Table3.13,Figure3.11).Theshrinkagealsoreflectstheeffectsoftheheavydomesticsupportandtradeprotectionin major sugar importing countries like the USA andJapan, or in formerly net importing countries, like theEuropean Union (EU) which became a significant netexporterasaresultofthesepolicies.Thetraditionalnetsurplusofthedevelopingcountriesintropicalbeverageshasbeenfluctuatingwidelyandonbalanceonapathofslowdecline.Thishas reflectedbothveryslowgrowthof consumption in themain importing and consumingcountries (the industrial ones) and declines in prices,evenincurrentdollars–muchmoreinconstantdollars.The net result has been that the developing countrieshavebeenexportingmoreandmorequantitiesbuttheirnetreceiptsfromsuchsaleshavefallen.Thisisvividlyillustrated by the case of coffee (Figure 3.3) wherecatastrophicprice falls characterized the earlyyearsofthecurrentdecade.
The evolution of the overall net agricultural tradebalanceofthedevelopingcountriesasawholedoesnotby itself denote overall improvement or deteriorationfromadevelopmentalstandpoint.Theaggregateof thedevelopingcountriesisacompositeofwidelydifferingcountryandcommoditysituations.Forsomecountries,adecliningagriculturaltradebalance(oragrowingdeficit)
is an indicator of progress towards improved welfare.This is thecaseofcountries likeKorea,Rep. inwhichthe growing agricultural deficit has gone hand in handwithhighratesofoveralldevelopmentandgrowingfoodconsumption.Thedecliningoverallbalancealsoreflectsthe rapid growth in such things as China’s growingimportsofvegetableoils(apositivedevelopmentoverallas they contribute to improve food consumption andare paid for by growing industrial export earnings); orcottonimportsintoseveraldevelopingcountries,whichsustain their growing exports of textiles. In this lattercase,however,thecottonexportingdevelopingcountriesare not benefitingmuch as a growingmarket share ofexportshasbeensuppliedbysubsidizedexportsfromtheUSA.Needless to say, a declining agricultural balanceisanegativedevelopmentaloutcomeincountrieswhichstilldependheavilyonexportearningsfromagricultureand/orhavetodivertscarceforeignexchangeresourcestopayforgrowingfoodimports(eventuallybuildingupunsustainableforeigndebt).Itisanevenmorenegativeindicator from the standpoint of human welfare whensuch food imports are not associated with rising foodconsumptionpercapitaandimprovedfoodsecurity,butare necessary just to sustain minimum levels of foodconsumption-anotuncommonoccurrence.
The projections indicate a continuing deepeningof the net trade deficit of the developing countries in
US$
bill
ion
(cur
rent
pri
ces)
and
mill
ion
t onn
es
2004
Value ($billion)
1980
19
81
1982
19
83
1984
19
85
1986
19
87
1988
19
89
1990
19
91
1992
19
93
1994
19
95
1996
19
97
1998
19
99
2000
20
01
2002
20
03
14
12
10
8
6
4
2
0
Quantity (million tonnes)
Figure 3.3 Developing countries, net exports of coffee
Prospects for agriculture and major commodity groups

36
volume terms.This is because their net imports of themain commodities in which they are deficit, mainlycereals and dairy products, will continue to rise fairlyrapidly.Inparallel, theirnet tradesurplusintraditionalexports (e.g. tropical beverages, bananas) will likelyriselessrapidly.TheparticularsrelatingtofuturetradeoutcomesforthemaincommoditygroupsarediscussedinthefollowingsectionsofthisChapter.Thepotentialofsomedevelopingcountries tobegrowingnetexportersof products competing with those from the industrialcountries (meat, but also palmoil, soybeans and sugar)in an increasingly liberal trading environment mayeventually attenuate the broader trend for developingcountries as awhole tobecomegrowingnet importersof food and agricultural products. Such effects maybe further strengthened by the support to the prices ofcommoditieslikesugarandvegetableoilsiftheiruseasfeedstocksfortheproductionofbiofuelsweretobecomemorewidespreadfollowingrisingpetroleumprices3.
Concerning production, at global level sufficientproduction potential can be developed formeeting theexpected increases in effective demand in the courseofthenextfivedecades.Asnoted, therequiredgrowthrateofglobalproductionwillbelowerthaninthepast.Naturally, even thisgrowthmaynotmaterializeunlesswemake ithappen.This requirescontinued support toagricultural research and policies and other conditions(education,credit,infrastructure,etc.)tomakeitprofitableandpossibleforfarmerstoexpandproductioncapacity.Thatthereisscopeforincreasingglobalproductionisnottosay thatallpeoplewillbe food-secure in the future.Far from it, as Chapter 2 has shown. The interactionbetween food security and food production potentialis verymuch a local problem in poor and agriculture-dependent societies. Many situations exist whereproductionpotentialislimited(e.g.inthesemi-aridareasgivenexistingandaccessibletechnology,infrastructure,etc.)andagoodpartofthepopulationdependsonsuchpoor agricultural resources for food and more generallivelihood.Unlesslocalagricultureisdevelopedand/orother income earning opportunities open up, the foodinsecuritydeterminedbylimitedlocalproductionpotentialwillpersist,eveninthemiddleofpotentialplentyattheworldlevel.Theneedtodeveloplocalagricultureinsuchsituations as the condition sine qua non for improvedfood security cannot be overemphasized. InChapter 2
(Box2.3),wesignaled thepossibility that someof themoreagriculturallydisadvantagedlow-incomecountrieswith high population growth may find it extremelydifficult toadvancebyasmuchasrequiredto improvefoodsecuritytoacceptablelevels.
3.2 Cereals
Inourpreviouswork(Bruinsma,2003)wehighlightedthe historical experience showing that the growth rateofglobaldemandforcereals(foralluses,hencealsoofworldproduction)hasbeeninlong-termdecline.Table3.2(column9)showstheprogressivefallinthegrowthratesinthelast40,30,20and10yearsendingin2001.ThesetrendsareseenmoreclearlyinFigure3.4usingdatauptothemostrecentyear2005(provisional).Ourearlierprojections to 2030 concluded that such decelerationwouldcontinue,butthattheabsoluteincreasesinworldconsumption in prospect still represented a significantquantumjumpofsome965milliontonnes(52percent)overthebaseyearlevelof1997/99,leadingtototalworldconsumptionof2830milliontonnesby2030.
There are a number of factors suggesting thatthe deceleration may be even more pronounced thanvisualizedonly4yearsagoandtheabsoluteincrementswilllikelybesmaller.Theyarethefollowing:n Datarevisionsshowingthatworldconsumptioninour
oldbaseyear1997/99waslowerthanweknewthen–by25milliontonnes;
n Projectedworldpopulationin2030inthemostrecentdemographicprojectionsusedhereis lowerthantheoneusedthen,8130millionvs.8270million;and
n Developments in recent years suggest that somestructural changes may have occurred making forlowergrowthinproductionandconsumptionofcerealsinanumberofmajorconsumingcountries,foremostamongthemChinaandtolesserextentIndia,whichtogetheraccountfor28percentofworldconsumptionandfor48percentofthatofthedevelopingcountries.In China total cereals consumption peaked at 385mtin1996andhadfallento314milliontonnesby 2003 according to FAO’s FBS data. In India,it grew by only 16 million tonnes over the sameperiod,i.e.9.1percentwhenpopulationhadincreased
3 On the correlation between sugar prices and those of petroleum via the ethanol link see “Brazil’s sugar industry gears up for a new world fuel”, Financial Times, 8 March 2006. An OECD study concludes that projections suggest “that biodiesel production, in particular, has the potential to boost world vegetable oil prices to levels that have not been observed during the past two decades” (OECD, 2006: 28).

37
12.3 percent. For the world as a whole, cerealsproduction remained practically flat at around 1.9 billion tonnes for the period 1996-2003. Theserecent developments, if taken into account, as theyshould to the extent that they are relevant for thefuture, represent another major factor making forlowerworldproduction/consumptioninthefuture.
The resulting lower projection of world cerealsconsumptionfor2030is2680milliontonnes,agrowthrate of1.2percentp.a.measuredfromtheaverageof1999/01.This is higher than that of the 1990s (0.9 percent),whenpercapitaconsumption(alluses)fellby20kgor 6percent(seeTable3.2,Col.2),principallybecausethelastdecadewas theperiodof thedrasticdecline in thetransitioncountriesfollowingthesystemicreforms.The2030figureforthedevelopingcountriesis1800milliontonnes,whichissome120milliontonneslowerthaninour earlier projections.The reduction reflects the threefactorsmentionedabove.Fortherestofthedevelopingcountries(i.e.excludingChinaandIndia,andinpercapitaterms),projected2030consumptionof268kgisactuallyslightlyhigherthanthatofourearlierprojections.
Looking beyond 2030, the growth rate of worldconsumption andproduction is expected to fall furtherin the subsequent 20 years to 0.6 percent p.a. and the
aggregateconsumptionwouldrisetojustover3billiontonnesby2050.Thus,annualworldproductionmustrisebysome800milliontonnesinthe30yearsto2030(notmuchabove thesome770million tonnes it rose in thepreceding30years1969/71 -1999/01) andbyanother330milliontonnesinthesubsequenttwodecades.Fromthestandpointofmountingpressuresonlandandwaterresources,thesenumbersimplyamuchmoremanageableoutcome than previously thought. The slowdown inthe growth of world consumption is, however, a verymixed blessing. On the positive side we must countthe influence of the lower population growth and thegradual approaching of saturation levels in per capitafoodconsumptioninagrowingnumberofcountries.Onthenegative side is theprospect that therewill stillbecountrieswithpersistent lowoverall foodconsumptionlevels whose population would consume more if theyhadaccesstomorefood.
Individual cereal commodities and categories of use
For rice, the characteristic feature of the historicalevolutionisthatpercapitaconsumption(foralluses,butoverwhelminglyforfood,thoughinsomecountriesriceisalsousedasanimalfeed)hastendedtoleveloffinthelast
Prospects for agriculture and major commodity groups
10-, 20-, 30-, and 40-Yr P eriods ending in y ear sh o wn in this Axis (1961-71, 1962-72, ...1995-05)
2005
19
71 19
72 19
73
1975
19
77 19
78 19
79
1981
19
82
1984
19
85
1987
19
88
1990
19
92 19
93
1995
19
96 19
97 19
98
2000
20
01 20
02 20
03
4
3.5
3
2.5
2
1.5
1
0
Production 1971-200530-yr GRR
0.5
2500
2000
1500
1000
500
0
10-yr GRR 40-yr GRR 20-yr GRR
1974
19
76
1986
19
94
1999
19
89
1991
19
83
1980
20
04
Gr o
wth
Rat
es o
f pro
duct
ion:
% p
.a.
Production (million tonnes)
Figure 3.4 World cereals production: growth rates in successive 10-, 20-, 30-, and 40-year periods

38
Box 3.2 Uncertainties concerning China’s cereals consumption and stocks
Data revisions and the lower projected population growth account for the bulk of the difference between the current projections of cereals consumption in the developing countries and those of the earlier study. In addition lower projections for China also contribute to the difference. China’s production of cereals (aggregate of wheat, maize, barley and milled rice – minor cereals are not included in order to make the data comparable with those of FAPRI) peaked in 1998 and 1999 at 380 million tonnes. Thereafter, it fell more or less continuously in the next five years reaching 312 million tonnes in 2003, before rebounding to around 345 million tonnes in 2004 and a provisional estimate of 352 million tonnes in 2005. Notwithstanding these declines in production, domestic prices did not rise until about mid-2003 and China remained a net cereals exporter (maize, rice) up to 2003 (it became a small net importer of 5 million tonnes in 2004). By mid-2003, however, the production shortfalls in combination with rising grain prices in world markets made an impact on the domestic demand-supply balance and led to rapidly increasing grain prices. The production rebound in 2004 is attributed to the response of farmers to these price rises as well as to good weather.
The important thing is to know what happened to consumption of food and feed and whether any significant departures from past patterns are indicative of more fundamental structural changes likely to persist in the future and affect the projections. FAO’s Food Balance Sheets data (which are used in this study) suggest that total domestic use of these cereals also fell continuously from a peak of 372 million tonnes in 1996 to 306 million tonnes in 2003 (the last year for which such FBS data are available as of March 2006). These trends are shown in Figure 3.5. However, others consider that total domestic use did not decline but that the shortfall was made up by drawing down China’s huge stocks. According to the data used by FAPRI (2005), stocks were reduced from a huge 325 million tonnes in 1999 to 106 million tonnes in 2004 (Figure 3.5). A review of the subject undertaken by FAO highlights the uncertainties concerning both stocks and consumption trends and concludes that “stocks in China must have fallen substantially in recent years” (FAO, 2004c).
The fact that livestock production growth (which depends increasingly on cereals feed) continued unabated in this period (meat production increased 51 percent) would seem to suggest that the second view could be nearer the truth. However, there are two counterarguments: (a) over the same period apparent consumption of protein feeds (mainly soybean meal) seems to have grown very rapidly judging from the increase in soybeans availability from 15 million tonnes to 36 million tonnes, with all of the increase coming from imports. This suggests substitution of oilmeals for cereals in the feed rations; and (b) we should not take for granted the livestock production statistics, as it is widely held that they overstate the growth of livestock production (see Ma et al, 2004). In short, the reliability of livestock data is as doubtful as that of changes in cereals consumption, if not more. Such limitations make them a poor guide for resolving the uncertainties as to what happened to the feed consumption of cereals. And, of course, the greater part of the decline in cereals use in the FBS data originated in food (35 million tonnes), not in feed (20 million tonnes). This lends some degree of plausibility to the decline in cereals consumption (see Box 2.1).
Figure 3.5 China: production, stocks and two views on consumption; aggregate of wheat, maize, rice and barley
2004
Mill
ion
tonn
es
450
400
350
300
250
200
150
100
50
0
390
370
359
330
310
290
270
250
1994
1995
1996
1997
1998
1999
2000
2005
2004
2003
2004
1994
1995
1996
1997
1998
1999
2000
2005
2004
2003
Source: FAPRI data from FAPRI (2005); Others: FAO STAT
Ending Stocks - FAPRI (right axis)Total Consumption (FAO - FBS)
ProductionTotal Consumption (FAPRI)
Prod.-Exports+Imports
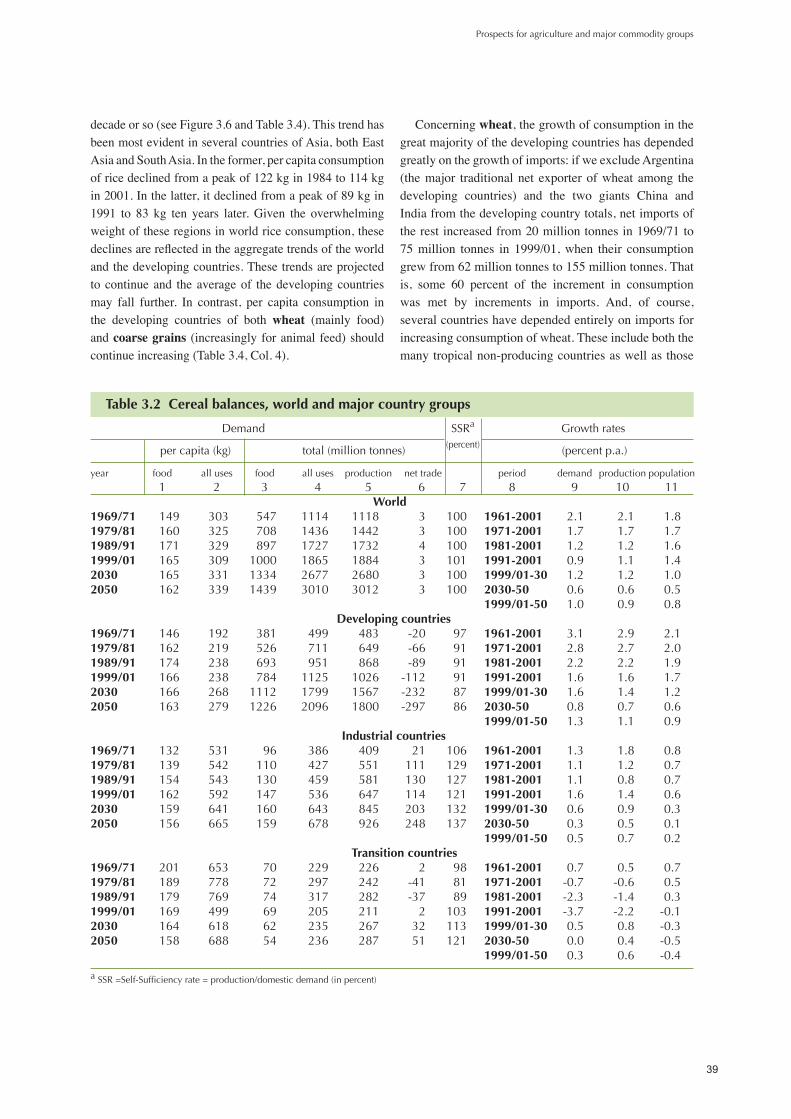
39
decadeorso(seeFigure3.6andTable3.4).ThistrendhasbeenmostevidentinseveralcountriesofAsia,bothEastAsiaandSouthAsia.Intheformer,percapitaconsumptionofricedeclinedfromapeakof122kgin1984to114kgin2001.Inthelatter,itdeclinedfromapeakof89kgin1991 to 83 kg ten years later.Given the overwhelmingweightoftheseregionsinworldriceconsumption,thesedeclinesarereflectedintheaggregatetrendsoftheworldandthedevelopingcountries.Thesetrendsareprojectedto continueand the averageof thedevelopingcountriesmay fall further. In contrast, per capita consumption inthe developing countries of both wheat (mainly food)andcoarse grains (increasinglyforanimal feed)shouldcontinueincreasing(Table3.4,Col.4).
Concerningwheat,thegrowthofconsumptioninthegreatmajorityofthedevelopingcountrieshasdependedgreatlyonthegrowthofimports:ifweexcludeArgentina(themajor traditionalnet exporterofwheat among thedeveloping countries) and the two giants China andIndiafromthedevelopingcountrytotals,netimportsoftherestincreasedfrom20milliontonnesin1969/71to75million tonnes in 1999/01,when their consumptiongrewfrom62milliontonnesto155milliontonnes.Thatis, some 60 percent of the increment in consumptionwas met by increments in imports. And, of course,severalcountrieshavedependedentirelyonimportsforincreasingconsumptionofwheat.Theseincludeboththemanytropicalnon-producingcountriesaswellasthose
Prospects for agriculture and major commodity groups
Table 3.2 Cereal balances, world and major country groups
Demand SSRa Growth rates
per capita (kg) total (million tonnes) (percent) (percent p.a.)
year food all uses food all uses production net trade period demand production population 1 2 3 4 5 6 7 8 9 10 11 World1969/71 149 303 547 1114 1118 3 100 1961-2001 2.1 2.1 1.81979/81 160 325 708 1436 1442 3 100 1971-2001 1.7 1.7 1.71989/91 171 329 897 1727 1732 4 100 1981-2001 1.2 1.2 1.61999/01 165 309 1000 1865 1884 3 101 1991-2001 0.9 1.1 1.42030 165 331 1334 2677 2680 3 100 1999/01-30 1.2 1.2 1.02050 162 339 1439 3010 3012 3 100 2030-50 0.6 0.6 0.5 1999/01-50 1.0 0.9 0.8 Developing countries1969/71 146 192 381 499 483 -20 97 1961-2001 3.1 2.9 2.11979/81 162 219 526 711 649 -66 91 1971-2001 2.8 2.7 2.01989/91 174 238 693 951 868 -89 91 1981-2001 2.2 2.2 1.91999/01 166 238 784 1125 1026 -112 91 1991-2001 1.6 1.6 1.72030 166 268 1112 1799 1567 -232 87 1999/01-30 1.6 1.4 1.22050 163 279 1226 2096 1800 -297 86 2030-50 0.8 0.7 0.6 1999/01-50 1.3 1.1 0.9 Industrial countries1969/71 132 531 96 386 409 21 106 1961-2001 1.3 1.8 0.81979/81 139 542 110 427 551 111 129 1971-2001 1.1 1.2 0.71989/91 154 543 130 459 581 130 127 1981-2001 1.1 0.8 0.71999/01 162 592 147 536 647 114 121 1991-2001 1.6 1.4 0.62030 159 641 160 643 845 203 132 1999/01-30 0.6 0.9 0.32050 156 665 159 678 926 248 137 2030-50 0.3 0.5 0.1 1999/01-50 0.5 0.7 0.2 Transition countries1969/71 201 653 70 229 226 2 98 1961-2001 0.7 0.5 0.71979/81 189 778 72 297 242 -41 81 1971-2001 -0.7 -0.6 0.51989/91 179 769 74 317 282 -37 89 1981-2001 -2.3 -1.4 0.31999/01 169 499 69 205 211 2 103 1991-2001 -3.7 -2.2 -0.12030 164 618 62 235 267 32 113 1999/01-30 0.5 0.8 -0.32050 158 688 54 236 287 51 121 2030-50 0.0 0.4 -0.5 1999/01-50 0.3 0.6 -0.4
a SSR =Self-Sufficiency rate = production/domestic demand (in percent)

40
Table 3.3 Cereal balances, developing regions
Demand SSRa Growth rates
per capita (kg) total (million tonnes) (percent) (percent p.a.)
year food all uses food all uses production net trade period demand production population 1 2 3 4 5 6 7 8 9 10 11
Sub-Saharan Africa1969/71 115 144 30 38 37 -3 98 1961-2001 2.9 2.4 2.81979/81 114 137 40 48 41 -8 85 1971-2001 3.2 2.7 2.91989/91 119 145 55 67 58 -8 86 1981-2001 3.3 3.0 2.81999/01 123 149 75 90 72 -16 80 1991-2001 2.9 2.3 2.62030 142 169 161 192 153 -39 81 1999/01-30 2.5 2.5 2.12050 155 186 234 280 220 -60 79 2030-50 1.9 1.8 1.4 1999/01-50 2.3 2.3 1.8 Near East/North Africa1969/71 179 293 33 53 46 -7 86 1961-2001 3.3 2.3 2.71979/81 200 332 48 80 58 -24 73 1971-2001 3.2 2.2 2.61989/91 212 354 67 111 77 -39 69 1981-2001 2.3 2.0 2.51999/01 204 343 80 135 80 -54 59 1991-2001 2.1 -0.4 2.22030 199 387 128 249 142 -106 57 1999/01-30 2.1 1.9 1.72050 193 408 150 316 173 -142 55 2030-50 1.2 1.0 0.9 1999/01-50 1.7 1.6 1.4 South Asia1969/71 150 169 106 120 116 -5 97 1961-2001 2.6 2.9 2.21979/81 151 170 134 150 147 -2 98 1971-2001 2.6 2.8 2.21989/91 164 185 181 204 203 -3 99 1981-2001 2.4 2.6 2.11999/01 157 180 210 241 254 -1 105 1991-2001 1.7 2.5 1.92030 167 198 328 390 370 -20 96 1999/01-30 1.6 1.3 1.32050 169 208 372 459 428 -31 95 2030-50 0.8 0.7 0.6 1999/01-50 1.3 1.0 1.0 East Asia1969/71 152 192 178 225 219 -8 97 1961-2001 3.3 3.3 1.81979/81 181 239 258 340 316 -24 93 1971-2001 2.8 2.8 1.51989/91 200 273 333 455 433 -27 95 1981-2001 1.9 2.0 1.41999/01 187 271 350 509 487 -21 96 1991-2001 1.0 1.1 1.12030 176 318 396 718 656 -62 91 1999/01-30 1.2 1.0 0.62050 162 332 365 749 682 -68 90 2030-50 0.2 0.2 0.0 1999/01-50 0.8 0.7 0.4 Latin America and Caribbean1969/71 119 224 33 63 66 3 104 1961-2001 3.2 2.6 2.21979/81 130 262 46 94 87 -8 93 1971-2001 2.8 2.2 2.01989/91 130 257 57 112 97 -12 86 1981-2001 2.3 1.7 1.81999/01 133 291 68 150 133 -20 89 1991-2001 2.7 3.0 1.62030 140 357 99 252 246 -5 97 1999/01-30 1.7 2.1 1.12050 139 383 106 292 296 4 100 2030-50 0.7 0.9 0.4 1999/01-50 1.3 1.6 0.8a SSR = Self-Sufficiency rate = production/domestic demand (in percent)
facing increasingly binding land and water constraints to increasing production (e.g. Yemen).
Growth in per capita wheat consumption of the developing countries should resume, following the exhaustion of the “China effect” (see Box 3.2) which had led to falls in the average of the developing countries in the 1990s. The past pattern of dependence of the growth of consumption on growing imports would continue. Thus,
for the same group of developing countries mentioned above (developing excluding Argentina, China and India), some 50 percent of the increment in their projected consumption should be met by increases in imports. Overall, the net wheat imports of all the developing countries except Argentina could grow from the present 74 million tonnes to 150 million tonnes in 2030 and on to 190 million tonnes in 2050. These substantial increases

41
Prospects for agriculture and major commodity groups
Table 3.4 Wheat, rice and coarse grains: Demand and production
Demand Production Growth rates
per capita (kg) total (million tonnes) (percent p.a.)
year food all uses food all uses production period demand production population
Dev.ping Dev.ping World World excl. excl. World China Transition
1 2 3 4 5 6 7 8 9 10 11 12 13
Wheat1969/71 57 89 47 50 64 210 327 322 1961-2001 2.4 2.4 1.81979/81 65 99 63 59 74 289 438 438 1971-2001 2.0 1.9 1.71989/91 72 105 73 64 84 375 551 559 1981-2001 1.2 1.2 1.61999/01 69 96 70 65 85 419 578 588 1991-2001 0.7 0.9 1.42030 71 100 80 77 92 578 813 818 1999/01-30 1.1 1.1 1.02050 72 102 83 83 94 636 903 908 2030-50 0.5 0.5 0.5 1999/01-50 0.9 0.9 0.8 Rice (Milled)1969/71 49 55 72 67 61 182 203 207 1961-2001 2.5 2.5 1.81979/81 54 59 76 67 64 237 263 263 1971-2001 2.2 2.3 1.71989/91 58 65 82 72 70 306 341 345 1981-2001 1.8 1.9 1.61999/01 57 64 78 71 68 347 387 403 1991-2001 1.3 1.7 1.42030 55 62 72 67 64 441 503 505 1999/01-30 0.9 0.8 1.02050 51 59 67 64 61 449 522 524 2030-50 0.2 0.2 0.5 1999/01-50 0.6 0.5 0.8 Coarse grains1969/71 42 159 72 73 141 156 584 589 1961-2001 1.8 1.8 1.81979/81 41 166 80 78 143 182 735 742 1971-2001 1.3 1.2 1.71989/91 41 159 84 82 137 216 834 828 1981-2001 0.9 0.9 1.61999/01 39 149 90 85 142 234 901 894 1991-2001 0.8 0.9 1.42030 39 168 116 105 164 314 1360 1356 1999/01-30 1.4 1.4 1.02050 40 179 129 117 174 354 1584 1580 2030-50 0.8 0.8 0.5 1999/01-50 1.1 1.1 0.8 Total cereals1969/71 149 303 192 189 266 547 1114 1118 1961-2001 2.1 2.1 1.81979/81 160 325 219 204 282 708 1436 1442 1971-2001 1.7 1.7 1.71989/91 171 329 238 217 292 897 1727 1732 1981-2001 1.2 1.2 1.61999/01 165 309 238 221 295 1000 1865 1884 1991-2001 0.9 1.1 1.42030 165 331 268 249 321 1334 2677 2680 1999/01-30 1.2 1.2 1.02050 162 339 279 263 329 1439 3010 3012 2030-50 0.6 0.6 0.5 1999/01-50 1.0 0.9 0.8
intheimportrequirementsreflect,inter alia,theprospectthatChinaandIndiawillrevert tobeingmedium-sizednetimportersagainaftertherecenttrendswhichsawnetimportsdeclinedrasticallyandtheemergenceofIndiaasanetwheatexporter(seediscussionoftradebelow).
Consumption of coarse grains should continue togrow,mainlyfornon-fooduses(essentiallyanimalfeed,though use for the production of biofuelsmay assume
someimportancein thefuture)butalsoforfoodin themany countries of sub-Saharan Africa where coarsegrains(maize,millet,sorghum,butalsotefinEthiopia)are the mainstay of food cereals consumption. Thenext three decadeswill probably see a higher increasein the global totals than the preceding three decadeswhichwitnessed the drastic contraction of feed use inthe formerly centrally planned economies of Europe.

42
Figure 3.6 Per capita consumption (all uses) of individual cereals
Figure 3.7 Coarse grains: food and non-food use

43
Prospects for agriculture and major commodity groups
The relevantdataaredepicted inFigure3.7. It is seenthatthedevelopingcountrieswillincreasetheirshareinworldnon-foodconsumptionofcoarsegrainsandsurpass the rest of the world by 2030. They now account for 39percentoftheworldnon-fooduseofcoarsegrains,upfromonly17percentthreedecadesago.Thesharemayincreaseto52in2030andonto56percentin2050.
Imports and Exports
Thelowerprojecteddemandforcerealsinthedevelopingcountries discussed above will also influence theirimport demand which, although continuing to grow,it should lead to somewhat lowernet imports in 2030(230million tonnes rather than the265million tonneswe had earlier) and on to some300million tonnes in20504(Table3.2,dataandprojectionsfortheindividualdeveloping regions are in Table 3.3). This is a justoverdoublingofnet imports in thenext threedecadescompared with the 5.7-fold increase of the precedingthreedecades.However,thegrowthofnetimportshasbeen slowing down, and the just over doubling overthenextthreedecadesrepresentssomerecoveryinthegrowthofnet imports.ThisoutcomereflectsabovealltheprospectthatcountrieslikeIndiaandChina,whichinrecentyearsreducednetimportsandbecamemodestnet exporters, will eventually revert to net importerstatus(Figure3.8).
Producing the export surplus.Toexplorehowthesegrowingimportrequirementsofthedevelopingcountriesmaybematchedbyincreasesonthepartoftheexportersweneedsomerearrangementandmoredetailedsettingoutofthedataandprojections.ThisisattemptedinTable3.6.Thefollowingcommentsrefermainlytothecontentsofthistable.
Thenet importsof thedevelopingimporters(shownatthebottomofTable3.5andrepeatedinTable3.6)plusthoseof the traditional industrialcountrynet importers(essentially Japan, Israel, and the other industrialcountriesexcept theEU,NorthAmericaandAustralia)wentfrom47milliontonnesin1969/71to177milliontonnes in1999/01, an incrementof130million tonnesin three decades. It was met by increases of the nettrade balances of the following country groups whichwere traditional exporters or became such during that
period:theEU-1546milliontonnes(fromnetimportsof 21million tonnes tonet exportsof25million tonnes),NorthAmerica 50million tonnes,Australia 12milliontonnes, combined Argentina, Thailand and Viet Nam 20milliontonnes.
In the projections, the net import requirements ofthe developing importers and the industrial importersincreaseby155million tonnes to2030andbyanother84 million tonnes by 2050. These quantities must begeneratedasadditionalexportsurplusbytherestoftheworld.Wherewilltheycomefrom?Thenovelelementintheprojectionsisthatpartoftherequiredincreasemaycomefromthetransitioncountries,whiletherestshouldcome from the traditional exporters, developingones -mainlyArgentina,ThailandandVietnam–and,intimehonoured fashion, the lion’sshareof theadditionalnetexportswouldoriginateinthetraditionalindustrialgrainexportingcountries-NorthAmerica,Australiaand,butonadecliningpathasnetexporter,alsotheEU(EuropeanCommission,2005b).
Theprospective roleof the transition countries as anoveladditionalsourceofgrainexportstotherestoftheworldmustbeunderlinedinanydebateonthepotentialofworldagriculturetomeetthegrowingdemandofthedeveloping countries. These countries as a group hadbecomelargenetimportersfromaboutthemid-70suntilthe early 1990s,with their net imports having reached 43milliontonnesin1993.Followingthereformprocessthey emerged as net exporters in most years after themid-90s,reachingpeaknetexportsof31milliontonnesin 2002, following the extraordinary weather-inducedreduction of harvests inWestern Europe. The shift ofthe transition countries from largenet importers to netexporters and the prospect that they will be growingnet exporters in the future are clearly seen in Figure3.8.Theseprospectivedevelopments shouldhelp relaxoften expressed concerns that the traditional industrialexporters of cereals would find it difficult to increaseexport surpluses in pace with the growing importrequirements of the developing country importers. Inpractice,andgiventhelittlescopeforincreasesintheirdomestic consumption, the production of cereals in the traditional industrial exporterneedonly increaseatrates thatwillbe lower than in thepast (seeTable3.6,bottomrow).
4 It is noted that our projections made in the mid-eighties from base year 1982/84, when net imports of the developing countries were 72 mt, indicated that they could rise to 112 million by 2000 (Alexandratos, 1988, p. 106), which is precisely the actual outcome for 1999/01 (Table 3.5), no doubt a lucky coincidence.

44
Table 3.5 Wheat, rice and coarse grains: Net trade balances
1969/71 1979/81 1989/91 1991/2001 2030 2050
Developing Countries
All cereals -20 -66 -89 -112 -232 -297
Wheat -25 -49 -59 -63 -127 -163
Rice -1 -2 0 2 5 6
Coarse grains 6 -16 -30 -51 -110 -139
Industrial countries
All cereals 21 111 130 114 203 248
Wheat 24 66 76 66 110 132
Rice 2 3 2 1 -2 -3
Coarse grains -5 42 52 47 95 118
Transition countries
All cereals 2 -41 -37 2 32 51
Wheat 3 -16 -15 2 22 36
Rice -1 -1 -1 -1 -1 -1
Coarse grains 0 -25 -21 1 11 16
Memo item: : Developing countries minus developing net exporters*
All cereals -30 -85 -106 -144 -295 -380
Wheat -26 -51 -64 -72 -145 -188
Rice -1 -5 -6 -9 -16 -20
Coarse grains -3 -28 -36 -62 -134 -172
* Developing net exporters: those with net cereal exports over 1 million tonnes in 1999/01 (Argentina, Thailand and Viet Nam). India and China, although they met this criterion, are not included in the net exporter category as they are only occasional net exporters and may not be exporters in the future.
Table 3.6 World cereals trade: matching net balances of importers and exporters
Net imports (-) or exports (+) Increment (million tonnes)
1969/71 1999/01 2030 2050 1969/71-1999/01 1999/01-2030 2030-50
Importers -47 -177 -332 -416 130 155 84
Developing Importers1 -30 -144 -295 -380 113 152 84
Industrial Importers -17 -33 -36 -36 16 3 0
Exporters 50 180 334 418 130 154 84
Developing Exporters 11 31 63 83 21 32 20
Transition Countries 2 2 32 51 0 30 19
Industrial Exporters2 38 147 239 284 110 92 45
World imbalance 3 3 3 3
Memo item: million tonnes percent p.a.
Production of industrial exporters 386 624 820 900 1.3 0.9 0.5
1 All developing countries minus developing exporters (Argentina, Thailand, Viet Nam).2 North America, Australia, EU15

45
Prospects for agriculture and major commodity groups
sennot noilliM
500
400
300
200
100
0
-100
-200
-300
-400
-500
Net Exports
Net Imports
1969/71 1979/81 1989/91 1999/2001 2030 2050
IndustrialExporters
China+India
Transition
IndustrialImporters
Developing:Other
Developing:Exporters
Figure 3.8 Cereals: importers and exporters
3.3 Livestock commodities
Past and present
Livestock, a major factor in the growth of world agriculture.Theworldfoodeconomyisbeingincreasinglydriven by the shift of diets and food consumptionpatternstowardslivestockproducts.Someusetheterm“food revolution” to refer to these trends (Delgado et al., 1999). In the developing countries, where almostallworldpopulation increases takeplace, consumptionofmeathasbeengrowingatover5percentp.a.,thatofmilkanddairyproductsat3.5–4.0percentp.a. in thelastfewdecades.Aggregateagriculturaloutputisbeingaffected by these trends, not only through the growthof livestock production proper, but also through thelinkagesoflivestockproductiontothecropsectorwhichsuppliesthefeedingstuffs,mainlycerealsandoilseeds.In addition, the shift of aggregate agricultural outputtowards the higher-value livestock productsmakes thegrowthrateofagriculturetobehigherthanwouldresultfromamereaggregationoftonnesorcalorieequivalents(Box3.1).
On thenegativeside,and inassociationwithpolicydistortions or market failures, there are environmentalimplicationsassociatedwith theexpansionof livestockproduction.Forexample,throughtheexpansionofland
for livestock development, livestock sector growth hasbeenaprimeforceindeforestationinsomecountriessuchasBrazil,andinovergrazinginothercountries.Intensivelivestock operations on industrial scale, mostly in theindustrial countries but increasingly in the developingones, are a major source of environmental problemsthrough the production of point-source pollution(effluents, etc.). In parallel, growth in the ruminantsector contributes to greenhouse gas concentrations intheatmosphere throughmethaneemissionsandnitrousoxidefromthewasteofgrazinganimals.
Important exceptions and qualifications.Thestrengthof the livestock sector as the major driving force ofglobal agriculture can be easily exaggerated. Manydeveloping countries and regions, where the need toincrease protein consumption is the greatest, are notparticipating in the process. There are 26 developingcountries having under 10 kg per capita consumptionofmeatandanother30withbetween10and20kg(theindustrialcountrieshaveanaverageof90kg).Ofthese56countries23havecurrentlyconsumptionlevelslowerthan 10 years earlier. Therefore, the phenomenon ofrisingmeatconsumptionintheworldislesswidespreadthan first impressions from the aggregates would leadonetobelieve.Itisjustthatpercapitaconsumptionhasbeen growing rapidly in a number of large countries,China and Brazil among them, and this has pulled up

46
the average of the developing countries and theworld(seeTables2.7and2.8anddiscussioninChapter2).Asnoted (Box3.2),China’smeatproduction statistics arethoughttooverstatetherealgrowthofthesectorinthiscountry,hencealsooftheworld.Thus,thegrowthrateofworldmeatconsumptionof2.7percentp.a.inthe1990sishalvedifChinaisexcludedfromtheworldtotals.Thisisnottodenythatmeatandotherlivestockproductsarepreferredfoodsinmostcountriesandthatdemandgrowsrapidlywhenincomesincrease.Itisjustthatthereislessof a meat revolution than commonly asserted, mainlybecause of lack of development and income growthin many countries. In addition, cultural and religiousfactorshavealsostoodinthewayofwiderdiffusionofconsumptionofmeatingeneralinsomecountries(India)orofparticularmeats(beefinIndia,porkintheMuslimcountries).
Formilkanddairyproducts,therehasbeenno‘Chinaeffect’ on the world totals, given the small weight oftheseproducts inChina’s foodconsumption,nomatterthatitspercapitaconsumptiongrewrapidlyfromasmallbase and it doubled in the last decade to some 10 kg.There has, however, been a strong negative impact onthe growth of world consumption from the slump inthe transitioncountries in the1990swhichreducedthegrowth rate from 2.0 percent p.a. (world without thetransitioncountries)to1.0percent(worldtotal).
Rapid growth of the poultry sector. Perhaps theperception of revolutionary change in the meat sectorreflects the extraordinary performance of worldproduction and consumption of poultry meat. It hasbeen growing at more than 5 percent p.a. (Table 3.7)and its share inworldmeat production increased from15 percent three decades ago to 30 percent currently.Per capita consumption increased nearly three-foldoverthesameperiod.Thatofporkalsoincreasedfrom 9.7kgto14.7kg(China’sstatisticshelping,buthardlyatallfortheworldwithoutChina).Incontrast,percapitaconsumption of ruminantmeat (from cattle, sheep andgoats) actually declined a little.Thegrowth of poultrymeatconsumptionreflectedinpartsubstitutionforothermeats, essentially beef, in the countries with alreadymedium-high levels of total meat consumption, e.g.severalmajor producers andoften exporters of beef inLatinAmerica,NorthAmerica,OceaniaandtheEU.Forother countries, it was part of themore general thrusttowards rapidly growing consumption of meat, e.g.severalcountriesintheregionsEastAsiaandNearEast/NorthAfrica.Significantincreasesinbeefconsumption
wererare.TheyoccurredinKoreaRep.,Japan,Malaysia,Kuwait,SaudiArabia,Mexico,TaiwanProvinceofChina,(allofthemsomehowlinkedtoincreasedbeefimports,oftentheresultofmoreliberaltradepolicies),andChina.Brazilisanexampleoffastgrowthinallaspectsofthemeateconomy,withsignificantincreasesinproduction,consumptionandexportsofbeef,poultryandpork.
Buoyancy of meat trade in recent years.The rapidgrowthinconsumptionofseveralcountrieswassupportedby even faster growth in trade. Some drastic changesoccurred in the sources of exports and destination ofimports. For example, Japan increasedper capitameatconsumptionfrom29kgin1979/81to43kgin1999/01,anincreaseof2.1milliontonnes.All this increasewasmetbyimports(whichgrewmorethan5-foldover theperiod),whileproductionremainedessentiallyconstant.At the global level, trade (world exports, includingthe meat equivalent of live animal exports) increasedfrom 9.2 percent of world consumption in 1979/81 to 12.8 percent in 1999/01, with poultry increasing from7 percent to 14 percent, beef from 12.5 percent to 16percentandporkfrom6.5to10percent.ThemajoractorsonthesideoftheimportersincludeJapanwhichtopsthelist,followedbytheRussianFederation,Mexico,HongKong(ChinaSAR),SaudiArabiaandtheRep.ofKorea.Ontheexportside,thecombinedexportsofbeefandmuttonofAustralia andNewZealandput thematthetopofworldmeatexportersuntil2001,whenBrazilbecametheworld’slargestexporter.Brazil’sskyrocketingexportsledtothedevelopingcountriesasawholeturningintonetexportersofmeatin2004forthefirsttimesincethelate1970s.Theothermajordevelopmentofthe1990shas been the turn around of the USA from a sizeablenetimporterofmeattoasizeablenetexporter,aresultreflectingitsdecliningnet importsofbeefandpigmeatand skyrocketing exports of poultry meat. In a sense,thoughthepoliciesaredifferent,theUSAisreplicatingtheearlierexperienceoftheEU,whichturnedfromabignetimporterofmeatuptothelate1970stoalargeand,until1999,growingnetexporter.
Figure 3.9 shows the net trade balances of meatby major country groups. On the importer side thelion’s share is accounted for by Japan (net imports of 2750 thousand tonnes in 1999/01), while an equalamountisaccountedforbyafewdevelopingcountries(major developing importers in the figure, i.e. thosewithover100thousandtonnesnet imports in1999/01:Mexico,HongKong,KoreaRep.,Philippines,Taiwan,Malaysia, and Cuba), followed by the region Near

47
Prospects for agriculture and major commodity groups
Table 3.7 Meat: aggregate production and demand
Production Consumption
1999/ 1961/ 1971 1981 1991 1999/01 2030 1999/ 1961 1971 1981 1991 1999/01 2030 2001 2001 -2001 -2001 -2001 -2030 -2050 2001 -2001 -2001 -2001 -2001 -2030 -2050
Thousand Growth rates, percent p.a. Thousand Growth rates, percent p.a. tonnes tonnes
World
Bovine 59378 1.7 1.3 1.1 0.7 1.3 0.9 58549 1.7 1.3 1.1 0.7 1.4 0.9
Ovine 11337 1.7 2.0 2.1 1.6 1.7 1.2 11187 1.7 2.0 2.1 1.6 1.7 1.2
Pigmeat 90666 3.3 3.1 2.9 2.5 1.2 0.4 90818 3.3 3.1 2.9 2.6 1.2 0.4
Poultrymeat 68331 5.4 5.2 5.2 5.3 2.5 1.5 67447 5.3 5.1 5.1 5.1 2.6 1.5
Total meat 229713 3.0 2.9 2.9 2.7 1.7 1.0 228000 3.0 2.9 2.8 2.7 1.7 1.0
World excl Transition 213026 3.4 3.5 3.7 3.6 1.8 1.0 209574 3.3 3.4 3.6 3.6 1.9 1.0
Developing countries
Bovine 29364 2.9 3.2 3.4 3.5 2.2 1.4 29239 3.2 3.5 3.6 3.6 2.2 1.3
Ovine 7865 3.0 3.5 3.8 3.7 2.1 1.4 8102 3.2 3.6 3.7 3.6 2.2 1.4
Pigmeat 52646 6.0 6.1 5.8 4.5 1.7 0.6 53053 6.0 6.1 5.9 4.7 1.7 0.6
-excl. China 12133 4.0 4.0 3.7 2.0 2.4 1.5 12777 3.9 4.0 3.8 2.4 2.3 1.4
Poultrymeat 35591 7.6 8.0 8.4 8.2 3.4 1.8 36053 7.6 7.9 8.2 8.2 3.4 1.8
Total meat 125466 4.9 5.3 5.6 5.1 2.4 1.3 126447 5.1 5.5 5.6 5.3 2.4 1.3
-excl. China 65168 3.7 3.9 3.9 3.5 2.8 1.8 66857 3.9 4.1 3.9 3.6 2.8 1.8
-excl.China and Brazil 49805 3.3 3.5 3.3 3.0 3.0 2.0 53314 3.7 3.8 3.4 3.3 3.0 1.9
Developing Countries: Total meat by region
sub-Saharan Africa 5564 2.4 2.3 2.1 2.4 3.3 2.8 5742 2.7 2.6 2.2 2.4 3.3 2.8
NearEast/North Africa 7382 4.1 4.4 4.0 4.3 3.3 2.1 8582 4.6 4.4 2.9 3.7 3.3 2.0
Lat. Amer. and Caribb. 31608 3.6 3.8 4.0 4.1 2.2 1.1 30657 3.8 4.0 4.2 4.1 2.0 1.1
-excl. Brazil 16244 2.6 2.6 2.4 3.1 2.4 1.4 17114 3.0 3.1 3.0 3.8 2.3 1.3
South Asia 7662 3.4 3.8 3.9 2.7 3.9 2.5 7419 3.3 3.7 3.7 2.5 4.0 2.5
East Asia 73251 6.7 7.1 7.4 6.3 2.1 0.9 74734 6.8 7.2 7.5 6.5 2.1 0.9
-excl. China 12953 4.7 5.0 4.6 2.6 2.9 1.7 14459 4.9 5.0 4.8 3.3 2.8 1.6
Memo Items
World livestock production (meat, milk, eggs)1 2.3 2.2 2.1 2.1 1.6 0.9
World cereals feed demand (million tonnes) 666 2.0 1.2 0.6 0.8 1.6 0.8
1 Growth rates of aggregate production derived by valuing all products at 1989/91 international prices (see Box 3.1)
East/NorthAfrica, the transition countries and the restofthedevelopingcountries,excl.themajordevelopingexporters (Brazil, Argentina, Uruguay, Thailand andIndia).Ontheexporterside,thepictureisdominatedbytheindustrialcountriesexcludingJapan(6milliontonnesnetexports in2004).However, asnoted, theexporting
developingcountrieshavebeenplayingagrowingroleinworldexports,particularlyBrazilwhosenetmeatexportsincreased to 4.6 million tonnes in 2004, an eight-foldincreaseintheperiod1997-2004.
Milk and dairy products.Thegrowthofworldmilkproductionandconsumption5hasbeenlessbuoyantthan
5 In our data system all dairy products (e.g. cheese, milk powder, etc, but excluding butter which is part of the animal fats in the food balance sheets) areconvertedintoliquidmilkequivalent.Perhapstheseconversionsofdataforsomanyfinalproductsarepartlyresponsibleforthelargestatistical discrepancy in the world trade data.

48
sennot dnasuohT
0
-5000
-10000
-15000
-200001969/71 1979/81 1989/91 1999/2001 2030 2050
N.East/N.Africa
Other Developing
Transition Countries
Major DevelopingImporters
Major DevelopingExporters
Japan
5000
10000
15000
20000
*Country groups defined in text
Industrial Countries-excl.Jap.
Net Exports
Net Imports
Figure 3.9 Meat: net trade, major importer/exporter country groups*
thatofmeat.Inpractice,theworldpercapitaconsumptioniscurrentlynotmuchabovethatof10or20yearsago.This is explained in large part by the decline in thetransitioncountries.Suchdeclinesaffectedmuchmoretheworldmilksector than thatofmeat,because thesecountries at the inception of the declines had amuchlarger weight in world milk output (27 percent) thanin thatofmeat (17percent).Thegrowthrateofworldconsumptioninthe1990swasonly1percentp.a.,butitwas2.1percentp.a.fortheworldwithoutthetransitioncountries. The developing countries continue to havepercapitaconsumptionwellbelowthatoftheindustrialcountries(partlyreflectingtheconsumptionhabitsofEastAsiaaswellaslowincomesandpovertyinmanyothercountries),buttheyaregraduallyreducingthedistance,although not all countries/regions are participating inthese increases (Tables 2.7 and 2.8). Consumption inSouthAsia grew the fastest and accounts for a good partofthegainsinthedevelopingcountries(Table3.8).Per capita consumption declined in both sub-SaharanAfrica and the Near East/North Africa regions fromthe early 1980s onwards. This development is partlyassociated with the levelling off in the eighties andsubsequent reduction of subsidized exports from theEU.Thenear stationarynet importsof thedevelopingcountrieslargelyparallelthepatternofnetexportsfromtheEU(Figure3.10)
The livestock sector in the future
Slower growth in world meat consumption.The forcesthat shaped the rapid growth of meat demand in thepastareexpectedtoweakenconsiderablyinthefuture.Slowerpopulationgrowthcomparedwiththepastisanimportant factor.Perhapsmore important is thenaturaldecelerationofgrowthbecausefairlyhighconsumptionlevels have already been attained in the few majorcountries that dominated past increases. As noted,Chinawentfrom13kg20yearsagoto48kgcurrently,according to its statistics. If itwere to continue at thesamerate,itwouldsoonsurpasstheindustrialcountriesin per capita consumption of meat, an unreasonableprospectgiventhatChinawillstillbeamiddleincomecountrywithsignificantpartsofitspopulationruralandin the low-incomecategoryforsometimetocome.Asanotherexampleandforsimilarreasons,Brazil’scurrentaverage meat consumption of 79 kg suggests that thescopeisratherlimitedfortherapidincreasesofthepasttocontinueunabatedthroughthecomingdecades.
Thenextquestioniswhetheranynewmajordevelopingcountries with presently low meat consumption willemergeasmajorgrowthpolesintheworldmeateconomy.India with its huge population and very low meatconsumption could in theory dominate developmentsifitshiftedmassivelytoconsumingmeat.Itisrecalled

49
Prospects for agriculture and major commodity groups
thatIndiaisexpectedtorivalChinainpopulationsizeby2030(both1.42billion)andsurpassitbyagoodmarginby2050(1.53billionvs.1.37billion).ItisalsorecalledthatSouthAsia’sprojectedgrowthrateofGDPpercapita(overwhelminglyreflectingthatforIndia)is,inthelatestWorldBank assessment, a respectable 4.5 percent p.a.for2000-2006and4.2percentp.a.afterthatuntil2015(WorldBank,2006:Table1.2).India’smeatconsumptionisverylow-currently4.9kgpercapita:ithasgrownbyonly0.6kginthe1990s,allofitinpoultrymeat,whenitspercapitahouseholdconsumptionexpendituregrew3.0percentp.a.(seeBox2.1).
Can India play the role China has had so far inraising world meat demand? The recent high growthratesofproduction(10percentp.a.inthe1990s)andpercapita consumption of poultrymeat in India are likelyto continue unabated in the coming decades. That is,India’sparticipationintheglobalupsurgeofthepoultrysector,beingatitsincipientstage,hasstillalongwaytogo6.Consumptionofothermeatswillprobablygrowbymuchless,withbeefandporkbeingsubjecttoculturalconstraints for significant parts of the population ofIndia and indeed thewhole of SouthAsia. In parallel,
consumption of the preferred mutton/goat meat facesproduction constraints, implying rising real relativeprices compared with poultry meat (Landes et al.,2004).Overall,theforceofthegrowthofpoultrymeatconsumptionhasthepotentialofraisingIndia’saverageconsumption of all meat to more than double presentlevels by 2030 and more by 2050. Notwithstandingthepossibility that thiskindofgrowthwillperhapsbeviewedasrevolutionaryinanationalcontext,Indiawouldstill be for several decades apredominantlyvegetariansociety by international standards7. Such increases inIndia’slivestocksectorwillbefarfromhavinganimpactonworldaveragesandthoseofthedevelopingcountriesanywherenear thatwhichwasexerted in thehistoricalperiodbydevelopmentsinChina.
Inconclusion,thepercapitameatconsumptioninthedeveloping countries is likely to grow atmuch slowerratesthaninthepast,mainlybecausethegreatpushgiventoconsumptiongrowthinthepastbyChinaandBrazilwillnotbeplayingthesameroleinthefuture.Theresultisthattheaggregatemeatconsumptionofthedevelopingmaygrowinthenextthirtyyearshalfasrapidlyasintheprecedingthreedecades(Table3.7).However,percapita
1961
EU15 Net Exports Developing Countries Net Imports
25000
Thou
sand
tonn
es (l
iqui
d m
ilk e
quiv
alen
t)
15000
5000
-5000
0
10000
20000
2001
1999
1997
1995
1993
1991
1989
1987
1985
1983
1981
1979
1977
1975
1973
1971
1969
1967
1965
1963
Figure 3.10 Dairy net trade: developing countries and EU15
6 “Information from industry sources suggests that production and consumption of poultry meat in India has grown by as much as 15 percent annually sincethemid-1990s,farfasterthanindicatedbyofficialdata.….PoultrywilllikelygrowinimportancetotheIndiandiet”(Landeset al., 2004).7 “Fortunately, ours is largely a vegetarian society and thus dependence on meat as a source of protein is much less compared to other nations includingChina.Hence,comparatively,ourfood-feedcompetitionwillalwaysbemoderate”(Paroda,2001).

50
Table 3.8 Milk and dairy products
1999/ 1961 1971 1981 1991 1999/01 2030 2001 -2001 -2001 -2001 -2001 -2030 -2050
‘000 tonnes Growth rates, percent p.a.
Production
World 577494 1.4 1.2 0.8 1.1 1.4 0.9 Developing 231385 3.4 3.6 3.7 4.0 2.5 1.4 sub-Saharan Africa 16722 2.6 2.6 2.2 2.7 2.6 2.1 Near East/North Africa 29278 2.2 2.3 2.4 2.8 2.3 1.5 Latin America and Caribbean 58203 2.8 2.6 2.9 3.4 1.9 1.0 South Asia 109533 4.0 4.6 4.6 4.8 2.8 1.5 East Asia 17652 5.9 6.9 6.4 5.2 3.0 0.6 Industrial countries 250681 0.8 0.7 0.3 0.8 0.5 0.2 Transition countries 95426 0.3 -0.7 -2.1 -3.3 0.1 -0.2World excl. transition countries 482118 1.7 1.8 1.7 2.2 1.7 0.9
Consumption
World 572025 1.4 1.2 0.8 1.0 1.4 0.9 Developing 251097 3.4 3.5 3.4 3.7 2.5 1.3 sub-Saharan Africa 18593 2.7 2.4 1.5 2.4 2.6 2.0 Near East/North Africa 34692 2.7 2.5 1.6 2.3 2.3 1.5 Latin America and Caribbean 63025 2.9 2.6 2.7 2.9 1.8 0.9 South Asia 110246 3.9 4.5 4.5 4.8 2.8 1.5 East Asia 24546 5.4 5.9 5.5 4.7 2.7 0.7 Industrial countries 228583 0.6 0.6 0.3 0.5 0.4 0.2 Transition countries 92342 0.2 -0.9 -2.3 -3.4 0.1 -0.2World excl. transition countries 479789 1.7 1.9 1.7 2.1 1.7 1.0
Net Trade (thousand tonnes)
1969/71 1979/81 1989/91 1999/01 2030 2050
World (Stat. discrepancy) 2388 1625 -1163 4652 4084 4050 Developing -7379 -17647 -18028 -19716 -32700 -38750 sub-Saharan Africa -927 -2541 -1836 -1882 -3760 -4300 Near East/North Africa -1215 -5193 -5958 -5446 -10200 -13600 Latin America and Caribbean -2456 -5131 -5140 -4780 -4620 -2160 South Asia -603 -1044 -874 -713 -2240 -4630 East Asia -2177 -3739 -4221 -6894 -11900 -14100 Industrial countries 9659 18545 15031 21288 33800 39800 Transition countries 109 729 1837 3083 3000 3050
consumption in the rest of the developing countriesshouldcontinuerisingandevenaccelerate,asshowninTable2.7.
Percapitameatconsumptioninthe transition countries has already started recovering from its precipitous fallin the 1990s (having fallen from 71 kg in 1989/91 to 44kgin1999/01).Itmayeventuallyrevertby2050tothehighlevelsithadachievedbeforethesystemicreformsofthe1990s(Table2.7).Intheindustrial countries,percapitaconsumptionofmeatisfairlyhighat90kg.Afewcountrieswith high fish consumption (Japan,Norway)havemuchlower,thoughrising,levels.Inprinciple,the
achievement of near-saturation levels of overall foodconsumption,aswellasconcernsabouthealth,suggestthat there is little scope for further increases. Yet thedata indicate that such increases do takeplace even incountrieswhichhavepassedthe100-kgmark,probablyreflectingamixofoverconsumptionandgrowingpost-retailwaste or feeding of pets. For example, theUSAincreasedconsumptionbysome10kg(to121kg)inthelast ten years and the latest FAPRI projections foreseeanincrease(allofitinpoultrymeat)of7percentfromthe average of 1999/01 to 2014, (FAPRI, 2005). Thelatest USDA baseline projections to 2015 provide a

51
largelysimilaroutlook(slightdeclineinbeefandpork,increaseinpoultry-USDA,2006:Table21).Thelatestprojections of the EU foresee a 6-kg increase in the 10 newmember states (to 82 kg by 2012), while percapitaconsumptionshouldremainstableat90kginthe EU-158. (European Commission, 2005b, Table A13).These trends have to be taken into account, even ifnutritional and health considerations would suggestotherwise. As shown in Table 2.7, our projection ofpercapitameatconsumption in the industrialcountriesgrows10percentinthethreedecadesto2030andanother 4percentinthesubsequenttwodecadesto2050.
Inconclusion, theprojectedslowdownintheworldmeat economy is based on the following assumptions:(a) relatively modest further increases in per capitaconsumptionintheindustrialcountries,(b)growthratesinpercapitaconsumptioninChinaandBrazilwellbelowthoseofthepast,(c)persistenceofrelativelylowlevelsofpercapitaconsumptioninIndia,and(d)persistenceoflowincomesandpovertyinmanydevelopingcountries.If these assumptions are accepted, the projectedslowdownfollowsinevitably.Naturally,aslowergrowthrate applied to a large base year world consumption(228milliontonnesin1999/01)willstillproducelargeabsolute increases (some 465 million tonnes must beproducedannuallyby2050,thegreatbulkofwhichinthedevelopingcountries).Thesequantitativeincreaseswillaccentuateenvironmentalandotherproblemsassociatedwithsuchlargelivestocksectors.
No slowdown in the consumption of dairy products. Giventhestilllowconsumptionlevelsinthedevelopingcountries,thepotentialforgrowthisthere.Fewdevelopingcountries have per capita consumption exceeding 150kg (Argentina,Uruguay, somepastoral countries inthe Sudano-Sahelian zone ofAfrica). Among the mostpopulous countries, only Pakistan has such a level. InSouthAsia,wheremilkanddairyproductsarepreferredfoods,Indiahasonly64kgandBangladesh14kg.EastAsiahasonly11kg.Inthislatterregion,however,foodconsumption preferences do not favour milk and dairyproducts, but the potential for growth is still therewithgrowingurbanization.Theregion’spercapitaconsumptionhasbeenrisingfastandshouldcontinuetodoso(Table2.8). Overall, therefore, there is considerable scope forfurthergrowthinconsumptionofmilkanddairyproducts.Intheprojections,thegrowthrateofworldconsumptionishigherthanintherecentpastdespitethelowerpopulation
growth (Table 3.8), an outcome reflecting above all thereversalofdeclinesinthetransitioncountries.
Meat trade expansion will likely continue, but more of the imports may be supplied by the developing exporters: Despitetheprojectedslowdowninmeatdemandgrowth,some of the forces that made for the above discussedbuoyancyinworldmeattradeintherecentpastarelikelytocontinuetooperate.Thenettradepositionsareshownin Figure 3.9. Overall, the trend for the developingcountries to become growing net importers of meat(1680 thousand tonnes in 1999/01, comparedwith netexportsof1100thousandtonnesthreedecadesago)maynotcontinue,mainlybecausethegroupofthedevelopingnetexporterslistedearlier,foremostamongthemBrazil,havethepotentialtocontinueincreasingexports.
Tradeindairyproductswillalsolikelyrecover,withthe net imports of the developing countries resuminggrowth after a period of stagnation from the mid-80sonwards (Table 3.8). This would reflect continuationof the growth of imports of EastAsia, as well as theresumption of import growth into the major deficitregion, theNearEast/NorthAfrica, following recoveryinthegrowthofdemand.
Livestock Production and the Use of Cereals for Animal Feed.We referred earlier to the importance ofthe livestock sector in creating demand for grains andoilseeds. Estimates put the total feed use of cereals at666million tonnes,or35percentofworld total cerealuse. Feed demand for cereals is often considered asthe dynamic element that conditions the growth of thecerealssector.However,inthelasttwodecadesorsoithas not been dynamic at all. Feed use of cereals grew 2.4percentp.a.inthe1970s(whenlivestockproductionwas growing at 2.5 percent), but then the growth rate fell to 0.9 percent in the subsequent two decades whileworld livestockproductionkeptgrowingat over2.0percentp.a.
Itappears, therefore, that theworldhasbeengettingontheaveragemoremeat,milkandeggsperkgofcerealsusedasfeed,aprima faciecaseofproductivitygainsinlivestockproduction.Nodoubt,therehavebeensuchgainsreflectinginparttheabovementionedgrowingshareofthepoultry sector in totalmeatproduction (poultry requiresmuch smaller quantities of cereals feed per kg ofmeatthanbeef).However,otherforceshavealsobeenatworkleadingtothereducedgrain/meatratios.Principalamongthemistherelativeshiftofworldlivestockproductionout
8 Tonotethatinthecountryclassificationusedhere9outthe10newmemberstatesarestillincludedinthegroupofthetransitioncountries,not in the group industrial countries, because of lack of historical data for a number of them.
Prospects for agriculture and major commodity groups

52
9 For the derivation of the growth rates of the entire oilcrops sector, the different crops are added together with weights equal to their oil content. This is what the expression ‘oil equivalent’, used here, means.
of the regions that use grain-intensive feeding systemsto the developing countries that have lower grain/meatratiosonaverage.Thedevelopingcountriesaccountnowfor55percentofworldmeatoutput,upfrom34percenttwo decades ago. The relative shift in the geographicaldistributionofworldmeatoutputreflectednotonlytheirfastergrowthofconsumptionbutalsothedrasticdeclineinthe1990sintheoutputofthetransitioncountrieswhichhadhighandofteninefficientuseofcerealsfeedperunitofoutput.
OtherfactorsthatcontributedtothesetrendsincludethehighcerealssupportpricesintheEUwhichprovidedincentives to livestock producers to substitute othersfeeds for cereals, including imported oilmeals andcassava.Cereals feeduse in theEU15peakedatabout1980, remained nearly flat until the mid-eighties, anddeclinedcontinuouslyuntil1992,when theMacSharryreformoftheEU’sCommonAgriculturalPolicyreduceddomesticcerealpricesandthelivestocksectorhassinceincreasedfeeduse(by50percentinthetenyearsafter1992).Thisboosttofeeddemandfromthelowerpolicyprices of cereals has largely run its course andgrowthwillmuchweakerinthefuture(EuropeanCommission,2005b).Theninthesecondhalfofthe1990stheabovedescribeddeclineincerealsuseinChinasetinandthiswasanotherimportantfactorleadingtothecurrent“low”shareof feed in theaggregatecerealsuse in theworld(35percent,downfrom40percenttwodecadesearlier).Finally, the slow growth of cereals feed use reflectedalso the growing use of oilmeals in livestock feeding.World output of soybeans, which is mainly processedintooilandhighproteinoilmeal,grewat5percentp.a.inthelastdecade.Byimplicationsohastheproductionandconsumptionasfeedofsoybeanmeal.Thisimpliesarelativeincreaseinthefeedrationsofoilmealsattheexpenseofcereals.
Concerningthefuture,someoftheforcesresponsiblefor the slowdown in the demand for cereals feed havebeenexhaustedand,therefore,willnothaveadepressinginfluenceinthefuture.Asnoted,thedeclineincerealsfeeduseintheEUwasreversedalreadyfromtheearly1990sandsuchuseshouldkeepgrowing,albeitatmuchslowerratesthanintheperiodafterthepricereforms.Inparallel,thedeclinesintheTransitioncountriesofbothlivestockproductionandcereals feedusehave levelledoff in thelastcoupleofyearsandsuchusewill revert togrowingagain.The increaseof theshareofpoultry in totalmeat
productionwillcontinue,butitwillnotbeaspronouncedasinthepastandtheimplicitproductivitygains(viewedattheleveloftheentirelivestocksector)fromthissourcewill not be as pronounced as in the past.ThenChina’sdecline in feeduseof cereals cannotcontinue formuchlongeriflivestockproductiongrowthistoproceedevenatmuchlowergrowthratesthaninthepast.
We noted earlier that the relative shift of worldlivestock output from the developed to the developingcountriescontributedtothedeclineinthegrowthofcerealsfeedusetowellbelowthegrowthoflivestockproduction.It is possible to visualize that this same phenomenoncould work in the opposite direction in the future: thecontinued growth of the developing countries’ share inworld livestockoutputwillbeassociatedwithagradualshift of their production from grazing and ‘backyard’systemstostall-fedsystemsusingconcentratefeedstuffs.Thiswillbeanadditionalfactormakingforhighergrowththaninthepastinthefeeduseofcereals.Suchstructuralchange in the production systemswill tend to raise theaverage grain-meat ratios of the developing countriesand perhaps compensate for opposite trends resultingfromimprovementsinproductivity.AstrongcaseforthisprospectismadeinarecentanalysisbytheDutchCentreforWorldFoodStudies(Keyzeret al.,2001).
In conclusion, all these deviations frompast trendssuggest that the growth of feed demand for cerealsshouldinthefuturebemoreinunisonwiththegrowthoflivestockproduction.Thisiswhatwehaveprojectedwith the result that the past declines in the growth ofdemandforcerealsforfeedshouldbereversedandthegrowthrateto2030isprojectedtobe1.6percentp.a.(upfrom0.8percentp.a.inthe1990s)and0.8percentp.a.inthesubsequenttwodecades(Table3.7).
3.4 Oilcrops, vegetable oils and products
Past and present
Fastest growth of all sub-sectors of global agriculture. Theoilcropssectorhasbeenoneof themostdynamicparts of world agriculture in recent decades. In the 20yearsto2001itgrewat4.1percentp.a.(Table3.9),compared with an average of 2.1 percent p.a. for allagriculture9.Itsgrowthrateexceededbyagoodmargin
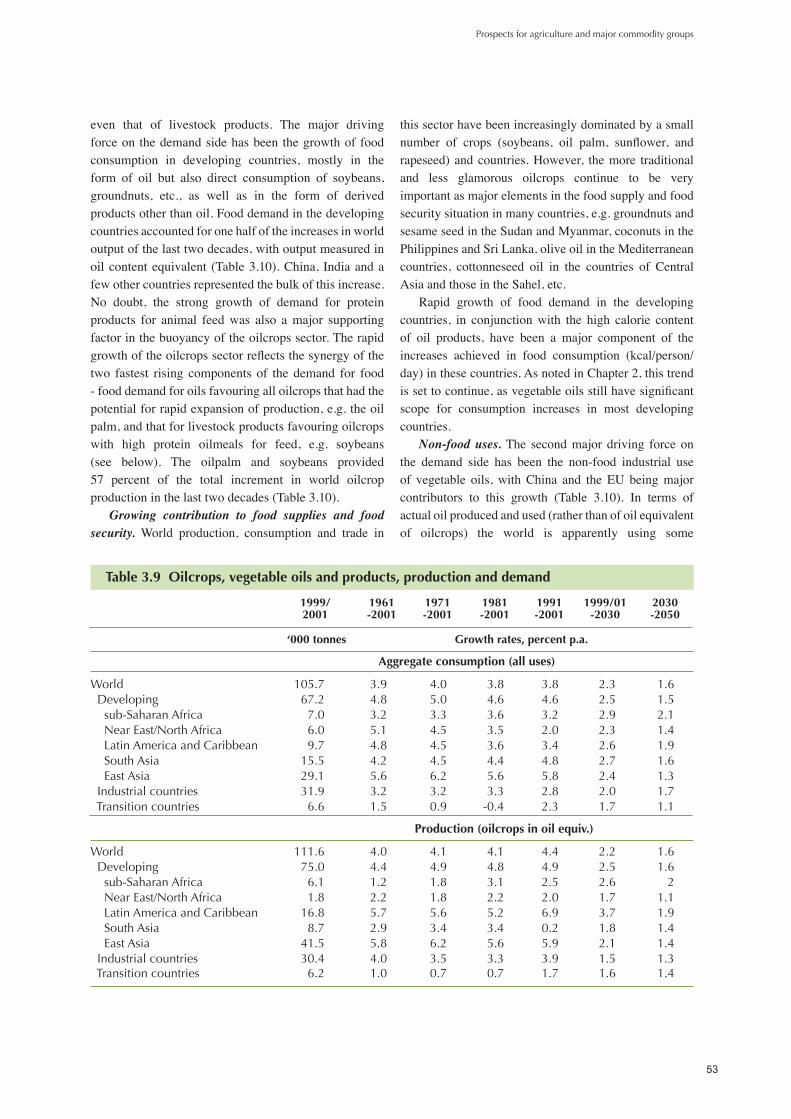
53
even that of livestock products. The major drivingforceonthedemandsidehasbeenthegrowthoffoodconsumption in developing countries, mostly in theform of oil but also direct consumption of soybeans,groundnuts, etc., as well as in the form of derivedproductsotherthanoil.Fooddemandinthedevelopingcountriesaccountedforonehalfoftheincreasesinworldoutputofthelasttwodecades,withoutputmeasuredinoilcontentequivalent (Table3.10).China, Indiaandafewothercountriesrepresentedthebulkofthisincrease.No doubt, the strong growth of demand for proteinproducts for animal feedwas also amajor supportingfactorinthebuoyancyoftheoilcropssector.Therapidgrowthoftheoilcropssectorreflectsthesynergyofthetwo fastest rising components of the demand for food-fooddemandforoilsfavouringalloilcropsthathadthepotentialforrapidexpansionofproduction,e.g.theoilpalm,andthatforlivestockproductsfavouringoilcropswith high protein oilmeals for feed, e.g. soybeans(see below). The oilpalm and soybeans provided 57 percent of the total increment in world oilcropproductioninthelasttwodecades(Table3.10).
Growing contribution to food supplies and food security. World production, consumption and trade in
thissectorhavebeenincreasinglydominatedbyasmallnumber of crops (soybeans, oil palm, sunflower, andrapeseed)andcountries.However, themore traditionaland less glamorous oilcrops continue to be veryimportantasmajorelementsinthefoodsupplyandfoodsecuritysituationinmanycountries,e.g.groundnutsandsesameseedintheSudanandMyanmar,coconutsinthePhilippinesandSriLanka,oliveoilintheMediterraneancountries, cottonneseed oil in the countries of CentralAsiaandthoseintheSahel,etc.
Rapid growth of food demand in the developingcountries, in conjunctionwith the high calorie contentof oil products, have been a major component of theincreases achieved in food consumption (kcal/person/day)inthesecountries.AsnotedinChapter2,thistrendissettocontinue,asvegetableoilsstillhavesignificantscope for consumption increases in most developingcountries.
Non-food uses.The secondmajor driving forceonthe demand side has been the non-food industrial useof vegetable oils,withChina and the EU beingmajorcontributors to this growth (Table 3.10). In terms of actualoilproducedandused(ratherthanofoilequivalentof oilcrops) the world is apparently using some
Prospects for agriculture and major commodity groups
Table 3.9 Oilcrops, vegetable oils and products, production and demand
1999/ 1961 1971 1981 1991 1999/01 2030 2001 -2001 -2001 -2001 -2001 -2030 -2050
‘000 tonnes Growth rates, percent p.a.
Aggregate consumption (all uses)
World 105.7 3.9 4.0 3.8 3.8 2.3 1.6 Developing 67.2 4.8 5.0 4.6 4.6 2.5 1.5 sub-Saharan Africa 7.0 3.2 3.3 3.6 3.2 2.9 2.1 Near East/North Africa 6.0 5.1 4.5 3.5 2.0 2.3 1.4 Latin America and Caribbean 9.7 4.8 4.5 3.6 3.4 2.6 1.9 South Asia 15.5 4.2 4.5 4.4 4.8 2.7 1.6 East Asia 29.1 5.6 6.2 5.6 5.8 2.4 1.3 Industrial countries 31.9 3.2 3.2 3.3 2.8 2.0 1.7 Transition countries 6.6 1.5 0.9 -0.4 2.3 1.7 1.1
Production (oilcrops in oil equiv.)
World 111.6 4.0 4.1 4.1 4.4 2.2 1.6 Developing 75.0 4.4 4.9 4.8 4.9 2.5 1.6 sub-Saharan Africa 6.1 1.2 1.8 3.1 2.5 2.6 2 Near East/North Africa 1.8 2.2 1.8 2.2 2.0 1.7 1.1 Latin America and Caribbean 16.8 5.7 5.6 5.2 6.9 3.7 1.9 South Asia 8.7 2.9 3.4 3.4 0.2 1.8 1.4 East Asia 41.5 5.8 6.2 5.6 5.9 2.1 1.4 Industrial countries 30.4 4.0 3.5 3.3 3.9 1.5 1.3 Transition countries 6.2 1.0 0.7 0.7 1.7 1.6 1.4

54
25 million tonnes for non-food industrial uses out ofa total use of 91 million tonnes. Two decades earlier,the comparable figures were 8 and 41 million tonnes,respectively.Theexistingdatadonotpermitustodraweven a partial balance sheet of the non-food industrialproducts for which significant quantities of vegetableoil products are used as inputs10. The main industrialproducts involved (paints, detergents, lubricants,oleochemicalsingeneraland,increasingly,biodiesel)arecommoditiesforwhichworlddemandcanbeexpectedtogrowmuchfasterthanthedemandforfood.Ifpetroleumpricesremainedhigh,thebiofuelssectorwilllikelykeepgrowing in importance as amarket outlet for oils andfats,justasthegrowingmarketforbioethanolprovidesoutletsforsugarcane(mainlyinBrazil),maize(mainlyintheUSA)andtoamuchsmallerextentforothercrops(sugar beet, wheat, sorghum, eventually cassava, etc).TheEUhasatargetofachievinga5.75percentmarketshareofbiofuelsinthepetrolanddieselmarketin2010(EuropeanCommission,2005c:38).
Concentration of growth in a small number of crops and countries. Thedemandforproteinmealsforanimalfeedalsocontributedtochangethegeographicaldistribution of oilseeds production. The latter shiftedtowards countries that could produce and exportoilseeds of high protein content, in which oilmealsare not by-products but rather joint productswith oil,e.g. soybeans in SouthAmerica. In addition, supportpolicies of the European Union (EU) also helped to
shiftworldproductionofoilseedsinfavourofrapeseedand sunflowerseed. Overall, four oilcrops (oilpalm,soybeans, rapeseed and sunflowerseed) account for 74percentofworldproduction.Threedecadesagotheyaccountedforonly51percent(Table3.12).Moreover,agoodpartoftheseincreasescamefromasmallnumberofcountries:palmoilmainlyfromMalaysiaandIndonesia;soybeans from theUSA,Brazil,Argentina,China andIndia; rapeseed from the EU, China, Canada, IndiaandAustralia; and sunflowerseed fromArgentina, theEU,China and India. For several countries, includingsomemajorproducers,thesefastexpandingoilcropsarenewcropsthatwerehardlycultivatedatall,orinonlyinsignificantamounts20oreven10yearsago.
Growing role of trade. Therapidgrowthofdemandin the developing countries was accompanied by theemergenceofseveralofthemasmajorimportersofoilsand/or oilseeds, with net imports rising by leaps andbounds.Thus,in1999/01therewereelevendevelopingcountries, each with net imports of over 0.6 milliontonnes(China,Pakistan,Mexico, India,etc.;seeTable3.11).Theseeleventogetherhadnetimportsof17milliontonnes, afive-fold increase in twodecades.Numerousotherdevelopingcountriesaresmallernetimporters,butstillaccountforanother5milliontonnesofnetimports,athree-foldincreaseintwodecades.Thisgroupincludesanumberofcountriesthatturnedfromnetexporterstonetimportersoverthisperiod,e.g.Senegal,SriLanka.With these ratesof increaseof imports, the traditional
Table 3.10 Sources of increases in world production and consumption of oilcrops (oil eq.)
Increase in world consumption by use, Increase in world production by oilcrop,
1979/81-1999/01 1979/81-1999/01
Total world increase (=100), of which: 100.0 Total world increase (=100), of which: 100.0 Developing countries, food 49.4 Oil palm (palm oil and palm kernel oil) 33.0 Of which :China 15.2 Soybeans 24.3 India 11.0 Rapeseed 18.2 Developed countries, food 13.6 Sunflower seed 7.4 Non-food industrial uses, world 30.2 Groundnuts 7.5 Of which :EU15 7.2 All other oilcrops* 9.5 China 4.8 USA 2.6 Brazil 1.9 Other uses (feed, seed, waste), world 6.7
* Includes cotton seed (in oil equivalent); more details on production in Table 3.12
10 One should be careful with these numbers as statisticians often use this category of demand as the dumping ground for unexplained residuals of domestic disappearance and statistical discrepancies. There is no doubt, however, that non-food industrial uses are a dynamic element of demand.

55
Prospects for agriculture and major commodity groups
nettradesurplusofthevegetableoils/oilseedscomplex(oils,oilmeals,oilseeds)ofthedevelopingcountrieswasprogressivelyreducedandturnedintoadeficitin2001(it recovered back to positive in the subsequent threeyears 2002-4). This happened despite the spectaculargrowth of exports of a few developing countries thatcametodominatetheworldexportscene,viz.MalaysiaandIndonesiaforpalmoilandBrazilandArgentinaforsoybeans.Indeed,ifBrazilisexcludedfromthetotals,thedeficitof the restof thedevelopingcountrieskeptgrowingtoreachUS$9.4billionin2004(Figure3.2).Ashappenedwiththelivestocksector,theoverallevolution
oftradeofoilseedsandproductshascontributedtotheagricultural trade balance of the developing countriesdiminishingrapidlyandturningnegative(Figure3.1).
Oilcrops responsible for a good part of agricultural land expansion.Ontheproductionside,thefastgrowthofoilcropsexpandedmainly,thoughnotexclusively,inland-abundant countries (Brazil,Argentina, Indonesia,Malaysia, the USA, Canada). The oil palm and thethreeannualoilcropswhichgrewthefastest(soybeans,rapeseed, and sunflower) have been responsible fora good part of the expansion of cultivated land underall crops in thedevelopingcountries and theworld as
Table 3.11 Net trade balances for oilseeds, oils and products
1969/71 1979/81 1989/91 1991/01 2030 2050
million tonnes (oil equivalent)
Developing countries 2.3 1.5 4.0 5.7 15.4 24.6
Malaysia 0.5 2.6 6.4 11.0 Argentina 0.3 1.1 3.0 5.8 Indonesia 0.3 0.4 1.3 5.6 Brazil 0.3 1.2 1.4 3.4 Philippines 0.7 1.1 1.0 0.9
sub-total, 5 major exporters 2.0 6.4 13.1 26.8 68.1 93.2
Other developing exporters 0.4 0.4 0.7 1.5 4.6 6.6
China 0.1 -0.1 -1.3 -4.3 India -0.1 -1.3 -0.2 -4.3 Mexico 0.0 -0.3 -0.9 -1.7 Pakistan -0.1 -0.4 -1.0 -1.5 Bangladesh -0.1 -0.1 -0.3 -1.1 Korea, Rep. 0.0 -0.2 -0.5 -0.9 Iran -0.1 -0.3 -0.7 -0.8 Taiwan Province of China -0.1 -0.2 -0.6 -0.7 Egypt -0.1 -0.3 -0.7 -0.7 Turkey 0.0 -0.1 -0.4 -0.6 Hong Kong -0.1 -0.1 -0.1 -0.6
sub-total, 11 major importers -0.6 -3.4 -6.8 -17.2 -44.6 -57.4
Other developing Importers 0.5 -1.9 -3.0 -5.3 -12.7 -17.7
Industrial countries -2.8 -0.4 -3.1 -2.2 -10.9 -20.9
USA 2.2 5.4 2.9 5.1 Canada 0.3 0.9 1.0 2.3 Japan -1.0 -1.7 -2.3 -2.6 EU-15 -4.1 -4.7 -4.1 -6.6 Other Industrial countries -0.3 -0.3 -0.6 -0.3
Transition countries 0.5 -0.9 -0.7 -0.1 -0.9 -0.3
World balance (stat. discrep.) -0.1 0.2 0.2 3.4 3.5 3.4
* Trade in oils and products derived from oils plus the oil equivalent of trade in oilseeds; trade in oilmeals not included in order to avoid double counting in the equation: production + net trade = consumption expressed in oil equivalent. Importer-exporter status as of 1999/01

56
a whole. In the developing countries, the harvestedarea11 under themaincrops (cereals, rootsand tubers,pulses, fibres, sugar crops and oilcrops) expanded by 96millionhawhilethatintherestoftheworlddeclined by65millionhainthetwodecadesto2000,ofwhichmorethanonehalf(50millionha)wasforoilcrops.
These numbers clearly demonstrate that landexpansion continues to play an important role inthe growth of crop production. The 160 percent increaseinoilcropoutputbetween1979/81and1999/01in the developing countries was brought about by a 62 percent (50 million ha) expansion of land under these crops, at the same time as land under theirother crops also increased by an almost equal amount (47millionha).
The oilcrops sector in the future
Food demand.As noted, the growth of food demandinthedevelopingcountrieswasthemajordrivingforcebehind the rapid growth of the oilcrops sector in thehistoricalperiod.Themostpopulouscountriesplayedamajor role in thesedevelopments (Table3.10).Willthese trends continue in the future? In the first place,slowerpopulationgrowth,particularlyinthedevelopingcountries, will be reflected in slower growth ratesof their aggregate demand for food, ceteris paribus. Naturally,othersthingswillnotbeequal:inparticular,thepercapitaconsumptionofthedevelopingcountrieswasonly4.9kgthreedecadesago.Thisaffordedgreatscopefortheincreasesinconsumptionwhichtookplace.
Table 3.12 Major oilcrops, world production
Production of oilcrops in Actual oil oil content equivalent (million tonnes) production
1969/71 1979/81 1989/91 1999/01 2030 2050 1999/01
Soybeans 8.1 15.9 19.6 30.5 67.9 96.4 25.7Oil palm 2.6 5.7 13.0 25.6 54.2 77.2 25.5Rapeseed 2.6 4.4 9.7 15.3 29.8 41.4 13.0Sunflowerseed 4.1 5.9 9.2 10.4 17.5 22.4 9.4Groundnuts 5.2 5.4 6.8 9.9 16.7 21.4 5.0Coconuts 3.4 4.1 5.2 6.5 10.8 12.6 3.2Cotton seed 3.5 4.2 5.4 5.4 7.7 8.9 3.8Sesame seed 0.9 0.9 1.0 1.3 2.4 3.1 0.8Other oilcrops 4.0 4.3 4.8 5.9 8.5 9.8 6.2
Total 34.2 50.8 74.8 110.9 215.5 293.2 92.6
Oils from non-oilcrops (maize, rice bran) 2.9
Growth rates, percent p.a.
1961-01 1971-01 1981-01 1991-01 1999/01-2030 2030-50 1999/01-50
Soybeans 4.7 4.0 3.6 5.1 2.7 1.8 2.3Oil palm 7.5 8.1 7.6 7.0 2.5 1.8 2.2Rapeseed 6.7 6.6 5.6 4.4 2.2 1.7 2.0Sunflowerseed 3.5 3.4 2.4 1.3 1.8 1.3 1.5Groundnuts 2.0 2.5 3.3 4.0 1.8 1.3 1.5Coconuts 2.0 2.3 2.7 2.2 1.7 0.7 1.3Cotton seed 1.7 1.5 1.0 0.3 1.2 0.7 1.0Sesame seed 1.5 1.7 1.9 2.9 2.0 1.4 1.7Other oilcrops 1.2 1.4 1.8 2.4 1.1 0.6 1.0
Total 4.0 4.1 4.1 4.4 2.2 1.6 2.0
11 The increase of harvested area implies not only expansion of the cultivated land in a physical sense (also referred to as arable area in the original study –Bruinsma,2003)butalsoexpansionofthelandundermultiplecropping(intheharvestedorsownareadefinition,ahectareofarablelandiscounted as two if it is cropped twice in a year). Therefore, the harvested area expansion under the different crops discussed here could overstate the extent to which physical area in cultivation has increased. This overstatement is likely to be more pronounced for cereals (where the arable area has probably declined even in the developing countries) than for oilcrops, as the latter include also tree crops (oil and coconut palms, olive trees).

57
Prospects for agriculture and major commodity groups
However,intheprocesspercapitaconsumptiongrewto10.4kgin1999/01.Withinthisaverage,Indiadoubledits per capita consumption and China increased it 3.5-fold. As shown in Table 3.10, food demand inthese two countries accounted for over one half ofthe increment in the food demand of the developingcountries.Whileoilswillremainafooditemwithhighincome elasticity inmost developing countries in theshort and medium term-future, the higher levels thatwillbeachievedgraduallywill lead to slowergrowthinthelongertermfuture.Thus,percapitaconsumptionwilllikelyriseatmuchslowerratescomparedwiththepast (Tables2.7-2.8).This slowdownmustbe seen inthecontextofrisingfooddemandforallcommoditiesandtheimpliedlevelsofkcal/person/day.WenotedinChapter2(Table2.2)that68percentofthepopulationofthedevelopingcountrieswillbeincountrieswithover3000kcal/person/dayin2050.Inevitably,consumptionof these calorie-rich foods (oils and products) cannotcontinue growing at the fast rates of the past. Thisprospectnotwithstanding, therewillstillbemanylowincome countries which in 2050will have per capitaconsumption of fats and oils totally inadequate forgood nutrition, the result of persistent low incomes andpoverty.
Non-food industrial uses. We noted earlier theinadequacyofthestatisticsonoilcropproductsusedfornon-foodindustrialpurposes.Wealsonotedthatsomeoftheindustrialproductsresultingfromsuchusehavehighincomeelasticitiesofdemand.Inaddition,vegetableoilsmay be increasingly used as feedstocks for productionofbiofuels.Palmoilfromthemainproducingcountries(MalaysiaandIndonesia)couldbeforthebiodieselsectorwhat sugar cane isproving tobe forbioethanol12. The latest projections of theEuropeanCommission foreseethat some10million tonnesof oilseeds (20percent oftotal consumption in the EU25 of both domesticallyproducedandimportedoilseeds)maybeusedtoproducebioenergyin2012,upfrom3.6milliontonnesin2003.Inaddition,some1.5milliontonnesofgrainsmaybesoused (EuropeanCommission, 2005b:TablesA.1,A.8).Thereis,therefore,aprima faciecasetobelievethattheshareoftotalvegetableoilproductiongoingtonon-food
industrialuseswillcontinuetogrowfairlyrapidly.Intheprojections,wemakeanallowancefor thiscategoryofdemandtogrowatratesabovethoseofthedemandforfood (3.2 percent p.a. versus 1.5 percent p.a. over theentireprojectionperiodto2050).By2050suchusesmayaccountforsome42percentoftotalusecomparedwith24percentatpresentandonly16percent30yearsago.
Trade.Theprojectedfairlybuoyantgrowthindemand,and the still considerable potential for expansion ofproductioninsomeofthemajorexporters(seebelow),suggest that past trade patternswill continue for sometime-thatis,rapidlygrowingimportsinmostdevelopingcountries, matched by continued export growth of themainexporters.TheprojectionsareshowninTable3.11.Thepotentialforfurtherproductionandexportincreasesof several developing countries, and the continuedgrowthofdemand(mainlyfornon-fooduses,includingoilmeals for feed) in the industrial countries togetherwiththelimitationintheirpotentialtoexpandproduction(particularly under policy reforms limiting the use ofsubsidies) would likely lead to the net export surplusof the developing countries rising again13, with Brazilplayinganevergrowingroleinsuchdevelopments.
Production.TheproductionanalysisoftheoilcropssectorisconductedseparatelyintermsoftheindividualcropslistedinTable3.12.Cottonisincludedamongthesecropsbecauseitcontributessome4percentofworldoilproduction,thoughprojectedproductionisdeterminedinthe context ofworld demand-supply balance of cottonfibre rather than oil. The production projections forthesemajoroilcropsareshowninTable3.12.Wenotedearlierthatoilcropproductionhasbeenresponsibleforagoodpartoftheareaexpansionundercropsin,mainly,the developing countries. The relatively land-intensivenature of oilcrop production growth reflects in largepart the fact that they are predominantly rainfed crops(less than ten percent irrigated, compared with about 40percentforcereals).
Intheperiodto2050oilcropproductionisrequiredtocontinuegrowingalbeitatratessignificantlybelowthoseof thepast (Table3.12).Evenat those lower rates, theabsoluteincrementsinvolvedareverylargeforsomeofthesecrops,e.g.morethantriplingforsoybeansandthe
12See:“Highhopesforpalmoilpushupshareprices.MalaysiaandIndonesiaarebenefitingfrominterestinanewenergysource”,Financial Times, 17October2005.Notethattheoilpalm,whilebenefitingfromhighpetroleumpricesviathebiofuelslink,itcompetesforland(oftenforestlandfor expansion) with natural rubber, a crop that is also gaining in competitiveness vis-à-vis synthetic rubber which is produced from the higher-priced petroleum. 13 The trade numbers in Table 3.12 comprise the oils traded as well as the oil equivalent of the trade in oilseeds and products made from vegetable oils. They do not include trade in oilmeals in order to avoid double counting when we express all numbers in oil equivalent.

58
oilpalm.Giventheirland-intensivenature,thequestionwhetherthereisenoughlandforsuchexpansionwithoutseriously threatening forest areasmust be posed14. We illustratewhat is involvedon thebasis of the exampleofsoybeans.Thethreemainsoybeanexportingcountries(theUSA,BrazilandArgentina)accountfor80percentofworldoutput,withthetwoSouthAmericancountrieshaving increased their share from 20 percent twentyyears ago to34percent in1999/01,while the shareofthe USA correspondingly declined from 64 percent to45percent15.Thesoybeansharvestedareainthesethreecountriesiscurrently52millionha16(havingincreased37percentinthelasttwodecades)andtheaverageyieldis 2.53 t/ha, having grown 33 percent over the sameperiod.Assumingtheymaintaintheirshareintheworldtotal, a triplingof their production - it hadquadrupledinthepreceding30years-wouldberequiredby2050,with South America, particularly Brazil, accountingfor an ever growing share17. A near doubling of thearea under cultivation would be probably required,even assuming future yieldsmatched the highest yieldencounteredcurrently in rainfedcultivationunderhighinput technology in theUSA.Howmuch landsuitableforgrowingsoybeansunderhighinputtechnology18dothesecountrieshave?
AccordingtotheFAO/IIASAGlobal Agroecological Zones Study (GAEZ, Fischer et al., 2002) Brazil hassome21millionhaoflandsuitableforsoybeans(classesVery SuitableandSuitable-notincludinglandinclosedforestandinprotectedareas)orsome66millionhaifweincludealsotheMedium Suitableclass.Itusescurrently(2005)23millionha,up fromonly14millionhaonly5years earlier.Argentinahas some27millionha landsuitable for soybeans (classes VS, S – 39 million haincludingclassMS)anditusescurrently14millionha,upfrom8.6millionhafiveyearsearlier.TheUSAhassome11millionhainclassesVS-Sandanother12millionhainclassMS.Itusescurrently29millionhaforsoybeans,thesameasfiveyearsearlier,whichisabovethelandgivenassuitableforsoybeansintheGAEZ.Naturally,notall
ofthelandshownassuitableforsoybeansintheGAEZestimateswillbeavailablefor thiscrop,asothercropsalsocompeteforit.Clearlythepotentialisnotunlimited.The expansion rates of the past cannot be continuedand even at the lower rates of increase projected hereexpansion of soybeans area will be pressing against landresources.
3.5 Roots, tubers and plantains
Food consumption of roots, tubers and plantains.Average world food consumption is 69 kg per capita,providing 6 percent of total food calories.As noted inChapter2,theseproductsrepresentthemainstayofdietsinseveralcountries,manyofwhicharecharacterizedbylowoverallfoodconsumptionlevelsandfoodinsecurity.Thegreatmajorityofthesecountriesareinsub-SaharanAfrica. The region’s per capita consumption is some 190 kgwhich provide 23 percent of total calories, butsomecountriesdependoverwhelminglyontheseproductsforfood(seeChapter2).
Thehighdependenceonroots, tubersandplantainsreflectstheagroecologicalconditionsofthesecountries,whichmake these products suitable subsistence crops,andtoalargeextentalsothepersistenceofpovertyandlackofprogress towardsdietdiversification.There aresignificantdifferencesastowhichofthesestarchyfoodsprovidethemainstayofdietsinthe19countriesdependenton this family of products. Cassava predominates inmost of them (the twoCongos,Angola,Mozambique,Tanzania, the Central African Republic, Liberia andMadagascar).IncontrastitismostlyplantainsinRwandaandUganda,andcassavaandsweetpotatoes inBenin,Togo,NigeriaandBurundi,whilethereismorebalanceamongthedifferentproducts(cassava,plantains,sweetpotatoesandotherrootsandtubers–mostlyyams)intheothercountries(Ghana,Coted’Ivoire,Guinea,Gabon).
Some studies highlight the high income elasticityofdemandforpotatoesinthedevelopingcountries,the
14 It is said that the expansion of soybean production in Brazil is contributing to deforestation in the Amazon, not so much because forest land is converted for soybean cultivation but rather because it drives expansion into the forest for grazing and rice cultivation (“Exports blamed for Amazon deforestation”, Financial Times, 14-01-05). Environmental groups also claim that expansion of the oilpalm is destroying rainforest and threatens the habitat of apes (BBC, “Shoppers ‘threat to orang-utans’” 23-09-05; also “Worse than Fossil Fuel” Guardian, 6th December 2005). 15 Provisional production data for 2005 suggest that the share of Argentina and Brazil increased further to 42 percent and that of the USA declined to 39 percent.16 Provisional 2005 data: 66 million ha.17 FAPRI, 2005, projects that Brazil will have overtaken the USA as the World’s largest producer of soybeans by 2010. 18WeusetheestimatesoflandsuitableforsoybeansasevaluatedbytheGAEZforthe“high input rainfed” variant, given that the yields these countries achievecurrentlyareclosetoorabovethe2.5-2.8tonnes/hageneratedbytheGAEZforthisvariantforlandclassesVS-Sontheaverage.

59
Prospects for agriculture and major commodity groups
majority of which have very low levels of per capitaconsumption19. This contrasts with the position of theother starchy foods (particularly sweet potatoes butalso cassava), whose per capita food consumption inthe developing countries has apparently stagnated ordeclined20. However, caution is required in drawingfirm inferences from these numbers because of theparticularlypoorqualityofdataasregardstheproductionandconsumptionofseveralofthesecrops.
Efforts to improve the cassava data in Africa inthe context of COSCA21 suggest that cassava is farfrombeingtheinferiorgoodputforwardintraditionalthinking. “The COSCA study found that the incomeelasticitiesofdemandforcassavaproductswerepositiveat all income levels” (Nweke et al., 2002). Indeed,cassavaplayedan importantrole in thenutritiongainsmadebyanumberofcountrieswhichfacedseverefoodinsecurityproblems.Forexample,gainsinpercapitafoodconsumptioninGhana(from1700caloriesin1979/81to2580caloriesin1999/01)andinNigeria(from2050to2720)camelargelyfromincreasesintheproductionandconsumptionofcassavaandsweetpotatoes–65percentand45percentofthetotalcalorieincreases,respectively.Indeed,thesetwocountriesarepresentedinFAO’s2000State of Food Insecurity in the World (FAO, 2000) assuccesscases in improving foodsecuritybasedon thediffusion of improved high-yielding cassava cultivars,largelydevelopedbyIITA(seealsoNweke,2004;Nweke et al.,2002).
However,suchgainsweretheexceptionratherthanthe rule in the many countries with food insecurityproblems andhighdependenceon starchy foods.Onlyafewofthem(Ghana,Nigeria,Malawi,Benin,Rwanda,Angola,GuineaandPeru)registeredsignificantincreasesinthepercapitafoodconsumptionoftheseproducts.Theothershadnogains,indeedsomeofthemsufferedoutrightdeclinesaccordingto thereportedproductionstatistics.Inconclusion,theexperiencesofthe“success”countriesindicate that these crops have a promising potential tocontribute to improved food security. Analyzing why
most countries with high dependence on these crops(over20percentofcalories)failedtobenefitfromsuchpotentialcanthrowsomelightonthemoregeneralissueofconditionsthatmustbemetifprogressinfoodsecurityistobemade.Thefactthatsomeofthesecountrieshavebeenexperiencingunsettledpoliticalconditionsandwariscertainlypartoftheproblem.
Feed uses of root crops. Significantquantitiesofrootsare used as feed, mostly potatoes (14 percent of worldproductiongoestofeed),sweetpotatoes(36percent)andcassava(27percent).Asmallnumberofcountriesorcountrygroupsaccountforthebulkofsuchuse.Forpotatoes,itismostlythecountriesoftheformerSovietUnionandEasternEurope,andChina.Potatofeedusehasdeclinedinrecentyears in absolute tonnage as well as percentage terms,mainlyasaresultofthedeclineofthelivestocksectorinthetransitioncountries.Forsweetpotatoes,Chinaaccountsforalmostthetotalityofworldfeeduseandforabouttwothirds of world production. Feed use in China expandedrapidlyup to the late1990s following the fast growthofitslivestocksectorandtheshiftofhumanconsumptiontopotatoesandotherpreferredfoods.
For cassava, a few countries account for the bulkworld feed use (Brazil, China, Nigeria, the EU15,Paraguay,Vietnam,Uganda,GhanaandAngola).UptoafewyearsagotheEU15wasbyfarthelargestuser.Itsfeeduseofimportedcassavapeakedatsome25milliontonnes(freshcassavaequivalent)in1990andhasfallenprecipitously since then to the current some 5milliontonnes. As noted, the rise and subsequent collapsefollowedthemovementsofthecerealpricessetbypolicyintheEU.ThevicissitudesofcassavaimportsandfeeduseintheEUprovideaninterestingstoryofthepowerofpolicies(inthiscasetheEU’ssupportpricesforcereals)tochangeradicallyfeedingpatternsandexertsignificantimpactsontradeaswellasonproduction,landuseandtheenvironmentinfarawaycountries(inthiscasemainlyThailand,seeBruinsma,2003,Ch.3).
These products will continue to play an importantroleinsustainingfoodconsumptionlevelsinthemany
19 “Whereas potatoes are typically considered a cheap, starchy staple in industrialized countries, they tend to be high-priced and sometimes are luxury vegetables in the developing world….. Consumption of potato increases as income increases. The relationships for cassava and sweet potato are different. As per capita incomes increase, per capita consumption declines” (Scott et al., 2000).20“OutsideofKerala(India)andisolatedmountainareasofVietNamandChina,mostcassavainAsiafordirectfoodpurposesisfirstprocessed.As incomesincreaseovertime,alsotheseareaswillreducetheirnon-processedcassavaintakeinfavourofthepreferredrice.On-farmcassavaflour consumption, seems to behave in a similar way to non-processed cassava in Asia, as it is also substituted for rice as economic conditions improve. Nonetheless, on-farm, in the poorer Asian rural areas (Indonesia, Viet Nam and China) cassava may remain as an emergency or buffer crop in times ofricescarcity.However,thisisnottheprimarynorthepreferreduse”(Henryetal.,1998).Also,“thegeneraltendencyisthatcerealsarepreferredto root crops” (FAO, 1990: 24) and “In general, cassava is not well regarded as a food, and in fact there is often a considerable stigma against it” (Plucknett et al., 2001).21 Collaborative study of cassava in Africa (COSCA), initiated in 1989.

60
0791
Transition
All Developing
)tnelaviuqe ragus war( sennot noilli
M
20020002
89916991
49912991
09918891
68914891
28910891
87916791
47912791
-30
-20
-10
0
10
20
30
Developing ImportersDeveloping Exporters Industrial
Figure 3.11 Sugar: net trade positions, 1970-2002
countriesthathaveahighdependenceonthemandlowfoodconsumptionlevelsoverall.Thepossibleevolutionin foodconsumptionper capita is shown inTables2.7and 2.8. Themain factor thatmade for the decline inthe average of the developing countries (precipitousdecline of sweet potato food consumption in China)will bemuchweaker, as the scope for furtherdeclinesismuchmore limited than in the past. In parallel, thetwofactorsthatmakeforincreasesintheaverage-thepositive incomeelasticitiesof thedemand forpotatoesandthepotentialofferedbyproductivityincreasesintheotherroots(cassava,yams)-willcontinuetooperate.Itwillbepossibleformorecountriesinsub-SaharanAfricato replicate the experiences of countries like Nigeria,GhanaandMalawi,andincreasetheirfoodconsumption.Thus,therecentupturninpercapitaconsumptionofthedevelopingcountriesisprojectedtocontinue(Table2.7),whilethedecliningtrendinsub-SaharanAfrica(excludingNigeriaandGhana,Table2.8)maybereversed.
Industrialnon-foodusesofcassavacanbenefitfromtheprospectthatthecropcanbecomeamajorfeedstock(along with sugar cane and maize) for the productionof ethanol (see section on sugar below). Thailand is
apparentlymovinginthisdirection22andothercountrieswith significant cassava production potentials may dosoifpetroleumpricesweretobekeptatlevelsmakingremunerativetheuseofcassavafeedstocksforbiofuels.Inourprojectionsofnon-foodindustrialusesofcassavawemadesomeallowanceforincreaseddemandoriginatinginthebiofuelssector.
3.6 Sugar
Consumption has been growing fast in the developingcountries,which now account for 72 percent ofworldconsumption (up from 49 percent 30 years ago),including the sugar equivalent of sugar crops used innon-food industrial uses (mainly Brazil’s sugar caneused in ethanol production - see below). In contrast,foodconsumptionhasgrownverylittleintheindustrialcountries,andhasdeclinedinthetransitioncountriesinthe1990s.Animportantfactorinthestagnationofsugarconsumption in the industrial countries has been therapid expansion of corn-based sweeteners in theUSA,where theynowexceedconsumptionof sugar23.Sugar
22 http://earth-policy.org/Updates/2005/update49 ; see also “Thai ‘Biofuel’ Sector Takes off as Region’s Energy Needs Rise”, Wall Street Journal, Sep 22, 200523 Data inhttp://www.ers.usda.gov/briefing/sugar/Data/data.htm

61
Prospects for agriculture and major commodity groups
is produced under heavy protection in the industrialcountries,withtheexceptionofthetraditionalexportersamongthem(AustraliaandSouthAfrica–OECD,2002).Under thisshelter, theirproductiongrewat1.4percentp.a.inthelastthreedecades,atatimewhentheirtotalconsumptionwasnotgrowing.Theresulthasbeenthatthesecountriesturnedfromnetimportersof8.9milliontonnes 30 years ago to net exporters of 4.4 milliontonnes in 1999/01 (Figure 3.11). This reflected partlythe growing exports ofAustralia, declining imports oftheUSAandtoasmallerextentJapan,butaboveall itreflected the shiftingof theEU fromanet importerof 2.4 million tonnes to a net exporter of 4.2 milliontonnes.Thenetexportsofthedevelopingexportersdidnotdeclinebecauseoverthesameperiodthedeclineoftheirexportstotheindustrialcountrieswascompensatedby rising imports into the transition countries and theimporting developing countries.The latter, particularlyseveralcountriesintheNearEast/NorthAfricaregionbutalsocountrieslikeIndonesiaandNigeria,playedamajorroleintheexpansionofworldtradeastheirimportsshotupinthesecondhalfofthenineties.
Amajorcharacteristicofthesedevelopmentsisthatthe low prices prevailing in world markets acted as adisincentive to production in countrieswhich failed to
improveproductivityand,togetherwiththerapidgrowthoftheirownconsumption,contributedtoturningseveraltraditional exporting developing countries into netimporters.These includecountries like thePhilippines,Peru, Mozambique and Taiwan (province of China).Collectively, they were net exporters of 2.3 milliontonnesintheearly-seventies.Theynowhavenetimportsof0.8milliontonnes.
Concerning the future, food consumption of sugarin the developing countries is projected to continue togrow (Tables 2.7, 3.13). Growth could be higher thanindicatedintheTablesifChina’spolicytolimitsaccharinconsumptionsucceeded(Baron,2001,p.4).Muchofthegrowthwouldoccur inAsia, asLatinAmericaand theNearEast/NorthAfricahavealreadyattainedfairlyhighlevelsofconsumption(Table2.8).Percapitaconsumptionwillprobablyremainconstantintheindustrialcountries,comparedwithdeclines inpart of thehistorical periodduringwhichcornsweetenersweresubstitutingforsugarintheUSA.Thisprocess,verypronounceduptothemid-eighties,hasbynowrunitscourse.Itcouldbereversedifsugarpriceswerenottobesupportedatthehighlevelssetbypolicyand/ormaizepricesweretorisefollowingitsgrowinguseforethanolproduction(USDA,2006:21).Someincreasesareexpectedinthetransitioncountries,
1970
B r azil (Sugar) Rest of W orld (Sugar)
25000
Mill
ion
Kg
and
Mill
ion
Lt.
15000
5000
30000
0
10000
20000
2014
20
08
2006
20
04
2002
20
00
1998
19
96
1994
19
92
1990
19
88
1986
19
84
1982
19
80
1978
19
76
1974
19
72
2010
20
12
Sou r ces: Sugar: F aostat; Alcohol with Projections: OECD (2005)
B r azil (Alcohol)
Figure 3.12 Industrial use of sugar (Brazil and rest of world) and (Brazil only) alcohol production

62
Table 3.13 Sugar (raw sugar equivalent)
Thousand tonnes percent p.a.
1999/01 1961 1971 1981 1991 1999/01 2030 1999/01 -2001 -2001 -2001 -2001 -2030 -2050 -2050Production Developing Countries 130846 3.2 3.1 2.5 2.2 2.2 1.6 1.9 Industrial Countries 35097 1.8 1.4 1.0 1.4 -0.1 -0.4 -0.2 Transition Countries 8330 -0.8 -1.6 -3.1 -3.6 0.0 -1.5 -0.6 World 174271 2.4 2.3 1.7 1.7 1.7 1.3 1.6Food Use Developing Countries 98042 3.4 3.2 2.7 2.7 1.7 0.9 1.4 Industrial Countries 29929 0.2 -0.1 0.5 0.8 0.2 0.0 0.2 Transition Countries 15004 0.6 -0.6 -1.8 0.3 -0.1 -0.2 -0.1 World 142978 2.1 1.8 1.6 2.0 1.3 0.7 1.1Industrial Non-Food World 16193 7.9 8.2 2.7 -0.8 4.6 3.2 4.0 Brazil 11545 11.4 11.2 2.7 -1.9 1969/71 1979/81 1989/91 1999/01 2030 2050 Food Consumption (kg/person/year)
Developing Countries 15 18 19 21 24 26 Industrial Countries 41 37 33 33 32 32 Transition Countries 42 46 43 37 39 41 World 22 23 23 24 26 27
Net Trade (Thousand tonnes)
Industrial Countries -8886 -1983 1851 4448 -2000 -6450 Australia 1672 2198 2739 3965 EU15 -2356 2481 3184 4235 South Africa 628 754 894 1402 Japan -2529 -2181 -1902 -1551 USA -4646 -3663 -1372 -1579 Other Industrial -1655 -1572 -1692 -2024 Transition Countries -935 -4813 -5006 -7510 -7600 -9300 Russia -5350 Developing Countries 9269 7329 3745 7353 13900 20000 Exporters in 1999/01 10893 14171 13752 24129 43150 54800 Brazil 1162 2653 1093 10515 Thailand 82 893 2812 3703 Cuba 5739 6718 6992 3099 Guatemala 62 189 477 1195 Colombia 147 239 347 997 Turkey 77 -83 -206 733 Swaziland 150 283 440 549 Other 3473 3278 1798 3338 Importers in 1999/01 -1623 -6842 -10007 -16780 -29200 -34800 Indonesia -132 -515 -323 -1758 Korea, Rep. -226 -444 -812 -1078 Iran -80 -816 -806 -1019 Nigeria -110 -716 -412 -954 Algeria -198 -554 -827 -950 Malaysia -354 -424 -570 -874 Egypt 90 -477 -703 -746 Saudi Arabia -86 -308 -447 -622 Syria -146 -209 -372 -557 Sri Lanka -308 -253 -333 -539 Morocco -244 -311 -268 -506 Other 171 -1815 -4133 -7178 World (imbalance) -556 527 584 4285 4300 4250

63
Prospects for agriculture and major commodity groups
makingupforsomeofthedeclinessufferedduringthe1990s.Giventhelowerpopulationgrowthinthefuture,thesedevelopmentssuggestafurtherdecelerationintheaggregate world food demand for sugar.As explainedbelow, the impact on the world sugar sector may becompensated by the growing use of sugar crops forbiofuelproduction.
Animportantinfluenceonthesectormaybeexertedby thewider use of biofuels.As noted, the rise in thepriceofpetroleumhaspromptedgreatlyrenewedinterestinbiofuelsassubstitutesforgasolineanddieselinmotorvehicles. Brazil, using sugar cane as the feedstock forproducingethanol,leadstheway24:thecountry’salcoholproduction increasedfrom11.3billion litres (lt.) in the2001/02 crop year to 15 billion lt. in 2004/05 takingonehalfof thecountry’s sugarcaneproduction.GivenBrazil’s large cane production potential, this has notdentedsignificantlyitscapacitytoproducesugartomeetthegrowingdemand for exports:over the sameperiodBrazil’s sugar production increased from 17 milliontonnes(milliontonnes)to28milliontonnesandexportsfrom 8 million tonnes to 18 million tonnes25. Othercountrieshaveplanstoproduceethanolfromsugarcane26. Morecountrieswithabundantlandresourcessuitableforproducing low-cost biofuel crops (e.g. vegetable oils,cassava,inadditiontosugarcane)canbeexpectedtojointhelistifdevelopmentsintheenergymarketssodictate.Notwithstanding theveryweakdataavailability in thisfield,someprovisionmustbemadeintheprojectionsfortheprospect that the futureof the sugar sectormaybeinfluencedsignificantlybythebiofuelfactor.
FAO’sdataonnon-foodindustrialusesofsugarcanbeutilisedasa roughguide, though it isnotknown towhat extent such use reflects fuel alcohol production.BrazilaccountsforthebulkoftheFAOdataonindustrialuses (70-80 percent of theworld total).TheFAOdataonBraziltrackfairlycloselythedatafromindependentsources of the country’s alcohol production27 (Figure3.12).Therefore,theexistingFAOdata(indicatingsuchuse of sugar of 16 million tonnes in 1999/01 – some
10percent ofworld total sugar use) canbe taken as astarting point for looking into the future. The OECD/FAOsugarprojectionsforBrazilto2014(OECD,2005b)indicateadoublingofalcoholproductionfrom2002-14to some 26 billion lt. taking into account preliminarydatashowinga20percentrecordedriseto15billionlt.from2002-04 (ofwhich some2.4billion lt. exported).Conservativelyweprojectfurthergrowthat3.5percentp.a. (roughly thatofBrazil’sGDP).For the restof theworld we project analogous increases for the abovementionedcountrieswithplanstoproducealcoholfromsugarcane.Theresultisthatthetrendtowardsdeclineinworlduseofsugarfor industrialpurposes in the1990s(-0.8 percent p.a.) is reversed in these conservativeassumptionsandisprojectedtogrowat4.0percentp.a.(Table3.13).Asnoted, thisupturnwouldcontribute tokeepingthegrowthrateofworldaggregatedemand(foralluses)andproductionfromdecliningasthegrowthoftheworldfooddemandforsugardecelerates.
Another factor thatmaymake fordeviationsof thefuture in relation to the past in the sugar sector is thegrowing pressure on the industrial countries to reducesugarprotectionism.Suchpressuresmaybearsomefruitinthenottoodistantfutureandleadtosomeshrinkageof sugar production in the industrial countries to thebenefitofhigherexportsfromthedevelopingcountries.The EU has been promoting reforms in this direction.Ifadoptedandimplementedtheywouldhavetheresultthat the region would turn again into a net importer.ThelatestassessmentbytheEUCommission(2005a– Table 4) indicates that with the proposed reforms the EU-25 could turn into a net importer to the tune of 3.5milliontonnesin2012/13.Thiscompareswiththenetexportsof1.6milliontonnesin2004andthehigherlevelsofearlieryears.Suchdevelopment,eventuallyreinforcedbymore liberal tradepoliciesofothermajor industrialimporters, would lead to the industrial countries as awhole reverting to their“natural”statusofbeingagainnetimportersofsugar,atrendalreadyforeshadowedbythevirtualdisappearanceoftheirnetsurplusin2004.
24 ItissaidthatBrazil’sethanoliscompetitivewithpetroleumwhenthelatter’spriceisUS$35-40/barrel(KojimaandJohnson,2005;OECD,2005a:Lebre laRovere,2004)orevenlessaccordingtoothers(see,forexample,“TheNextPetroleum”,Newsweek,18August2005).Thesefigurescomparewiththe current petroleum price of US$60+. Eventually, the competitiveness may be further enhanced (though not by much – Kojima and Johnson, 2005) if the savings ofgreenhousegas(GHG)emissionsresultingfromsubstitutingethanolforgasolineweretobemonetizedintheformoftradablecarboncredits(Certified Emission Reductions of greenhouse gases) through the Clean Development Mechanism under the provisions of the Kyoto Protocol. Naturally, the dollar exchange rate plays a decisive role here and competitiveness would be reduced if the dollar were to fall vis-à-vis the currency of the biofuel-producing countries.25 Data from USDA Foreign Agricultural Service, Brazil, Sugar Reports 2002 and 2005, GAIN Reports Numbers BR2008 and BR5020 (http://www.fas.usda.gov/htp/news/news05/2005percent20archive.htm).26 Peru,Colombia,CentralAmerica,India,Thailand,Australia,SouthAfrica,Zimbabwe:http://earth-policy.org/Updates/2005/update4927 http://www.portalunica.com.br/referencia/estatisticas.jsp

64
The real boost to world trade will likely continueto come from the growing import requirements ofthe importing developing countries, both the majorimporters(seelistinTable3.13)andothersthatwillbebecomingsuch.Thetransitioncountrieswillcontinuetoincrease their imports thoughnotasfastas in thepast,inparticularbecauseRussia,theworld’slargestimporter(net imports 5.4million tonnes in 1999/01, 73 percentofconsumption),will likelymove towardshigher self-sufficiency(Gudosnikov,2001),givenalsosomedeclineinaggregateconsumptionreflectingitsalreadyhighpercapitaconsumptionandfallingprojectedpopulation.
3.7 Concluding remarks
Thefuturemayseesomedrasticdecline in thegrowthof world agriculture. The slowdown reflects the lowerpopulation growth and the gradual attainment ofmedium-high levels of per capita consumption in agrowingnumberofcountries.The latterfactorrestrictsthe scope for further growth in demand per capita inseveralcountrieswhichfuelledmuchofthegrowthinthehistoricalperiod,foremostamongthemChina.Incontrast,developingcountriesthatexperiencedslowgrowthinthepast(andasresultstillhavelowpercapitaconsumption-lessthan2700kcal/person/dayandpotentialforfurthergrowth)shouldnotexperienceanyslowdownbutrathersomeacceleration.
Increasingly,worldagriculturemayhave todependon non-food uses of its produce if growth rates arenot to be sharply lower compared with the past. Thebiofuels sector may provide some scope, perhaps asignificantone, for relaxing theconstraints representedbythedeclininggrowthratesofthedemandforhumanconsumption. For themoment, biofuels from differentcrops in the different countries28 are not generallycompetitivewithoutsubsidiesevenattheUS$60/barrelpricesof oil,with the exceptionof ethanol fromsugarcane in Brazil. This is true also for other countriesproducingsugarcane(orhavethepotentialtodoso),as
manyofthemdonothavetheappropriatecombinationoflandresourcesandproductivity,agriculturalpractices,infrastructureandtechnologicalprowessofBrazil.Still,theseconditionsarenotimmutableand“thisexperiencewith ethanol in Brazil could be replicated in otherdeveloping countries” (UNCTAD, 2005: 17). Africa,with its significant sugar cane production potential, isoften cited as a region that could profit from Brazil’sexperience and technology29, though obstacles torealizing it (infrastructure, institutional,etc) shouldnotbe underestimated. Eventually, the competitiveness ofbiofuelsmaybefurtherenhanced(thoughnotbymuch–KojimaandJohnson,2005)ifthesavingsofgreenhousegas emissions resulting from substituting biofuels forpetroleum-basedfuelsweretobemonetizedintheformoftradablecarboncredits(CertifiedEmissionReductionsof greenhouse gases) through the Clean DevelopmentMechanismundertheprovisionsoftheKyotoProtocol.
Notwithstandingtheuncertaintiesaboutthefutureofbiofuels, the issueofalternativeenergysources isveryalive and questions are increasingly asked about thepotential of world agriculture to become a significantsourceofbiomassfeedstocks(KojimaandJohnson,2005;Smeetset al.,2004).Althoughatpresentthepromotionofbiofuelsinseveralindustrializedcountriesservestheadditional(perhapstheprincipal)objectiveofsupportingtheiragricultures(hencerestrictionsinimportsofbiofuelsareusuallyanintegralpartofsuchpolicies),inthefutureitcanhavesignificanteffectsonworldagricultureasitcanoffernoveldevelopmentopportunitiesforcountrieswithamplelandresources,e.g.severalcountriesinsub-SaharanAfrica, LatinAmerica andSouth-EastAsia, ifbarrierstotradeofbiofuelswereeased.
At the same time as offering novel developmentopportunities,theissueofpossiblecompetitionbetweenuses of agricultural resources for energy vs. food willbebecomingincreasinglyrelevant.Traditionalfoodandfibreuseoflandmayloseoutinthiscompetitionsimplybecause,onthemargin,thepotentialmarketforenergyishugeinrelationtothatforfood,eventuallyleadingtorisingfoodprices.Thelattermaynotdentthewelfareof
28 Other crops currently used as feedstocks for ethanol production include sugar beets and cereals (mainly in Europe – the latest EU projections make an allowance for 1.5 million tonnes of cereals to be used for bioenergy production in 2012 - European Commission, 2005b) and maize (mainly in the USA, where strong growth is foreseen for the next 10 years when maize use for ethanol may reach 23 percent of production, i.e. more that twice present levels and surpassing exports as a major outlet for the crop– USDA, 2006), while cassava is a promising candidate in countries like Thailand. Vegetable oils (mainly soybean oil in the USA and rapeseed oil in Europe) are also used in the production of biodiesel, while palm oil is considered to have a competitive edge over other oils. Among these crops, sugar cane has the advantage that its main by-product (bagasse) is used in the production of electricity thus making the ethanol distilleriesvirtuallyself-sufficientinenergy.29 Feature story on the World Bank President’s visit to Brazil, 20 December 2005 (http://web.worldbank.org/wbsite/external/news/ 0,,contentMDK:20764365~menuPK:34457~pagePK:34370~piPK:34424~theSitePK:4607,00.html)
65
thosewhocanaffordtopayhigherpricesforbothfoodand fuel, including the population groups that benefitfromthedevelopmentofbiofuels.However,lowincomeconsumersthatdonotparticipateinsuchgainsmaybeadverselyaffectedintheiraccesstofood.And,ofcourse,the environmental implications, e.g. deforestation, offurtherexpansionofagriculturefortheproductionofthefeedstockcropshavetobeaccountedforinthedrawingupofthebalancesheetoftheprosandconsoftheenergysectordemandsspillingoverintoagriculture.Pressuresfromtheexpansionofbiofuelsonfoodcropagriculturemay be somewhat mitigated by the prospect thateventuallytheadvancementof technologywouldmakepossibleeconomicproductionof“cellulosic”ethanol.Thelatterusesasfeedstocklignocellulosicbiomass(grasses,wood, but also crop residues) that could be grown onlandwithlimitedfoodcropproductionpotential.
Itistooearlytodealfullywiththisimportantsubject,particularly in the light of uncertainties concerning theoilprice levelsatwhichalternativeenergysourcesotherthan biofuels (e.g. nuclear, solar, wind, etc) becomecompetitive30. However, the issues of alternative energysourcesandthepotentialofagricultureasasourceofthebiomassfeedstocksfortheproductionofliquidfuelswillcontinuetodrawinterest.Ourconventionalprojectionsto2050areafirstandnecessarystepinaddressingit:theycanhelpestablishhowmuchmorefoodandrelatedagriculturalresourcestheworldmayneedinthelongertermfutureandinwhichcountries–avaluableinputintoanyevaluationofthepotentialfordivertingagriculturalresourcestootherusesandwhatthismayimplyforfoodsecurity.
30 Work is underway in the Global Perspective Studies Unit at FAO.

66
Appendix: Countries1 and commodities
AngolaBeninBotswanaBurkina FasoBurundiCameroonCentral Afr. Rep.ChadCongoCôte d’IvoireDem. Rep. of CongoEritreaEthiopiaGabonGambiaGhanaGuineaKenyaLesothoLiberiaMadagascarMalawiMaliMauritaniaMauritiusMozambiqueNamibiaNigerNigeriaRwandaSenegalSierra LeoneSomaliaSudanSwazilandTogoUgandaUnited Rep. of TanzaniaZambiaZimbabwesub-Saharan Africa, other2
ArgentinaBoliviaBrazilChileColombiaCosta RicaCubaDominican Rep.EcuadorEl SalvadorGuatemalaGuyanaHaitiHondurasJamaicaMexicoNicaraguaPanamaParaguayPeruSurinameTrinidad and TobagoUruguayVenezuelaLatin America, other3
AfghanistanAlgeriaEgyptIran, Islamic Rep.IraqJordanLebanonLibyan Arab Yam.MoroccoSaudi ArabiaSyrian Arab Rep.TunisiaTurkeyYemenNear East, other4
BangladeshIndiaMaldivesNepalPakistanSri Lanka
East Asia
CambodiaChinaDem. Rep. of KoreaIndonesiaLaoMalaysiaMongoliaMyanmarPhilippinesRep. of KoreaThailandViet NamEast Asia, other5
Africa, sub-Saharan Latin America and Near East/North Africa South Asia Caribbean
Developing Countries
1 Country groups marked with asterisk (*) were treated in the analysis as one aggregate. 2 Cape Verde, Comoros, Djibouti, Guinea Bissau, Sao Tomé and Principe, Seychelles.3 Antigua,Bahamas,Barbados,Belize,Dominica,Grenada,NetherlandAntilles,SaintKittsandNevis,SaintLucia,SaintVincent/Grenadines,Bermuda.4 Cyprus, Kuwait, United Arab Emirates.5 Brunei, Macau, Solomon Islands, Fiji, French Polynesia, New Caledonia, Vanuatu, Papua New Guinea, Kiribati.

67
Industrial countries
AustriaBelgiumDenmarkFinlandFranceGermanyGreeceIrelandItalyLuxembourgNetherlandsPortugalSpainSwedenUnited Kingdom
IcelandMaltaNorwaySwitzerlandIsraelJapanSouth AfricaAustraliaNew ZealandCanadaUnited States
European Union-15* Other Industrial Countries
Transition countries
Countries in the European Union* Central Asia* Other Eastern Europe*
Russian Federation
Czech RepublicEstoniaHungaryLatviaLithuaniaPolandSlovakia Slovenia
ArmeniaAzerbaijanGeorgiaKazakhstanKyrgyzstanTajikistanTurkmenistanUzbekistan
AlbaniaBosnia and HerzegovinaBulgariaCroatiaRomaniaMoldova RepublicThe Former Yugoslav Rep. of MacedoniaSerbia and MontenegroBelarusUkraine
Annex

68
Commodities covered
WheatRice, paddyMaizeBarleyMilletSorghumOther cerealsPotatoesSweet potatoes and yamsCassavaOther rootsPlantainsSugar, raw1
PulsesVegetablesBananasCitrus fruitOther fruitVegetable oil and oilseeds (in vegetable oil equivalent)2
Cocoa beansCoffeeTeaTobaccoCotton lintJute and hard fibresRubber
Beef, veal and buffalo meatMutton, lamb and goat meatPig meatPoultry meatMilk and dairy products (in whole milk equivalent)Eggs
Crops Livestock
1 Sugar production in the developing countries analyzed separately for sugar cane and sugar beet.
2 Vegetableoilproductioninthedevelopingcountriesanalyzedseparatelyforsoybeans,groundnuts,sesameseed,coconuts,sunflowerseed,palm oil/palm-kernel oil, rapeseed, all other oilseeds.
Note on Commodities
Allcommoditydataandprojectionsinthisreportareexpressedintermsofprimaryproductequivalentunlessstatedotherwise.Historicalcommoditybalances(SupplyUtilizationAccounts-SUAs)areavailableforabout160primaryand170processedcropandlivestockcommodities.Toreducethisamountofinformationtomanageableproportions,alltheSUAdatawereconvertedtothecommodityspecificationgivenaboveinthelistofcommodities,applyingappropriateconversionfactors(andignoringjointproductstoavoiddoublecounting:e.g.wheatflourisconvertedbackintowheatwhilewheatbranisignored).Inthisway,oneSupplyUtilizationAccountinhomogeneousunitsis derived for each of the commodities of the study.Meat production refers to indigenousmeat production, i.e.productionfromslaughteredanimalsplusthemeatequivalentofliveanimalexportsminusthemeatequivalentofallliveanimalimports.Cerealsdemandandtradedataincludethegrainequivalentofbeerconsumptionandtrade.
ThecommoditiesforwhichSUAswereconstructedarethe26cropsand6thelivestockproductsgiveninthelistabove.Theproductionanalysisforthedevelopingcountrieswas,however,carriedoutfor34cropsbecausesugarandvegetableoilsareanalyzedseparately(forproductionanalysisonly)forthe10cropsshowninthefootnotetothelist.

69
References
Alexandratos, N.(ed.)(1988),World Agriculture: Towards 2000, an FAO Study,BelhavenPress,Londonand NewYorkUniversityPress,NewYork.
Alexandratos, N.(ed.)(1995),World Agriculture: Towards 2010, an FAO Study,J.WileyandSons,Chichester,UKandFAO,Rome.
Alexandratos N.(2005),“CountrieswithRapidPopulationGrowthandResourceConstraints:IssuesofFood,Agriculture,andDevelopment”,Population and Development Review,June,31(2):237–258.
Alexandratos, N.(2006),“TheMediterraneanDietinaWorldContext”,Public Health Nutrition, 9(1A):111–117.
Babaleye, T. (2005),“CanCassavaSolveAfrica’sFoodCrisis?”,African Business,314:24-25.
Baron, P.(2001),Roundup of key developments and issues that will shape the future of world and Asian sugar industries,paperforthe7thAsiaInternationalSugarConference,Bangkok,29-31August,2001,InternationalSugarOrganization,London.
Bruinsma J.,(ed.)(2003),World Agriculture: Towards 2015/30,an FAO Perspective,London:Earthscan andRome:FAO.
Delgado, C., Rosegrant, M., Steinfeld, H., Ehui S. and C. Courbois(1999),Livestock to 2020: The next food revolution,Food,Agriculture,andtheEnvironmentDiscussionPaper28,IFPRI,Washington,D.C.
Dev, Mahendra S., C. Ravi, B.Viswanathan, A. Gulati and S. Ramachander,(2004),Economic Liberalisation, Targeted Programmes and Household Food Security: A Case Study Of India,MTIDDiscussionPaperNo.68,IFPRI,Washington,D.C.
European Commission(2005a),Reforming the European Union’s Sugar Policy: Update of Impact Assessment,[SEC(2005)808],Brussels.
European Commission(2005b),Prospects for Agricultural Markets and Income 2005 – 2012: Update for the EU-25,Brussels(December).
European Commission(2005c),Biomass Action Plan,[SEC(2005)1573],Brussels.
Evenson, R.(2002),Technology and Prices in Agriculture,PaperfortheFAOConsultationonAgriculturalCommodityPrices,Rome,25-26March(FAO,CommoditiesandTradeDivision).
Evenson, R.(2004),“FoodandPopulation:D.GaleJohnsonandtheGreenRevolution”,Economic Development and Cultural Change.52,3.
FAPRI(2005),U.S. and World Agricultural Outlook,FoodandAgriculturalPolicyResearchInstitute,IowaStateUniversity(StaffReport1-05).
FAO(1990),Roots, Tubers, Plantains and Bananas in Human Nutrition,Rome.
FAO(1996a),Food, Agriculture and Food Security: Developments since the World Food Conference and Prospects,TechnicalBackgroundDocumentNo1fortheWorldFoodSummit,Rome.
FAO(1996b),The Sixth World Food Survey,Rome.
FAO(1999),The State of Food Insecurity in the World 1999,Rome.
FAO(2000),The State of Food Insecurity in the World 2000,Rome.
FAO(2001),The State of Food Insecurity in the World 2001,Rome.
FAO(2004a),The State of Food Insecurity in the World 2004,Rome.
FAO(2004b),Human Energy Requirements,ReportofaJointFAO/WHO/UNUExpertConsultation, FAOFoodandNutritionTechnicalReportSeriesNo1,Rome.

70
FAO(2004c),Critical Review of China’s Cereal Supply and Demand and Implications for World Markets,DocumentCCP:GR-RI/04/2,Rome.
Fischer, G., van Velthuizen, H., F. Nachtergaele, F. and M. Shah(2002),Global Agro-ecological Assessment for Agriculture in the 21st Century: Methodology and Results,RR-02-02,IIASA,Laxenburg,AustriaandFAO,Rome(datatablesinhttp://www.iiasa.ac.at/collections/IIASA_Research/Research/LUC/GAEZ/index.htm).
Gudosnikov, S.(2001),“Russia – World’s Leading Importer for Ever?”,paperforthe10thInternationalISOSeminar,London,27-28November2001,InternationalSugarOrganization,London.
Henry, G., Westby A. and C. Collinson(1998),Global Cassava End-Uses and Markets: Current Situation and Recommendations for Further Study.ReporttoFAObytheEuropeangrouponroot,tuberandplantainscoordinatedbyDrGuyHenry,CIRAD.
Hopper, G.(1999),“ChangingFoodProductionandQualityofDietinIndia,1947-98”,Population and Development Review,25(3):443-447.
Kantor, L.(1998),A Dietary Assessment of the US Food Supply: Comparing Per Capita Food Consumption with Food Guide Pyramid Serving Recommendations,AgriculturalEconomicsReportNo.772.Washington,DC: USDepartmentofAgriculture.
Kojima, M. and T. Johnson(2005),Potential for Biofuels for Transport in Developing Countries,WorldBank,Washington,D.C.
Keyzer, M., M. Merbis and F. Pavel(2001),Can We Feed the Animals? Origins and Implications of Rising Meat Demand,CenterforWorldFoodStudies,Amsterdam.
Landes, M., Persaud, S. and J. Dyck (2004),India’sPoultrySector:DevelopmentandProspects,WRS-04-03,USDA,Washington,D.C.
Lebre la Rovere, E. (2004),The Brazilian Ethanol Program: Biofuels for Transport,PaperfortheInternationalConferenceforRenewableEnergy,Bonn.
Lipton, M. (1999),Reviving Global Poverty Reduction - What role for Genetically Modified Plants?,1999 SirJohnCrawfordMemorialLecture,CGIARInternationalCentersWeek,28October1999,Washington,D.C.
Ma, Hengyun, Jikun Huang and Scott Rozelle(2004)“ReassessingChina’sLivestockStatistics:AnAnalysis ofDiscrepanciesandtheCreationofNewDataSeries”,Economic Development and Cultural Change, 52,2:445-473.
Meenakshi J. V. and B. Vishwanathan (2003),“CalorieDeprivationinRuralIndia,1983-1999/2000”,Economic and Political Weekly,January25.
Minhas, B. S.(1991),‘OnEstimatingtheInadequacyofEnergyIntakes:RevealedFoodConsumptionBehaviourVersusNutritionalNorms(NutritionalStatusofIndianPeoplein1983)’,Journal of Development Studies, 28(1):1-38.
Naiken, L. (2003),“FAOMethodologyforEstimatingthePrevalenceofUndernourishment”,inFAO(2003),Measurement and Assessment of Food Deprivation and Undernutrition,ProceedingsofanInternationalScientificSymposium,Rome,26-28June2002.
Nweke, F (2004),New Challenges in the Cassava Transformation in Nigeria and Ghana,EptdDiscussionPaperNo.118,IFPRI,WashingtonD.C.
Nweke, F., Spencer D and J. Lynam(2002),The Cassava Transformation: Africa’s Best Kept Secret. Lansing, Mich.,USA:MichiganStateUniversityPress.
OECD (2002),Report on Policy Reform in the Sugar Sector,DocumentAGR/CA/APM(2001)32/Rev1,Paris
OECD(2005a),Biofuels,OECD,Paris.
OECD(2005b),OECD-FAO Agricultural Outlook, 2005-2014,OECD,Paris.
OECD(2006),Agricultural Market Impacts of Future Growth in the Production of Biofuels(AGR/CA/APM(2005)24/FINAL),Paris.
Paroda R.S. (2001),“Food,NutritionandEnvironmentalSecurity”,PresidentialAddress,IndianScienceCongressAssociation,January3,2001[http://isc2001.nic.in].

71
Plucknett, D.L., Phillips. T.P. and R.B. Kagbo, (2001),“ADevelopmentStrategyforCassava:TransformingaTraditionalTropicalRootCrop”,Proceedings of the Validation Forum of the Global Cassava Development Strategy,Rome26-28April2000,FAO,Rome.
Rao, Hanumantha C. H.(2000),“DecliningDemandforFoodgrainsinRuralIndia:CausesandImplications”Economic and Political WeeklyJanuary22,2000.
Saha, Anamitra A. (2000),“PuzzleofDecliningRuralFoodgrainsConsumption”,Economic and Political Weekly,July1.
Schmidhuber J. and P. Shetty(2005),“TheNutritionTransitionto2030,WhyDevelopingCountriesAreLikelytoBeartheMajorBurden”,Plenarypaperpresentedatthe97thSeminaroftheEuropeanAssociationofAgriculturalEconomists,UniversityofReading,England,21-22April,2005(http://www.fao.org/es/esd/gstudies.htm).
Scott, G., Rosegrant, M. and C. Ringler, (2000),Roots and Tubers for the 21st Century: Trends, Projections and Policy Options.Washington,DC,IFPRIandLima,Peru,CIP.
Sen, P. (2005),“OfCaloriesandThings:ReflectionsonNutritionalNorms,PovertyLinesandConsumptionBehaviourinIndia”,Economic and Political Weekly(October22):4611-18.
Shariff, A. and A.C. Mallick (1999),“DynamicsofFoodIntakeandNutritionbyExpenditureClassinIndia”,Economic and Political Weekly,July3-9,1999.
Shetty, P. (2002),“NutritionTransitioninIndia”,Public Health Nutrition,5(1A):175–182.
Smeets, E., A. Faaij and I. Lewandowski (2004),A Quickscan of Global Bio-Energy Potentials to 2050,CopernicusInstitute-UtrechtUniversity.
Svedberg, P.(2001),“Undernutritionoverestimated”,SeminarPaperno.693,InstituteforInternationalEconomicStudies,StockholmUniversity,Stockholm.
UN (2003),World Population Prospects: The 2002 Revision,UnitedNations,NewYork.
UN (2004),World Population to 2300,UnitedNations,NewYork.
UN(2005a),World Population Prospects, the 2004 Revision: Highlights, United Nations,NewYork.
UN(2005b),The Millennium Development Goals Report 2005,UnitedNations,NewYork.
UNCTAD (2005),Biofuels – Advantages and Trade Barriers,(UNCTAD/DITC/TED/2005/1),UnitedNations,NewYork.
USDA(2006),USDA Agricultural Baseline Projections to 2015,BaselineReportOCE-2006-1,USDA,Washington,D.C.
WHO(2003),Diet, Nutrition and the Prevention of Chronic Diseases: Report of a Joint WHO/FAO Expert Consultation,WHOTechnicalReportSeries916,WorldHealthOrganization,Geneva.
World Bank(2000),“Commoditiesinthe20thCentury”,Global Commodity Markets,No1,January2000,Washington,D.C.
World Bank (2002),Global Economic Prospects and the Developing Countries 2002,Washington,D.C.
World Bank(2004),World Development Indicators, 2004—CDROM,Washington,D.C.
World Bank(2005),Global Development Finance, 2005.Washington,D.C.
World Bank (2006),Global Economic Prospects, 2006.Washington,D.C.
References