Embed Size (px)
Citation preview
Oracle® CloudWorking with Planning for Oracle EnterprisePlanning and Budgeting Cloud
E94270-08
Oracle Cloud Working with Planning for Oracle Enterprise Planning and Budgeting Cloud,
E94270-08
Copyright © 2016, 2018, Oracle and/or its affiliates. All rights reserved.
Primary Author: EPM Information Development Team
This software and related documentation are provided under a license agreement containing restrictions onuse and disclosure and are protected by intellectual property laws. Except as expressly permitted in yourlicense agreement or allowed by law, you may not use, copy, reproduce, translate, broadcast, modify,license, transmit, distribute, exhibit, perform, publish, or display any part, in any form, or by any means.Reverse engineering, disassembly, or decompilation of this software, unless required by law forinteroperability, is prohibited.
The information contained herein is subject to change without notice and is not warranted to be error-free. Ifyou find any errors, please report them to us in writing.
If this is software or related documentation that is delivered to the U.S. Government or anyone licensing it onbehalf of the U.S. Government, then the following notice is applicable:
U.S. GOVERNMENT END USERS: Oracle programs, including any operating system, integrated software,any programs installed on the hardware, and/or documentation, delivered to U.S. Government end users are"commercial computer software" pursuant to the applicable Federal Acquisition Regulation and agency-specific supplemental regulations. As such, use, duplication, disclosure, modification, and adaptation of theprograms, including any operating system, integrated software, any programs installed on the hardware,and/or documentation, shall be subject to license terms and license restrictions applicable to the programs.No other rights are granted to the U.S. Government.
This software or hardware is developed for general use in a variety of information management applications.It is not developed or intended for use in any inherently dangerous applications, including applications thatmay create a risk of personal injury. If you use this software or hardware in dangerous applications, then youshall be responsible to take all appropriate fail-safe, backup, redundancy, and other measures to ensure itssafe use. Oracle Corporation and its affiliates disclaim any liability for any damages caused by use of thissoftware or hardware in dangerous applications.
Oracle and Java are registered trademarks of Oracle and/or its affiliates. Other names may be trademarks oftheir respective owners.
Intel and Intel Xeon are trademarks or registered trademarks of Intel Corporation. All SPARC trademarks areused under license and are trademarks or registered trademarks of SPARC International, Inc. AMD, Opteron,the AMD logo, and the AMD Opteron logo are trademarks or registered trademarks of Advanced MicroDevices. UNIX is a registered trademark of The Open Group.
This software or hardware and documentation may provide access to or information about content, products,and services from third parties. Oracle Corporation and its affiliates are not responsible for and expresslydisclaim all warranties of any kind with respect to third-party content, products, and services unless otherwiseset forth in an applicable agreement between you and Oracle. Oracle Corporation and its affiliates will not beresponsible for any loss, costs, or damages incurred due to your access to or use of third-party content,products, or services, except as set forth in an applicable agreement between you and Oracle.
Contents
Documentation Accessibility
Documentation Feedback
1 Welcome to Oracle Enterprise Planning and Budgeting Cloud
About Oracle Enterprise Planning and Budgeting Cloud 1-1
About Integrating Business Processes 1-2
Learning More About Oracle Enterprise Planning and Budgeting Cloud 1-3
2 Familiarizing Yourself With Oracle Enterprise Planning andBudgeting Cloud
Navigating in Oracle Enterprise Planning and Budgeting Cloud 2-1
About Driver-Based Planning, Trend-Based Planning, and Direct Input 2-2
3 Working With Financials
Task Overview 3-1
Setting User Variables 3-3
About Specifying Driver Values 3-4
About Trends 3-4
Planning Using a Rolling Forecast 3-5
Planning at the Weekly Level 3-7
Planning Revenue and Expense 3-7
Specifying Drivers and Trends 3-9
Manually Entering Expenses and Revenues 3-10
Viewing Your Total Plan and Forecast 3-10
Viewing Your Income Statement 3-11
Planning Using Balance Sheets 3-11
Specifying Balance Sheet Drivers 3-13
Specifying Assets and Liabilities for Direct Balance Sheet 3-13
iii
About Using Cash Flow and Balance Sheet Balance 3-14
Viewing Your Total Plan and Forecast 3-14
Planning Using Cash Flow 3-14
Specifying Driver-Based Cash Use and Source Assumptions 3-14
Entering Financing and Investing Details 3-15
Running Financials Rules 3-16
Analyzing Financials with Dashboards 3-16
Analyzing Your Financials 3-16
Reviewing Forms and Instructions 3-17
Reviewing Data from Workforce, Projects, and Capital 3-17
4 Working With Workforce
Task Overview 4-1
Setting User Variables 4-3
Managing Compensation Expenses 4-4
Managing Hiring Requisitions 4-4
Adding Hiring Requisitions 4-5
Updating Hiring Requisitions 4-6
Updating Employee Compensation 4-7
Changing an Employee's Status 4-7
Hiring Employees 4-8
Planning an Employee's Departure 4-8
Transferring Employees 4-8
Planning Merit Rates 4-9
Calculating Compensation Expenses 4-10
Synchronizing Defaults 4-11
Troubleshooting a Rule's Error Message 4-11
Managing Non Compensation Expenses 4-12
Strategic Workforce Planning 4-12
Managing Demographics 4-13
Analyzing Workforce Expenses 4-13
Reporting on Data 4-14
Analyzing Project Utilization 4-14
5 Working With Projects
Task Overview 5-1
Setting User Variables 5-3
Adding Projects and Entering Project Details 5-4
Entering Project Assumptions 5-5
iv
Planning Expenses 5-6
Planning Revenue 5-9
Defining Revenue Recognition Obligation Details 5-12
Capitalizing Projects 5-13
Running Project Rules 5-14
Using Rolling Forecast with Projects 5-14
Preparing Forecast Data 5-14
Analyzing Project Financials With Dashboards 5-15
Analyzing Project EVM 5-16
Analyzing Project Performance 5-17
Reviewing Forms and Instructions 5-18
6 Working With Capital
Task Overview 6-1
Setting User Variables 6-2
Entering Capital Asset Assumptions 6-3
Managing New Capital Investments 6-4
Managing Existing Assets 6-8
Managing Intangibles 6-10
Analyzing Capital Financials with Dashboards 6-12
Analyzing Capital Asset Financials 6-12
7 Working With Strategic Modeling
Task Overview 7-1
Working with Templates 7-3
Working with Models 7-4
Managing Models 7-4
Creating a Strategic Modeling Model 7-4
Opening, Checking Out, and Deleting Models 7-6
Working in the Account View 7-6
Working with Account Groups 7-8
Working with Dataviews 7-8
Entering Account Data 7-9
Adding and Deleting Subaccount Members 7-10
Managing and Editing Subaccounts 7-11
Defining the Forecast Method for Accounts 7-12
Specifying a Target Value for an Account 7-18
Performing What-If Analysis with Scenarios 7-21
Determining How Values are Calculated 7-23
v
Working with Reports 7-23
Reviewing Reports 7-24
Creating and Running Consolidations 7-24
Creating a Consolidation 7-25
Defining Business Cases for Consolidations 7-26
Defining Model Characteristics 7-27
Specifying Child Model Attributes 7-27
Specifying Parent Model Attributes 7-28
About Using Input Only Scenarios in Consolidations 7-29
Running a Consolidation 7-30
vi
Documentation Accessibility
For information about Oracle's commitment to accessibility, visit the OracleAccessibility Program website at http://www.oracle.com/pls/topic/lookup?ctx=acc&id=docacc.
Access to Oracle Support
Oracle customers that have purchased support have access to electronic supportthrough My Oracle Support. For information, visit http://www.oracle.com/pls/topic/lookup?ctx=acc&id=info or visit http://www.oracle.com/pls/topic/lookup?ctx=acc&id=trsif you are hearing impaired.
vii
Documentation Feedback
To provide feedback on this documentation, send email to [email protected],or, in an Oracle Help Center topic, click the Feedback button located beneath theTable of Contents (you may need to scroll down to see the button).
Follow EPM Information Development on these social media sites:
LinkedIn - http://www.linkedin.com/groups?gid=3127051&goback=.gmp_3127051
Twitter - http://twitter.com/hyperionepminfo
Facebook - http://www.facebook.com/pages/Hyperion-EPM-Info/102682103112642
Google+ - https://plus.google.com/106915048672979407731/#106915048672979407731/posts
YouTube - https://www.youtube.com/oracleepminthecloud
Documentation Feedback
viii
1Welcome to Oracle Enterprise Planningand Budgeting Cloud
Related Topics
• About Oracle Enterprise Planning and Budgeting Cloud
• About Integrating Business Processes
• Learning More About Oracle Enterprise Planning and Budgeting Cloud
About Oracle Enterprise Planning and Budgeting CloudOracle Enterprise Planning and Budgeting Cloud provides complete, planning andbudgeting solutions for Financials, Workforce, Capital, and Projects. These businessprocesses include built-in best practice predefined content including forms,calculations, dashboards, drivers, and key performance indicators (KPIs). Forms aredesigned to integrate with the dashboards and reports that dynamically reflect yourdata, plans, and forecasts.
About the business processes:
• Financials—Integrated driver-based planning for income statement, balance sheet,and cash flow. The out-of-box tools, such as KPIs, drivers, and accounts help youprepare reports faster. You can also use Financials to perform expense andrevenue planning.
Watch this overview video to learn more about Financials.
Overview Video.
• Workforce—Headcount and compensation planning to link financial plans with theworkforce plan. Budget for future headcount and related personnel expenses suchas salary, benefits, and taxes.
Watch this overview video to learn more about Workforce.
Overview Video.
• Projects—Bridge the gap between project planning systems and the financialplanning process. Assess the impact organizational projects and initiatives haveon overall corporate resources, and ensure they align with short and long termfinancial targets.
Watch this overview video to learn more about Projects.
Overview Video.
• Capital—Plan for the long-term impact of capital assets on financial plans.Manage, prioritize, and plan for capital expenses.
1-1
Watch this overview video to learn more about Capital.
Overview Video.
• Strategic Modeling—For long-term strategic planning, this solution combines a setof rich financial forecasting and modeling features with built in on-the-fly scenarioanalysis and modeling capabilities.Watch this overview video to learn more about Strategic Modeling.
Overview Video
You might not see all the features described in this guide depending on what yourAdministrator has enabled. Administrators can incrementally enable some features,which would add additional forms, dashboards, KPIs, rules, and so on.
Watch this overview video to learn more about Oracle Enterprise Planning andBudgeting Cloud.
Overview Video.
About Integrating Business ProcessesDepending on how your administrator set up your application, the administrator canset up business processes to support these scenarios:
• In Financials, see a rollup of Workforce employee details and integrate Workforceexpenses (such as salary, benefits, and so on) into Financials reporting.
• In Financials, see a rollup of Projects details and integrate project expenses andrevenue into your Financials reporting.
• In Financials, see a rollup of Capital asset details and integrate the capital assetdepreciation into Financials reporting.
• In Workforce, see the utilization of employees across projects or on a per projectbasis.
• In Projects, assign project assets to Capital asset classes to capitalize the assets.Assets are moved from Projects to Capital.
• In Projects, use Job Rates from Workforce.
• In Projects, use Equipment Rates from Capital.
Required steps are noted for each business process, for example, when you add anew hire in Workforce or plan a new asset in Capital.
When you are ready to see integrated data, ask your administrator to run the requiredrules and push data. You can review integrated data in these dashboards:
• To see an overview of data rolled up to Financials, see Reviewing Data fromWorkforce, Projects, and Capital.
• To review employee utilization across projects, see Analyzing Project Utilization.
• To review capitalized assets that were pushed from Projects in the New Assetsfrom Projects and Capital Work in Progress dashboards, see Analyzing Capital
Chapter 1About Integrating Business Processes
1-2
Financials with Dashboards. You can also see Asset Usage by Project in adashboard. See Analyzing Capital Asset Financials.
Watch this overview video to learn more about integrating business processes inOracle Enterprise Planning and Budgeting Cloud.
Overview Video.
Learning More About Oracle Enterprise Planning andBudgeting Cloud
To get more information or help about Oracle Enterprise Planning and BudgetingCloud and related services:
• Review best practices and access these videos by clicking or tapping Academy
on the Home page:
– Watch this overview video to learn more about Financials.
Overview Video
– Watch this tutorial video to familiarize yourself with entering data in Financials.
Tutorial Video
– Watch this overview video to learn more about Projects.
Overview Video
– Watch this tutorial video to familiarize yourself with entering data in Projects.
Tutorial Video
– Watch this overview video to learn more about Workforce.
Overview Video
– Watch this tutorial video to familiarize yourself with entering data in Workforce.
Tutorial Video
– Watch this overview video to learn more about Capital.
Overview Video
Chapter 1Learning More About Oracle Enterprise Planning and Budgeting Cloud
1-3
– Watch this overview video to learn more about Oracle Enterprise Planning andBudgeting Cloud.
Overview Video
• To get Help, click the arrow next to your user icon in the upper right corner of thescreen, and then click Help.
• See these related guides on the Help Center (http://docs.oracle.com/cloud/latest/pbcs_common/index.html):
– Getting Started with Oracle Enterprise Performance Management Cloud forUsers
– Working with Planning for Oracle Planning and Budgeting Cloud
Chapter 1Learning More About Oracle Enterprise Planning and Budgeting Cloud
1-4
2Familiarizing Yourself With OracleEnterprise Planning and Budgeting Cloud
Related Topics
• Navigating in Oracle Enterprise Planning and Budgeting Cloud
• About Driver-Based Planning, Trend-Based Planning, and Direct Input
Navigating in Oracle Enterprise Planning and BudgetingCloud
Useful navigation tips:
• To return to the Home page when you’ve navigated away from it, click the Oracle
logo in the upper left corner (or your custom logo) or the Home icon
.
• To see additional administrator tasks in the Navigator, click the horizontal bars
next to the Oracle logo (or your custom logo) .
• Expand a dashboard to full screen by clicking the Show/Hide bar at the top of thedashboard; click it again to return to normal view.
• Hover the cursor in the upper right corner of a form or dashboard to see a menu ofoptions appropriate to the context, such as Actions, Save, Refresh, Settings,
Maximize .
• In a subcomponent for a business process, use the horizontal and vertical tabs toswitch tasks and categories.
For example, use the vertical tabs to switch between reviewing Overviewdashboards and planning Expenses. The vertical tabs are different depending onthe business process and the features that you’ve enabled.
2-1
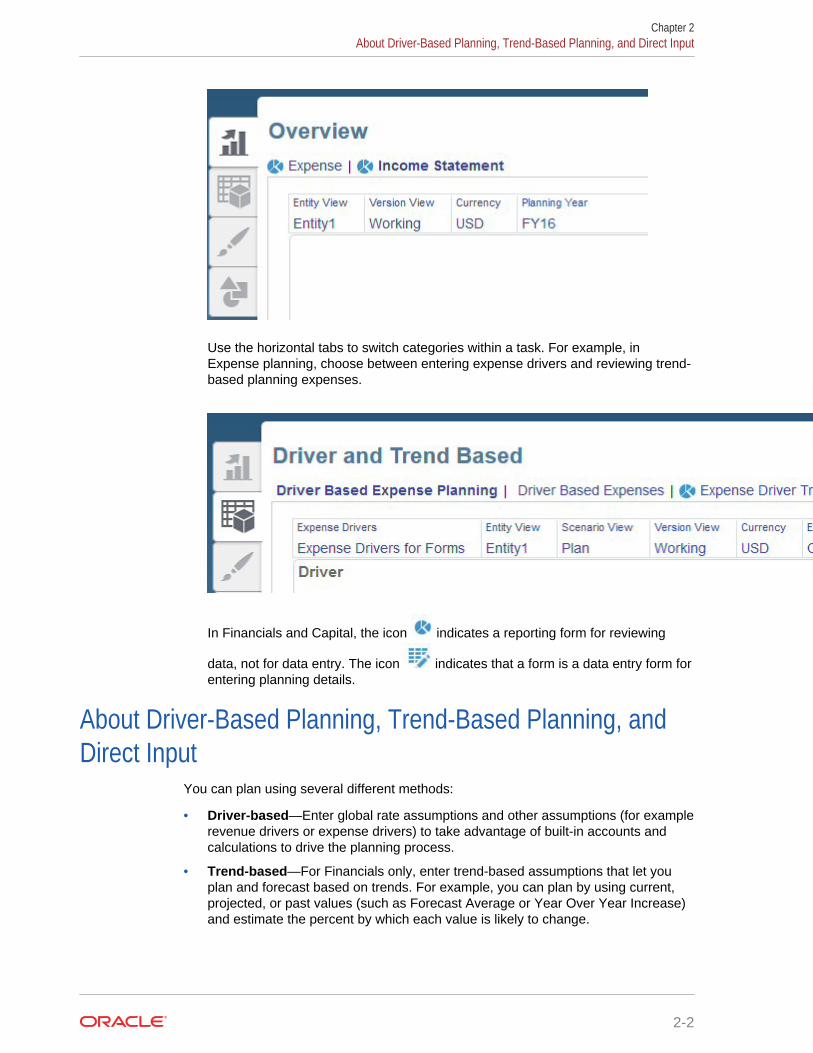
Use the horizontal tabs to switch categories within a task. For example, inExpense planning, choose between entering expense drivers and reviewing trend-based planning expenses.
In Financials and Capital, the icon indicates a reporting form for reviewing
data, not for data entry. The icon indicates that a form is a data entry form forentering planning details.
About Driver-Based Planning, Trend-Based Planning, andDirect Input
You can plan using several different methods:
• Driver-based—Enter global rate assumptions and other assumptions (for examplerevenue drivers or expense drivers) to take advantage of built-in accounts andcalculations to drive the planning process.
• Trend-based—For Financials only, enter trend-based assumptions that let youplan and forecast based on trends. For example, you can plan by using current,projected, or past values (such as Forecast Average or Year Over Year Increase)and estimate the percent by which each value is likely to change.
Chapter 2About Driver-Based Planning, Trend-Based Planning, and Direct Input
2-2

• Direct Entry—Directly enter data, for example if your planning and forecastingdoes not have historic trends or specific business drivers. When you use thisplanning method, no built-in logic is used.
Chapter 2About Driver-Based Planning, Trend-Based Planning, and Direct Input
2-3
3Working With Financials
Related Topics
• Task Overview
• Setting User Variables
• About Specifying Driver Values
• About Trends
• Planning Using a Rolling Forecast
• Planning at the Weekly Level
• Planning Revenue and Expense
• Planning Using Balance Sheets
• Planning Using Cash Flow
• Running Financials Rules
• Analyzing Financials with Dashboards
• Analyzing Your Financials
• Reviewing Data from Workforce, Projects, and Capital
Task OverviewIn general, you'll build your Financials plans and forecasts in this order:
1. Define your user variables. See Setting User Variables. For information aboutspecifying other preference settings, see Working with Planning for OraclePlanning and Budgeting Cloud.
2. Review and adjust driver values for recurring line items. These drivers, enabled byyour administrator, determine how you will set, track, and analyze accounts. Youcan specify driver values using trend assumptions or by direct entry. Then enter,adjust, and calculate your expenses and revenues. You can:
• Set and adjust drivers
• Set and adjust trends
• Manually adjust accounts
See:
• Planning Revenue and Expense
• Planning Using Balance Sheets
• Planning Using Cash Flow
3. Depending on your type of planning, review internal financial statements such asBalance Sheets and Cash Flow statements.
4. Ask your administrator to run the Rollup rule.
3-1
5. Get a status of your department’s or the total business financials, key trends, and
KPIs using the interactive dashboards on the Overview tab. See Analyzing Financials with Dashboards.
6. Evaluate your financials using the provided dashboards and analysis forms. See Analyzing Your Financials.To include Workforce, Capital, or Projects in your dashboards, have youradministrator define data maps to make your other types of planning data anddetails available.
Note:
You might not see all the features described in this section, depending onwhat your Administrator has enabled.
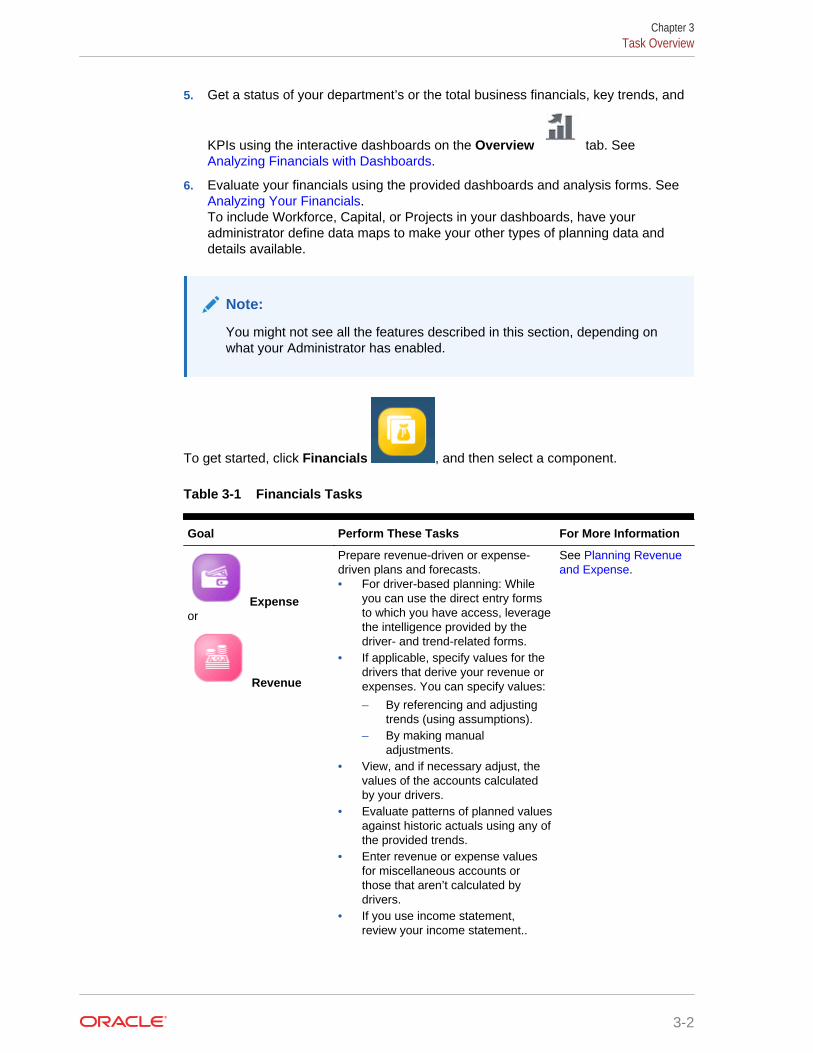
To get started, click Financials , and then select a component.
Table 3-1 Financials Tasks
Goal Perform These Tasks For More Information
Expenseor
Revenue
Prepare revenue-driven or expense-driven plans and forecasts.• For driver-based planning: While
you can use the direct entry formsto which you have access, leveragethe intelligence provided by thedriver- and trend-related forms.
• If applicable, specify values for thedrivers that derive your revenue orexpenses. You can specify values:
– By referencing and adjustingtrends (using assumptions).
– By making manualadjustments.
• View, and if necessary adjust, thevalues of the accounts calculatedby your drivers.
• Evaluate patterns of planned valuesagainst historic actuals using any ofthe provided trends.
• Enter revenue or expense valuesfor miscellaneous accounts orthose that aren’t calculated bydrivers.
• If you use income statement,review your income statement..
See Planning Revenueand Expense.
Chapter 3Task Overview
3-2
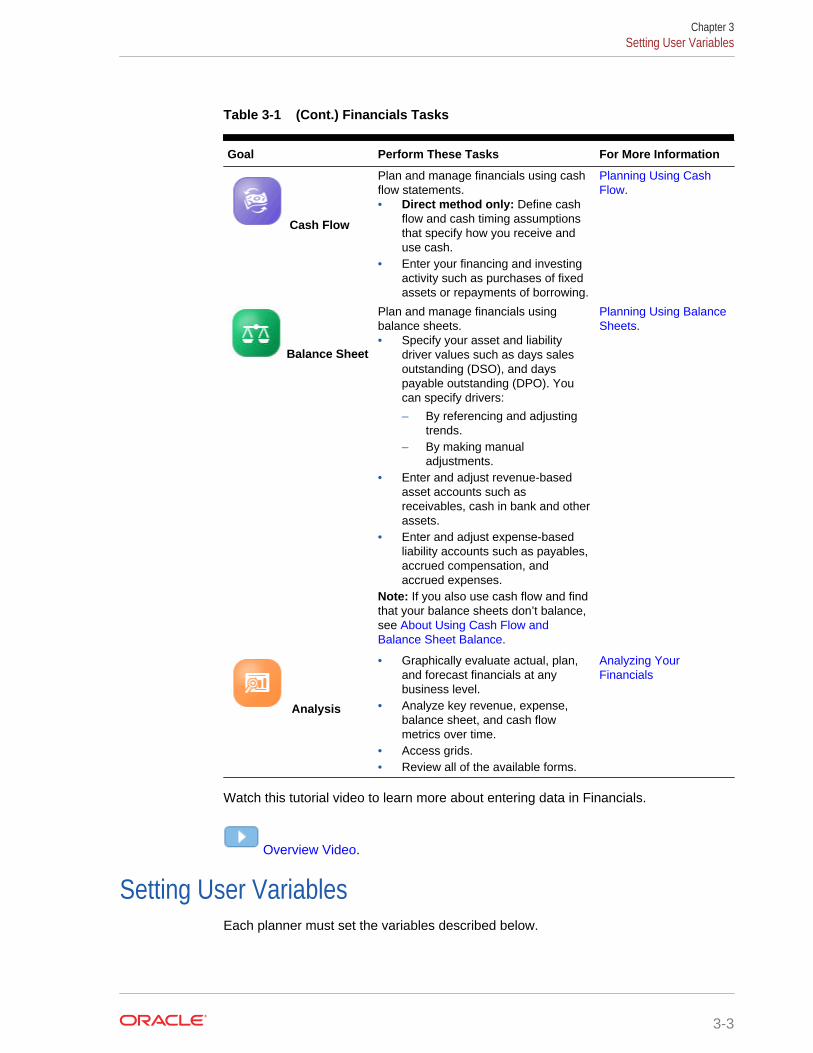
Table 3-1 (Cont.) Financials Tasks
Goal Perform These Tasks For More Information
Cash Flow
Plan and manage financials using cashflow statements.• Direct method only: Define cash
flow and cash timing assumptionsthat specify how you receive anduse cash.
• Enter your financing and investingactivity such as purchases of fixedassets or repayments of borrowing.
Planning Using CashFlow.
Balance Sheet
Plan and manage financials usingbalance sheets.• Specify your asset and liability
driver values such as days salesoutstanding (DSO), and dayspayable outstanding (DPO). Youcan specify drivers:
– By referencing and adjustingtrends.
– By making manualadjustments.
• Enter and adjust revenue-basedasset accounts such asreceivables, cash in bank and otherassets.
• Enter and adjust expense-basedliability accounts such as payables,accrued compensation, andaccrued expenses.
Note: If you also use cash flow and findthat your balance sheets don’t balance,see About Using Cash Flow andBalance Sheet Balance.
Planning Using BalanceSheets.
Analysis
• Graphically evaluate actual, plan,and forecast financials at anybusiness level.
• Analyze key revenue, expense,balance sheet, and cash flowmetrics over time.
• Access grids.• Review all of the available forms.
Analyzing YourFinancials
Watch this tutorial video to learn more about entering data in Financials.
Overview Video.
Setting User VariablesEach planner must set the variables described below.
Chapter 3Setting User Variables
3-3
1. From the Home page, click Tools , then User Variables .
2. Set up these user variables that are required for all business processes:
• Entity
• Scenario
• Version
• Reporting Currency
• Years
For Financials, set these user variables for the Account dimension:
• For the OFS_Expense Account variable, select OFS_Total OtherExpenses.
• For the OFS_Expense Drivers variable, select OFS_Expense Drivers forForms.
Capital, Workforce, and Projects have their own dynamic variables (defined with theUse Context option), which allow user variables to be used in the Point of View. Withdynamic variables, the value of the user variable changes dynamically based on thecontext of the form, and users don’t need to set the default value.
About Specifying Driver ValuesBefore building a plan or forecast, verify and if needed adjust the key drivers, enabledby your administrator, that derive revenues and expenses. You can specify drivervalues:
• Manually
• By referencing and adjusting current, past, or projected trends such as:
– Prior Year Actual Average
– Forecast Average
– Year Over Year Increase / Decrease to adjust the last business year’s valueby percentage
For cash flow, you’ll specify the sources and timings of your revenue and expensecategories. See Specifying Driver-Based Cash Use and Source Assumptions. Forbalance sheet, you’ll specify items like accrued compensation, accounts receivable,and prepaid expenses. See Specifying Balance Sheet Drivers.
About TrendsYou can enter trend-based assumptions that let you plan and forecast based ontrends. Financials includes the following trends:
• Current Year Actual Average—Calculates the average for an account for theCurrent Fiscal Year specified in Planning and Forecast Preparation.
• Current Month Actual—Takes the value for an account for the month or weekspecified as the Current Period for the Current Fiscal Year specified in Planningand Forecast Preparation.
Chapter 3About Specifying Driver Values
3-4
• Hold Forecast to Current Year Plan—For the Forecast Scenario only, compareshow much has been spent year to date for an account to the Plan for the currentyear, and spreads the remainder evenly over the remaining months in theForecast. For example, if Travel YTD Actuals is 260,000, the full year Plan is500,000, and the current month is June, there is 240,000 remaining to be spreadover the remaining 6 months in the year (July – Dec): 240000 / 6 = 40000. The40000 is spread evenly for Jul to Dec. This trend ensures that you keep Forecastin line with Plan. If YTD spending exceeds the Plan, the forecast for the remainingperiods is set to zero, rather than a negative number.
• Prior Year Actual Average—Calculates the average for an account for the yearprior to the Current Fiscal Year specified in Planning and Forecast Preparation.For example, if the Current Fiscal Year is FY17, the prior year is FY16.
• Prior Year Actual with Seasonality—Takes the value for account for the monthusing the value for the same month in the prior year.
• Forecast Average—For the Plan Scenario only, takes the average for theForecast from the prior year. For example, for FY18 in the Plan scenario, selectingthis trend calculates the average for the account from FY17 in the ForecastScenario.
• Forecast with Seasonality—For the Plan Scenario only, takes the monthlyvalues from the Forecast from the prior year. For example, in FY18 for the PlanScenario, selecting this trend calculates the monthly value for the account fromFY17 in the Forecast Scenario.
• Year over Year Increase/Decrease—Applies a % increase or decrease to theprior year’s value.
• No Trend—Removes the trend and clears the data from a previously set trend.
• Monthly Growth—Calculates year over year change for an account using currentyear and prior year as the basis to calculate the growth.
• Prior Month Run Rate—Takes the value of the prior period. For example, ifCurrent Month is June FY16 and the first period of Forecast is July, this trendtakes the value of June and applies it to July. If adjustments are made to the Julyvalue, the adjusted July value is used for August.
Planning Using a Rolling ForecastIf your administrator enabled rolling forecast, you can plan using a rolling forecast inaddition to, or instead of, standard forecasting. With rolling forecasts, you can performcontinuous planning so you can plan beyond a one year horizon. Depending on howyour administrator set up rolling forecast, you can plan continuously at a weekly levelfor either 13, 26, or 52 weeks, at a monthly level for either 12, 18, or 24 months, or at aquarterly level for either 4, 6, or 8 quarters.
When your administrator updates the current time period, rolling forecast forms anddashboards are automatically updated to add or drop time periods to the reflect theupdated rolling forecast range. Trends and drivers are populated to newly added timeperiods.
You can plan with a rolling forecast using:
• Driver and trend-based planning.
• Manually entering rolling forecast values.
Chapter 3Planning Using a Rolling Forecast
3-5
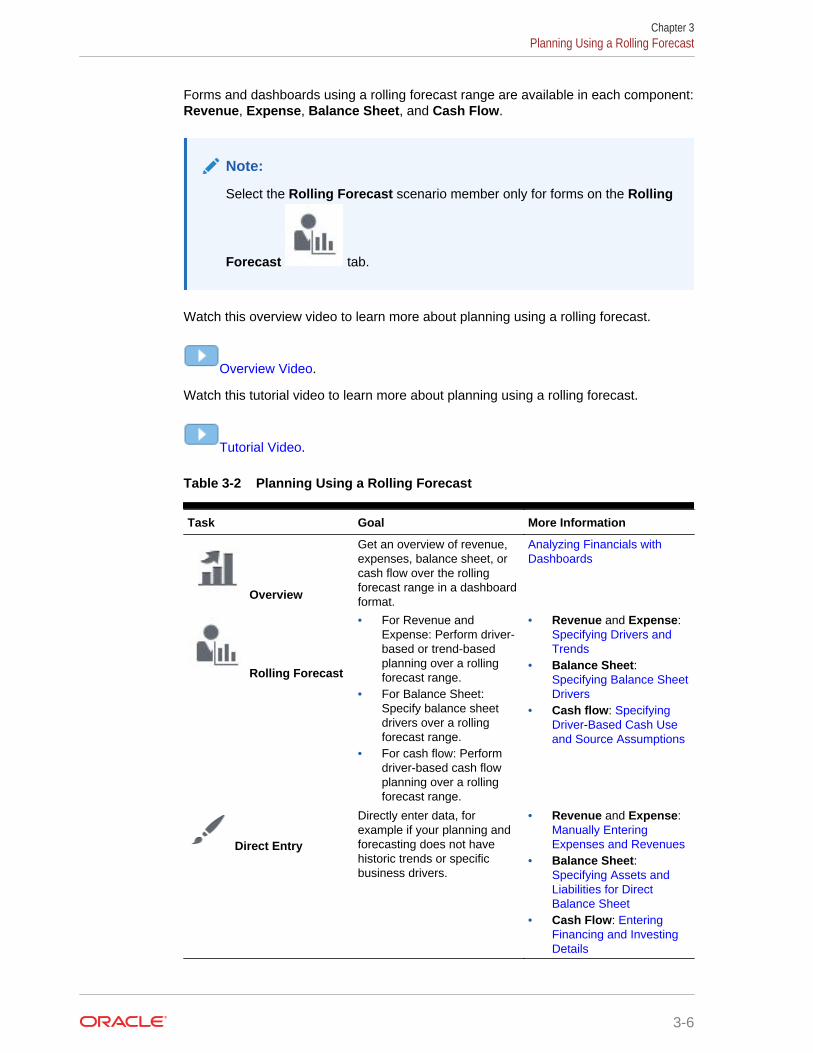
Forms and dashboards using a rolling forecast range are available in each component:Revenue, Expense, Balance Sheet, and Cash Flow.
Note:
Select the Rolling Forecast scenario member only for forms on the Rolling
Forecast tab.
Watch this overview video to learn more about planning using a rolling forecast.
Overview Video.
Watch this tutorial video to learn more about planning using a rolling forecast.
Tutorial Video.
Table 3-2 Planning Using a Rolling Forecast
Task Goal More Information
Overview
Get an overview of revenue,expenses, balance sheet, orcash flow over the rollingforecast range in a dashboardformat.
Analyzing Financials withDashboards
Rolling Forecast
• For Revenue andExpense: Perform driver-based or trend-basedplanning over a rollingforecast range.
• For Balance Sheet:Specify balance sheetdrivers over a rollingforecast range.
• For cash flow: Performdriver-based cash flowplanning over a rollingforecast range.
• Revenue and Expense: Specifying Drivers andTrends
• Balance Sheet: Specifying Balance SheetDrivers
• Cash flow: SpecifyingDriver-Based Cash Useand Source Assumptions
Direct Entry
Directly enter data, forexample if your planning andforecasting does not havehistoric trends or specificbusiness drivers.
• Revenue and Expense: Manually EnteringExpenses and Revenues
• Balance Sheet: Specifying Assets andLiabilities for DirectBalance Sheet
• Cash Flow: EnteringFinancing and InvestingDetails
Chapter 3Planning Using a Rolling Forecast
3-6
Planning at the Weekly LevelAfter planning at the weekly level, run these rules to convert weeks to months beforeviewing dashboards and performing trend calculations:
• Convert Weekly Data to Monthly
• Convert Monthly Data to Weekly
Alternatively, run "Convert Weekly Data to Monthly in Form" and "Convert MonthlyData to Weekly in Form" from the Actions menu for a form if your administratorassociated these rules with your form.
Planning Revenue and Expense
The Financials Revenue and Expense components provideseveral options to help you plan and forecast:
Watch this tutorial video to learn more about revenue, expense, and income statementplanning in Oracle Enterprise Planning and Budgeting Cloud.
Tutorial Video.
Table 3-3 Building Plans and Forecasts
Task Description Use TheseForms
MoreInformation
Overview
Review an overview of your financials in adashboard format.
• Revenue |Expense
• IncomeStatement
• RollingForecast
• IncomeStatementRollingForecast
AnalyzingFinancials withDashboards
Chapter 3Planning at the Weekly Level
3-7
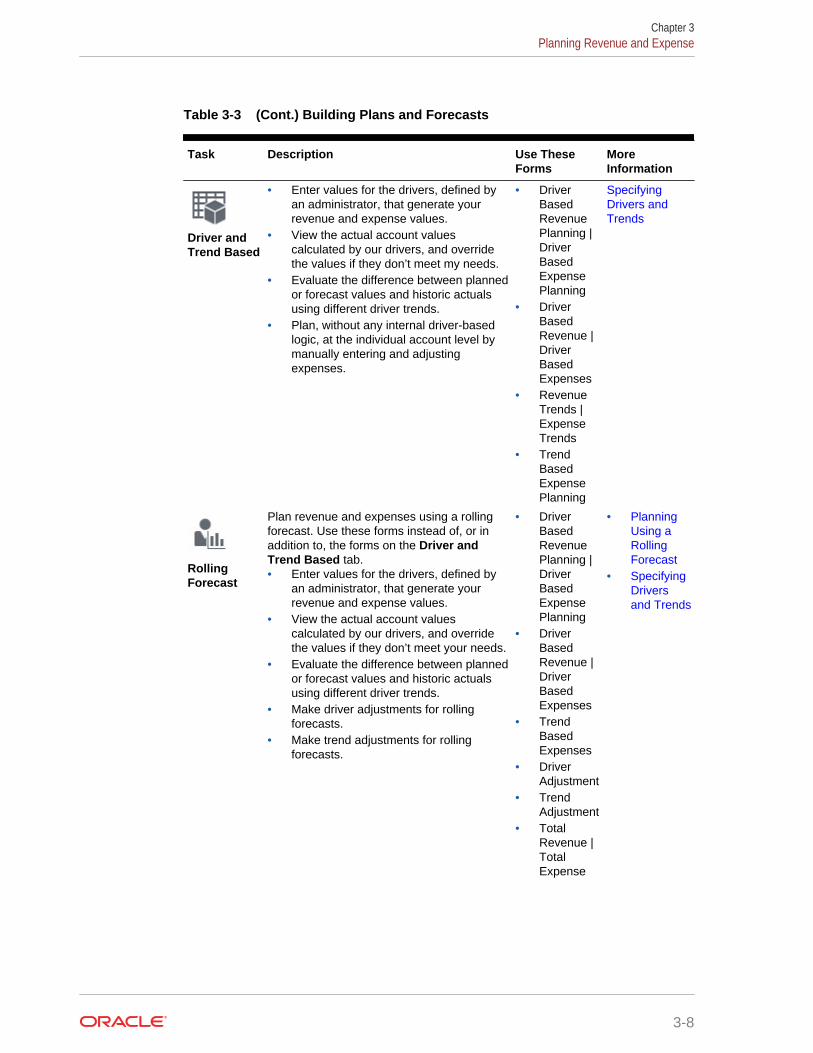
Table 3-3 (Cont.) Building Plans and Forecasts
Task Description Use TheseForms
MoreInformation
Driver andTrend Based
• Enter values for the drivers, defined byan administrator, that generate yourrevenue and expense values.
• View the actual account valuescalculated by our drivers, and overridethe values if they don’t meet my needs.
• Evaluate the difference between plannedor forecast values and historic actualsusing different driver trends.
• Plan, without any internal driver-basedlogic, at the individual account level bymanually entering and adjustingexpenses.
• DriverBasedRevenuePlanning |DriverBasedExpensePlanning
• DriverBasedRevenue |DriverBasedExpenses
• RevenueTrends |ExpenseTrends
• TrendBasedExpensePlanning
SpecifyingDrivers andTrends
RollingForecast
Plan revenue and expenses using a rollingforecast. Use these forms instead of, or inaddition to, the forms on the Driver andTrend Based tab.• Enter values for the drivers, defined by
an administrator, that generate yourrevenue and expense values.
• View the actual account valuescalculated by our drivers, and overridethe values if they don’t meet your needs.
• Evaluate the difference between plannedor forecast values and historic actualsusing different driver trends.
• Make driver adjustments for rollingforecasts.
• Make trend adjustments for rollingforecasts.
• DriverBasedRevenuePlanning |DriverBasedExpensePlanning
• DriverBasedRevenue |DriverBasedExpenses
• TrendBasedExpenses
• DriverAdjustment
• TrendAdjustment
• TotalRevenue |TotalExpense
• PlanningUsing aRollingForecast
• SpecifyingDriversand Trends
Chapter 3Planning Revenue and Expense
3-8
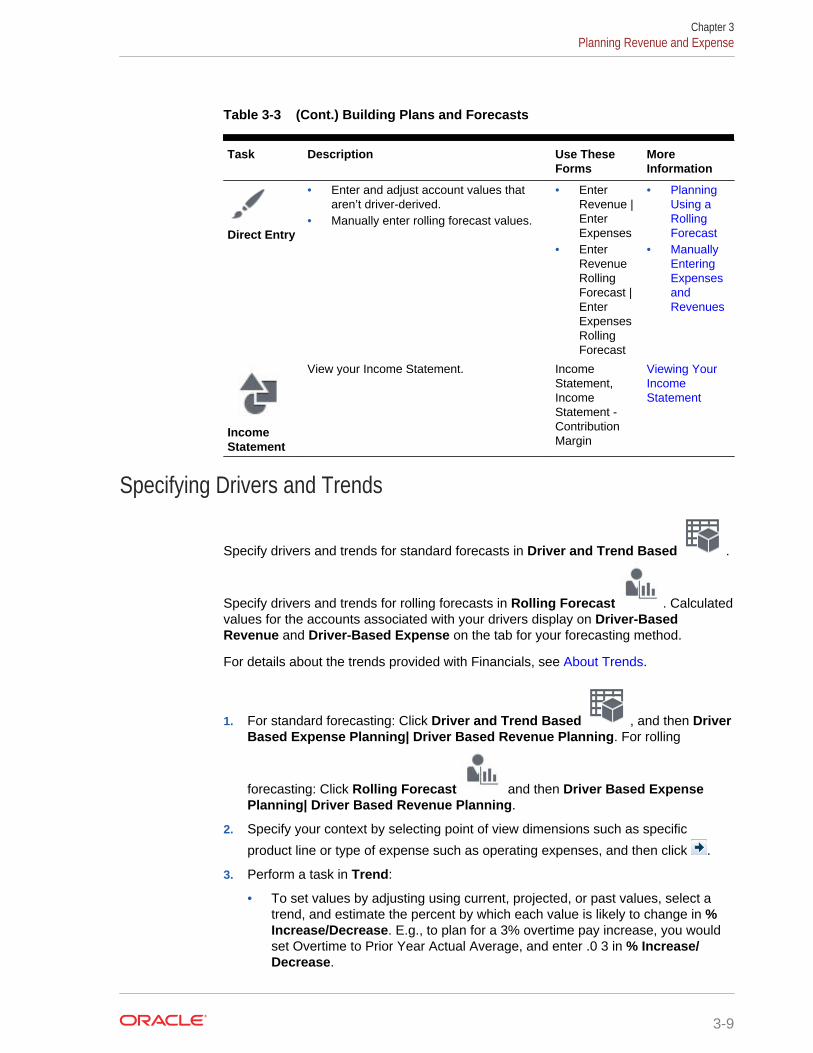
Table 3-3 (Cont.) Building Plans and Forecasts
Task Description Use TheseForms
MoreInformation
Direct Entry
• Enter and adjust account values thataren’t driver-derived.
• Manually enter rolling forecast values.
• EnterRevenue |EnterExpenses
• EnterRevenueRollingForecast |EnterExpensesRollingForecast
• PlanningUsing aRollingForecast
• ManuallyEnteringExpensesandRevenues
IncomeStatement
View your Income Statement. IncomeStatement,IncomeStatement -ContributionMargin
Viewing YourIncomeStatement
Specifying Drivers and Trends
Specify drivers and trends for standard forecasts in Driver and Trend Based .
Specify drivers and trends for rolling forecasts in Rolling Forecast . Calculatedvalues for the accounts associated with your drivers display on Driver-BasedRevenue and Driver-Based Expense on the tab for your forecasting method.
For details about the trends provided with Financials, see About Trends.
1. For standard forecasting: Click Driver and Trend Based , and then DriverBased Expense Planning| Driver Based Revenue Planning. For rolling
forecasting: Click Rolling Forecast and then Driver Based ExpensePlanning| Driver Based Revenue Planning.
2. Specify your context by selecting point of view dimensions such as specific
product line or type of expense such as operating expenses, and then click .
3. Perform a task in Trend:
• To set values by adjusting using current, projected, or past values, select atrend, and estimate the percent by which each value is likely to change in %Increase/Decrease. E.g., to plan for a 3% overtime pay increase, you wouldset Overtime to Prior Year Actual Average, and enter .0 3 in % Increase/Decrease.
Chapter 3Planning Revenue and Expense
3-9
For rolling forecasts, trends apply to all years in the rolling forecast range.When the current time period is updated, forms are updated to add or droptime periods to reflect the updated rolling forecast range; trends are alwayscalculated for the entire rolling forecast range.
• To set values manually without referencing historic data, select No Trend, andthen enter values in Adjustment (+/ -).
4. Double-click Year Total to calculate assumed values.
5. View values for driver-calculated accounts:
a. Click Driver Based Expenses | Driver Based Revenue, and then CalculatedYear Total to view your annual, quarterly, or monthly driver-derived values. Ifthey’re insufficient or incorrect, or inappropriate, you can override them in anyperiod.
b. Specify your context by selecting point of view dimensions such the year and
scenario, and then click .
c. Expand Adjust Year Total to access the period for which to modify driverderived values, and enter new values.
6. To adjust calculated values for accounts or drivers for rolling forecasts, clickDriver Adjustments and then enter a value in the Adjustment (+/ -) column.
7. To adjust calculated values for accounts for trends for rolling forecasts inExpense, click Trend Adjustment and then enter a value in the Adjustment (+/ -)column.
Manually Entering Expenses and RevenuesTo enter miscellaneous or non-driver calculated expenses or revenues:
1. Click , and then Enter Revenue | Enter Expenses. If you are using arolling forecast, click Enter Revenue Rolling Forecast | Enter Expenses RollingForecast.
2. Define your context by specifying point of view dimensions such as entity and
scenario, and then click
3. For each expense or revenue item, enter a monthly or quarterly value.
4. Double-click Year Total to view the annual total.
Viewing Your Total Plan and ForecastDepending on your planning method, view your total plan and forecast. Select a form,and then specify the POV.
Chapter 3Planning Revenue and Expense
3-10
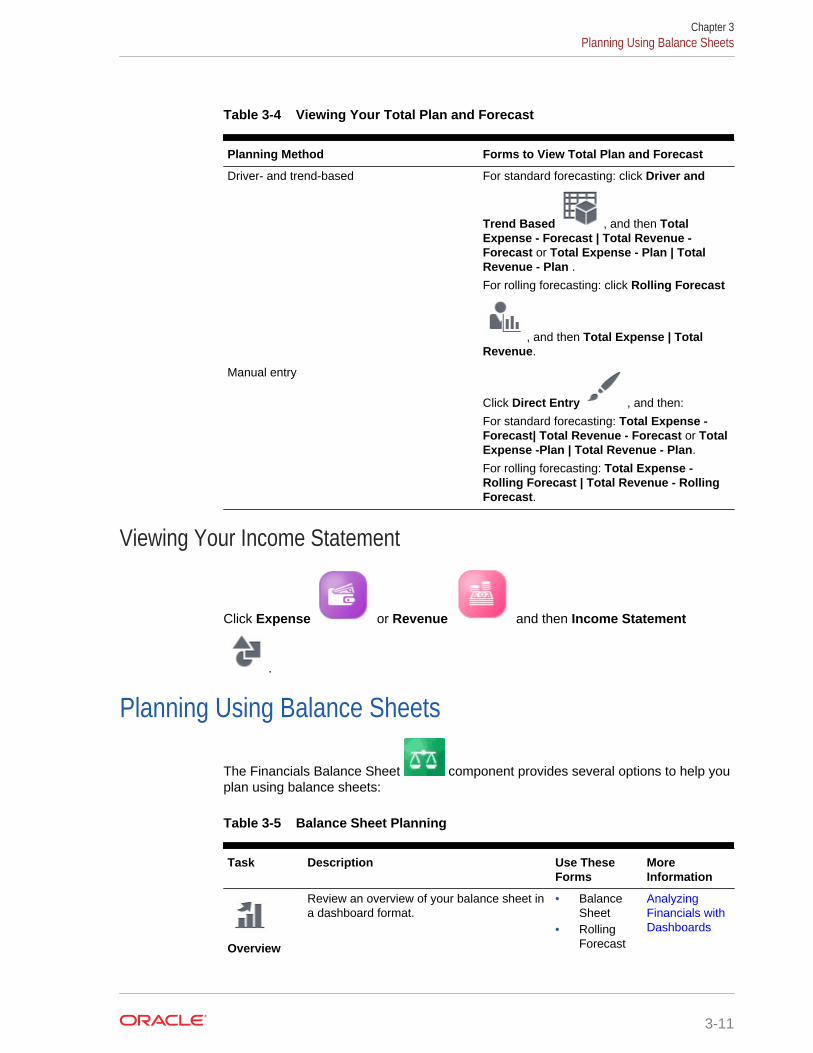
Table 3-4 Viewing Your Total Plan and Forecast
Planning Method Forms to View Total Plan and Forecast
Driver- and trend-based For standard forecasting: click Driver and
Trend Based , and then TotalExpense - Forecast | Total Revenue -Forecast or Total Expense - Plan | TotalRevenue - Plan .For rolling forecasting: click Rolling Forecast
, and then Total Expense | TotalRevenue.
Manual entry
Click Direct Entry , and then:
For standard forecasting: Total Expense -Forecast| Total Revenue - Forecast or TotalExpense -Plan | Total Revenue - Plan.
For rolling forecasting: Total Expense -Rolling Forecast | Total Revenue - RollingForecast.
Viewing Your Income Statement
Click Expense or Revenue and then Income Statement
.
Planning Using Balance Sheets
The Financials Balance Sheet component provides several options to help youplan using balance sheets:
Table 3-5 Balance Sheet Planning
Task Description Use TheseForms
MoreInformation
Overview
Review an overview of your balance sheet ina dashboard format.
• BalanceSheet
• RollingForecast
AnalyzingFinancials withDashboards
Chapter 3Planning Using Balance Sheets
3-11
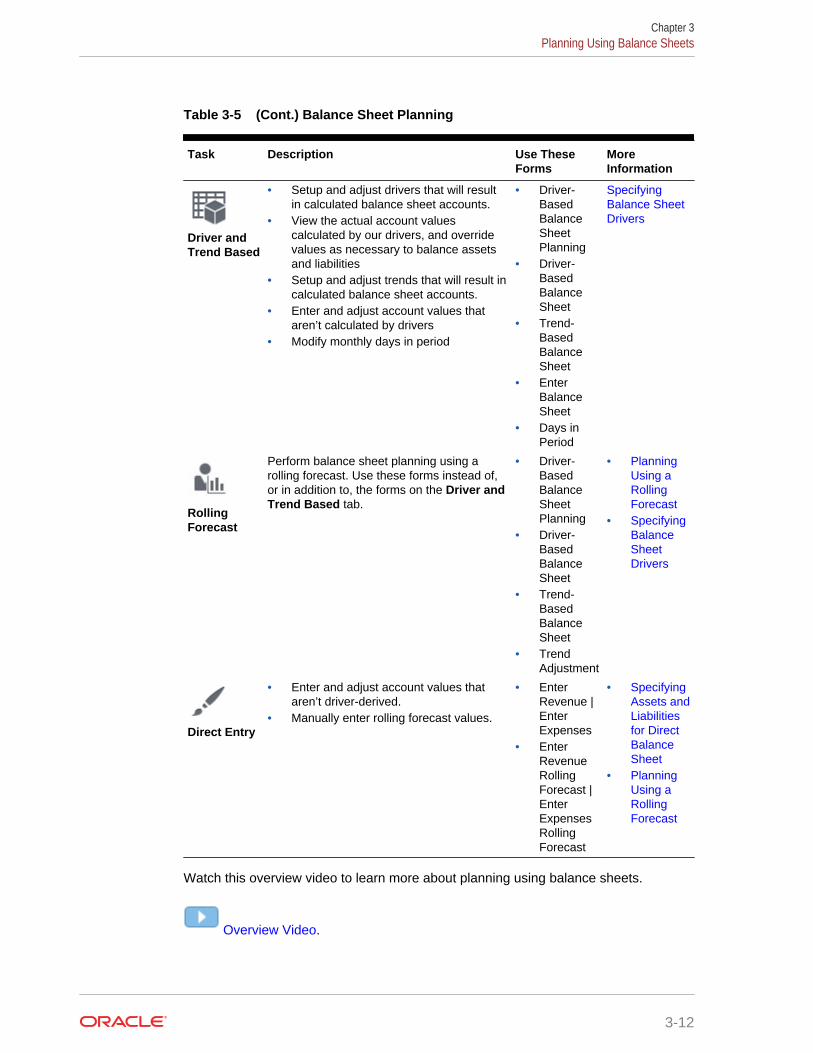
Table 3-5 (Cont.) Balance Sheet Planning
Task Description Use TheseForms
MoreInformation
Driver andTrend Based
• Setup and adjust drivers that will resultin calculated balance sheet accounts.
• View the actual account valuescalculated by our drivers, and overridevalues as necessary to balance assetsand liabilities
• Setup and adjust trends that will result incalculated balance sheet accounts.
• Enter and adjust account values thataren’t calculated by drivers
• Modify monthly days in period
• Driver-BasedBalanceSheetPlanning
• Driver-BasedBalanceSheet
• Trend-BasedBalanceSheet
• EnterBalanceSheet
• Days inPeriod
SpecifyingBalance SheetDrivers
RollingForecast
Perform balance sheet planning using arolling forecast. Use these forms instead of,or in addition to, the forms on the Driver andTrend Based tab.
• Driver-BasedBalanceSheetPlanning
• Driver-BasedBalanceSheet
• Trend-BasedBalanceSheet
• TrendAdjustment
• PlanningUsing aRollingForecast
• SpecifyingBalanceSheetDrivers
Direct Entry
• Enter and adjust account values thataren’t driver-derived.
• Manually enter rolling forecast values.
• EnterRevenue |EnterExpenses
• EnterRevenueRollingForecast |EnterExpensesRollingForecast
• SpecifyingAssets andLiabilitiesfor DirectBalanceSheet
• PlanningUsing aRollingForecast
Watch this overview video to learn more about planning using balance sheets.
Overview Video.
Chapter 3Planning Using Balance Sheets
3-12
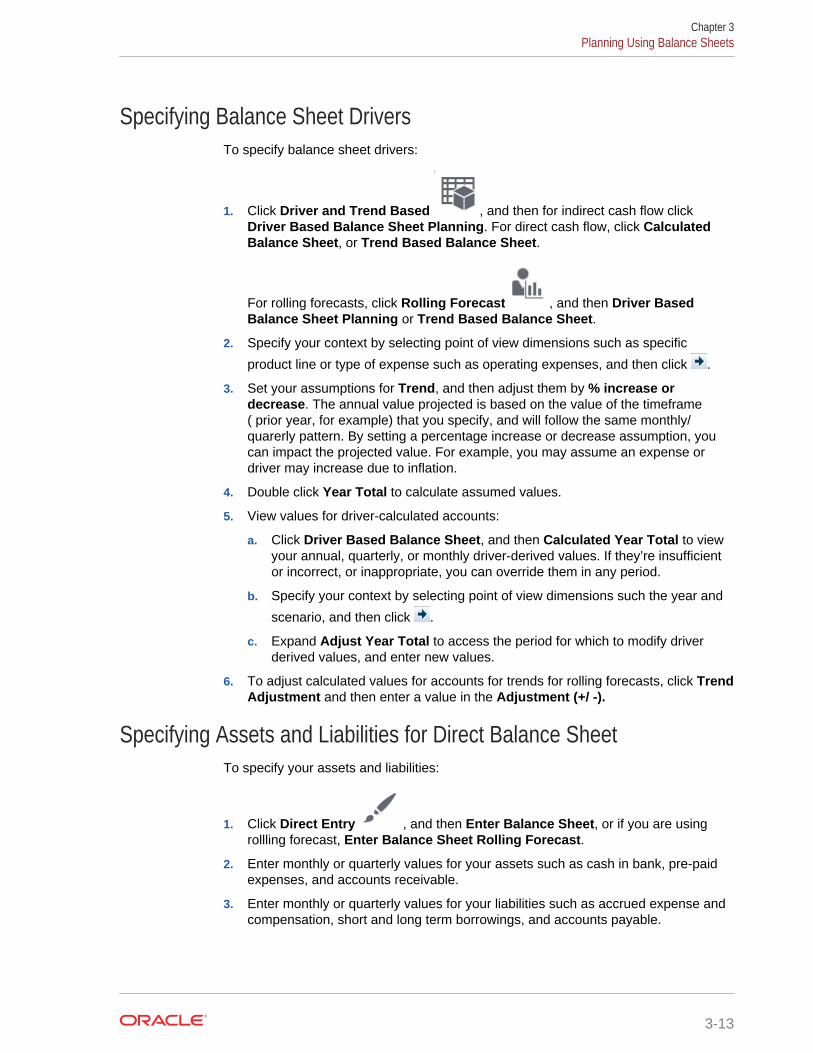
Specifying Balance Sheet DriversTo specify balance sheet drivers:
1. Click Driver and Trend Based , and then for indirect cash flow clickDriver Based Balance Sheet Planning. For direct cash flow, click CalculatedBalance Sheet, or Trend Based Balance Sheet.
For rolling forecasts, click Rolling Forecast , and then Driver BasedBalance Sheet Planning or Trend Based Balance Sheet.
2. Specify your context by selecting point of view dimensions such as specific
product line or type of expense such as operating expenses, and then click .
3. Set your assumptions for Trend, and then adjust them by % increase ordecrease. The annual value projected is based on the value of the timeframe( prior year, for example) that you specify, and will follow the same monthly/quarerly pattern. By setting a percentage increase or decrease assumption, youcan impact the projected value. For example, you may assume an expense ordriver may increase due to inflation.
4. Double click Year Total to calculate assumed values.
5. View values for driver-calculated accounts:
a. Click Driver Based Balance Sheet, and then Calculated Year Total to viewyour annual, quarterly, or monthly driver-derived values. If they’re insufficientor incorrect, or inappropriate, you can override them in any period.
b. Specify your context by selecting point of view dimensions such the year and
scenario, and then click .
c. Expand Adjust Year Total to access the period for which to modify driverderived values, and enter new values.
6. To adjust calculated values for accounts for trends for rolling forecasts, click TrendAdjustment and then enter a value in the Adjustment (+/ -).
Specifying Assets and Liabilities for Direct Balance SheetTo specify your assets and liabilities:
1. Click Direct Entry , and then Enter Balance Sheet, or if you are usingrollling forecast, Enter Balance Sheet Rolling Forecast.
2. Enter monthly or quarterly values for your assets such as cash in bank, pre-paidexpenses, and accounts receivable.
3. Enter monthly or quarterly values for your liabilities such as accrued expense andcompensation, short and long term borrowings, and accounts payable.
Chapter 3Planning Using Balance Sheets
3-13
About Using Cash Flow and Balance Sheet BalanceFinancials automatically balances your plan and forecast balance sheets. If yourliabilities and equity exceed your assets, a short term investment is used. Alternatively,if your assets exceed your liabilities and equity, a short term borrowing is created. Youmust enter the impact to cash flow of the short term investment or the short termborrowing in Financing and Investing Details.
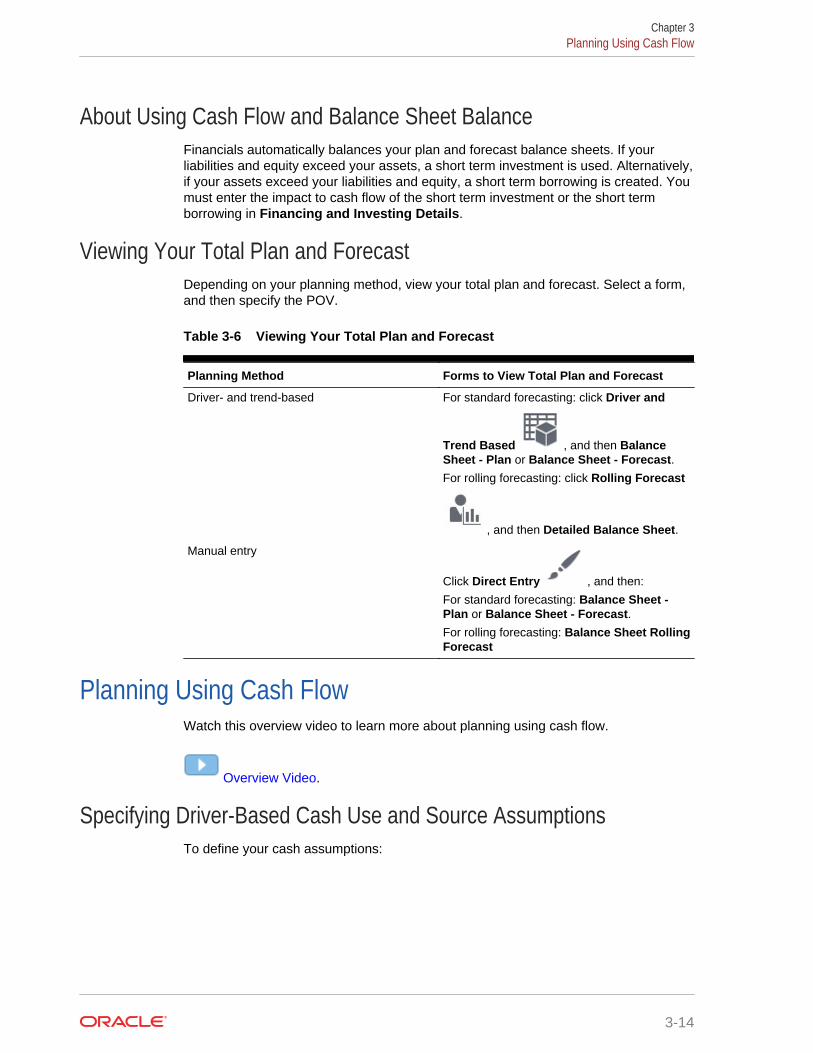
Viewing Your Total Plan and ForecastDepending on your planning method, view your total plan and forecast. Select a form,and then specify the POV.
Table 3-6 Viewing Your Total Plan and Forecast
Planning Method Forms to View Total Plan and Forecast
Driver- and trend-based For standard forecasting: click Driver and
Trend Based , and then BalanceSheet - Plan or Balance Sheet - Forecast.For rolling forecasting: click Rolling Forecast
, and then Detailed Balance Sheet.
Manual entry
Click Direct Entry , and then:
For standard forecasting: Balance Sheet -Plan or Balance Sheet - Forecast.For rolling forecasting: Balance Sheet RollingForecast
Planning Using Cash FlowWatch this overview video to learn more about planning using cash flow.
Overview Video.
Specifying Driver-Based Cash Use and Source AssumptionsTo define your cash assumptions:
Chapter 3Planning Using Cash Flow
3-14
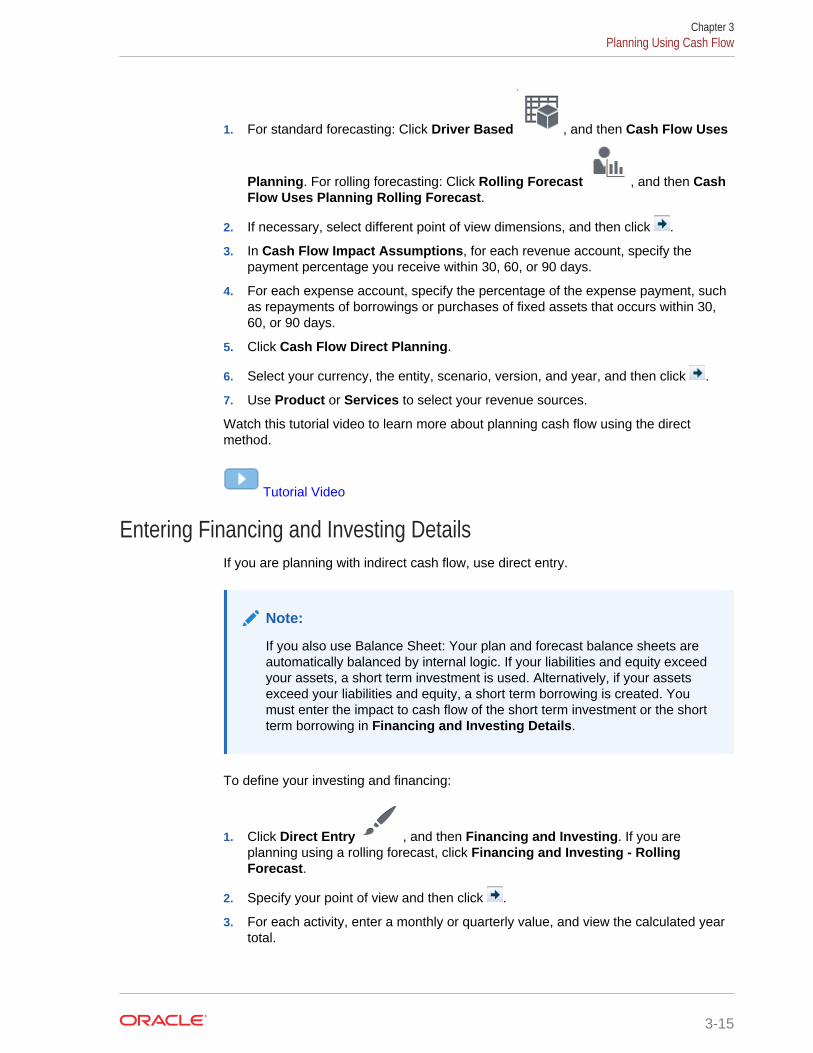
1. For standard forecasting: Click Driver Based , and then Cash Flow Uses
Planning. For rolling forecasting: Click Rolling Forecast , and then CashFlow Uses Planning Rolling Forecast.
2. If necessary, select different point of view dimensions, and then click .
3. In Cash Flow Impact Assumptions, for each revenue account, specify thepayment percentage you receive within 30, 60, or 90 days.
4. For each expense account, specify the percentage of the expense payment, suchas repayments of borrowings or purchases of fixed assets that occurs within 30,60, or 90 days.
5. Click Cash Flow Direct Planning.
6. Select your currency, the entity, scenario, version, and year, and then click .
7. Use Product or Services to select your revenue sources.
Watch this tutorial video to learn more about planning cash flow using the directmethod.
Tutorial Video
Entering Financing and Investing DetailsIf you are planning with indirect cash flow, use direct entry.
Note:
If you also use Balance Sheet: Your plan and forecast balance sheets areautomatically balanced by internal logic. If your liabilities and equity exceedyour assets, a short term investment is used. Alternatively, if your assetsexceed your liabilities and equity, a short term borrowing is created. Youmust enter the impact to cash flow of the short term investment or the shortterm borrowing in Financing and Investing Details.
To define your investing and financing:
1. Click Direct Entry , and then Financing and Investing. If you areplanning using a rolling forecast, click Financing and Investing - RollingForecast.
2. Specify your point of view and then click .
3. For each activity, enter a monthly or quarterly value, and view the calculated yeartotal.
Chapter 3Planning Using Cash Flow
3-15
Running Financials RulesYou can run these rules in Financials:
• Calculate Actuals—Calculates any drivers and aggregates actuals for the selectedperiods.
• Prepare Forecast—Copies the selected periods of actuals to the Forecastscenario and then recalculates any accounts with a trend or driver to arrive at anupdated forecast. Also copies current forecast to prior forecast version forcomparison.
• Prepare Plan—Calculates trends and drivers for the selected year(s). You can usethis rule to create a new year plan as years change. Or you can use it if you haveprepared a multi-year plan and have updated data for trend and driver basis.
Analyzing Financials with DashboardsPredefined dashboards give you insight into overall financials for revenue, expenses,balance sheet, and cash flow. You can drill in to members in dashboard charts to seethe level of detail you want.
1. Click Revenue , Expense , Balance Sheet , or Cash
Flow .
2. If it's not already selected, click Overview .
3. Use the Point of View bar to select different dimension members to display in theform, for example to select a different project or entity.
4. Click the horizontal tab for the type of dashboard you want to see. If you areplanning over a rolling forecast range, click the rolling forecast dashboards.
Analyzing Your FinancialsUse the provided interactive dashboards to compare your plans, forecasts, andactuals, and to get a dynamic visual snapshot of your financials; at a total businesslevel, or at an entity level perspective. You can drill-down to access more data formore detailed analysis.
Use the analysis forms to get a variety of detailed plan and forecast information andtrend-based data. An administrator can customize the analysis forms, or create newones. See Administering Planning for Oracle Enterprise Planning and BudgetingCloud.
Chapter 3Running Financials Rules
3-16
To view analysis forms and dashboards, click Financials , then Analysis
, and then explore data using the vertical tabs.
Reviewing Forms and InstructionsYou can review all of the available forms and dashboards related to your financials,and review form instructions if your administrator provided them.
Click Analysis , and then click Forms .
Reviewing Data from Workforce, Projects, and CapitalIf you've integrated Financials with Workforce, Projects, or Capital, review a summaryof the rolled up data.
1. Click Analysis , and then click Forms .
2. Select Financials Integration Summary, Balance Sheet Integration Summary,or Cash Flow Direct Integration Summary.
3. From the Actions menu, select Roll Up to push data from Workforce and Capitalto Financials.
4. Review data that's been pushed from other business processes:
• Financials Integration Summary
– Salary data from Workforce in the Workforce Detail column.
– Expense and revenue from Projects in the Project Detail column.
– Depreciation, amortization, and other expenses from Capital in the CapitalDetail column.
• Balance Sheet Integration Summary—Accounts that affect the balancesheet are pushed from Capital or Projects to Financials.
• Cash Flow Direct Integration Summary—Accounts that affect the cash floware pushed from Capital or Projects to Financials.
Chapter 3Reviewing Data from Workforce, Projects, and Capital
3-17
4Working With Workforce
Related Topics
• Task Overview
• Setting User Variables
• Managing Compensation Expenses
• Managing Non Compensation Expenses
• Strategic Workforce Planning
• Managing Demographics
• Analyzing Workforce Expenses
• Reporting on DataFor complete reporting on data, Workforce provides data maps, which enable youto push consolidated data from one cube to a reporting cube. For example, youcan push compensation data to the reporting cube.
• Analyzing Project Utilization
Task OverviewReview the tasks you'll perform in Workforce. In general, you'll perform tasks in thisorder:
1. Before creating or updating plans and forecasts, run these business rules:Synchronize Defaults and Calculate Compensation.Access these business rules from Compensation Planning, then ManageEmployees, then Existing Employees.
2. Set up user variables.
See Setting User Variables.
3. Review or enter workforce assumptions and defaults. Your administrator may haveset up initial assumptions.Use Compensation Planning, then Assumptions and Defaults.
4. Update workforce details.See the table below.
5. Run the Calculate Compensation business rule again to recalculate values.
6. Review dashboards and analytics.
7. Report on data using data maps.
4-1
Note:
You might not see all the features described in this section, depending onwhich features your administrator enabled.
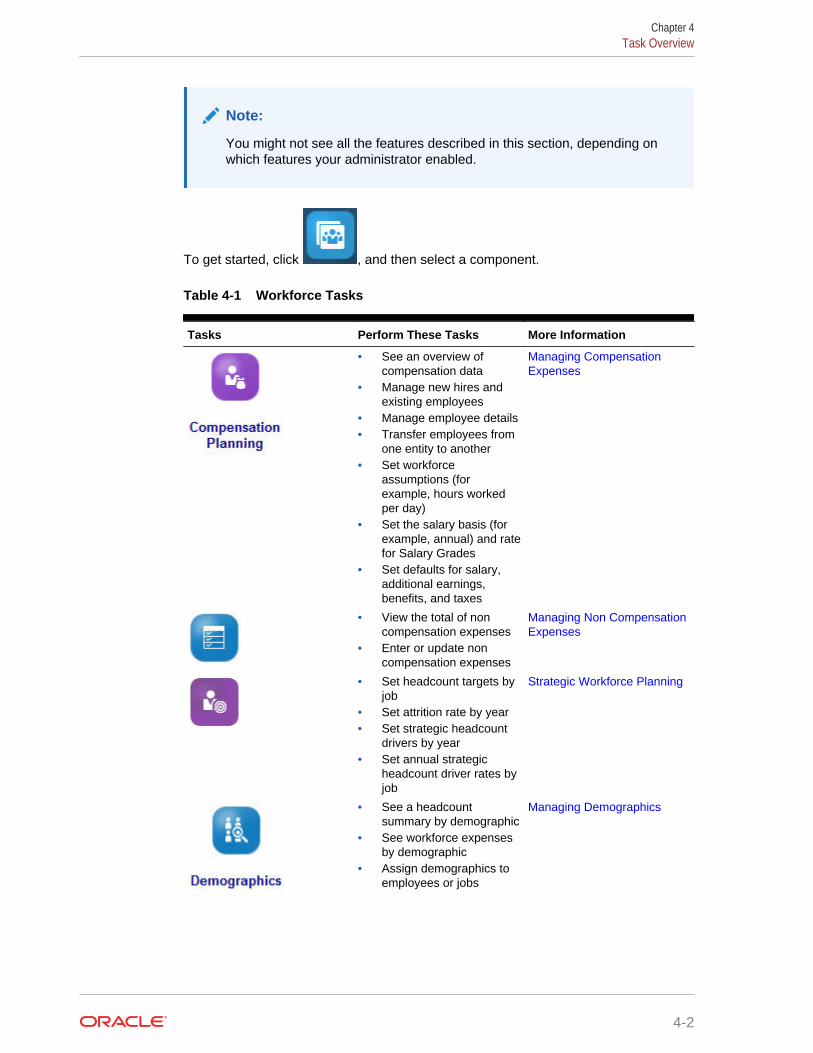
To get started, click , and then select a component.
Table 4-1 Workforce Tasks
Tasks Perform These Tasks More Information
• See an overview ofcompensation data
• Manage new hires andexisting employees
• Manage employee details• Transfer employees from
one entity to another• Set workforce
assumptions (forexample, hours workedper day)
• Set the salary basis (forexample, annual) and ratefor Salary Grades
• Set defaults for salary,additional earnings,benefits, and taxes
Managing CompensationExpenses
• View the total of noncompensation expenses
• Enter or update noncompensation expenses
Managing Non CompensationExpenses
• Set headcount targets byjob
• Set attrition rate by year• Set strategic headcount
drivers by year• Set annual strategic
headcount driver rates byjob
Strategic Workforce Planning
• See a headcountsummary by demographic
• See workforce expensesby demographic
• Assign demographics toemployees or jobs
Managing Demographics
Chapter 4Task Overview
4-2
Table 4-1 (Cont.) Workforce Tasks
Tasks Perform These Tasks More Information
• See a dashboardsummary of headcountand FTE (full-timeequivalent)
• Analyze compensationtrends over time
• View headcount andexpenses by skill set
• See an overview ofutilization and staffing, byexisting employees tohires
Analyzing WorkforceExpenses
If you integrated Workforcewith Projects, reviewdashboards and forms thatshow:• Utilization and staffing
overview.• FTE requirement across
projects.• FTE requirement by
project.• Employee utilization. You
can also reassignemployees to projects asneeded.
• Employee assignments.
Analyzing Project Utilization
Watch this tutorial video to learn more about entering data in Workforce.
Overview Video.
Setting User VariablesEach planner must set the variables described below.
1. From the Home page, click Tools , then User Variables .
2. Set up these user variables that are required for all business processes:
• Entity
• Scenario
• Version
• Reporting Currency
• Years
For Financials, set these user variables for the Account dimension:
Chapter 4Setting User Variables
4-3
• For the OFS_Expense Account variable, select OFS_Total OtherExpenses.
• For the OFS_Expense Drivers variable, select OFS_Expense Drivers forForms.
Capital, Workforce, and Projects have their own dynamic variables (defined with theUse Context option), which allow user variables to be used in the Point of View. Withdynamic variables, the value of the user variable changes dynamically based on thecontext of the form, and users don’t need to set the default value.
Managing Compensation ExpensesBefore updating employee-related information, you might want to review currentexpenses trends and summaries by clicking or tapping Compensation, and thenOverview.
Managing Hiring RequisitionsA hiring requisition adds placeholder expenses to the workforce budget until someoneis hired to fill the requisition. When an employee is hired to fill the hiring requisition, theplaceholder hiring requisition expense is transferred to and associated with the hiredemployee.
Hiring requisitions functionality is available if these Workforce features are enabled:
• Granularity type Employee or Employee and Job
• New Hires option under Workforce Management
When workforce demands exceed the number of available employees, you can useNew Hires functionality to:
• Add a hiring requisition to be filled by an employee
• Change the status of a hiring requisition
• Associate a hiring requisition with an employee
• Remove hiring requisitions
• Calculate the resulting compensation expenses
Workforce initially provides 100 blank New Employee Hiring Requisitions, which youcan use and then add more when you need to. To add a hiring requisition, useCompensation Planning, then Manage Employees, and then Add HiringRequisition from the Actions gear. (Use the same sequence for the other hiringrequisition options.)
When you fill a hiring requisition by hiring an employee, you associate the hiringrequisition with the employee. The reconciled FTE value equals the Hiring RequisitionFTE value. In other words, the FTE and headcount is reduced for the hiring requisitionand assigned to the associated employee.
To associate a hiring requisition to an employee:
1. Add a hiring requisition if needed.
See Adding Hiring Requisitions.
2. Associate the employee with the hiring requisition.
Chapter 4Managing Compensation Expenses
4-4
This action transfers the FTE/headcount to the existing associated employee. Thenew hire requisition properties Reconciled FTE and Reconciled Headcount arepopulated. See Hiring Employees.
3. After the hiring requisition available FTE is assigned to an existing associatedemployee, you may opt to remove the hiring requisition because it no longercontributes to workforce compensation expenses.
Adding Hiring RequisitionsWhen workforce demands exceed the number of available employees, you can addhiring requisitions to be filled by employees. You can create multiple requisitionssimultaneously, set their FTE, their employee type, their time span, and their salary.
For an overview, see Managing Hiring Requisitions.
Note:
This topic applies only to the Employee and the Employee and Jobgranularity options.
To add hiring requisitions:
1. Click Compensation Planning, then Manage Employees, and then New Hires.
2. Click Actions, and then Add Hiring Requisitions.
3. At Requisition Details, set these aspects, and then click Next:
• Number of requisitions you're adding
• FTE value for each
• Employee Type (for example, Regular, Contractor, or Temporary)
4. For Calendar Information, select the Start Year and Start Month to set when therequisition's expenses are to be included in expense calculations, and then clickNext.Optionally, select the End Year and End Month if you know the end date for anemployee. Specifying an ending period is especially useful for temporaryemployees; doing so saves you from having to plan their departure using the PlanDeparture rule. Calculations for their workforce expenses then begin and end withtheir start and end dates. Note that if you use the ending period option, you mustselect both the end year and month.
5. At Job and Salary Options, select:
• Which Job the requisition is for
• Which Union Code the requisition is for
• The option for setting the requisition's salary:
– Salary Defaults: Select to set the salary based on the salary defaults,which are set on the Defaults tab of Compensation Planning.
– Salary Basis and Rate: Select to directly enter the salary rate (forexample, 6000) and basis (for example, Monthly).
Chapter 4Managing Compensation Expenses
4-5
– Salary Grade: Select to set the salary by selecting a salary grade. Youradministrator imports salary grades, and you set the defaults for new hiresby selecting Compensation Planning, then Assumptions, and thenSalary Grades.If you don't select a salary option, then the salary defaults are used.Selecting either Salary Basis and Rate or Salary Grade overrides anysalary default assignments.
6. Click Launch.The Additional Earnings, Benefits, Taxes, headcount, and so on are calculated forthe specified requisitions during the time range you specified.
If needed, you can later change the Salary Rate, Salary Basis, Salary Grade, Status,or end period for a hiring requisition you’ve added. See Updating Hiring Requisitions.To update the salary after the TBH has been associated with a hired employee, see Updating Employee Compensation.
Updating Hiring RequisitionsAfter you've added a hiring requisition, you can update its status description, salary, ortime span. You can also remove a requisition.
Note:
To remove a requisition, follow Step 1 below, then select Actions, and thenRemove Hiring Requisition. When a requisition is deleted, its associatedFTE/headcount and compensation expenses are no longer included incalculations.
To update a hiring requisition:
1. Click Compensation Planning, then Manage Employees, and then New Hires.
2. Select the requisition to update.
3. Click Actions, and then Change Requisition.
4. At Requisition Change, select the option that applies, and then click Next:
• Status—Select to set an informational description to the requisition: New,Active, Approved, Unapproved, On-hold, or Closed.
• Salary—Select to update the salary basis, rate, or grade for the requisition.Skip to Step 5.
• Extend Calendar—Select to change the requisition's end date. Calculationsfor a requisition's workforce expenses begin and end with the requisition's startand end dates. Skip to Step 6.
• Reduce Calendar—Skip to Step 7.
5. To update the salary associated with the requisition:
• Salary Defaults—Select to set the salary based on the salary defaults, whichare set on the Defaults tab of Compensation Planning.
• Salary Basis and Rate—Select to directly enter the salary rate (for example,6000) and basis (for example, Monthly).
Chapter 4Managing Compensation Expenses
4-6
• Salary Grade—Select to set the salary by selecting a salary grade. Youradministrator imports salary grades, and you set the defaults for new hires byselecting Compensation Planning, then Assumptions—and then SalaryGrades.If you don't select a salary option, then the salary defaults are used. Selectingeither Salary Basis and Rate or Salary Grade overrides any salary defaultassignments.
6. To extend the time span for the requisition:
a. In Copy Properties from, select the month to use as the basis for whichrequisition properties to copy to the extended range. This option enables youto carry forward into the extended range such aspects as FTE, Status,Employee Type, and Pay Type.
b. Select the End Year and End Month.Specifying an end month and year saves you from having to plan theirdeparture using the Plan Departure rule. Note that you must select both theend year and month.
7. To reduce the time span of the requisition, select the End Year and End Month.You must select both the end year and month.
8. Click Launch.The Additional Earnings, Benefits, Taxes, headcount, and so on are calculated forthe specified requisitions during the time range you specified.
Updating Employee CompensationTo view and update employee compensation:
1. Click Compensation, and then Employee Details.
2. Update the information as needed.
Changing an Employee's StatusTo change an employee's status:
1. Click Compensation Planning, then Manage Employees, and then ExistingEmployees.
2. Select the employee in the row, and then from the Actions gear, click ChangeEmployee Status.
3. Select the pertinent information, including the new status:
• Active—The employee's workforce expenses are included fully in workforcecalculations.
• Disability—The employee's workforce expenses are not calculated for thespecified period.
• Leave of Absence—The employee's workforce expenses are not calculatedfor the specified period.
• Maternity—The employee's workforce expenses are calculated according tothe Partial Payment Factor, set in assumptions. The Partial Payment Factorsets the pay percentage to apply to the employee's salary. To set thispercentage in assumptions, click Compensation Planning, and thenAssumptions.
Chapter 4Managing Compensation Expenses
4-7
• On Sabbatical—The employee's workforce expenses are not calculated forthe specified period.
4. Select the month, year, and duration of the status. You can also add a comment.
Hiring EmployeesWhen you hire an employee, you associate the employee with an existing hiringrequisition.
When you hire an employee, you add them as a member to the Employee dimension.Then you associate the employee to a hiring requisition (TBH), which assigns theirFTE and headcount to the application. (For information on hiring requisitions, see Managing Hiring Requisitions). After you reconcile the new employee with a hiringrequisition, you manage the employee's workforce information on the ExistingEmployees form.
To associate a newly-hired employee with a hiring requisition:
1. Click Compensation, then Manage Employees, and then New Hires.
2. Click the row containing the hiring requisition to associate with the new hire, thenActions, and then Associate Employee.
The new employee's compensation expenses are added to the totals, and theheadcount and compensation expenses for the hiring requisition are cleared.
Planning an Employee's DepartureWhen an employee resigns or is terminated, to stop their associated compensationexpenses from being included in calculations as of their departure month, use PlanDeparture.
To plan an employee's departure:
1. Click Compensation Planning, then Manage Employees, and then ExistingEmployees.
2. Select the employee.
3. Click Actions, and then Plan Departure.
4. Select the pertinent date and information.For example, select the month, year, reason the employee is leaving, and addoptional comments.
The employee's workforce expenses aren't included in calculations after the departuremonth.
Transferring EmployeesTransferring an employee changes the department (or entity) against which theircompensation expenses are calculated. Managers transfer employees using either ofthese processes:
• One-step Transfer—Use the Transfer rule if you own both the source and targetentities (that is, you have access permissions to the source and target entities).
• Two-step Transfer—Use the Transfer Out and Transfer In rules if you don't haveaccess permissions to both the source and target entities. The two-step transfer
Chapter 4Managing Compensation Expenses
4-8
provides security. For example, it ensures that managers in Department A can'tsee member data for Department B if they don't have access permissions to theDepartment B entity. You should transfer out an employee during the same monthin which receiving department transfers in the employee.
Note:
After an employee is transferred out, their data is not retained in the formerdepartment as of the transfer month. When the employee is transferred tothe new department, the status is set to Active for that department, and theemployee’s salary is calculated in the new department.
To use the two-step employee-transfer process:
1. Click Compensation Planning, then Manage Employees, and then ExistingEmployees.
2. Click the Actions gear, and then Transfer Out.
Transfer Out causes the employee's name to be displayed in the Review PendingTransfers form.
3. To transfer the employee into the target department, in Review PendingTransfers, select the employee, then Action, and then Transfer In.
Tip:
Oracle recommends that you review pending transfers before approving aplan.
Planning Merit RatesMerit rate increases are added to salary calculations. You can plan merit rates foremployees using these methods:
• Based on the employee's performance rating, for example, Meets Expectations,Exceeds Expectations, or No Merit. (Your administrator can create or importperformance ratings.)
• By setting default percentage rates by entity in the Default Merit member. If theperformance rating isn't set for an employee (you can set and view performanceratings on the Employee Details form) or if you want to plan merit rates at a moregeneric level, you can set default percentage rates for merit increases by entity.The merit increase for the year is included in the base salary calculations of thatyear and is carried forward into the base salary for subsequent years.This method is particularly useful when managers don't yet have performanceinformation, for example, when planning merit increases for future years. Tosimplify planning when merit rates are the same across entities, you can also copymerit rates from one entity to another using the rule Copy Merit Rates.
To set merit rates:
Chapter 4Managing Compensation Expenses
4-9
1. Click .
2. Click Assumptions, and then Merit Rates.
3. From the Point of View links, select the Scenario, Version, and Entity.
4. Set merit rates using the method you prefer:
• In the performance rating row, enter the merit percentage rate.
• If no performance rating is set, enter the merit percentage rate in the DefaultMerit row. This value is used in salary calculations only if the performancerating is blank.Optional: To copy the merit rates from one entity to another, run the ruleCopy Merit Rates from the Actions menu. At the rule's prompt, select theparent or child entity member whose merit rate you want to copy and thetarget level 0 member to copy the rate to. Selecting a source parent memberenables you to easily push merit rates. Even after you’ve copied a merit rate toanother entity, you can still overwrite the rate in the Merit Rates form.
Note:
Merit rates must be set at the level 0 entity level, whether they'rebased on performance rating or the Default Merit member. Ifmanagers enter merit rates at the company Assumptions (No Entity)member, the rates aren't effective until they're copied or added tospecific level 0 child members of Total Entity. Individual entityowners can use the rule Copy Merit Rates and then modify therates if needed.
5. Click Actions, and then Synchronize Component Definition.Running this rule recalculates tax thresholds that may change as a result of meritincreases for employees.
Calculating Compensation ExpensesWhenever you update data in Workforce, to recalculate expenses, you must run theCalculate Compensation rule. Click Actions, and then Calculate Compensation.
Note:
If you get an error message about invalid data when running a business rule,see Troubleshooting a Rule's Error Message.
Chapter 4Managing Compensation Expenses
4-10
Synchronizing DefaultsYou must run the Synchronize Defaults business rule when entity defaults are addedor existing defaults are changed. Running Synchronize Defaults pushes the updatedconfiguration information so that form calculations are based on the updatedinformation.
To run Synchronize Defaults, select Actions, then Business Rules, and thenSynchronize Defaults. If you launch Synchronize Defaults using the right-clickmenu, you should use it for a selected employee-job combination.
If you intend to execute the business rule for:
• Only one person, highlight the row containing that person's name, and then runthe business rule.
• Multiple people, or to select the dimensionality with a runtime prompt, highlight ablank row and then run the business rule.
Note:
When an existing salary grade, benefit, tax, or additional earning is updated,to push the updated definitions to employees and jobs, run the SynchronizeComponent Definition business rule. This business rule doesn't updateentity defaults.
Note:
After new data has been imported, run the business rule Process LoadedData to copy the data to the necessary periods in the planning year range.Running this business copies the information from the substitution variables&CurYr and &CurMnth.
Note:
If you get an error message about invalid data when running a business rule,see Troubleshooting a Rule's Error Message.
Troubleshooting a Rule's Error MessageTo make it easy for you to work with data, Workforce extensively uses Smart List drop-down lists. Smart Lists that are defined with the property Create from Members usetext data (the member names), not the Smart Lists' numeric ID. If a Smart List in yourapplication mistakenly has numeric data or is missing data, you get an error messagewhen you run a predefined business rule such as Process Loaded Data orSynchronize Defaults.
Chapter 4Managing Compensation Expenses
4-11
To find and fix incorrect Smart List values:
1. Click Compensation Planning, and then Defaults.
2. Review the Entity defaults on the Salary, Additional Earnings, Benefits, andTaxes tabs.
Check to see if there’s invalid data (numeric instead of text data) related toemployee properties and compensation.
3. To make sure there are no invalid Smart List values at the employee and job
combination, click the Validate tab .
If there’s numeric data for a Smart List, your administrator can fix this error byreloading the data for that employee and job combination or by adding the missingmember to the hierarchy. Then you can select that member from the Smart Listdrop-down list. Or, you can select another Smart List value that fits your needs.
Managing Non Compensation ExpensesYou manage non compensation expenses such as training or travel expenses using
Other Expenses .
• To view a summary of expenses, click Summary.
• To add or update non compensation expenses, click Non CompensationExpenses.
Strategic Workforce PlanningStrategic Workforce Planning helps ensure that you have the right skill sets andheadcount to align with the organization's long-term strategy. Often driven by HumanResource departments, strategic planning often looks ahead two to ten years andconsiders such factors as:
• Attrition rates, including retirement ages
• New product lines or technologies that require certain skill sets and headcount
• The most critical job roles that require focus on retention
Strategic Workforce Planning translates long-term corporate strategy into executionplans by ensuring that the strategy is supported by the right workforce. It provides aregular, proactive way to anticipate future workforce trends and gaps.
To analyze workforce requirements in the future, click . Then enteranticipated workforce requirements:
• Strategic Headcount Planning: Set future headcount targets such as regular anddeparted headcount.
• Strategic Headcount Attrition Rate: Set the target attrition rate for each job.
Chapter 4Managing Non Compensation Expenses
4-12
• Strategic Headcount Driver: Enter the headcount driver for planning strategicheadcount demand.
• Strategic Headcount Driver Rate: Enter the headcount driver rate for planningstrategic headcount demand.
Managing DemographicsDemographics describe employee attributes that are unique to each individual, suchas Ethnicity, Gender, Religion, Veteran Status, Highest Education Degree, and AgeBand. Analyzing demographics can help:
• Ensure fairness in hiring
• Address talent gaps as older employees retire
• Examine how many employees and what skill sets your future projects require
To view and update demographics, for example, to set an attribute for a newemployee, click Demographics. Then:
• To see a graphic summary of headcount by demographic, click HeadcountOverview.
• To see a graphic summary of workforce expenses by demographic, clickWorkforce Expenses Overview.
• To set a demographic by employee and job, click Employee Demographics.To ensure correct calculations in the dashboards, on the Demographics byEmployee form, you can select any demographic member, including theUnspecified Demographic member. However, avoid selecting aNo_<demographic_member_name> member, for example, No Highest EducationDegree, No Age Band, or No Gender.
Note:
Your administrator sets up which demographics the organization tracks.
Analyzing Workforce ExpensesSo that you can see the big picture of headcount, compensation, and trends, skillssets, and so on, Workforce provides predefined dashboards. From a dashboard, youcan drill to the detail data by clicking or tapping links. You can also perform what-ifanalysis in many ways. For example, change a value in the grid and see its immediateeffect in the chart.
To access an analysis dashboard, in Workforce, click and then explore thedata presented on the vertical tabs.
Chapter 4Managing Demographics
4-13
Reporting on DataFor complete reporting on data, Workforce provides data maps, which enable you topush consolidated data from one cube to a reporting cube. For example, you can pushcompensation data to the reporting cube.
The data maps:
• Compensation Data for Reporting—For reporting on compensation information
• Headcount Data for Reporting—For reporting on headcount data
• Non Compensation data for Reporting—For reporting on non compensationinformation
To access the data maps:
1. Click Application
, then Data Exchange
, and then Data Maps.
2. Click the data map to use, and then from Actions, click Push Data.The data in the reporting cube is always cleared before data is pushed to it.
The Administering Planning for Oracle Planning and Budgeting Cloud guide describeshow to set up and change data maps.
Analyzing Project UtilizationIf you enabled integration between Workforce and Projects, the Projects Utilization
Analysis component provides predefined analysis dashboards andforms that give you insight into workforce metrics.
Watch this tutorial video to learn about analyzing employee utilization in projects.
Tutorial Video
1. To review project utilization, from the Home page, click Workforce, thenAnalysis, and then the Project Utilization tab.
2. From the Actions menu, click Aggregate.
3. Click the horizontal tabs to review dashboards for information on:
Chapter 4Reporting on Data
4-14
• Utilization and staffing overview.
• FTE requirement across projects.
• Employee utilization. You can also reassign employees to projects as needed.
• FTE requirement by project.
• Employee utilization.
• Employee assignments.
Chapter 4Analyzing Project Utilization
4-15
5Working With Projects
Related Topics
• Task Overview
• Setting User Variables
• Adding Projects and Entering Project Details
• Entering Project Assumptions
• Planning Expenses
• Planning Revenue
• Capitalizing Projects
• Running Project Rules
• Using Rolling Forecast with Projects
• Preparing Forecast Data
• Analyzing Project Financials With Dashboards
• Analyzing Project Performance
Task OverviewReview the tasks you'll perform in Projects. In general, you'll plan projects in this order:
1. Set user variables. Setting User Variables.
2. Enter project details. See Adding Projects and Entering Project Details.
3. Review or enter project standard rate assumptions set up by your administrator.See Entering Project Assumptions.
4. Manage project expenses and revenue, including setting up driver-basedassumptions for expenses and revenue. See Planning Expenses and PlanningRevenue.
5. Optionally:
• For capital projects, if Projects is integrated with Capital, you can plan forcapitalization of projects. See Capitalizing Projects.
• For contract projects, define revenue recognition performance obligations andpercentages, and perform revenue recognition what-if analysis. See DefiningRevenue Recognition Obligation Details.
• Analyze projects over a rolling forecast range. See Using Rolling Forecast withProjects.
6. Review dashboards and analytics. See Analyzing Project Financials WithDashboards and Analyzing Project Performance.
5-1
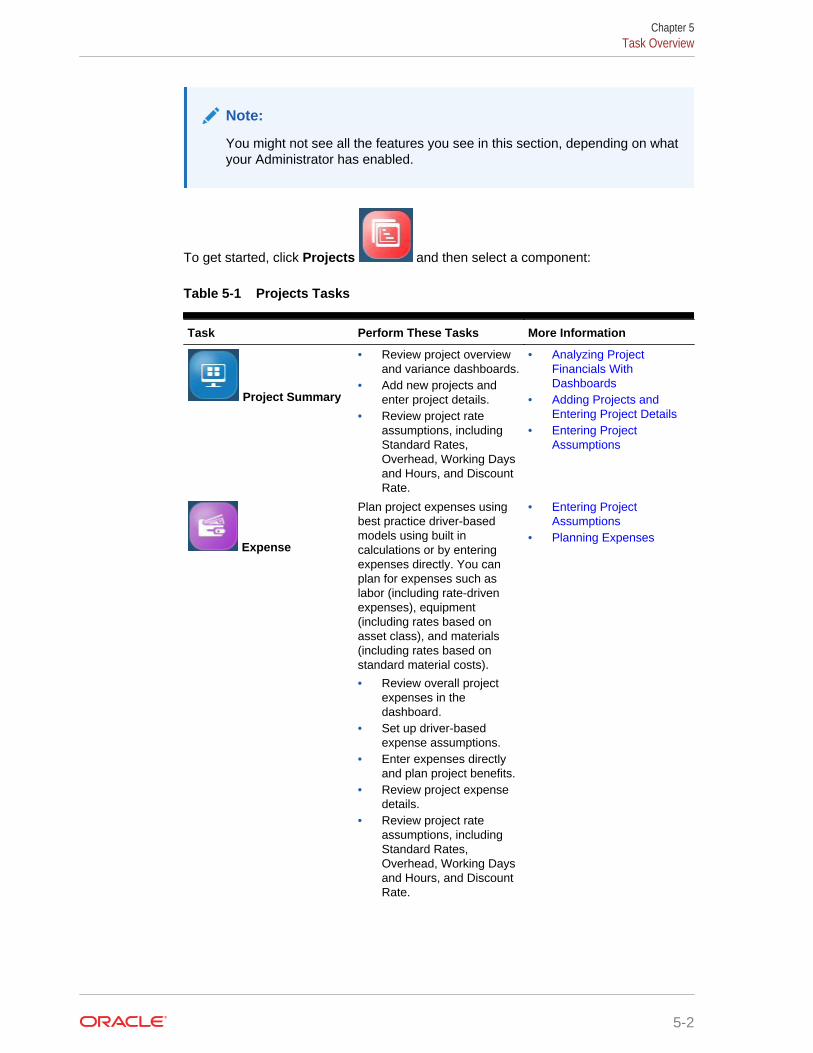
Note:
You might not see all the features you see in this section, depending on whatyour Administrator has enabled.
To get started, click Projects and then select a component:
Table 5-1 Projects Tasks
Task Perform These Tasks More Information
Project Summary
• Review project overviewand variance dashboards.
• Add new projects andenter project details.
• Review project rateassumptions, includingStandard Rates,Overhead, Working Daysand Hours, and DiscountRate.
• Analyzing ProjectFinancials WithDashboards
• Adding Projects andEntering Project Details
• Entering ProjectAssumptions
Expense
Plan project expenses usingbest practice driver-basedmodels using built incalculations or by enteringexpenses directly. You canplan for expenses such aslabor (including rate-drivenexpenses), equipment(including rates based onasset class), and materials(including rates based onstandard material costs).
• Review overall projectexpenses in thedashboard.
• Set up driver-basedexpense assumptions.
• Enter expenses directlyand plan project benefits.
• Review project expensedetails.
• Review project rateassumptions, includingStandard Rates,Overhead, Working Daysand Hours, and DiscountRate.
• Entering ProjectAssumptions
• Planning Expenses
Chapter 5Task Overview
5-2
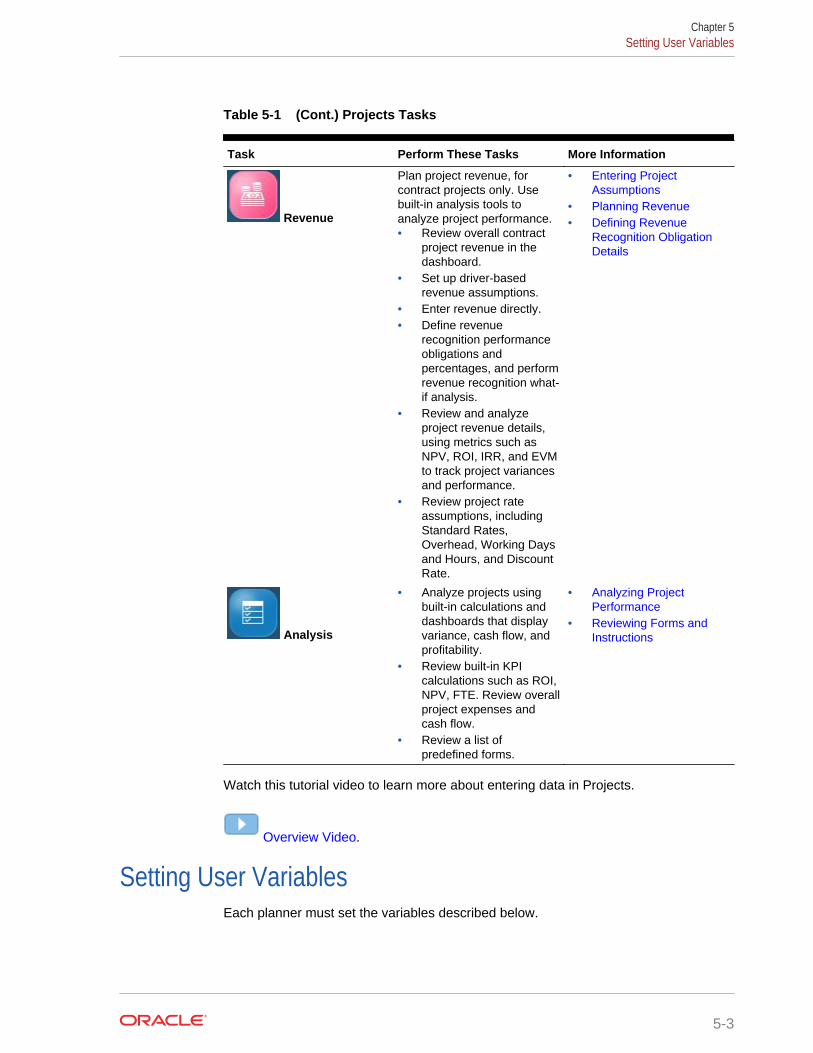
Table 5-1 (Cont.) Projects Tasks
Task Perform These Tasks More Information
Revenue
Plan project revenue, forcontract projects only. Usebuilt-in analysis tools toanalyze project performance.• Review overall contract
project revenue in thedashboard.
• Set up driver-basedrevenue assumptions.
• Enter revenue directly.• Define revenue
recognition performanceobligations andpercentages, and performrevenue recognition what-if analysis.
• Review and analyzeproject revenue details,using metrics such asNPV, ROI, IRR, and EVMto track project variancesand performance.
• Review project rateassumptions, includingStandard Rates,Overhead, Working Daysand Hours, and DiscountRate.
• Entering ProjectAssumptions
• Planning Revenue• Defining Revenue
Recognition ObligationDetails
Analysis
• Analyze projects usingbuilt-in calculations anddashboards that displayvariance, cash flow, andprofitability.
• Review built-in KPIcalculations such as ROI,NPV, FTE. Review overallproject expenses andcash flow.
• Review a list ofpredefined forms.
• Analyzing ProjectPerformance
• Reviewing Forms andInstructions
Watch this tutorial video to learn more about entering data in Projects.
Overview Video.
Setting User VariablesEach planner must set the variables described below.
Chapter 5Setting User Variables
5-3
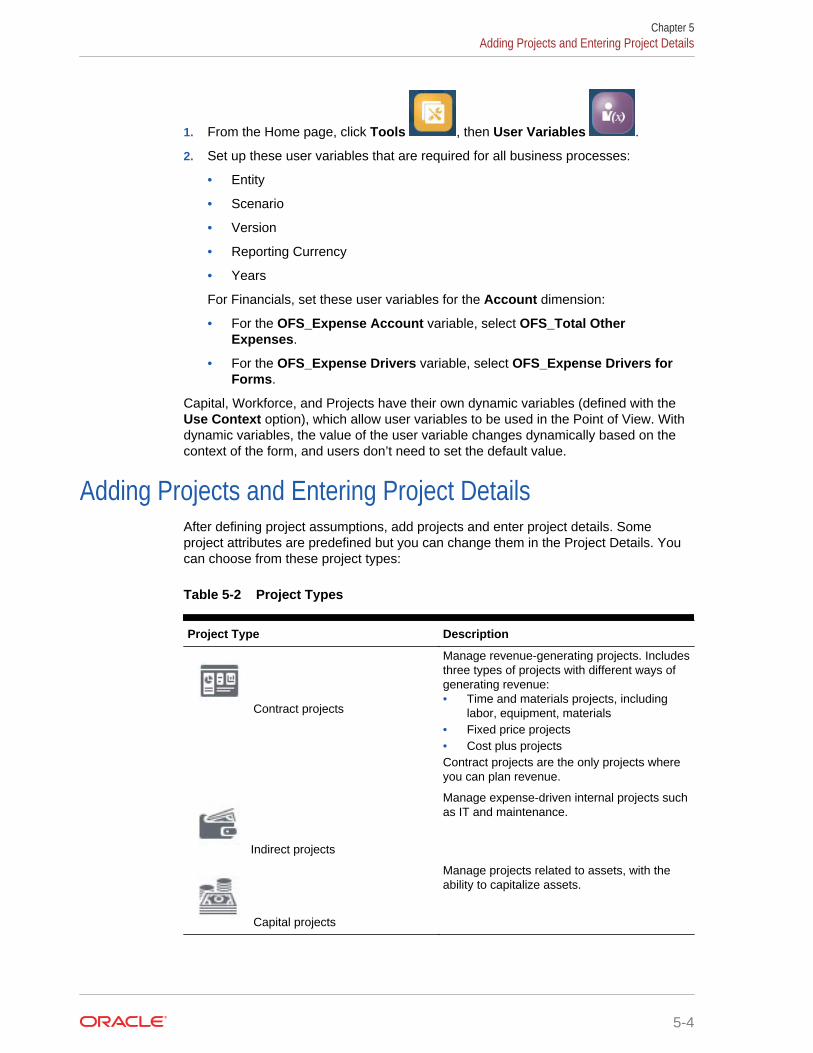
1. From the Home page, click Tools , then User Variables .
2. Set up these user variables that are required for all business processes:
• Entity
• Scenario
• Version
• Reporting Currency
• Years
For Financials, set these user variables for the Account dimension:
• For the OFS_Expense Account variable, select OFS_Total OtherExpenses.
• For the OFS_Expense Drivers variable, select OFS_Expense Drivers forForms.
Capital, Workforce, and Projects have their own dynamic variables (defined with theUse Context option), which allow user variables to be used in the Point of View. Withdynamic variables, the value of the user variable changes dynamically based on thecontext of the form, and users don’t need to set the default value.
Adding Projects and Entering Project DetailsAfter defining project assumptions, add projects and enter project details. Someproject attributes are predefined but you can change them in the Project Details. Youcan choose from these project types:
Table 5-2 Project Types
Project Type Description
Contract projects
Manage revenue-generating projects. Includesthree types of projects with different ways ofgenerating revenue:• Time and materials projects, including
labor, equipment, materials• Fixed price projects• Cost plus projectsContract projects are the only projects whereyou can plan revenue.
Indirect projects
Manage expense-driven internal projects suchas IT and maintenance.
Capital projects
Manage projects related to assets, with theability to capitalize assets.
Chapter 5Adding Projects and Entering Project Details
5-4
Adding Projects
To add a new project:
1. Click Project Summary .
2. Select the vertical tab for the type of project you want to add (Contract, Indirect,or Capital) and then click Project Details.
You see tabs only for the project types that are enabled.
3. From the Actions menu, select Add New Project.
4. Enter a project name, description, and start and end dates.
5. Add project details. Project details vary depending on the project type.
For Contract projects, you also specify the project type (time and materials, fixedprice, cost plus). If Revenue is enabled for contract projects, you also specify:
• Revenue Recognition—when the revenue will be recognized:
– Monthly, Quarterly, or Semiannually
– After Completion
– When Billed—When you select this method, you must also specify theperiod and year for revenue recognition in the Revenue ObligationDetails form. See Defining Revenue Recognition Obligation Details.
– Performance Obligation—Allows you to recognize revenue based on apercent completion method based on actual completion of the contract.You define performance obligation details and the % allocation that woulddetermine the transaction prices, which allows you to simulate recognizedrevenue. This method can help you simulate the US GAAP ASC 606 andIFRS 15 requirements for contract projects. When you select this method,you specify the performance obligation details, revenue recognitionpercentages, and the period and year for revenue recognition in theRevenue Obligation Details form. See Defining Revenue RecognitionObligation Details.
• Revenue Cash Flow Incidence—how revenue cash flow is recognized.
Note:
If the project is set up with Override Rates set to Yes, planners can overridethe global standard rate (set by administrators) when setting up revenue andexpense drivers.
Entering Project AssumptionsPlanners set up expense and revenue assumptions for driver-based planning.
Chapter 5Entering Project Assumptions
5-5
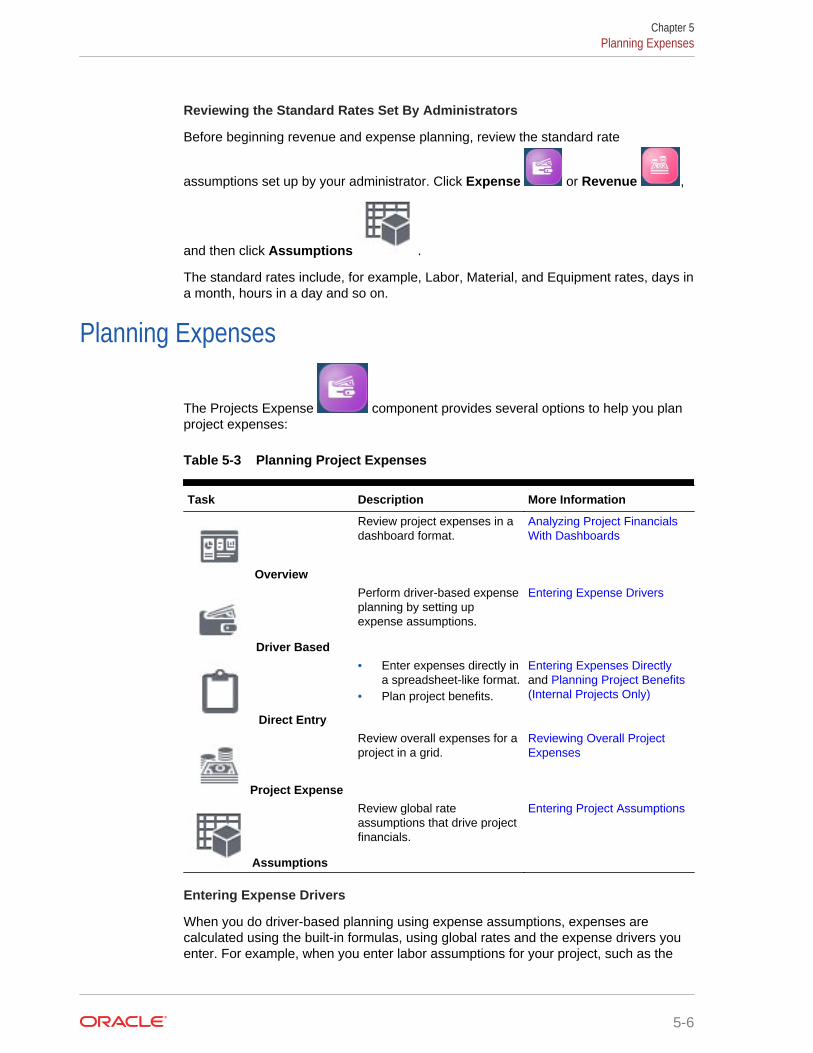
Reviewing the Standard Rates Set By Administrators
Before beginning revenue and expense planning, review the standard rate
assumptions set up by your administrator. Click Expense or Revenue ,
and then click Assumptions .
The standard rates include, for example, Labor, Material, and Equipment rates, days ina month, hours in a day and so on.
Planning Expenses
The Projects Expense component provides several options to help you planproject expenses:
Table 5-3 Planning Project Expenses
Task Description More Information
Overview
Review project expenses in adashboard format.
Analyzing Project FinancialsWith Dashboards
Driver Based
Perform driver-based expenseplanning by setting upexpense assumptions.
Entering Expense Drivers
Direct Entry
• Enter expenses directly ina spreadsheet-like format.
• Plan project benefits.
Entering Expenses Directlyand Planning Project Benefits(Internal Projects Only)
Project Expense
Review overall expenses for aproject in a grid.
Reviewing Overall ProjectExpenses
Assumptions
Review global rateassumptions that drive projectfinancials.
Entering Project Assumptions
Entering Expense Drivers
When you do driver-based planning using expense assumptions, expenses arecalculated using the built-in formulas, using global rates and the expense drivers youenter. For example, when you enter labor assumptions for your project, such as the
Chapter 5Planning Expenses
5-6
job class, rate, start and end dates, the total project labor costs are automaticallycalculated using the rates per job class and the start and end dates.
To use driver-based expense planning, review the existing rates your administratorentered, and then add and modify your expense assumptions.
1. Click Expense .
2. Click Driver Based .
3. Select the horizontal tab for the expense assumptions you want to enter and selectthe members from the Point of View, and then review or update driver details.
• Labor—Enter details for labor assumptions for each job or job code, such asstart and end date, FTE, location.
• Equipment—For each type of equipment, enter start and end dates and units.
• Material—For each type of material, enter cash flow incidence. Set thepayment terms for expenses; the selected value impacts the cash outflow onthe project. Options are: Two months prior, one month prior, current month,next month, 2 months after, 3 months after, 4 months after.
• Other—Enter any additional resources and the cash flow incidence or othercustom assumptions for each.
4. If the project is set up with Override Rates set to Yes, and the global rate is notcorrect for a project, enter the new rate.
5. To add or remove expense assumptions, from the Actions menu, select Add LineItems or Remove Line Item.
6. When you've finished entering expense assumptions, from the Actions menu,select Calculate Expenses.
Note:
If Projects is integrated with Workforce, calculating expenses pushesdata such as utilization to Workforce. Then, in Workforce you must alsoselect Aggregate from the Actions menu.
If Projects is integrated with Financials, and expense accounts aremapped, calculating expenses and rolling up Projects pushes data toFinancials.
Entering Expenses Directly
You can directly enter project expenses. When you enter expenses directly, no driver-based calculations are used.
When you change project dates, or when you import projects, before directly enteringexpenses, on the Project Details form, from the Actions menu, click Refresh ProjectDates.
Chapter 5Planning Expenses
5-7
1. Click Expenses .
2. Click Direct Entry .
3. Select the project from the Point of View, and then select expense types and enterexpense details on each row.
Tip:
You can copy a cell value and drag the cursor to fill all the cells in a row.
If you enter at the Year total level, values are automatically spreadevenly to lower levels.
4. From the Actions menu, you can select Add Line Items or Remove Line Item.
5. When you've finished entering expenses, from the Actions menu, selectCalculate Expenses.
Planning Project Benefits (Internal Projects Only)
In addition to planning expenses, you can also plan for tracking project benefits forboth capital and indirect projects. By planning project benefits, you can quantify thefinancial benefits to help justify the need for the project. For example, if you are settingup a new web site, you can track financial benefits that might come out of the project.For example, you might get incremental revenue from leads from the web site, or, ifyou handle queries on the web site, you might see call center savings. Or a new videoconferencing facility can lead to savings on travel expenses.
You can also plan the non-financial benefits of a project, which can be used to justify aproject and help measure a project's success. For example, a new web site mightimprove the customer satisfaction index, or you might see an incremental increase inyour user base by investing in the project. You can quantify the benefits and map themto various project accounts.
1. Click Expenses .
2. Click Direct Entry .
3. Select Project Financial Benefits to enter financial benefits for the selectedaccount. Enter any assumptions about the benefit, and enter the benefit amount.
The benefit amount is used in ROI and other KPI calculations to justify the project.The financial benefits can be mapped to a revenue account or an expenseaccount. Based on this definition, the amounts are assigned to the respectivefinancial accounts.
Chapter 5Planning Expenses
5-8
4. Select Project Non Financial Benefits and select a non financial benefit. Enterany assumptions about the benefit and enter a value.
Non financial benefits help set additional measurable targets to justify the projectover and above the financial benefits. While these are not used in KPIcalculations, they can be tracked to quantify the benefit. For example, if you wantto set the user base to grow to a certain level based on a marketing campaignproject, set the target values here.
You can also capture additional qualitative project benefits that aren't trackablewith numbers that can help justify projects. For example, you could note thatcustomers will have a better user experience with the improved web site design.
Rules are run when you save and the KPIs are calculated based on the financialbenefits you specified. This is not applicable for non financial benefits because theyare not used for calculations.
Reviewing Overall Project Expenses
You can review an overall summary of project expenses in a spreadsheet-like format.Values come from driver-based expenses and from direct input.
1. Click Expenses. .
2. Click Project Expense .
3. Change the project or other members to review by selecting different membersfrom the Point of View.
Planning Revenue
The Projects Revenue component provides several options to help you planproject revenue (for contract projects only):
Table 5-4 Planning Project Revenue
Task Description More Information
Overview
Review project revenue in adashboard format.
Analyzing Project FinancialsWith Dashboards
Driver Based
Perform driver-based revenueplanning by setting up revenueassumptions. Define revenuerecognition performanceobligations and percentages,and perform revenuerecognition what-if analysis.
Entering Revenue Drivers and Defining Revenue RecognitionObligation Details
Chapter 5Planning Revenue
5-9
Table 5-4 (Cont.) Planning Project Revenue
Task Description More Information
Direct Entry
Enter revenue directly in aspreadsheet-like format.
Entering Revenue Directly
Analysis
Review overall revenue for aproject, project profitability,and project cash flow in a grid.
Reviewing Overall ProjectRevenue
Assumptions
Review global rateassumptions that drive projectfinancials.
Entering Project Assumptions
Entering Revenue Drivers
When you do driver-based planning using revenue assumptions, revenue is calculatedusing the built-in formulas, using the revenue drivers you enter. For example, you canset up labor or equipment assumptions for contract projects and indicate how revenueis recognized.
To use driver-based revenue planning, review the existing rates your administratorentered, and add and modify your own assumptions.
1. Click Revenue .
2. Click Driver Based .
3. Select the horizontal tab for the revenue assumptions you want to enter and enterassumption details.
• Labor—Enter revenue assumptions for labor such as billing rate.
• Material—Enter revenue assumptions for material such as billing rate per unit.
• Equipment—Enter revenue assumptions for equipment such as billing rate.
• Other—Set other revenue assumptions.
• Cost Plus—Set the Margin earned for a Cost Plus Project. The margin % canbe set on the Total Expense or at a more detailed level.
• Revenue Recognition What If—Set the revenue recognition terms for theproject and perform what-if analysis. See Defining Revenue RecognitionObligation Details.
4. If the project is set up with Override Standard Labor Rates, Override StandardEquipment Rates, or Override Standard Materials Rates set to Yes, and theglobal rate is not correct for a project, enter the new rate.
Chapter 5Planning Revenue
5-10
5. To add or remove revenue assumptions, from the Actions menu, select Add LineItems or Remove Line Item.
6. When you've finished entering revenue assumptions, from the Actions menu,select Calculate Revenues.
Entering Revenue Directly
You can directly enter project revenue. When you enter revenue directly, no driver-based calculations are used.
When you change project dates, or when you import projects, before directly enteringrevenue, on the Project Details form, from the Actions menu, click Refresh ProjectDates.
1. Click Revenue .
2. Click Direct Entry .
3. Select the project from the Point of View, and then select revenue types and enterrevenue details on each row.
Tip:
You can copy a cell value and drag the cursor to fill all the cells in a row.
If you enter at the Year total level, values are automatically spreadevenly to lower levels.
4. From the Actions menu, you can select Add Line Items or Remove Line Item.
5. When you've finished entering revenue, from the Actions menu, select CalculateRevenue.
Reviewing Overall Project Revenue
You can review an overall summary of project revenue in a spreadsheet-like format.Values come from driver-based expenses and from direct input.
1. Click Revenue. .
2. Click Analysis .
3. Change the project or other members to review by selecting different membersfrom the Point of View.
4. Click the horizontal tabs to review total project revenue, project profitability, orproject cash flow.
Chapter 5Planning Revenue
5-11
Defining Revenue Recognition Obligation DetailsFor revenue-generating contract projects, if the revenue recognition methods is WhenBilled or Performance Obligation, you must specify the period and year for revenuerecognition. Additionally, when the revenue recognition method is PerformanceObligation, you specify revenue recognition percentages against obligations that youdefine. Revenue allocated to a performance obligation should be recognized when thegoods or services are transferred to the customer, which occurs when the customerhas control of the asset or use of the service.
You can perform revenue recognition what-if analysis by analyzing different revenuerecognition terms, helping in the decision making process to decide on the financialterms of contract projects based on the performance obligation details.
Using the When Billed or Performance Obligation method can help you simulate theUS GAAP ASC 606 and IFRS 15 requirements for contract projects.
Before performing this task, complete these tasks:
1. Create a contract project with a revenue recognition method of When Billed orPerformance Obligation.
2. Enter project expenses (either directly or by drivers), and then from the Actionsmenu, select Calculate Expenses.
3. Enter project revenue (either directly or by drivers), and then from the Actionsmenu, select Calculate Revenues.
To define revenue obligation details for a contract project that has a RevenueRecognition method of When Billed or Performance Obligation:
1. Click Revenue , then Driver-Based , and then RevenueRecognition What If to open the Revenue Recognition dashboard.
2. In Project Details, review the details. You can also change the revenuerecognition method.
3. In Revenue Obligation Details, enter obligation details that describe either amilestone or specific terms of the contract that need to be fulfilled based on whenyou plan to recognize the revenue, and then save your changes:
• Obligation Details—Enter a description of each obligation for the project. Aperformance obligation is defined as a promise to transfer a good or service.
• Revenue Recognition—Enter the % of total revenue for the project thatneeds to be recognized when each obligation is fulfilled. This step is requiredonly when the Revenue Recognition method is Performance Obligation; it isnot required for When Billed.
• When Period—Select the period in which to recognize the revenue for eachobligation.
• When Year—Select the year in which to recognize the revenue for eachobligation.
Chapter 5Planning Revenue
5-12
When you save the form, based on the % of revenue recognition input, therecognized revenue, unearned revenue, and accrued revenue are calculated permonth and year.
4. In Total Project Revenue, review the impact of your changes to unearned,accrued, and recognized revenue in a grid.
5. In Revenue Recognition Trend, review the impact of your changes to therecognized revenue and unearned revenue in a trend line.
Performing Revenue Recognition What-If Analysis
You can perform what-if analysis for revenue recognition using the RevenueRecognition What If dashboard. You can use milestone-based revenue recognition tounderstand the impact of various contract project scenarios on profit and loss. Forexample:
• Use the Project Details form to change the revenue recognition method for aproject.
• Use the Revenue Obligation Details form to modify the obligations, percentages,and periods for recognizing revenue.
Review the impact of your changes in the Total Project Revenue grid or in theRevenue Recognition Trend graph.
Watch this overview video to learn more about defining revenue recognition obligationdetails and performing what-if analysis.
Overview Video.
Capitalizing ProjectsFor capital projects, you can allocate project expenses either partially or in full to oneor more assets. For example, if you have a project related to building a new facility,you might allocate equipment costs to the Machinery and Equipment asset class.
To capitalize projects:
1. Click Project Summary .
2. Click Capital and then click Project Capitalization.
3. In the Total Project Expenses area, select a project and view your total projectexpenses.
4. In the Allocate Expense to Asset area, select a project expense you want tocapitalize, and then select the corresponding capital expense account. Also selectthe asset class (for example, Machinery or Buildings) where you plan the expenseto be capitalized. You can select one or multiple assets for the expense to beallocated. Choose the same asset class/asset in case you want multiple expensesto be assigned to same asset. Indicate how much of the cost should be capitalized
Chapter 5Capitalizing Projects
5-13
(making it a capital expense versus an operating expense) and enter capitalizationdetails.
When you save, the Total Project Expenses area is updated to show thecapitalized expense compared to the total expense.
The Capital Work in Progress area is updated with the capitalized projects.
5. In the Capital Work in Progress area, add additional details for each capitalizedasset and specify the planned inservice date, which drives the depreciation andother expense calculations.
6. From the Action menu, select Calculate Depreciation.
The depreciation for the assigned capital project asset is calculated, based on theinservice date.
The capitalized assets are pushed from Projects to Capital. In Capital, in New AssetPlanning, select the asset class and project to see the capitalized asset’s value andassociated depreciation.
Running Project RulesIf you are responsible for several projects and would like to see rolled up project levelat entity level, run these rules:
• Rollup Projects
• Rollup Project Cube
Using Rolling Forecast with ProjectsIf your administrator set up rolling forecast for Projects, after you plan and forecastyour projects, you can analyze projects over a rolling forecast time period range.
To review your projects in a rolling forecast time period range, click Projects ,
then Analysis , and then Rolling Forecast .
Rolling forecast forms and dashboards are set up based on the rolling forecast range.
When your administrator updates the current time period, rolling forecast forms anddashboards are automatically updated to add or drop time periods to reflect theupdated rolling forecast range.
Preparing Forecast DataTo prepare forecast data, complete these tasks:
1. Create a project.
2. Enter project expenses (either directly or by drivers), and then from the Actionsmenu, select Calculate Expenses.
Chapter 5Running Project Rules
5-14
3. Enter project revenue (either directly or by drivers), if appropriate for your project,and then from the Actions menu, select Calculate Revenues.
4. Prepare forecast data by copying data from the Plan scenario to the Forecastscenario using one of these two methods:
• Approve the project: Click Project Summary , then the vertical tab forthe project type, and then Project Details. Select the project, and then fromthe Actions menu, select Approve Project.
• Copy data from the Plan scenario to the Forecast scenario: Click Project
Summary , then the vertical tab for the project type, and then ProjectDetails. From the Actions menu, select Copy Projects. Specify details forsource and target scenario and version, and then click Launch.
5. Prepare forecast data by copying Actual data to the Forecast scenario: From the
Home page, click Rules , and then Prepare Detailed Forecast Data.Specify details for the entity, projects, Plan scenario and version, and the monthsand years that contain Actual data, and then click Launch.
Now the Forecast scenario includes Actuals for the specified months and year, andPlan data for the rest of the future periods. Any data that was previously in theForecast scenario is now in Prior FCST.
Analyzing Project Financials With DashboardsPredefined dashboards give you insight into overall project financials and expense andrevenue metrics. You can drill in to members in dashboard charts to see the level ofdetail you want.
Project Dashboards
At any time during your planning process, use the dashboards in Project Summary toget an overview of your projects. There are dashboards for each enabled project type.
1. Click Project Summary .
2. Click the vertical tab for the project type:
• Contract
• Indirect
Chapter 5Analyzing Project Financials With Dashboards
5-15
• Capital
3. Click the horizontal tab for the type of dashboard you want to see:
• Projects Overview for an overview
• Projects Variance to see project variance measures
• EVM (Earned Value Management) to see project schedule variances
4. Use the Point of View bar to select different dimension members to display in theform, for example to select a different project or entity.
Expense Dashboards
Review the expense dashboard to see an overall summary of project expenses andmetrics in chart form.
1. Click Expenses .
2. If it's not already selected, click Overview .
3. Use the Point of View bar to select different dimension members to display in theform, for example to select a different project or entity.
Revenue Dashboards
Review the revenue dashboard to see an overall summary of project revenue andmetrics in chart form.
1. Click Revenue .
2. If it's not already selected, click Overview .
3. Use the Point of View bar to select different dimension members to display in theform, for example to select a different project or entity.
Analyzing Project EVMProjects provides rules and dashboards that make it easy to measure and analyzeproject EVM. To analyze EVM measures, you must first prepare forecast data. See Preparing Forecast Data.
Once you have Forecast data, you can analyze project EVM.
To analyze project EVM:
Chapter 5Analyzing Project Financials With Dashboards
5-16
1. Click Project Summary , then the vertical tab for the project type, andthen EVM.
2. In the Enter % Complete Estimate form, enter a value for % Complete for theproject for the current month, and then save the form.EVM measures are calculated when you save the form.
Perform this step each month to update the percent complete for the project.
3. Review the updated EVM measures in the EVM dashboard.
Analyzing Project Performance
The Projects Analysis component provides predefined analysis dashboardsthat give you insight into overall project financials and KPIs.
You can track and analyze performance at a project level or, if programs are enabled,also at the program level.
Table 5-5 Analyzing Project Performance
Task Description
Overview
Get an overview of project performanceincluding variance, profitability, and cash flowin a dashboard.
Profitability
Review project expenses and project cashflow in a grid.
Use the Project Detailed Analysis form tosee a summary of the KPIs for each project soyou can evaluate project performance for allprojects in one place.
Program
If your administrator enabled the Programdimension, and you mapped projects toprograms, review program KPIs including ROI,NPV, and Payback and program performancesuch as profitability and NPV in dashboards.
Rolling Forecast
If your administrator enabled Rolling Forecast,review forms and dashboards over the definedrolling forecast range.When your administrator updates the currenttime period, rolling forecast forms anddashboards are automatically updated to addor drop time periods to reflect the updatedrolling forecast range.
Click Analysis , and then click the type of analysis to review.
Chapter 5Analyzing Project Performance
5-17
You can drill in to members in dashboard charts to see the level of detail you want.Change the project or other members to review by selecting different members fromthe Point of View.
Note:
If you enabled integration between Workforce and Projects, the Workforce
Utilization Analysis component provides predefined analysisdashboards and forms that give you insight into workforce metrics. For moreinformation, see Analyzing Project Utilization.
If you enabled both Projects and Financials, and you mapped accounts, youcan review the data that was moved from Projects to Financials. See Reviewing Data from Workforce, Projects, and Capital.
Reviewing Forms and InstructionsYou can review all of the available forms and dashboards related to project planning,and review form instructions if your administrator provided them.
Click Analysis , and then click Forms .
Chapter 5Analyzing Project Performance
5-18
6Working With Capital
Related Topics
• Task Overview
• Setting User Variables
• Entering Capital Asset Assumptions
• Managing New Capital Investments
• Managing Existing Assets
• Managing Intangibles
• Analyzing Capital Financials with Dashboards
• Analyzing Capital Asset Financials
Task OverviewReview the tasks you'll perform in Capital. In general, you'll plan capital assets in thisorder:
1. Set user variables. See Setting User Variables.
2. Review or enter capital assumptions, including driver-based assumptions fordepreciation and amortization, funding assumptions, and other expenseassumptions. See Entering Capital Asset Assumptions.
3. Add new capital assets and new asset details, and manage new assets. ManagingNew Capital Investments.
4. Manage existing assets and intangible assets. See Managing Existing Assets and Managing Intangibles.
5. Get an overview of Capital financials with dashboards. See Analyzing CapitalFinancials with Dashboards.
6. Review the financial impact of Capital assets. See Analyzing Capital AssetFinancials.
Note:
You might not see all the features you see in this section, depending on whatyour Administrator has enabled.
To get started, click Capital and then select a component:
6-1
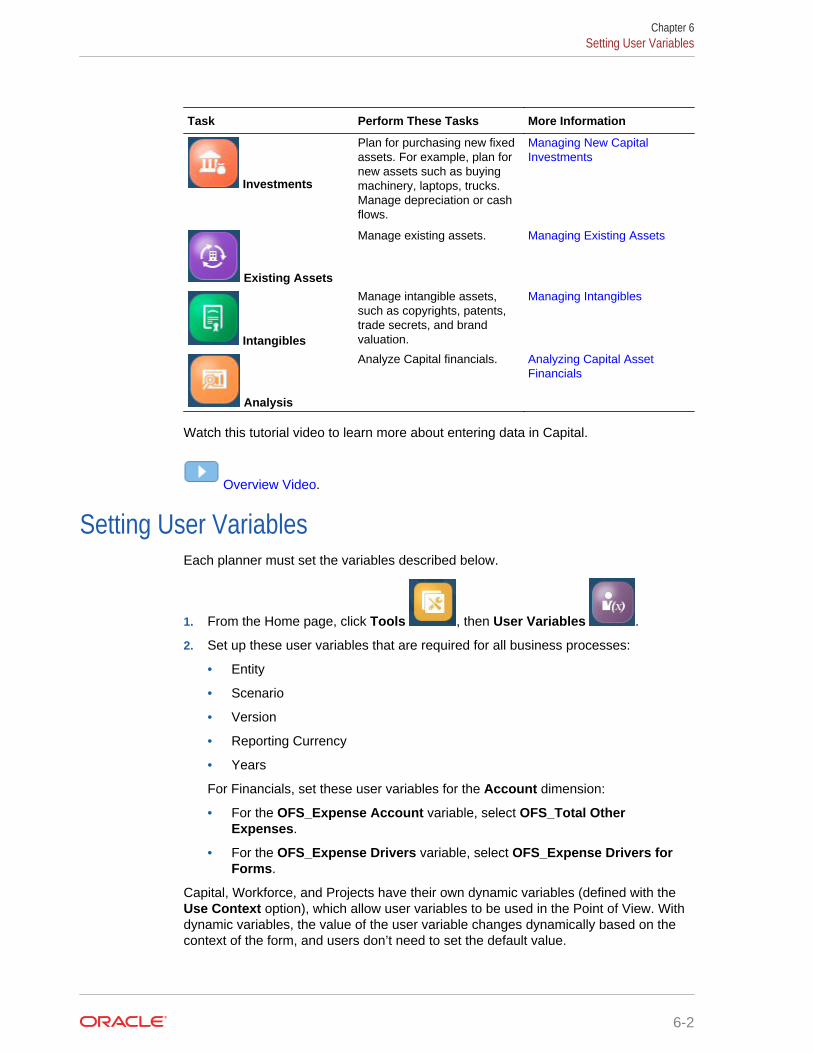
Task Perform These Tasks More Information
Investments
Plan for purchasing new fixedassets. For example, plan fornew assets such as buyingmachinery, laptops, trucks.Manage depreciation or cashflows.
Managing New CapitalInvestments
Existing Assets
Manage existing assets. Managing Existing Assets
Intangibles
Manage intangible assets,such as copyrights, patents,trade secrets, and brandvaluation.
Managing Intangibles
Analysis
Analyze Capital financials. Analyzing Capital AssetFinancials
Watch this tutorial video to learn more about entering data in Capital.
Overview Video.
Setting User VariablesEach planner must set the variables described below.
1. From the Home page, click Tools , then User Variables .
2. Set up these user variables that are required for all business processes:
• Entity
• Scenario
• Version
• Reporting Currency
• Years
For Financials, set these user variables for the Account dimension:
• For the OFS_Expense Account variable, select OFS_Total OtherExpenses.
• For the OFS_Expense Drivers variable, select OFS_Expense Drivers forForms.
Capital, Workforce, and Projects have their own dynamic variables (defined with theUse Context option), which allow user variables to be used in the Point of View. Withdynamic variables, the value of the user variable changes dynamically based on thecontext of the form, and users don’t need to set the default value.
Chapter 6Setting User Variables
6-2
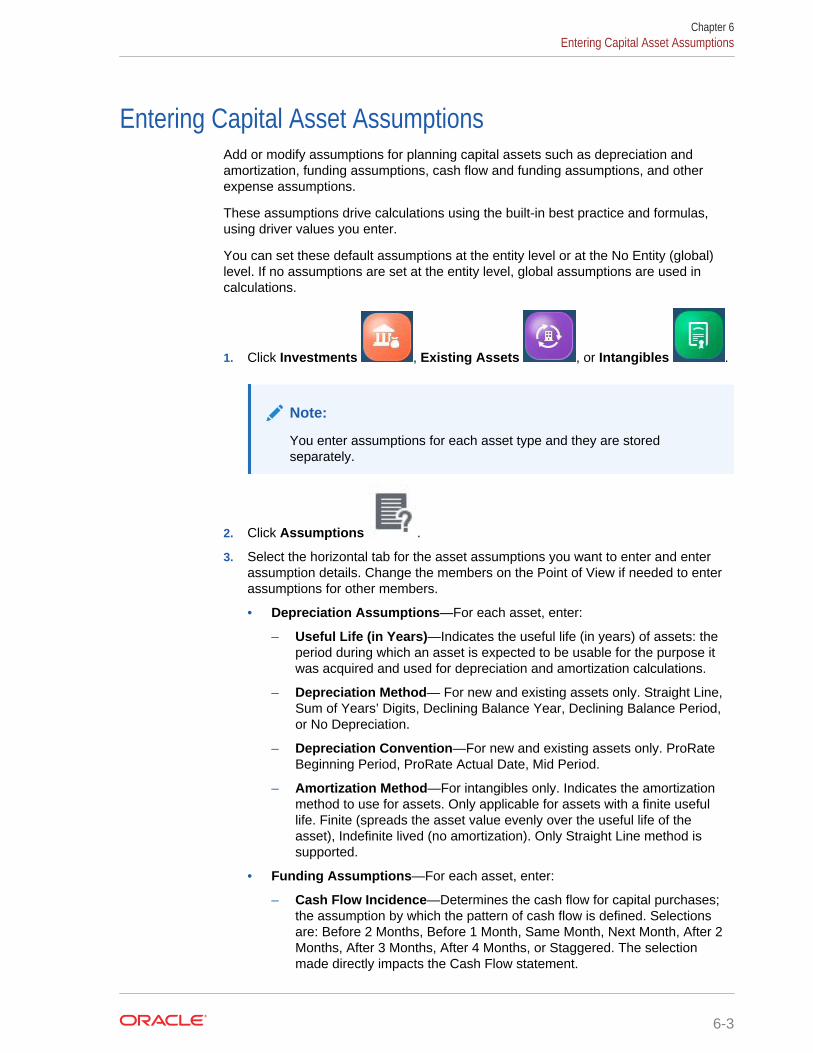
Entering Capital Asset AssumptionsAdd or modify assumptions for planning capital assets such as depreciation andamortization, funding assumptions, cash flow and funding assumptions, and otherexpense assumptions.
These assumptions drive calculations using the built-in best practice and formulas,using driver values you enter.
You can set these default assumptions at the entity level or at the No Entity (global)level. If no assumptions are set at the entity level, global assumptions are used incalculations.
1. Click Investments , Existing Assets , or Intangibles .
Note:
You enter assumptions for each asset type and they are storedseparately.
2. Click Assumptions .
3. Select the horizontal tab for the asset assumptions you want to enter and enterassumption details. Change the members on the Point of View if needed to enterassumptions for other members.
• Depreciation Assumptions—For each asset, enter:
– Useful Life (in Years)—Indicates the useful life (in years) of assets: theperiod during which an asset is expected to be usable for the purpose itwas acquired and used for depreciation and amortization calculations.
– Depreciation Method— For new and existing assets only. Straight Line,Sum of Years’ Digits, Declining Balance Year, Declining Balance Period,or No Depreciation.
– Depreciation Convention—For new and existing assets only. ProRateBeginning Period, ProRate Actual Date, Mid Period.
– Amortization Method—For intangibles only. Indicates the amortizationmethod to use for assets. Only applicable for assets with a finite usefullife. Finite (spreads the asset value evenly over the useful life of theasset), Indefinite lived (no amortization). Only Straight Line method issupported.
• Funding Assumptions—For each asset, enter:
– Cash Flow Incidence—Determines the cash flow for capital purchases;the assumption by which the pattern of cash flow is defined. Selectionsare: Before 2 Months, Before 1 Month, Same Month, Next Month, After 2Months, After 3 Months, After 4 Months, or Staggered. The selectionmade directly impacts the Cash Flow statement.
Chapter 6Entering Capital Asset Assumptions
6-3
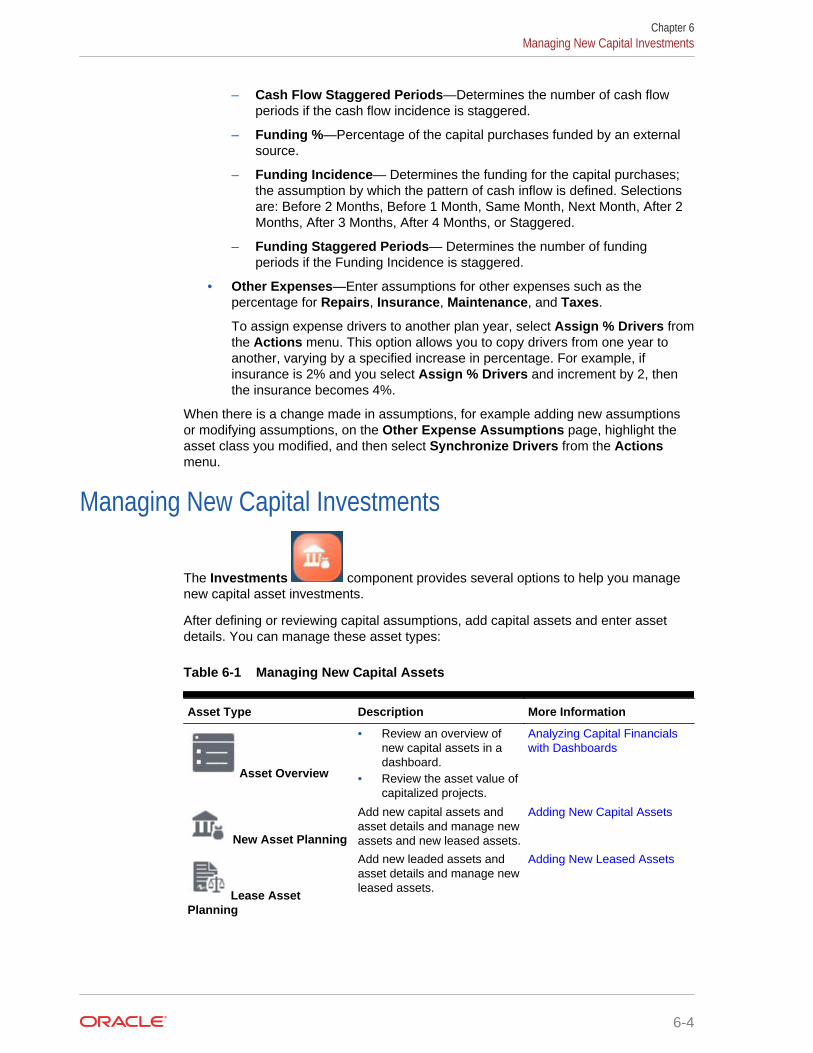
– Cash Flow Staggered Periods—Determines the number of cash flowperiods if the cash flow incidence is staggered.
– Funding %—Percentage of the capital purchases funded by an externalsource.
– Funding Incidence— Determines the funding for the capital purchases;the assumption by which the pattern of cash inflow is defined. Selectionsare: Before 2 Months, Before 1 Month, Same Month, Next Month, After 2Months, After 3 Months, After 4 Months, or Staggered.
– Funding Staggered Periods— Determines the number of fundingperiods if the Funding Incidence is staggered.
• Other Expenses—Enter assumptions for other expenses such as thepercentage for Repairs, Insurance, Maintenance, and Taxes.
To assign expense drivers to another plan year, select Assign % Drivers fromthe Actions menu. This option allows you to copy drivers from one year toanother, varying by a specified increase in percentage. For example, ifinsurance is 2% and you select Assign % Drivers and increment by 2, thenthe insurance becomes 4%.
When there is a change made in assumptions, for example adding new assumptionsor modifying assumptions, on the Other Expense Assumptions page, highlight theasset class you modified, and then select Synchronize Drivers from the Actionsmenu.
Managing New Capital Investments
The Investments component provides several options to help you managenew capital asset investments.
After defining or reviewing capital assumptions, add capital assets and enter assetdetails. You can manage these asset types:
Table 6-1 Managing New Capital Assets
Asset Type Description More Information
Asset Overview
• Review an overview ofnew capital assets in adashboard.
• Review the asset value ofcapitalized projects.
Analyzing Capital Financialswith Dashboards
New Asset Planning
Add new capital assets andasset details and manage newassets and new leased assets.
Adding New Capital Assets
Lease AssetPlanning
Add new leaded assets andasset details and manage newleased assets.
Adding New Leased Assets
Chapter 6Managing New Capital Investments
6-4
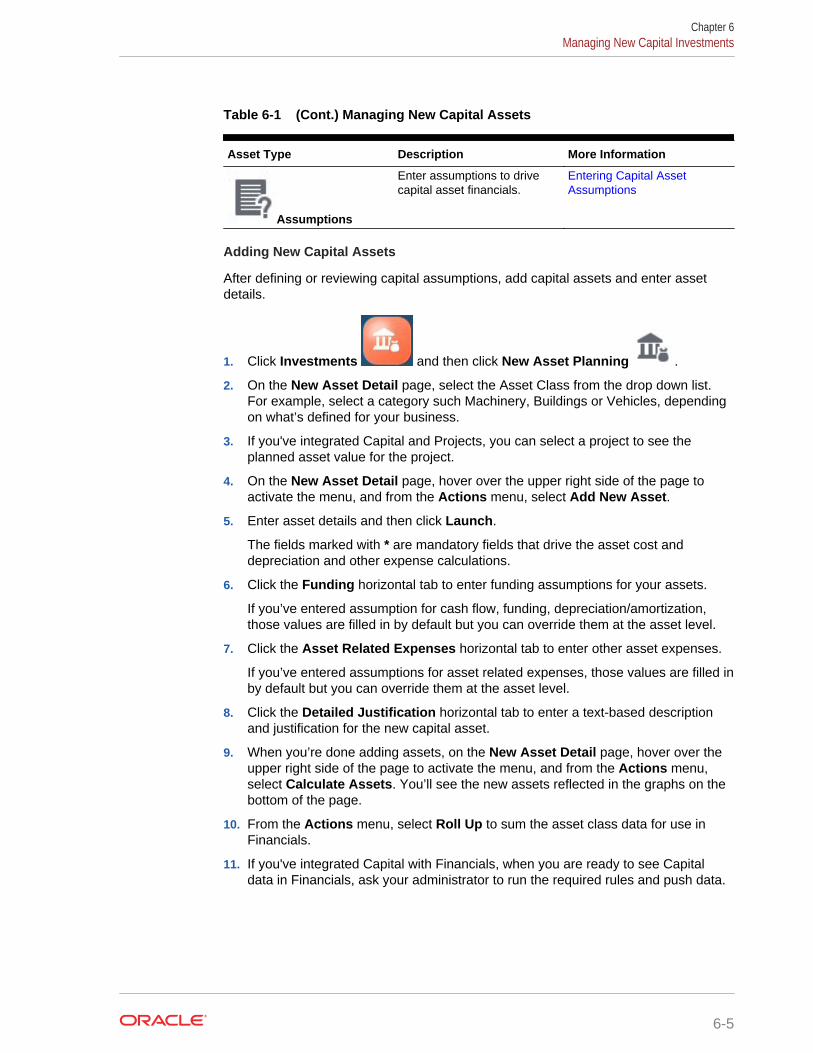
Table 6-1 (Cont.) Managing New Capital Assets
Asset Type Description More Information
Assumptions
Enter assumptions to drivecapital asset financials.
Entering Capital AssetAssumptions
Adding New Capital Assets
After defining or reviewing capital assumptions, add capital assets and enter assetdetails.
1. Click Investments and then click New Asset Planning .
2. On the New Asset Detail page, select the Asset Class from the drop down list.For example, select a category such Machinery, Buildings or Vehicles, dependingon what’s defined for your business.
3. If you've integrated Capital and Projects, you can select a project to see theplanned asset value for the project.
4. On the New Asset Detail page, hover over the upper right side of the page toactivate the menu, and from the Actions menu, select Add New Asset.
5. Enter asset details and then click Launch.
The fields marked with * are mandatory fields that drive the asset cost anddepreciation and other expense calculations.
6. Click the Funding horizontal tab to enter funding assumptions for your assets.
If you’ve entered assumption for cash flow, funding, depreciation/amortization,those values are filled in by default but you can override them at the asset level.
7. Click the Asset Related Expenses horizontal tab to enter other asset expenses.
If you’ve entered assumptions for asset related expenses, those values are filled inby default but you can override them at the asset level.
8. Click the Detailed Justification horizontal tab to enter a text-based descriptionand justification for the new capital asset.
9. When you’re done adding assets, on the New Asset Detail page, hover over theupper right side of the page to activate the menu, and from the Actions menu,select Calculate Assets. You’ll see the new assets reflected in the graphs on thebottom of the page.
10. From the Actions menu, select Roll Up to sum the asset class data for use inFinancials.
11. If you've integrated Capital with Financials, when you are ready to see Capitaldata in Financials, ask your administrator to run the required rules and push data.
Chapter 6Managing New Capital Investments
6-5
Note:
If you are integrating Capital with Projects, you can review capitalized assetsthat were pushed from Projects by selecting the asset class and project. Youcan review the New Assets from Projects and Capital Work in Progressdashboards to review capitalized projects information.
Note:
When adding an asset, if the salvage value is set to 0 (zero), the DB Year orDB Period depreciation method may not produce the desired results. Toproduce correct depreciation calculations when using the DB Yeardepreciation method, Oracle recommends that the salvage value be set to atleast 1% of the basic cost.
After calculating the asset, if currency precision is set to 0, depreciationvalues for Declining balance Year are rounded and may not appear correct.However, internally the full correct value is stored and used in calculations.
Removing Assets
You can remove a new asset:
On the New Asset Detail page, select the asset, and then from the Actions menu,select Remove Asset.
Adding New Leased Assets
There are two types of leased assets:
• Operating Lease—Similar to rental agreements, operating leases are for shortdurations. The lessor, who retains exposure to the risks and benefits of ownership,generally covers the maintenance, insurance, and repair costs of the asset.
• Capitalized Lease—Leases that last for almost the life of the asset and where theasset is worthless after the lease period. The lessee effectively assumes all therisks and benefits of ownership, including maintenance, repairs, insurance, andobsolescence. The lessor’s role is primarily to provide financing for the asset. Attermination, the asset is usually transferred to the lessee for a specified sum,which is similar to buying an asset in installments over time.
1. Click Investments and then click Lease Asset Planning .
2. On the New Asset Detail page, select the Asset Class from the drop down list.For example, select a category such Desktop, Furniture, or Office Equipment,depending on what’s defined for your business.
3. If you’ve integrated Capital and Projects, select a project to associate the assetwith.
Chapter 6Managing New Capital Investments
6-6
4. On the Lease Asset Planning page, hover over the upper right side of the pageto activate the menu, and from the Actions menu, select Add New LeasedAsset.
5. On the Add Leased Asset Form, enter details such as lease term, lease payment,payment frequency, and then click Launch.
6. Click Calculate Lease to see the updated impact of leased assets on the financialstatements. Capitalized leases affect the Income Statement and the BalanceSheet, whereas operating leases affect only the Income Statement.
Note the following about Present Value of Lease calculations:
• Payment timing is not considered in the calculation for Present Value of Lease.
• When the payment frequency is anything other than annual, the present value ofthe lease is calculated based on the Lease Payment value (as entered by theuser) and by converting the actual value the user entered for the interest rate andnumber of periods, based on the payment frequency .
• Present Value of Lease is not displayed as a negative number.
When a leased asset is added, Capital automatically selects a lease type (OperatingLease or Capitalized Lease) based on the parameters entered. After you add a leasedasset, you can change the lease type on the New Leased Asset Details form. Notethat if you change the asset parameters later, you must also remember to change thelease type, if applicable.
Criteria that Capital applies when classifying a lease as Operating versus Capitalized:
• Transfer of ownership at the end of the lease term
• Purchase option at a certain date during the lease period at a bargain (much lessthan the expected market value of the asset at that time)
• The lease term is for the major part of the asset's useful life (at least 75% of theasset’s useful life)
• The present value of the lease payments exceeds 90% of the initial value of theasset
Impact of leasing type on financial statements:
• Operating Lease—The lease payments are recorded as operating expense (rentexpense) on the Income Statement.
• Capitalized Lease:
– Records an asset and liability on the Balance Sheet to reflect the value ofequipment and the obligation of the lease payments respectively (debt)
– Depreciates the asset over its useful life, which reduces the asset on theBalance Sheet and generates a depreciation expense on the IncomeStatement
– The interest associated with the lease must be listed as an expense on theIncome Statement (imputed interest payment)
Converting New Assets to Existing Assets
When you are ready to reconcile a planned new asset to an existing asset, on the NewAsset Detail page or Lease Asset Planning page, select the asset and then from theActions menu, select Convert New to Existing.
Chapter 6Managing New Capital Investments
6-7
The asset and all the associated data is moved from new to existing assets.
Removing Lease Assets
You can remove a lease asset:On the Lease Asset Planning page, select the asset, and then from the Actionsmenu, select Remove Asset.
Managing Existing Assets
The Existing Assets component provides several options to help youmanage existing capital assets.
Table 6-2 Managing Existing Assets
Task Description More Information
Overview
Review overview and variancedashboards for existing capitalassets.
Analyzing Capital Financialswith Dashboards
Manage Assets
Manage existing assets:• Retirements and transfers• Funding assumptions• Asset-related expense
drivers• Improvements
• Transferring and RetiringExisting Assets
• Improving Existing Assets
Existing LeasedAssets
Manage existing leasedassets.
Managing Existing LeasedAssets
Assumptions
Enter assumptions to drivecalculations for existingassets.
Entering Capital AssetAssumptions
Transferring and Retiring Existing Assets
You can transfer or retire existing assets when needed. For example, transferownership of an asset to another organization or retire it by selling it or writing off itsvalue.
1. Click Existing Assets and then click Manage Assets .
2. Select the asset, and then hover to see the Actions menu, and then selectTransfer Asset or Retire Asset.
3. Enter transfer details for the asset such as the Transfer To entity, the date, and thejustification. Or, enter retirement details such as the retirement date, whether it’s asale or a write-off, the retire costs, and the sale or write-off value.
Chapter 6Managing Existing Assets
6-8
4. For the target entity, you must calculate the assets: Navigate to the target entity (inthe Point of View bar), and from the Actions menu, select Calculate Asset.
The asset cost is no longer included in calculations as of the time of retirement. If youtransferred the asset, you see that the asset is transferred to the other entity.
Improving Existing Assets
Facilities and cost center managers plan for improving assets (for example, upgradingan asset, adding floor space, and so on). Enter details, such as the improvementname for the asset, description, asset units, asset rate, salvage value, physicallocation, purchase date, and in-service date.
Note:
Before you improve an asset, you must select the Enable for DynamicChildren member property for the Asset Detail and specify the Number ofPossible Dynamic Children, and then refresh the application. Thisessentially is splitting the asset from one asset to multiple assets. To allowplanners to improve the assets, enable dynamic parent property for the assetyou want to improve. The existing asset detail should be loaded against achild under this parent to represent the base asset. All other improvementswill be captured as a sibling to this base asset.
For example, create a member under the asset and load the existing assetdetail against that. Here is how the hierarchy would look:
Office Building No#3020 - Enable Dynamic Parent Property
• Office Building No#3020- Base Asset
• Office Building No#3020 - Improvement 1
• Office Building No#3020 - Improvement 2
In this example, when the Asset Detail dimension is being built, load theParent member and the Base Asset and load all data against the Base Assetmember. Improvement 1 and Improvement 2 members are created when youlaunch the Improvement rule in Capital. (Planners can rename theimprovements.)
1. Click Existing Assets and then click Manage Assets. .
2. Select Improvements on the horizontal tabs.
3. Select an asset, and then from the Actions menu, select Improvement.
4. Enter details, such as the improvement name for the asset, description, assetunits, asset rate, salvage value, physical location, purchase date, and in-servicedate and then click Launch.
The asset with the improvement name is added below the original asset.
Chapter 6Managing Existing Assets
6-9
Managing Existing Leased Assets
You manage existing leased assets in the same way you manage existing assets.
1. Click Existing Assets and then click Existing Leased Assets
.
2. Manage expenses, amortization, and so on.
3. Hover to see the Actions menu, and then select Calculate All and Roll Up. Thisaggregates data for Total Entity, Total Fixed Asset, and any custom dimensionsthat are enabled.
Managing Intangibles
The Intangibles component provides several options to help you manageintangible assets (assets such as leasehold improvements, software rights, tradesecrets, and brand valuation).
Table 6-3 Managing Intangibles
Task Description More Information
Overview
Review an overview ofintangible asset financials.
Analyzing Capital Financialswith Dashboards
New Intangibles
Add new intangible assets. Adding and Managing NewIntangibles
ExistingIntangibles
Manage existing intangibleassets.
Managing Existing Intangibles
Assumptions
Review depreciation andamortization assumptions todrive Capital asset financials.
Entering Capital AssetAssumptions
Adding and Managing New Intangibles
To add a new intangible:
1. Click Intangibles and then click New Intangibles .
Chapter 6Managing Intangibles
6-10
2. On the Asset Details page, select the Asset Class from the drop down list. Forexample, select a category such Copyright, Royalty, or Brand Valuation,depending on what’s defined for your business.
3. If you’ve integrated Capital and Projects, select a project from the Page drop-downlist to associate the asset with.
4. On the Asset Details page, hover over the upper right side of the page to activatethe menu, and from the Actions menu, select Add New Asset.
5. Enter asset details and then click Launch.
If you’ve entered assumptions for Insurance% or Maintenance%, those values arefilled in by default but you can override them at the asset level.
6. Click the Funding Assumptions horizontal tab to enter funding assumptions foryour assets.
If you’ve entered funding assumptions, those values are filled in by default but youcan override them at the asset level.
7. Click the Other Expenses horizontal tab to enter other asset expenses.
If you’ve entered assumptions for other expenses, those values are filled in bydefault but you can override them at the asset level.
8. Click the Detailed Justification horizontal tab to enter a text-based descriptionand justification for the new capital asset.
9. When you’re done adding assets, on the Asset Details page, hover over theupper right side of the page to activate the menu, and from the Actions menu,select Calculate Intangible. Select Roll Up. This aggregates data for Total Entity,Total Fixed Asset, and any custom dimensions that are enabled.
You’ll see the new assets reflected in the graphs on the bottom of the page.
Removing Intangibles
You can remove a new intangible:
On the Asset Detail page, select the asset, and then from the Actions menu, selectRemove Asset.
Managing Existing Intangibles
You can manage existing intangibles.
1. Click Intangibles and then click Existing Intangibles .
2. Manage assets using these options.
• Impair Asset—When an asset is worth less on the market than the valuelisted on the Balance Sheet, you can impair it, which results in a write-down ofthe asset account to the stated market price. Only intangible assets can beimpaired. Enter details about the asset to be impaired including the impair dateand the fair market value, and the impairment option:
– Expensed—The asset value will be expensed.
– Capitalized—The asset value will be capitalized. If you select thecapitalize option, the impairment value is posted to capital reserve.
Chapter 6Managing Intangibles
6-11
– Partially Capitalized—Part of the asset value will be capitalized. If youselect Partially Capitalized, the impairment value is apportioned to thecapital reserve, based on Capitalized %. Amortization is reduced from themonth of impairment.
• Retire Asset—When assets are retired, asset balances are terminated as ofthe retirement date, and losses or gains on sales or write-offs are calculated.Also, asset-related expenses are not calculated for a retired asset after theretirement date.
• Transfer Asset—To ensure optimum use of assets, facilities managers andcost center managers can transfer fixed asset resources across departments.When planning transfers, ensure that users have access permissions to thesource and destination entities.
3. After making changes to existing intangibles, from the Actions menu, selectCalculate Intangible and Roll Up. This aggregates data for Total Entity, TotalFixed Asset, and any custom dimensions that are enabled.
Analyzing Capital Financials with DashboardsPredefined dashboards give you insight into overall capital asset financials, includingcapital expenditures, and cash flow and balance sheet impacts. You can drill in tomembers in dashboard charts to see the level of detail you want.
1. Click Investments , Existing Assets , or Intangibles .
2. Click Overview .
3. For Investments and Existing Assets, click the horizontal tab for the type ofdashboard you want to see.
4. Use the Point of View bar to select different dimension members to display in theform, for example to select a different project or entity.
Analyzing Capital Asset Financials
The Capital Analysis component provides predefined analysis dashboardsthat give you insight into the impact of capital assets on your overall financialperformance.
Table 6-4 Analyzing Capital Asset Financials
Task Description
Capital Expenses Summary
See an overview of Capital expenses in adashboard format. See an ExpensesSummary and an Asset Summary in gridformat.
Chapter 6Analyzing Capital Financials with Dashboards
6-12
Table 6-4 (Cont.) Analyzing Capital Asset Financials
Task Description
Financial Statements
Review the balance sheet, cash flow impacts,and profit and loss impacts of capital assets.
Asset Usage
Review asset usage summary and assetusage across projects, if you've integratedCapital with Projects.
To analyze Capital financials click Analysis and then select the type ofanalysis to review.
You can drill in to members in dashboard charts to see the level of detail you want.Change members to review by selecting different members from the Point of View.
Chapter 6Analyzing Capital Asset Financials
6-13
7Working With Strategic Modeling
Related Topics
• Task Overview
• Working with Templates
• Working with Models
• Working with Reports
• Creating and Running Consolidations
Task OverviewReview the tasks you'll perform in Strategic Modeling. In general, you'll perform tasksin this order:
1. Open an application, review the templates used to create models, and then createa model or open an existing model. See Working with Templates and Creating aStrategic Modeling Model.
2. Check out a model, if required. You can also open a copy of a model. See Opening, Checking Out, and Deleting Models.
3. Perform strategic analysis tasks such as:
• Manage accounts and subaccounts.
• Define the forecast method for accounts.
• Identify a target value for an account.
• Perform what-if analysis using the Scenario Manager.
• Determine how values are calculated.
• Calculate the model.
See Working with Models.
4. Review built-in and custom reports. Working with Reports.
5. Build and run consolidations to roll up data. See Creating and RunningConsolidations.
Note:
You might not see all the features you see described in this section,depending on the access your Administrator has given you to models andfeatures.
7-1
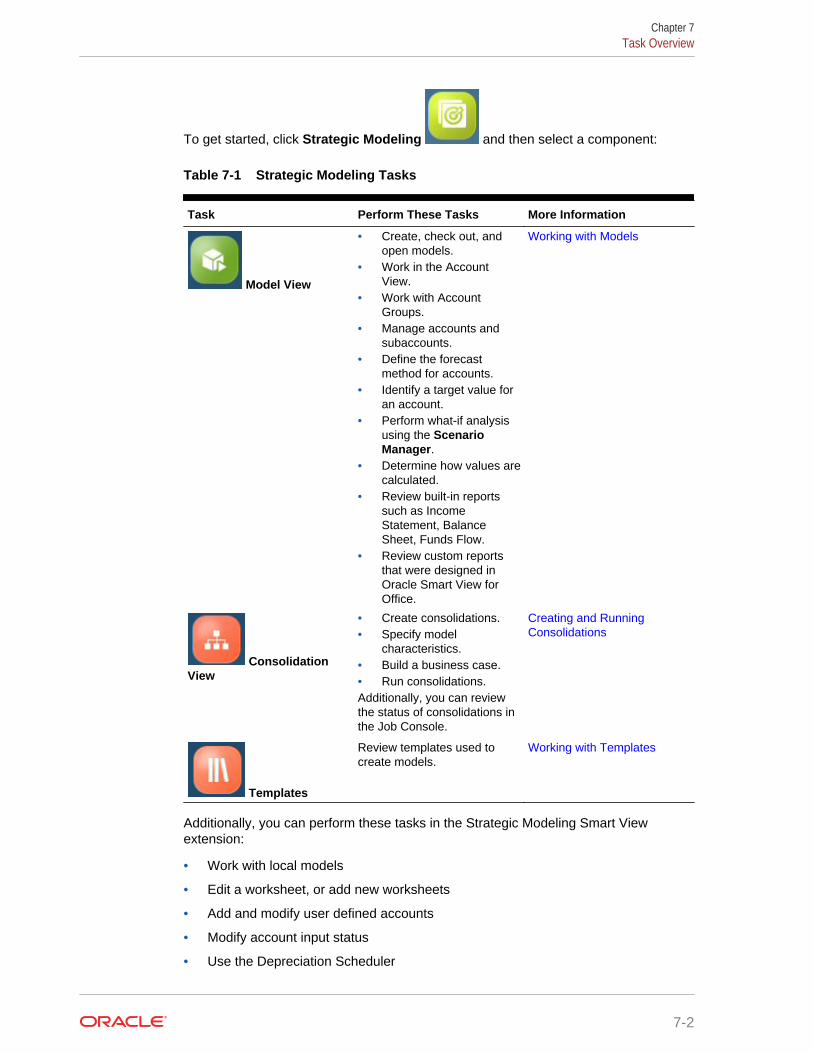
To get started, click Strategic Modeling and then select a component:
Table 7-1 Strategic Modeling Tasks
Task Perform These Tasks More Information
Model View
• Create, check out, andopen models.
• Work in the AccountView.
• Work with AccountGroups.
• Manage accounts andsubaccounts.
• Define the forecastmethod for accounts.
• Identify a target value foran account.
• Perform what-if analysisusing the ScenarioManager.
• Determine how values arecalculated.
• Review built-in reportssuch as IncomeStatement, BalanceSheet, Funds Flow.
• Review custom reportsthat were designed inOracle Smart View forOffice.
Working with Models
ConsolidationView
• Create consolidations.• Specify model
characteristics.• Build a business case.• Run consolidations.Additionally, you can reviewthe status of consolidations inthe Job Console.
Creating and RunningConsolidations
Templates
Review templates used tocreate models.
Working with Templates
Additionally, you can perform these tasks in the Strategic Modeling Smart Viewextension:
• Work with local models
• Edit a worksheet, or add new worksheets
• Add and modify user defined accounts
• Modify account input status
• Use the Depreciation Scheduler
Chapter 7Task Overview
7-2

• Use Sensitivity Analysis
• Modify the Time structure and settings
• Add and edit Debt Schedules
• Change funding options
• Perform currency translations
• Work with tax and valuation options
• Design a custom report or modify a standard report
• Save a model as a template
• Generate or assign custom dimensions
• Modify a template and upload it for use on the Web
• Convert and upload reports from the on premise version of Oracle HyperionStrategic Finance to Strategic Modeling on the Web
• Upload templates you created from the on premise version of Strategic Finance toStrategic Modeling on the Web
Working with TemplatesUse templates to quickly create a model. Templates include a hierarchical set ofaccounts without time periods or data.
Strategic Modeling includes templates for commonly used account structures. You canuse one of the provided templates, or create and upload custom templates.
Oracle provides these templates:
• Standard
• Utility
• Healthcare
• Retail
• Higher Education
These templates are available when you enable Strategic Modeling so you can get upand running quickly. You can't modify the templates provided by Oracle, but you cansave a copy of a template and modify it for your business use case.
To review the account structure of the provided templates and any custom templatesyou've uploaded:
1. From the Home page, click Strategic Modeling , and then click
Templates .
2. From the Actions menu for the template you want to review, click Open.
Chapter 7Working with Templates
7-3
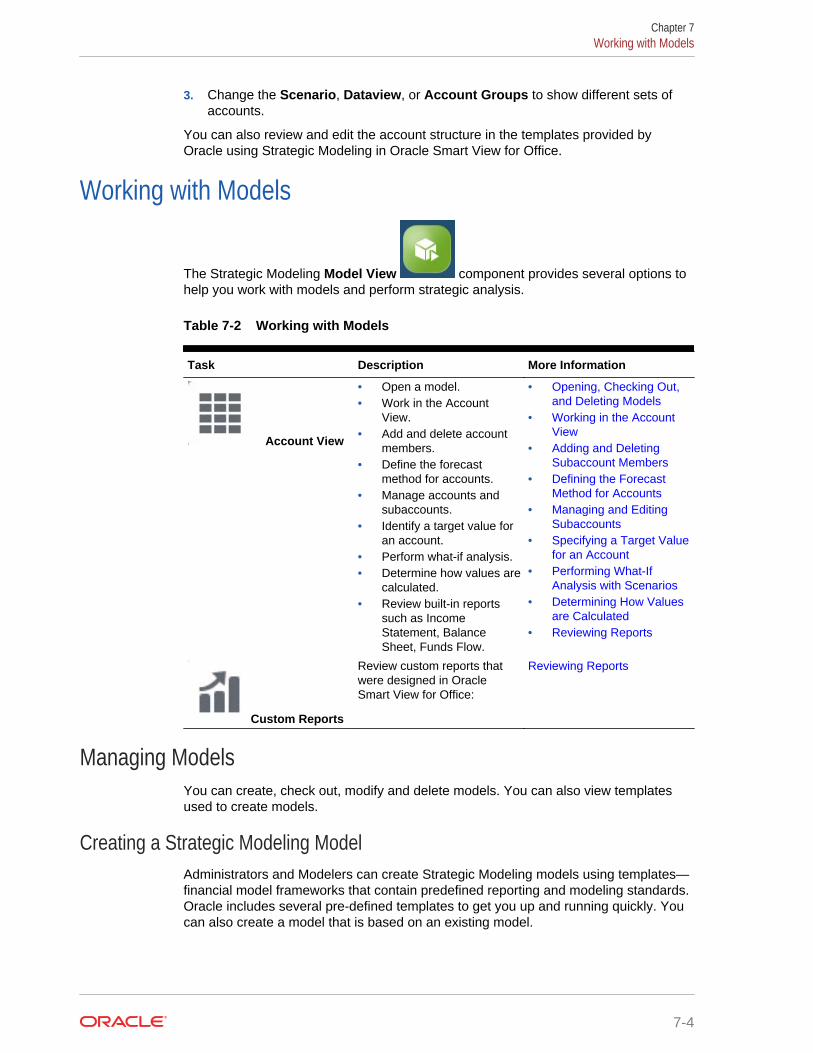
3. Change the Scenario, Dataview, or Account Groups to show different sets ofaccounts.
You can also review and edit the account structure in the templates provided byOracle using Strategic Modeling in Oracle Smart View for Office.
Working with Models
The Strategic Modeling Model View component provides several options tohelp you work with models and perform strategic analysis.
Table 7-2 Working with Models
Task Description More Information
Account View
• Open a model.• Work in the Account
View.• Add and delete account
members.• Define the forecast
method for accounts.• Manage accounts and
subaccounts.• Identify a target value for
an account.• Perform what-if analysis.• Determine how values are
calculated.• Review built-in reports
such as IncomeStatement, BalanceSheet, Funds Flow.
• Opening, Checking Out,and Deleting Models
• Working in the AccountView
• Adding and DeletingSubaccount Members
• Defining the ForecastMethod for Accounts
• Managing and EditingSubaccounts
• Specifying a Target Valuefor an Account
• Performing What-IfAnalysis with Scenarios
• Determining How Valuesare Calculated
• Reviewing Reports
Custom Reports
Review custom reports thatwere designed in OracleSmart View for Office:
Reviewing Reports
Managing ModelsYou can create, check out, modify and delete models. You can also view templatesused to create models.
Creating a Strategic Modeling ModelAdministrators and Modelers can create Strategic Modeling models using templates—financial model frameworks that contain predefined reporting and modeling standards.Oracle includes several pre-defined templates to get you up and running quickly. Youcan also create a model that is based on an existing model.
Chapter 7Working with Models
7-4
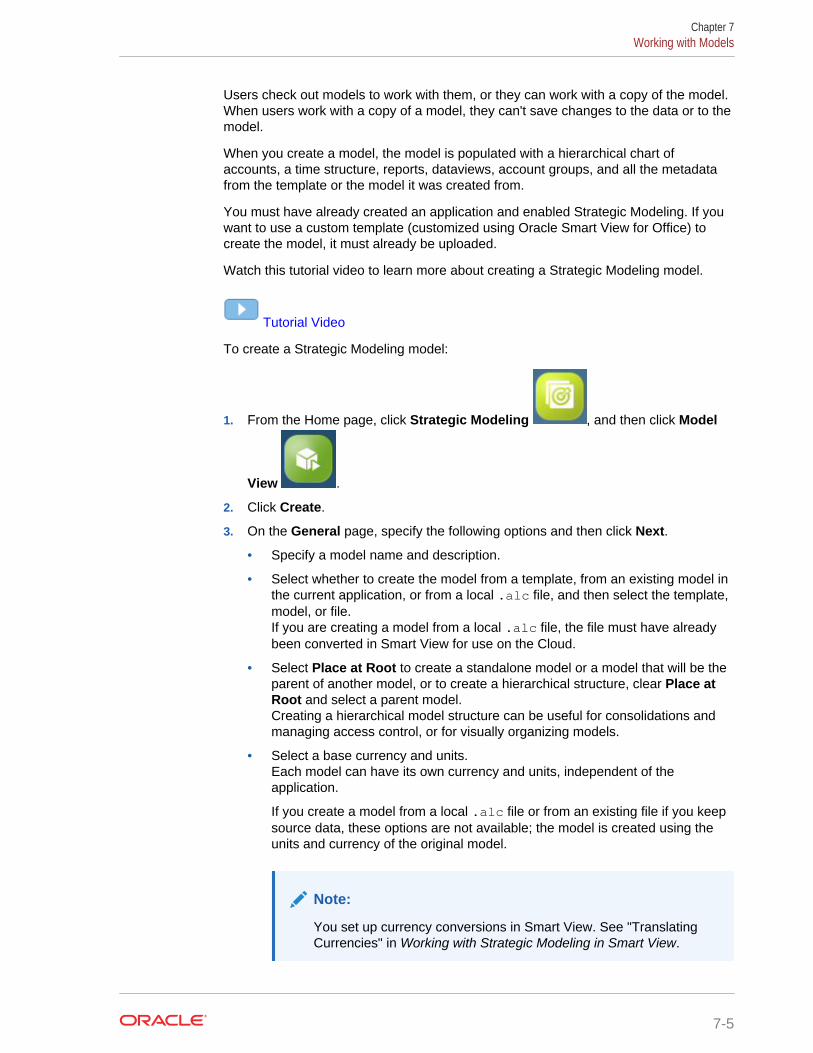
Users check out models to work with them, or they can work with a copy of the model.When users work with a copy of a model, they can't save changes to the data or to themodel.
When you create a model, the model is populated with a hierarchical chart ofaccounts, a time structure, reports, dataviews, account groups, and all the metadatafrom the template or the model it was created from.
You must have already created an application and enabled Strategic Modeling. If youwant to use a custom template (customized using Oracle Smart View for Office) tocreate the model, it must already be uploaded.
Watch this tutorial video to learn more about creating a Strategic Modeling model.
Tutorial Video
To create a Strategic Modeling model:
1. From the Home page, click Strategic Modeling , and then click Model
View .
2. Click Create.
3. On the General page, specify the following options and then click Next.
• Specify a model name and description.
• Select whether to create the model from a template, from an existing model inthe current application, or from a local .alc file, and then select the template,model, or file.If you are creating a model from a local .alc file, the file must have alreadybeen converted in Smart View for use on the Cloud.
• Select Place at Root to create a standalone model or a model that will be theparent of another model, or to create a hierarchical structure, clear Place atRoot and select a parent model.Creating a hierarchical model structure can be useful for consolidations andmanaging access control, or for visually organizing models.
• Select a base currency and units.Each model can have its own currency and units, independent of theapplication.
If you create a model from a local .alc file or from an existing file if you keepsource data, these options are not available; the model is created using theunits and currency of the original model.
Note:
You set up currency conversions in Smart View. See "TranslatingCurrencies" in Working with Strategic Modeling in Smart View.
Chapter 7Working with Models
7-5
• If you created the model from an existing model, select Keep Time Structureif you want the new model to use the same time period structure as theexisting model.If you selected Keep Time Structure, you can select Keep Source ModelData to include the source model's data values in the accounts.
If you select Keep Time Structure, skip to step 5.
4. On the Calendar, Time Period, and Configure Years pages, specify the optionsfor building the calendar for this model.
5. Review the model creation options, and then click Create Model.
The model is created with a chart of accounts and a calendar structure based on theoptions you selected.
You can convert an Oracle Hyperion Strategic Finance model to a Strategic Modelingmodel in Smart View. See Working with Strategic Modeling in Smart View.
Opening, Checking Out, and Deleting ModelsYou can check out a model, or work with a copy.
To open or check out a model:
1. From the Home page, click Strategic Modeling , and then click Model
View .
2. Click the model you want to open, and from the Actions menu, select Open-Checkout or Open As Copy.When you check out a model, you can save changes to the data and the model.When you work with a copy of a model, you can't save changes to the data or themodel.
3. If you checked out the model, after you make changes to it and save the changes,click Close to close the model, and then select Check In to save the changes tothe server, or Discard to discard the changes.
If you selected Open as Copy, you can save your changes temporarily, but whenyou close the model, the changes are not saved to the server.
To delete a single model, select it from the Models list, and then from the Actionsmenu, click Delete. To delete a parent model and all of its descendants, select theparent model from the Models list, and then from the Actions menu, click DeleteHierarchy.
Working in the Account ViewWhen you open a model, it opens in the Account View, where you can view andmanage the accounts and subaccounts in a model.
About Accounts, Subaccounts, and Account Groups
Account types include:
Chapter 7Working with Models
7-6
• Input accounts—Manually enter financial data into Input accounts for historicaland forecast periods. In forecast periods, use forecast methods or freeformformulas to calculate values. The forecast method you specify determines theformat for the input data in forecast periods. For example, if Sales uses the GrowthRate forecast method, you enter input data as a growth rate into the forecastperiods.For details about entering data in input accounts, see Entering Account Data.
• Calculated accounts—Calculates values with formulas using output from otheraccounts. You can't edit formulas in calculated accounts; they are fixed to retainaccounting integrity.
• User-Defined Accounts—Defined in Oracle Smart View for Office. IncludesMemo Accounts to create additional detail in the financial accounts, Custom Ratioaccounts to create additional ratios for analysis, and Debt Covenant accounts todefine measures within Custom Ratios testing against performance standards(debt covenants).
Subaccounts are used for additional input detail in main accounts. Subaccountsinherit attributes of main accounts in both historical and forecast periods. You candistinguish subaccounts because they have a colon in their account key.
Account groups are used to group accounts together to make them easy to find anddisplay when doing data entry. Default account groups are inherited from the template.Administrators and modelers can create additional account groups. See Working withAccount Groups.
Dataviews are used to filter the type of accounts that are displayed. Administratorsand modelers can create and edit dataviews. See Working with Dataviews.
Strategic Modeling account numbers have up to three segments, separated by adecimal point or, for subaccounts, a colon:
• Main account number (vxxxx). These accounts drive the accounting integrity ofthe model.
• Related account number (vxxxx.xx)
• Subaccount number (vxxxx.xx:xxxx or for a subaccount of a main account:vxxxx:xxxx)
For descriptions of the accounts, see Strategic Modeling Account Definitions.
About the Account View
In the Account View, you can:
• Change the point of view: Select from the Scenario, Dataview, or Account
Groups lists and then click Refresh .
• Add and delete subaccount members in the account hierarchy. See Adding andDeleting Subaccount Members.
• Calculate and save a model.
• Perform analysis tasks using the actions available on the Actions menu.
Chapter 7Working with Models
7-7
Working with Account GroupsUse Account Groups to manage accounts in bulk. For example, you can create agroup containing all Income Statement accounts that shows data input rows only. Youalso use Account Groups to select the accounts to display on the Account View.
Administrators and Modelers can create and edit account groups. All users can useAccount Groups to select the accounts to display on the Account View.
To create and edit account groups:
1. Open a model.
2. In the Account View, from the Actions menu, click Account Groups.
3. In the left pane, click Add Account Groups, and then select a type to add:
• Add List of Accounts—Creates groups of accounts.
• Add List of Groups—Creates groups of account groups.
• Add a Separator—Creates a line to separate groups in a list. If you add aseparator, reorder the Separator as needed, and then click OK. You can skipthe remaining steps in this procedure.
4. Enter a name and then click OK.
5. Click Add Accounts to add accounts or account groups to the list.
6. Select the accounts or account groups to add to the list, click SelectAccounts, and then click OK.You can use Search to easily find the account or group you want.
7. For a list of a accounts, select options for how to display the accounts:
• Subaccounts—Specify how to display subaccounts.
• Dimensions—Specify how to display dimensions when adding mainaccounts. Available only when All subaccounts are selected.
• Default View—Specify the default view to display accounts.
8. Select whether to hide this group from the Account Group list, and for accountlists, select whether to include subaccounts for user-defined accounts and whetherto include accounts that have been turned off.
9. Click OK.
The new Account Group is available in the Account Groups list in the Account View.
Additionally, in the Account Groups dialog box you can:
• Edit, rename, and delete account groups. Note that you can't edit, rename ordelete the default account groups that are provided with Strategic Modeling.
• Reorder the account groups by dragging and dropping or by using the arrows,which affects the display order in the Account Groups list in the Account View.
Working with DataviewsUse dataviews to filter the accounts and manage the display of data in the AccountView. Models include default dataviews:
Chapter 7Working with Models
7-8
• Standard
• Input Only
• Output Only
Administrators and modelers can create and edit dataviews to customize the display inthe Account View.
To create a dataview:
1. Open a model.
2. In the Account View, from the Actions menu, click Dataviews.
3. In the left pane, click Add Dataview.
4. Enter a name and then click OK.
5. Specify the properties and attributes for the new dataview, and then click OK.
• Display Options
– Display Group Headers as Titles—displays Account Group headings.
– Hide Input Row if a Calc Account—hides input rows for calculatedaccounts.
– Hide Calculated Time Period Column—hides calculated time perioddetails.
• Attributes—Select whether to display input rows, output rows, or both, andspecify the row order.
• Time Period—Specify the time period to display. If you select Set TimeRange, specify the Beginning Boundary and Ending Boundary usingfunctions or by entering values.
The new dataview is available in the Dataview list in the Account View.
Additionally, in the Dataviews dialog box you can:
• Edit, rename, and delete dataviews.
• Reorder the dataviews by dragging and dropping or by using the arrows, whichaffects the display order in the Dataviews list in the Account View.
Entering Account DataYou enter account data (historical values, project forecast assumptions, and estimatevaluation assumptions) in the Accounts view.
Tips for entering data:
• To enter negative values, start the value with a minus sign (-).
• Enter ‘#’ or ‘##’ into a cell to override current values. The ‘#’ and ‘##’ overrides arenot valid for use within historical time periods unless those periods are calculatedusing Freeform Formulas.
• Strategic Modeling stores numbers up to 16 significant digits, before and/or afterthe decimal point. You can change the number of decimal places displayed.
Chapter 7Working with Models
7-9
Adding and Deleting Subaccount MembersYou can add subaccount members to the account hierarchy by adding a child orsibling member to the selected account.
You can also add children or sibling subaccount members in bulk.
For information about editing subaccounts, see Managing and Editing Subaccounts.
Watch this tutorial video to learn more about working with subaccounts.
Tutorial Video
Adding Subaccounts One at a Time
To add a subaccount one at a time:
1. In the Account View, right-click an account, and from the context menu selectAdd Sibling or Add Child, depending on where you want to add the new memberin the account hierarchy.
Tip:
To quickly find an account, from the Actions menu, click Find Account,and then enter the name or the subaccount identifier number.
A new subaccount is added, with the name NewNN appended to the account ID.
• You can't add siblings to main accounts.
• The subaccount ID must be unique within this group of subaccounts.
2. Enter a name in the Account Names column.
3. To make further edits to the new account, right-click the account and select Edit.See Managing and Editing Subaccounts.
Adding Subaccounts in Bulk
To add subaccounts in bulk:
1. Prepare a file that contains the subaccount member names to be added, and thencopy the subaccount member names.You can prepare the file in Microsoft Excel or in any editor. The subaccountdelimiter is a new line character. For example, copy a column in Excel thatincludes all the subaccounts.
2. In the Account View, right-click the row header for the account or subaccount towhich you want to add children or siblings, and then click Paste Children or PasteSibling.Paste Sibling is available only when you select a subaccount row.
3. In the Paste window, paste the copied subaccounts.You can edit the pasted text, or add additional subaccounts to the list.
4. Click Paste.
Chapter 7Working with Models
7-10
The subaccounts are added as children or siblings of the currently selectedaccount.
For Paste Children, the subaccounts are pasted at the end of the currentlyselected subaccount's children list.
For Paste Siblings, the subaccounts are pasted above the currently selectedsubaccount row as siblings.
The pasted text is used as the descriptions for the newly created subaccounts.Subaccounts keys are automatically generated.
Deleting Accounts
To delete an account, in the Account View, right-click an account, and from thecontext menu select Delete. When you delete an account, its children are alsodeleted.
Note:
Because main accounts drive the accounting integrity of the model, you can'tdelete them. Main accounts are recognizable by an account ID of vxxxx.
Managing and Editing SubaccountsTo edit a subaccount:
1. In the Account View, select the subaccount you want to edit, and then from theActions menu, select Subaccounts.You can also right-click a cell and click Subaccounts.
2. Edit the member name (subaccount ID) and the description, if needed.
Note:
If the fields are not available (greyed out), it means that the subaccountis not editable, for example if you don't have access permissions to editit.For main accounts, to maintain the accounting integrity of the model, youcan edit the name but not other fields.
3. In Type, select the rollup option for this subaccount.
4. To edit related accounts:
a. Click Edit next to Related Accounts.
b. In the list of related accounts, click Edit .
c. You can make changes to a group of accounts all at one time. Enter searchtext in the Find box, and then: Click Find and Replace, enter the replacementtext, and then click Replace All. Or, click Append, enter the text to append,select whether to append at the Front or End of the name, and then clickAppend All.
Chapter 7Working with Models
7-11
d. Make changes to one account at a time by clicking or tapping the accountname in the right-hand panel of Related Accounts and making the changes inthe Name box.
e. Click Save.
5. Click Apply to save the changes.
Defining the Forecast Method for AccountsEvery account uses a unique forecast method to project account values in future(forecast) time periods. Use Account Forecast to review or define the forecastmethod for accounts. You can use pre-built forecasting methods, or build your ownfreeform formula. Many of the accounts in the template have a pre-defined forecastmethod; you can revise the method if required for your business. (All the accounts thataccept input do have a default forecast method defined.)
Watch this tutorial video to learn more about defining the forecast method foraccounts.
Tutorial Video
To define a forecast method for accounts.
1. Open a model.
2. In the Account View, click the cell for the account you want to review or change.
Tip:
To quickly find an account, from the Actions menu, click Find Account,and then enter the name or the subaccount identifier number.
3. From the Actions menu, click Account Forecast. The Forecast panel shows thecalculation used to calculate the forecast value.You can also right-click a cell and click Account Forecast.
In this example, Product Price uses a standard formula:
Chapter 7Working with Models
7-12
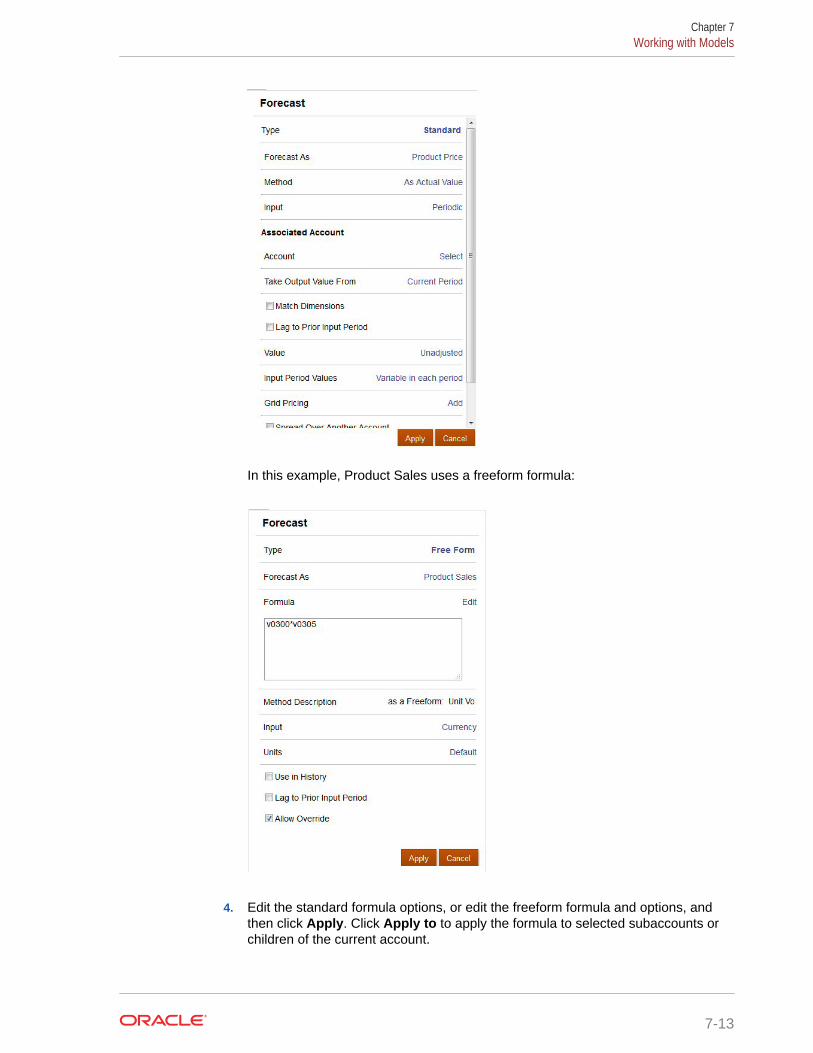
In this example, Product Sales uses a freeform formula:
4. Edit the standard formula options, or edit the freeform formula and options, andthen click Apply. Click Apply to to apply the formula to selected subaccounts orchildren of the current account.
Chapter 7Working with Models
7-13
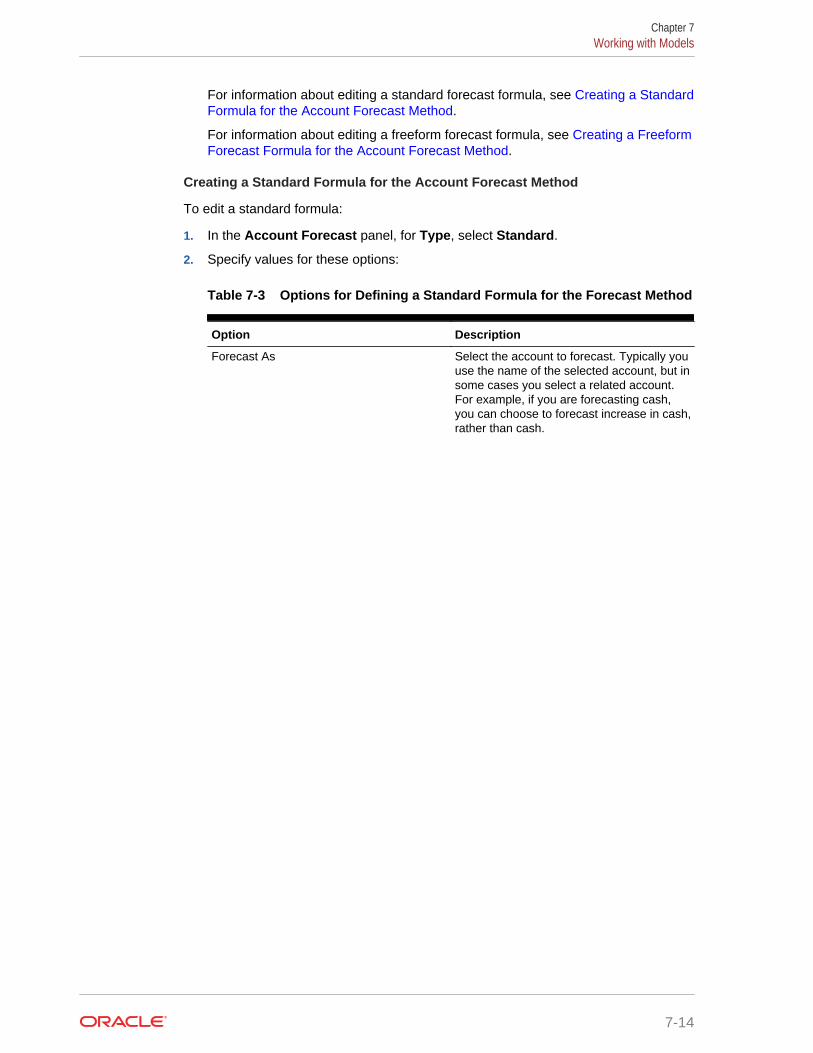
For information about editing a standard forecast formula, see Creating a StandardFormula for the Account Forecast Method.
For information about editing a freeform forecast formula, see Creating a FreeformForecast Formula for the Account Forecast Method.
Creating a Standard Formula for the Account Forecast Method
To edit a standard formula:
1. In the Account Forecast panel, for Type, select Standard.
2. Specify values for these options:
Table 7-3 Options for Defining a Standard Formula for the Forecast Method
Option Description
Forecast As Select the account to forecast. Typically youuse the name of the selected account, but insome cases you select a related account.For example, if you are forecasting cash,you can choose to forecast increase in cash,rather than cash.
Chapter 7Working with Models
7-14
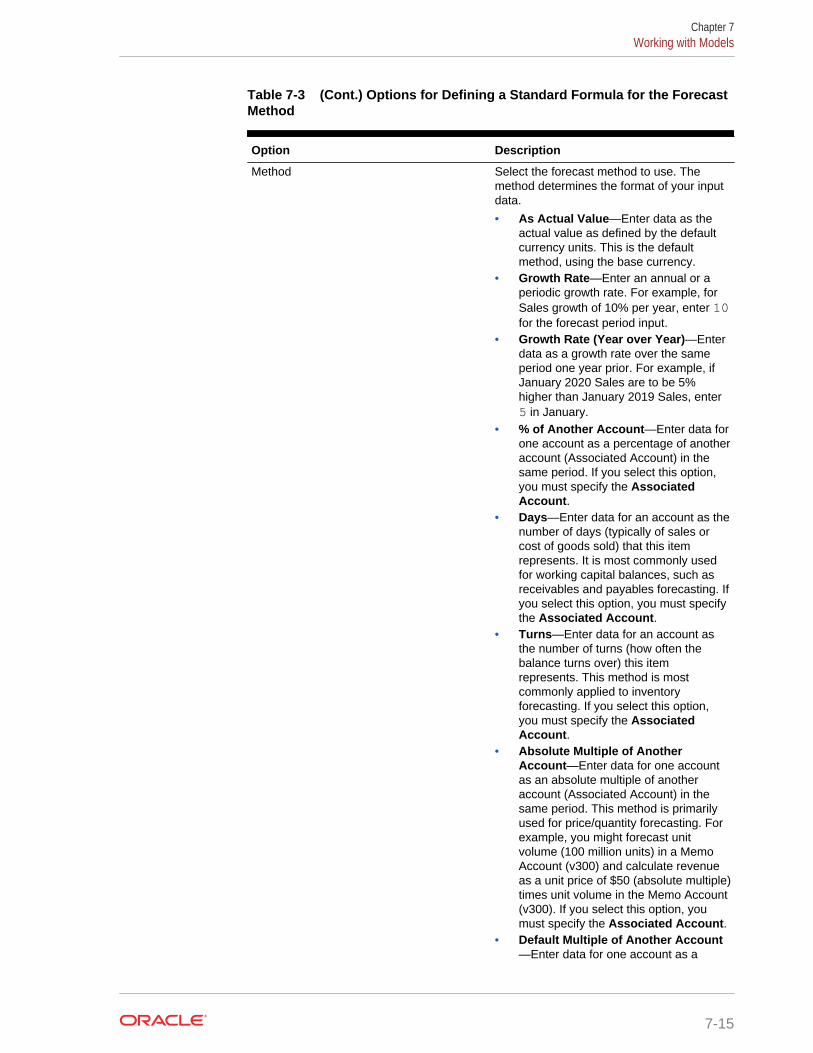
Table 7-3 (Cont.) Options for Defining a Standard Formula for the ForecastMethod
Option Description
Method Select the forecast method to use. Themethod determines the format of your inputdata.
• As Actual Value—Enter data as theactual value as defined by the defaultcurrency units. This is the defaultmethod, using the base currency.
• Growth Rate—Enter an annual or aperiodic growth rate. For example, forSales growth of 10% per year, enter 10for the forecast period input.
• Growth Rate (Year over Year)—Enterdata as a growth rate over the sameperiod one year prior. For example, ifJanuary 2020 Sales are to be 5%higher than January 2019 Sales, enter5 in January.
• % of Another Account—Enter data forone account as a percentage of anotheraccount (Associated Account) in thesame period. If you select this option,you must specify the AssociatedAccount.
• Days—Enter data for an account as thenumber of days (typically of sales orcost of goods sold) that this itemrepresents. It is most commonly usedfor working capital balances, such asreceivables and payables forecasting. Ifyou select this option, you must specifythe Associated Account.
• Turns—Enter data for an account asthe number of turns (how often thebalance turns over) this itemrepresents. This method is mostcommonly applied to inventoryforecasting. If you select this option,you must specify the AssociatedAccount.
• Absolute Multiple of AnotherAccount—Enter data for one accountas an absolute multiple of anotheraccount (Associated Account) in thesame period. This method is primarilyused for price/quantity forecasting. Forexample, you might forecast unitvolume (100 million units) in a MemoAccount (v300) and calculate revenueas a unit price of $50 (absolute multiple)times unit volume in the Memo Account(v300). If you select this option, youmust specify the Associated Account.
• Default Multiple of Another Account—Enter data for one account as a
Chapter 7Working with Models
7-15
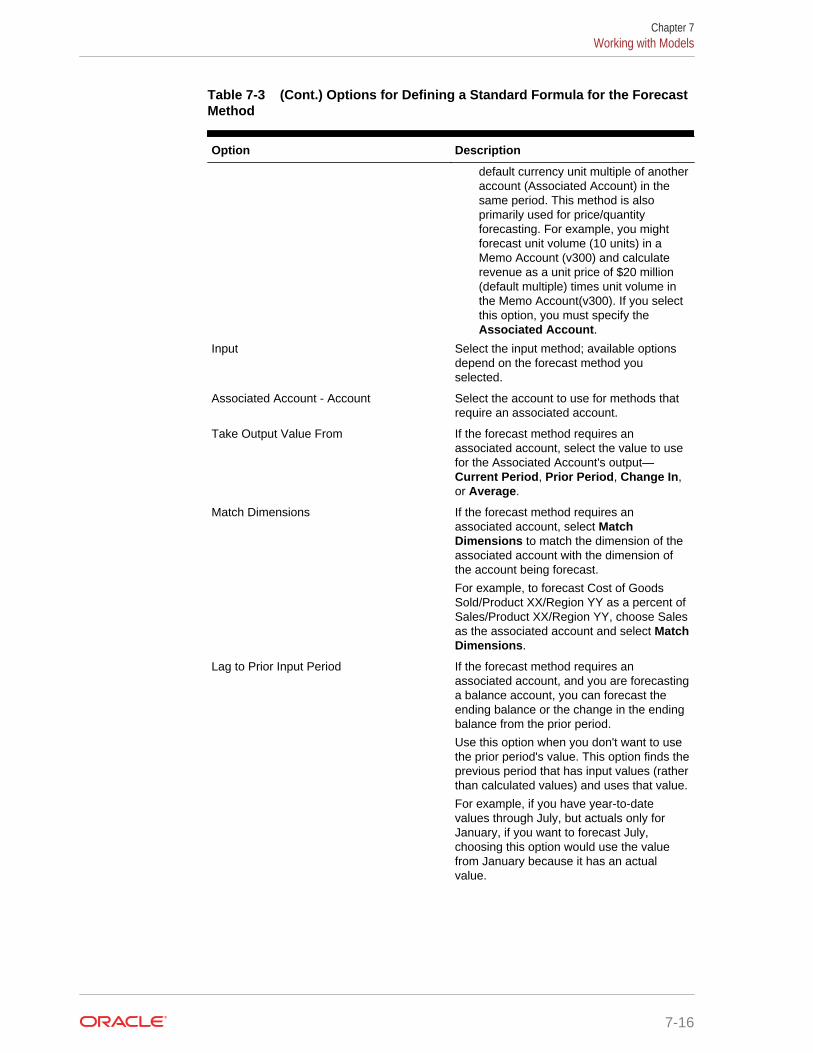
Table 7-3 (Cont.) Options for Defining a Standard Formula for the ForecastMethod
Option Description
default currency unit multiple of anotheraccount (Associated Account) in thesame period. This method is alsoprimarily used for price/quantityforecasting. For example, you mightforecast unit volume (10 units) in aMemo Account (v300) and calculaterevenue as a unit price of $20 million(default multiple) times unit volume inthe Memo Account(v300). If you selectthis option, you must specify theAssociated Account.
Input Select the input method; available optionsdepend on the forecast method youselected.
Associated Account - Account Select the account to use for methods thatrequire an associated account.
Take Output Value From If the forecast method requires anassociated account, select the value to usefor the Associated Account's output—Current Period, Prior Period, Change In,or Average.
Match Dimensions If the forecast method requires anassociated account, select MatchDimensions to match the dimension of theassociated account with the dimension ofthe account being forecast.
For example, to forecast Cost of GoodsSold/Product XX/Region YY as a percent ofSales/Product XX/Region YY, choose Salesas the associated account and select MatchDimensions.
Lag to Prior Input Period If the forecast method requires anassociated account, and you are forecastinga balance account, you can forecast theending balance or the change in the endingbalance from the prior period.
Use this option when you don't want to usethe prior period's value. This option finds theprevious period that has input values (ratherthan calculated values) and uses that value.
For example, if you have year-to-datevalues through July, but actuals only forJanuary, if you want to forecast July,choosing this option would use the valuefrom January because it has an actualvalue.
Chapter 7Working with Models
7-16
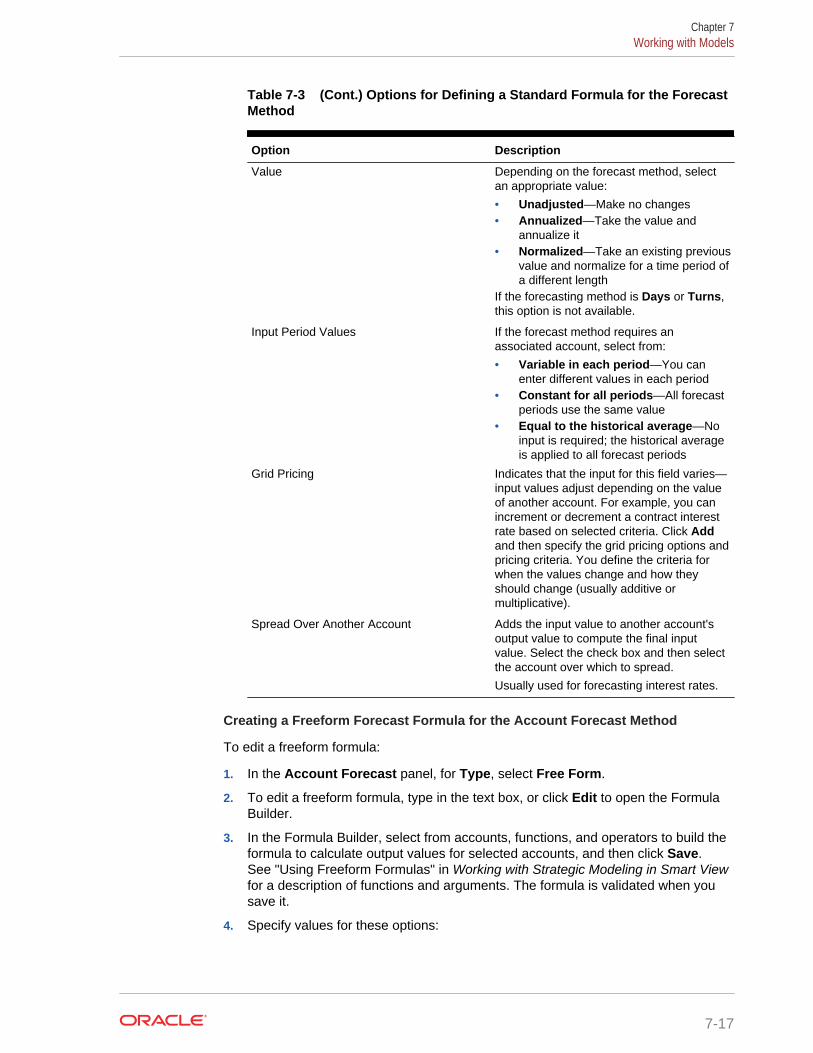
Table 7-3 (Cont.) Options for Defining a Standard Formula for the ForecastMethod
Option Description
Value Depending on the forecast method, selectan appropriate value:
• Unadjusted—Make no changes• Annualized—Take the value and
annualize it• Normalized—Take an existing previous
value and normalize for a time period ofa different length
If the forecasting method is Days or Turns,this option is not available.
Input Period Values If the forecast method requires anassociated account, select from:
• Variable in each period—You canenter different values in each period
• Constant for all periods—All forecastperiods use the same value
• Equal to the historical average—Noinput is required; the historical averageis applied to all forecast periods
Grid Pricing Indicates that the input for this field varies—input values adjust depending on the valueof another account. For example, you canincrement or decrement a contract interestrate based on selected criteria. Click Addand then specify the grid pricing options andpricing criteria. You define the criteria forwhen the values change and how theyshould change (usually additive ormultiplicative).
Spread Over Another Account Adds the input value to another account'soutput value to compute the final inputvalue. Select the check box and then selectthe account over which to spread.
Usually used for forecasting interest rates.
Creating a Freeform Forecast Formula for the Account Forecast Method
To edit a freeform formula:
1. In the Account Forecast panel, for Type, select Free Form.
2. To edit a freeform formula, type in the text box, or click Edit to open the FormulaBuilder.
3. In the Formula Builder, select from accounts, functions, and operators to build theformula to calculate output values for selected accounts, and then click Save.See "Using Freeform Formulas" in Working with Strategic Modeling in Smart Viewfor a description of functions and arguments. The formula is validated when yousave it.
4. Specify values for these options:
Chapter 7Working with Models
7-17

Table 7-4 Options for Defining a Freeform Formula for the Forecast Method
Option Description
Forecast As Select the account to forecast. Typically youuse the name of the selected account, but insome cases you select a related account.
Method Description Enter a description of the formula.
Input Optional: For formulas using @input, fromInput select the format of the input data.
• Currency—Enter input data using theoption set in Units.
• Items— Enter input data using optionset in Units.
• Percent—Enter input data as apercentage. Useful for tax rateformulas.
• Ratio—Enter input data as a ratio.• Days—Enter input data as a number of
days. The input must be multiplied byanother account to produce the outputvalue.
• Turns— Enter the input data as thenumber of turns. The input must bemultiplied by another account toproduce the output value.
Units For formulas using @input, select the inputdata unit (thousands, or millions, forexample).
Use in History Select to use freeform formulas in historicalperiods.
For example, you might want to calculateSales as Price x Quantity in both historicaland forecast periods.
If this option is not selected, the freeformformula is used only in forecast periods andhistorical data must be input separately.
Lag to Prior Input Period For formulas using lag time periods.
Allow Override Select to allow users to input values insteadof using the formula.
In input periods, you can override theselected input method to enable input of thatperiod's value as Default Currency/Items. Tooverride the input method, enter a poundsign (#) before or after the number.
5. Click Apply.
Specifying a Target Value for an AccountUse Goal Seek to specify a target value for an account and determine the values thatare needed to drive that result. To use goal seek, you select the account value youwant to change, an associated account to drive the change, and a time range overwhich to make the changes.
Chapter 7Working with Models
7-18
For example, suppose your total payroll percentage of budget is 16.69% in 2017 andyou want to reduce it to 16.18%. You decide to reduce payroll percentage by changingthe Selling Hours Productivity in the time range January through December 2017.When you select Seek in the Goal Seek panel, Strategic Modeling calculates thechanges required in Selling Hours Productivity to reach the Total Payroll Percentagetarget for 2017, spreading the adjustment in Selling Hours Productivity betweenJanuary and December 2017 (by a percentage or an amount, depending on yourselection) to achieve the target value. When you use Goal Seek, you don't have tomake manual adjustments to accounts or write complex business rules to see how toreach your target.
Watch this tutorial video to learn more about Goal Seek.
Tutorial Video
To specify a target value for an account:
1. Open a model.
2. In the Account View, click the cell for the account you want to change.
3. From the Actions menu, click Goal Seek.You can also right-click a cell and click Goal Seek.
4. In the Set Goal area, change the Account, Scenario, or Time Period if needed,and then enter the target value for this account in Goal.
5. In the Adjust By area, specify the account you want to adjust to meet the goal inthe target account, the time periods over which to make the change, and whetherto adjust by a percentage or an amount.The change account must be related to the goal account through a formula, or thegoal seek will fail.
For example, in this image, the current value for Product Sales in 2020 is 819.3.Suppose you want to increase that to 900. Product Sales is calculated fromseveral accounts, including Unit Volume. You want to reach the product sales goalby adjusting the Unit Volume by the same percentage for each time periodbetween 2017 and 2020. When you use Goal Seek, the unit sales are adjusted tomeet the product sales target of 900 in 2020.
Chapter 7Working with Models
7-19
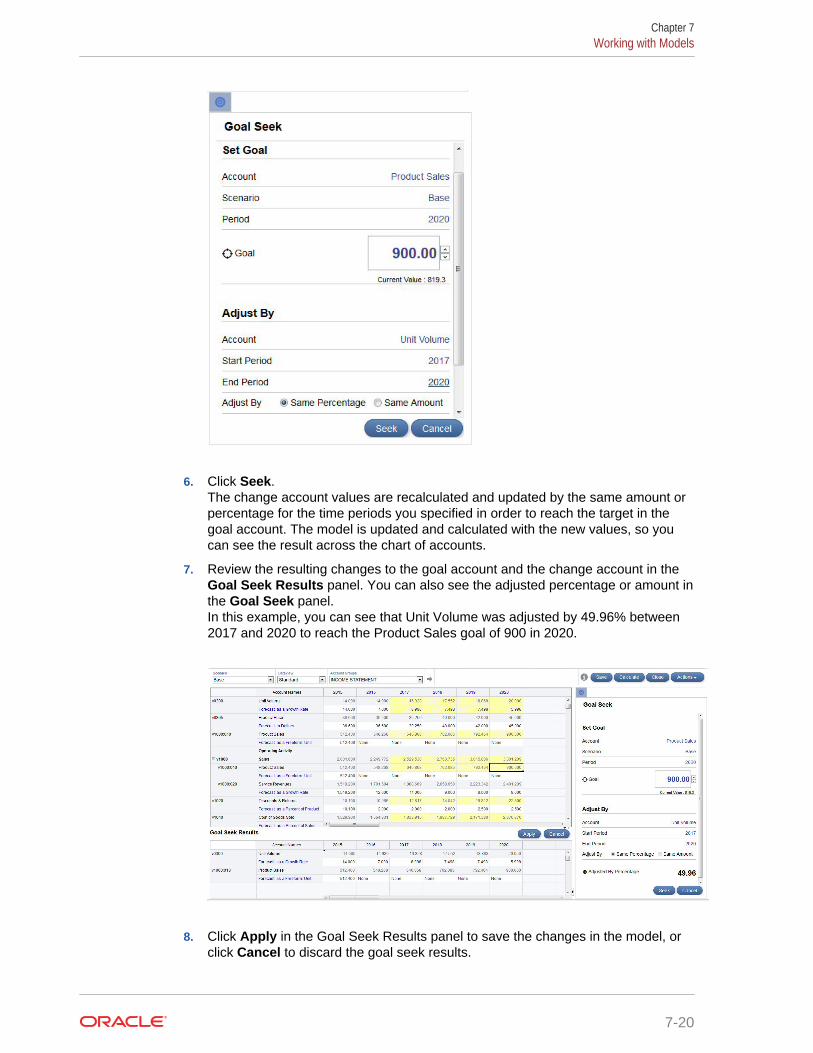
6. Click Seek.The change account values are recalculated and updated by the same amount orpercentage for the time periods you specified in order to reach the target in thegoal account. The model is updated and calculated with the new values, so youcan see the result across the chart of accounts.
7. Review the resulting changes to the goal account and the change account in theGoal Seek Results panel. You can also see the adjusted percentage or amount inthe Goal Seek panel.In this example, you can see that Unit Volume was adjusted by 49.96% between2017 and 2020 to reach the Product Sales goal of 900 in 2020.
8. Click Apply in the Goal Seek Results panel to save the changes in the model, orclick Cancel to discard the goal seek results.
Chapter 7Working with Models
7-20
9. If you checked out the model, save it and check it in.
Performing What-If Analysis with ScenariosYou can model different business outcomes and evaluate different sets of forecastassumptions by defining scenarios. Use Scenario Manager to create scenarios anddefine the accounts to include—the entire chart of accounts, a subset of accounts, orjust a single account. All accounts are in the Base scenario; you add an account to ascenario because you want the values to come from your new scenario rather from theBase scenario (or other standalone scenario).
Perform what-if analysis by creating different scenarios and changing the input values(including the forecast method) for different accounts in the scenario. Then, see howthese changes affect the output in the account.
All models include two scenarios by default:
• Base—Includes all accounts and contains the original inputs of each account. Itdoes not inherit any values from any other scenarios. All inherited scenarios endtheir inheritance order with the base scenario, or another standalone scenario;Base is always the ultimate source of data if no other scenario supplies it.
• Actuals—Contains actuals values
You can't remove the accounts from Base and Actual scenarios.
About Scenario Inheritance
You can define a scenario that inherits accounts, input values, and the forecastmethods from other scenarios. For any values not in the current scenario, StrategicModeling uses values from the scenario it inherits from. You can also set up a multipleinheritance scenario, where your scenario first looks for values in the lowest levelscenario in the inheritance order. For any values not in that scenario, it searches in thenext scenario in the inheritance order, and so on, until it reaches a standalonescenario, such as Base. Inherited scenarios save time in data entry and let youexperiment with changing values in a scenario without breaking relationships in themodel. With multiple inheritance, you can mix and match the sets of changes withoutbreaking the relationships.
Creating a New Scenario
When you define a new scenario, you create it from an existing scenario.
To define a new scenario for what-if analysis:
1. Open a model, either by checking it out or opening it as a copy.
2. In the Account View, select the scenario to use as a basis for the new scenario.When you create a new scenario, the properties and account selection are basedon the currently active scenario in the model, with the exception of inheritanceorder.
3. From the Actions menu, click Scenario Manager.You can also right-click a cell and click Scenario Manager.
4. Click New Scenario .
5. Enter a name and description for the scenario.
6. Select the type of scenario to create:
Chapter 7Working with Models
7-21
• Standalone—Creates a scenario that does not inherit values from any childscenarios and includes all the accounts in the model.
• Inherits—Specifies that the current scenario inherits values and forecastmethods from the Inherit From scenario or scenarios if the values do not existin the current scenario.
• Input Only—Creates a scenario of input-only accounts that doesn't generateany output. This option is useful for consolidation when you want the parent tocontribute data to the consolidation instead of getting the data from the childfor the accounts specified in the input only scenario. By adding an account tothe input only scenario, it is blocked from getting data from a child node duringconsolidation. For more details about using input only scenarios inconsolidations, see About Using Input Only Scenarios in Consolidations.
7. If you selected Inherits, select the scenario or scenarios from which this scenarioshould inherit values and forecast methods.If you select multiple scenarios, drag and drop the scenarios to indicate theinheritance order. Note that inheritance order doesn't matter if the values from theinheriting scenarios don't overlap.
8. For Use Actuals, select when to use actuals values:
• Never
• When Available—If there's an actual value for this period, use it.
• In History—Use actual values in historical periods.
For example, your budget stays static, so you would select In History for a budgetscenario. But for actuals, you would want to select When Available to use theactual values as they become available over time.
9. In Accounts, click Add to select the accounts to include in this scenario, selectthe accounts, and then click Add.You can filter the list of accounts by using the Search box. Use Ctrl-click to selectmore than one account.
10. Click Apply.
The scenario is added to the model.
After creating a scenario, update values or forecast methods as needed and thencalculate the model.
Managing Scenarios
You can edit or delete scenarios, filter the display of scenarios, or change the scenarioorder.
To delete a scenario, click the scenario and then click Delete .
To filter the scenario display (by default, all scenarios are displayed), click AllScenarios, and then select the scenarios to display: Inheriting Scenarios,Standalone Scenarios, Input Only Scenarios, Output Only Scenarios (fromcurrency translations).
To change the order of scenarios in the Scenario Manager panel, drag and drop thescenarios to reposition them in the list. You can reorder scenarios only when AllScenarios are displayed. The Base and Actual scenarios can't be re-ordered and arealways the first and second scenarios in the list. Changing the order of scenariosaffects the order of scenarios in the Scenario list in the POV in Account View.
Chapter 7Working with Models
7-22
Watch this tutorial video to learn more about working with scenarios.
Tutorial Video
Determining How Values are CalculatedTo determine how a value is calculated, use Audit Trail. From any cell, you can drill tosee the values that contributed to the cell value.
Watch this tutorial video to learn more about determining how values are calculatedusing Audit Trail.
Tutorial Video
To determine how a cell's value is calculated:
1. From the Account View, click an output cell, and then from the Actions menu,click Audit Trail.You can also right-click a cell and click Audit Trail.
The Audit Trail for the cell value shows the formula that was used to calculate thevalue.
2. Perform any of these tasks in the Audit Trail window:
• Drill down in elements of the formula to get more details about the value.Values that can be drilled display as blue hyperlinks.
• Change the time period or scenario to show the audit trail for a different cellvalue.
• Click the arrow next to Audit Trail to see a history of auditsteps. Click one of the steps to go back to that point in your audit. The audittrail is cleared and restarted when you change the time period, scenario, oraccount.
3. To change an input value to see how it affects the data:
a. Change the input value. Affected cells are highlighted in yellow.
b. Click Update to save the updated values, or click Discard.
c. Click Save to save the data in the model.
Working with ReportsYou can work with built-in reports or with custom reports built in Oracle Smart View forOffice.
Chapter 7Working with Reports
7-23
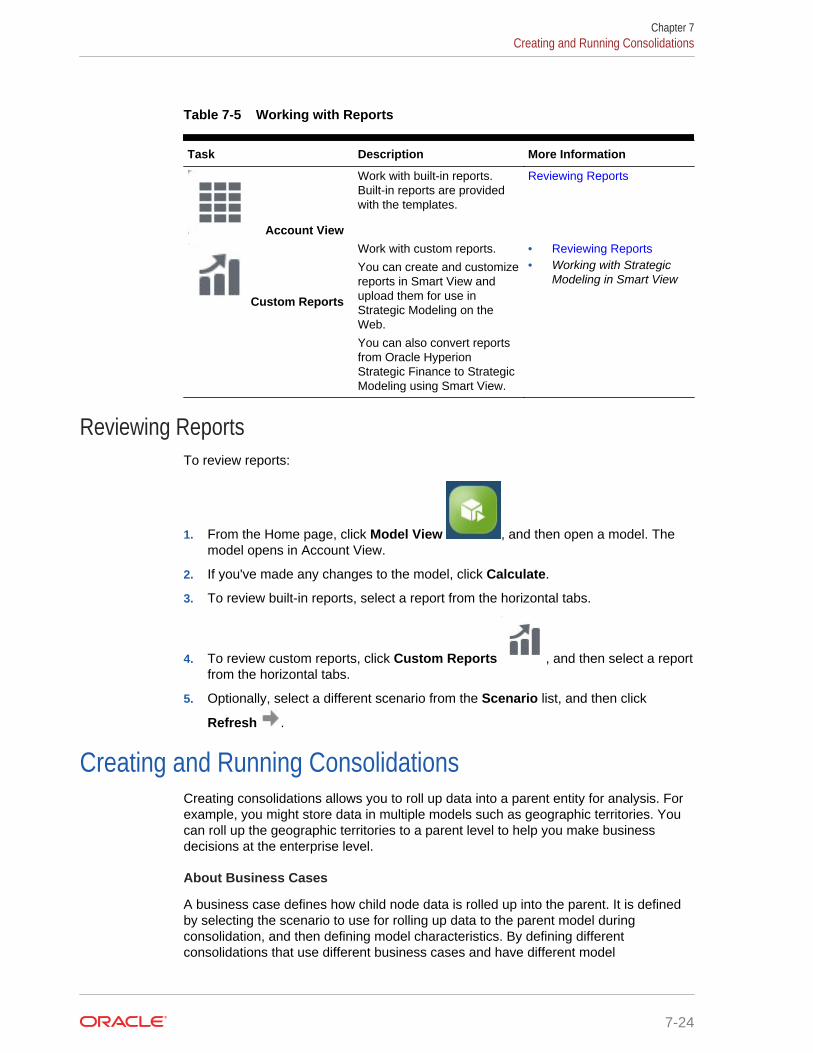
Table 7-5 Working with Reports
Task Description More Information
Account View
Work with built-in reports.Built-in reports are providedwith the templates.
Reviewing Reports
Custom Reports
Work with custom reports.
You can create and customizereports in Smart View andupload them for use inStrategic Modeling on theWeb.
You can also convert reportsfrom Oracle HyperionStrategic Finance to StrategicModeling using Smart View.
• Reviewing Reports• Working with Strategic
Modeling in Smart View
Reviewing ReportsTo review reports:
1. From the Home page, click Model View , and then open a model. Themodel opens in Account View.
2. If you've made any changes to the model, click Calculate.
3. To review built-in reports, select a report from the horizontal tabs.
4. To review custom reports, click Custom Reports , and then select a reportfrom the horizontal tabs.
5. Optionally, select a different scenario from the Scenario list, and then click
Refresh .
Creating and Running ConsolidationsCreating consolidations allows you to roll up data into a parent entity for analysis. Forexample, you might store data in multiple models such as geographic territories. Youcan roll up the geographic territories to a parent level to help you make businessdecisions at the enterprise level.
About Business Cases
A business case defines how child node data is rolled up into the parent. It is definedby selecting the scenario to use for rolling up data to the parent model duringconsolidation, and then defining model characteristics. By defining differentconsolidations that use different business cases and have different model
Chapter 7Creating and Running Consolidations
7-24
characteristics, you can analyze how these different business cases affect thebusiness at a more global, consolidated level.
Overview of Creating and Running Consolidations
Follow these overall steps for creating and running consolidations.
1. Create the consolidation and build the consolidation structure. See Creating aConsolidation.
2. Create and assign one or more business cases. See Defining Business Cases forConsolidations.
3. Define model characteristics. See Defining Model Characteristics.
4. Run the consolidation. See Running a Consolidation.
Watch this tutorial video to learn more about creating and running consolidations.
Tutorial Video
Creating a ConsolidationTo create a new consolidation:
1. From the Home page, click Consolidation View .
2. Click Add and enter a name.
3. From the Actions menu, click Open to start building the consolidationstructure.
4. Click to add models to the consolidation structure.
5. From the Available Models list, drag and drop a model to the consolidationstructure.
6. To add an additional model, drag and drop a model from the Available Models listto the location you want in the Consolidation structure.
7. To delete a model from the consolidation structure, select the model, and from the
Actions menu, click Remove Model. The selected model and all of itschildren and business cases are removed from the consolidation structure.
If you delete a consolidation that you've already run, it deletes the associated businesscases in all of the models in the structure.
After creating the consolidation structure, you must create a business case to definehow child node data is rolled up to the parent. See Defining Business Cases forConsolidations.
About Valid Consolidation Structures
To ensure that your consolidation structure is valid, avoid these conditions that causeconsolidations to fail:
Chapter 7Creating and Running Consolidations
7-25
• Fiscal years don't match
• Subperiods exist in the parent that don't exist in the child
• Deal period exists in the parent without a matching deal period in the child
These conditions won't stop a consolidation from running, but could causemeaningless data:
• The child has years that the parent doesn't have
• The parent and child have different historical boundaries
• There are matching periods in the parent and child but the number of days in theperiods are not the same
• The actual period boundaries don't match
• The user-defined dimensions are not compatible
• The parent and child have a different number of months or weeks in a year or theend of the year falls on different days
• The parent has periods with more time detail than the child (for example, theparent has months but the child only has years)
Defining Business Cases for ConsolidationsOnce you've built a consolidation structure, you must create one or more businesscases to complete the consolidation definition. A business case defines how childnode data is rolled up into the parent.
To create a business case:
1. Select a model in the consolidation structure, and then click Add New BusinessCase.
2. Enter a business case name.
3. In Leaf Node Scenario to Contribute, select the default scenario to use for theleaf nodes in this structure for rolling up data to the parent model duringconsolidation, and then click Add.You can change the scenario associated with individual leaf nodes later in theConsolidation tree structure list in the Scenario column.
The business case is added and becomes the currently active business case.
4. To add an additional business case, click the business case name next toBusiness Case, and then click Add Business Case. For example, you mightwant to add a business case that reflects a different default scenario or hasdifferent model characteristics.
5. To exclude a model from a business case during consolidation, but keep it in the
consolidation structure, select the model, and from the Actions menu, clickExclude Model, and then select whether to exclude From the Parent BusinessCase or From All Parent Business Cases. When a model is excluded from theparent business case, [Excluded] is displayed next to the model name. When amodel is excluded from all parent business cases, [Excluded from All] isdisplayed next to the model name.
Chapter 7Creating and Running Consolidations
7-26
For example, there could be a model where the additive process for consolidationdoes not apply. For example, non-currency accounts such as inflation rates andprice/quantity relationships would not make sense to include in the consolidation.
6. To remove a business case, select the business case from the Business Case
list, and from the Actions menu, click Remove Business Case.
Note:
If users are also working in Oracle Smart View for Office, click Refresh to getthe changes from the database.
After adding business cases, you define model characteristics to further define yourbusiness case. See Defining Model Characteristics.
Defining Model CharacteristicsAfter you've added models to a consolidation and added a business case, you canfurther define the consolidation by defining the model characteristics.
1. To define model characteristics, select a model from the consolidation structure,
and from the Actions menu, click Model Characteristics.The attributes available depend on whether the model is a child or parent in theconsolidation structure.
2. To specify model characteristics for a child level model, see Specifying ChildModel Attributes.To specify model characteristics for a parent level model, see Specifying ParentModel Attributes.
For intermediate nodes in the consolidation structure, you define both child andparent characteristics.
Specifying Child Model AttributesTo specify child model attributes:
1. In Method Used, specify the method for consolidating the entity to the parent:When you use the Cost, Equity, or Minority Interest Consolidation methods,the subaccount structures should be similar.
• Full Consolidation—Use this method to consolidate 100% of all accounts.
• Cost—Use this method when the amount of investment in a company is lessthan 20% and is held for at least one year.
• Equity—Use this method when the amount of investment in a company is atleast 20% and less than 50% and is held for at least one year. Business unitvalues roll up into Dividends from Subsidiaries and Earnings from Investmentsaccounts, which are used to calculate the parent's investments.
• Minority Interest—Use this method when the amount of investment isbetween 50% and 100% of the company's stock. This method also rolls upoutput values. While 100% of the business unit is consolidated, thesecalculations recognize the outside interest in the business.
Chapter 7Creating and Running Consolidations
7-27
For more details about the calculations used for each method, see "DataManagement" in Working with Strategic Modeling in Smart View.
2. If you specified Equity for the method, in Target Subaccount, specify whichsubaccount receives the child entities' values.This option is available if account v2420 in the parent entity was set up to includesubaccounts. This method has calculations for v2420. If v2420 has subaccounts,specify which subaccount receives the child entities values.
3. If you specified Equity for the method, in Equity Groups, select an accountgroup.Account groups you select here are consolidated into the parent.
4. In Ownership, enter the percentage of the entity to be consolidated.For example, if sales in the first forecast period of the child entity are $200 andownership is 100%, $200 is consolidated. If ownership is 80%, $160 isconsolidated.
5. In Periods to Consolidate into Parent, specify the Start Period and End Periodacross which the consolidation should run. The time period range must be withinthe range of the consolidated parent. Select a specific time period or one of thefollowing:
• First Period in File—Consolidates starting in the first time period in themodel.
• <Deal Period>—Consolidates starting in the deal period (defined in TimePeriods in Oracle Smart View for Office).
• Residual value period—Uses the last period in the model. Or, if endingperiods don't match between child and parent, the residual value period iscalculated.
6. Click Apply to apply changes for this node in the consolidation structure to thecurrently selected business case. Click Apply All to apply changes for this node inthe consolidation structure to the all business cases for this node.
Specifying Parent Model AttributesTo specify parent model attributes:
1. In Contributing Scenarios, if applicable, from the Input Only Scenarios list,select the input only scenario or scenarios that include accounts that you don'twant rolled up to the parent. All input only scenarios in the parent model are listed.You can also define input only scenarios for parent models that are at anintermediate level in a nested consolidation.
Use this option when you want the parent node to contribute data values to theconsolidation instead of getting values from the child for the accounts specified inthe input only scenario.
See About Using Input Only Scenarios in Consolidations.
2. In Elimination Groups Based On, select the source for elimination groups.Elimination groups define accounts to eliminate from consolidation. Select CurrentModel or Child Model, and then from the User Defined Elimination Groups,select account groups to eliminate from consolidation.Eliminated accounts are set to zero in the consolidation parent during processing.
3. For Data Preservation, define how data is used in non-consolidated time periods.
Chapter 7Creating and Running Consolidations
7-28
• Don't Preserve Data—Blocks data from non-consolidated time periods,resulting in zero values.
• Preserve Inputs—Data recalculates using Input cells. Preserve Input doesnot work on these input accounts because Consolidation treats them ascalculated accounts: v5000 Cost of Capital (Kw), v5005 Long-Term Cost ofCapital (%), v5300 Cost of Equity (Ke), v5305 Long-Term Cost of Equity (%),v5700 Economic Profit PROC (%), and v5705 Long-Term Required Return(%). To preserve the values of these accounts in the consolidation, add themto an input-only scenario that is used in the consolidation.
• Preserve Outputs—Data recalculates using Output cells.
4. Click Apply to apply changes for this node in the consolidation structure to thecurrently selected business case. Click Apply All to apply changes for this node inthe consolidation structure to the all business cases for this node.
About Using Input Only Scenarios in ConsolidationsIf you've created an input only scenario in a model, and that model is a parent model ina consolidation, you can specify the input only scenario when you define the parentmodel attributes for the consolidation. When you run the consolidation, for theaccounts specified in the input only scenario, the parent node contributes data valuesto the consolidation instead of getting values from the child.
For example, suppose you want to set up a scenario to define the financing for yourbusiness. Financing is typically defined at the parent level rather than at the businessunit (child) level. You define accounts that have the data you want to contribute tofinancing the business plan in an input only scenario in the parent model. You canhave more than one version of the data in different input only scenarios and contributedifferent input only scenarios to different business cases in the consolidation. Whenyou consolidate, you can analyze different results depending on different financeoptions from the different business cases. The financing data always comes from theparent model during a consolidation for the accounts specified in the input onlyscenario.
If there is more than one input only scenario in a parent model, you can select one ormore. For example, if you are modeling financing scenarios, but you also want tomodel operating scenarios, you can combine multiple scenarios that input values todifferent accounts so you can analyze different result sets.
Note:
If you select more than one input only scenario at the same time for a parentin a consolidation, ensure that each scenario contributes to differentaccounts in the consolidation.
About input only scenarios:
• They have no output values and cannot be calculated.
• They contain input values only for those accounts that are selected as members.
• They can be contributed as data to a business case in a consolidation. Multiplescenarios can be contributed to the same business case.
Chapter 7Creating and Running Consolidations
7-29
• Because data values and forecast methods are statically copied from thecontributing input only scenario(s) to the business case at consolidation time, thedata is refreshed from the original source each time you run the consolidation.
• Define member accounts that automatically block the consolidation of values forthe business case that they were contributed to.
Running a ConsolidationOnce you've defined your consolidation structure, business cases, and optionallymodel characteristics, you can run the consolidation.
To run a consolidation:
1. Select a model in the consolidation structure, and then click .
2. Select the business case or business cases to consolidate, or click All toconsolidate all business cases, and then click Run.By default, the currently selected business case is selected.
The consolidation is submitted to the Job Console, where you can monitor theprogress of the consolidation. From the Home page, click Application, and then Jobs.
When the consolidation is complete, you can open the parent model and see the datarolled up from child models.
Chapter 7Creating and Running Consolidations
7-30