Embed Size (px)
Citation preview
Working Paper
December 2015
Center for Economic and Policy Research 1611 Connecticut Ave. NW Suite 400 Washington, DC 20009
tel: 202-293-5380 fax: 202-588-1356 www.cepr.net
Dean Baker is an Economist and Co-Director at Center for Economic and Policy Research (CEPR)
Working Paper: The Upward Redistribution of Income: Are Rents the Story?
By Dean Baker* In the years since 1980, there has been a well-documented upward redistribution of income. While
there are some differences by methodology and the precise years chosen, the top one percent of
households have seen their income share roughly double from 10 percent in 1980 to 20 percent in
the second decade of the 21st century.1 As a result of this upward redistribution, most workers have
seen little improvement in living standards from the productivity gains over this period.
This paper argues that the bulk of this upward redistribution comes from the growth of rents in the
economy in four major areas: patent and copyright protection, the financial sector, the pay of CEOs
and other top executives, and protectionist measures that have boosted the pay of doctors and other
highly educated professionals. The argument on rents is important because, if correct, it means that
there is nothing intrinsic to capitalism that led to this rapid rise in inequality, as for example argued
by Thomas Piketty.
Rather than focusing on redistributive measures, such as strongly progressive income taxes or wealth
taxes, if inequality stems from rents, the appropriate response is to alter the institutional
arrangements that allow for such enormous rents. For example, if patents provide much larger
compensation to patent holders than is necessary to achieve breakthroughs in medical research and
other areas, then the goal should be to design a system to finance research with smaller rewards. If
the current system provides for rents, then this alternative system should allow for the same pace of
innovation at lower cost, thereby both increasing efficiency and reducing inequality. The issue in this
1 Saez (2015), Data for Figure 2.
Working Paper: The Upward Redistribution of Income: Are Rents the Story? 2
story is not using the government to reverse market outcomes but rather to restructure the market
to generate qualitatively different outcomes.
Before outlining the evidence for the existence and magnitude of rents from each of these sources, it
is worth making two additional points. First, it is necessary to have a brief digression on the use of
the term “rent” in this discussion. “Rent” is used to refer to an income that is generated that exceeds
what would be needed to meet the same economic purpose given an alternative set of institutional
arrangements. In this sense, “rents” are accruing due to patent and copyright protection if it would
be possible to generate the same amount of innovation or creative work at less expense with an
alternative institutional structure. In the case of CEO pay, the question is whether it would be
possible to induce the same amount of effort from comparably skilled individuals at lower pay in a
different institutional structure.
The second point concerns a simple empirical issue. The upward redistribution over this time period
is overwhelmingly not a story of redistribution from labor to capital. While the distribution of
income shares between factors has gotten considerable attention recently,2 a careful examination of
the data shows that income shares changed little from the end of the 1970s until the recent
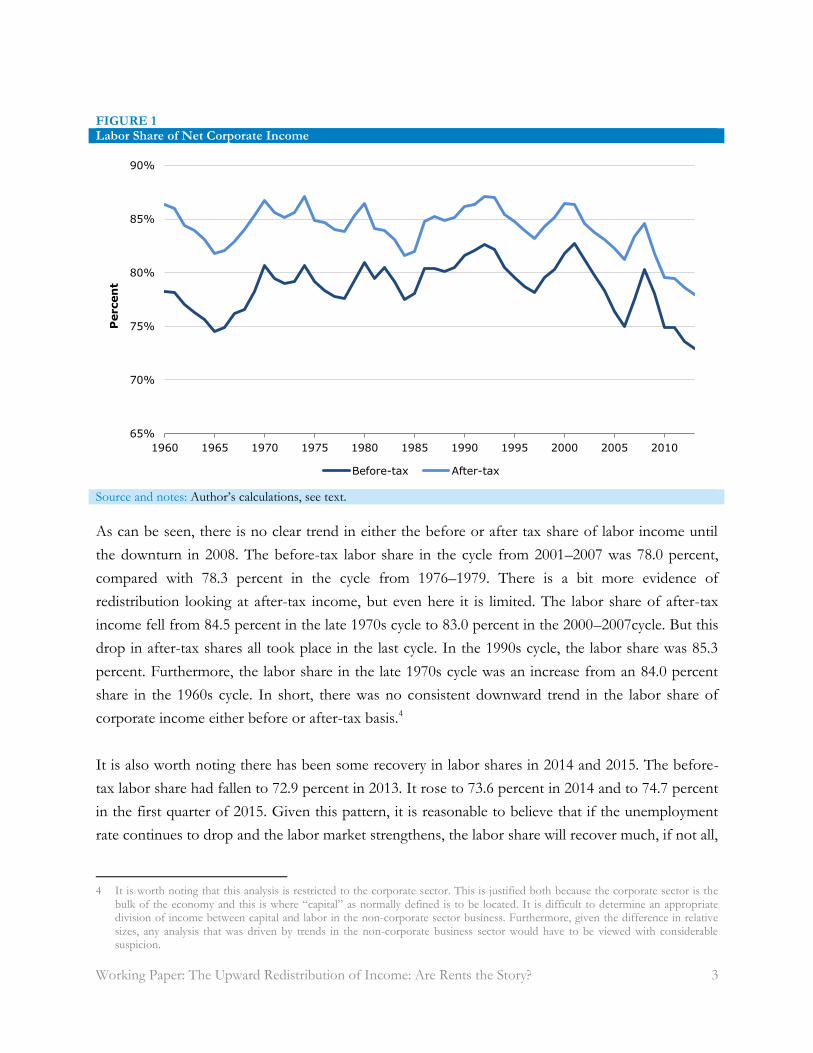
recession. Figure 1 shows the share of labor in net corporate income from 1960 to 2013, both
before- and after-tax.3
3 These data are taken from BEA (2015), National Income and Product Accounts, Table 1.14 Labor income is total compensation
(Line 4, while the denominator for before tax income is net value added (Line 3) minus indirect business taxes. The denominator for after-tax income subtracts corporate income taxes (Line 7) from the denominator. Indirect business taxes are removed since there is not an obvious way to allocate them between labor and capital. The trend is affected little by their inclusion. Arguably, the category of business transfers, which have increased substantially over this period, should be treated as a form of corporate income tax. Business transfers includes items like the money paid out as part of the tobacco settlement and the settlements that banks made as a result of their conduct during the housing bubble. If these were deducted the labor share of after-tax income would be slightly higher toward the end of this period.
Working Paper: The Upward Redistribution of Income: Are Rents the Story? 3
FIGURE 1
Labor Share of Net Corporate Income
Source and notes: Author’s calculations, see text.
As can be seen, there is no clear trend in either the before or after tax share of labor income until
the downturn in 2008. The before-tax labor share in the cycle from 2001–2007 was 78.0 percent,
compared with 78.3 percent in the cycle from 1976–1979. There is a bit more evidence of
redistribution looking at after-tax income, but even here it is limited. The labor share of after-tax
income fell from 84.5 percent in the late 1970s cycle to 83.0 percent in the 2000–2007cycle. But this
drop in after-tax shares all took place in the last cycle. In the 1990s cycle, the labor share was 85.3
percent. Furthermore, the labor share in the late 1970s cycle was an increase from an 84.0 percent
share in the 1960s cycle. In short, there was no consistent downward trend in the labor share of
corporate income either before or after-tax basis.4
It is also worth noting there has been some recovery in labor shares in 2014 and 2015. The before-
tax labor share had fallen to 72.9 percent in 2013. It rose to 73.6 percent in 2014 and to 74.7 percent
in the first quarter of 2015. Given this pattern, it is reasonable to believe that if the unemployment
rate continues to drop and the labor market strengthens, the labor share will recover much, if not all,
4 It is worth noting that this analysis is restricted to the corporate sector. This is justified both because the corporate sector is the
bulk of the economy and this is where “capital” as normally defined is to be located. It is difficult to determine an appropriate division of income between capital and labor in the non-corporate sector business. Furthermore, given the difference in relative sizes, any analysis that was driven by trends in the non-corporate business sector would have to be viewed with considerable suspicion.
65%
70%
75%
80%
85%
90%
1960 1965 1970 1975 1980 1985 1990 1995 2000 2005 2010
Percen
t
Before-tax After-tax
Working Paper: The Upward Redistribution of Income: Are Rents the Story? 4
of the ground lost during the downturn. Of course, there is no guarantee that job growth will
continue at the same pace as in 2013–2015, in which case some of the loss in labor shares could
persist.
While this would be hugely important for most workers’ living standards, this is a relatively
straightforward macroeconomic phenomenon that can be distinguished from the upward
redistribution that happened in the years before the collapse of the housing bubble. That was clearly
a story of an upward redistribution among wage earners rather than from labor to capital. In this
respect, it is also worth noting that high unemployment has likely played a role in this upward
redistribution. The unemployment rate averaged 0.6 percentage points above the Congressional
Budget Office’s (CBO) estimate of the NAIRU in the years since 1980, excluding the years since
2008. By contrast, the unemployment rate was on average 0.5 percentage points below CBO’s
estimate of the NAIRU in the years from 1949–1979.5,6 Since a tight labor market has a
disproportionate effect on wage growth at the middle and bottom end of the wage distribution, the
higher unemployment rates in the period since 1980 have almost certainly been an important factor
in the upward redistribution among wage earners over this period.
The distinction between a redistribution from wages to profits and a redistribution from middle and
low-end wage earners to high-end earner is important for two reasons. The first is in recognizing
where the money went that workers were not receiving. Up until the downturn, it was not profits.
The second reason it is important to recognize that a rising profit share cannot explain wage
stagnation through most of this period is that it undermines the view that there was some
fundamental change in the conditions of competition over this period. The forces putting downward
pressure on wages during this period led to lower prices for consumers. For example, substituting
lower cost labor from the developing world for higher paid manufacturing workers in the United
States, led to lower prices for the finished product. A key implication of this story is that policies
that put downward pressure on the incomes of high-end earners will also result primarily in lower
prices for consumers, not higher profits. This means that it should be expected that depressing the
incomes of high-end earners will lead to higher real wages for most workers through lower prices.
5 Baker and Bernstein (2013). 6 The CBO estimates of the NAIRU need not be taken as an accurate measure of the economy’s limits in generating employment;
however, they do provide an unbiased point of reference for these purposes.
Working Paper: The Upward Redistribution of Income: Are Rents the Story? 5
Rents from Patents and Copyrights The argument for patent and copyright protection is straightforward. The idea is for the government
to provide monopolies for a limited period of time in order to provide incentives for innovation and
creative work. Patent and copyright monopolies are one of the ways in which the government can
finance research and development and creative work, but it is certainly not the only way, and
arguably not the best way.
In the last three decades as a matter of policy, these monopolies have gotten considerably stronger
and longer. For example, the length of copyright protection was twice lengthened, going from a
maximum of 56 years (28 years, with the option of a 28 year extension) prior to 1976 to 95 years in
the Sony Bono Copyright Act passed in 1998. The scope has also been extended to apply to a wide
range of digital reproductions. The areas in which it is possible to gain patent monopolies has been
hugely expanded since 1980, with changes in laws and court rulings allowing for patents of life
forms, business methods, and software.
The extension and strengthening of patent and copyright law has hugely increased the amount of
rents gained as a result. This is perhaps clearest in the case of pharmaceuticals. In 2014, the country
spent $423.5 billion on pharmaceuticals.7 These drugs would have likely sold for 10–20 percent of
this price in the absence of patents and related protections.8 This implies savings of between $340
billion and $380 billion if all drugs were sold in a free market.
Of course, it would be necessary to replace the research supported through patent monopolies.
7 BEA (2015), National Income and Product Accounts, Table 2.4.5U, Line 20. 8 It is difficult to produce an accurate estimate of the price of these drugs in a world without patent protections. There is data
available on the price of generic prescriptions compared to those of brand drugs, but the generic prices will still exceed the free market price for three reasons. First, the first generic manufacturer in a market enjoys a period of six months as an exclusive generic. During this period, it is likely to charge a price far above the competitive market price. The second reason is that brand manufacturers also make drugs which are sold as generics. These drugs are likely to be sold as at a premium to patients who started treatment with the brand drug and want to remain on the brand drug. The third reason is that even if the main patent(s) for a drug may have expired, there may be patents on other ingredients that raise the price of the drug. Chain drug stores sell hundreds of generic drugs for $5–$10 per prescription. As a group, these drugs are not qualitatively different than brand drugs. According to the National Association of Chain Drug Stores, the average price of a brand prescription in 2010 was $166.71, the most recent year for which data are available National Association of Chain Drug Stores, 2010. Prices had risen at an average annual rate of 9.8 percent, implying that the average price per prescription in 2015 would be $266. The average price for a generic in 2010 was $44.14. Generic drug prices had increased at an 8.7 percent rate since 2000, implying an average of price of $67 in 2015, or roughly 25 percent of the brand price. However, since the average generic price would still be inflated by patent protection, the price of generics in a truly competitive market would have to be considerably less.
Working Paper: The Upward Redistribution of Income: Are Rents the Story? 6
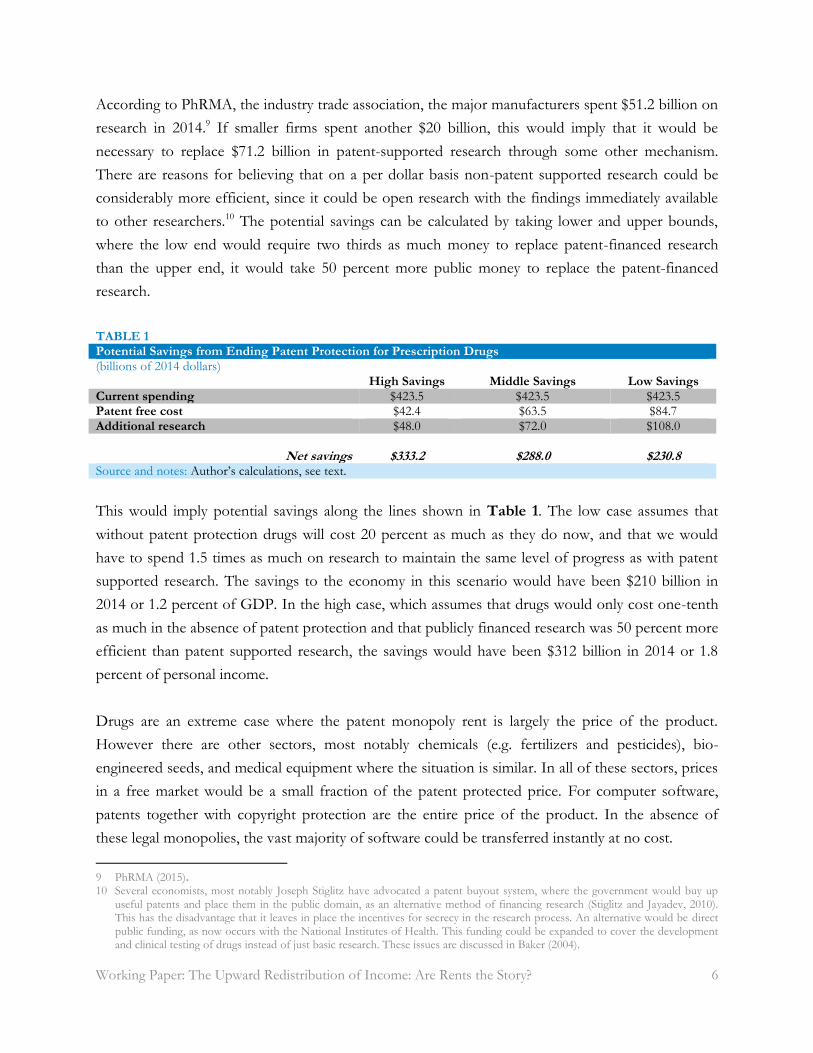
According to PhRMA, the industry trade association, the major manufacturers spent $51.2 billion on
research in 2014.9 If smaller firms spent another $20 billion, this would imply that it would be
necessary to replace $71.2 billion in patent-supported research through some other mechanism.
There are reasons for believing that on a per dollar basis non-patent supported research could be
considerably more efficient, since it could be open research with the findings immediately available
to other researchers.10 The potential savings can be calculated by taking lower and upper bounds,
where the low end would require two thirds as much money to replace patent-financed research
than the upper end, it would take 50 percent more public money to replace the patent-financed
research.
TABLE 1
Potential Savings from Ending Patent Protection for Prescription Drugs
(billions of 2014 dollars) High Savings Middle Savings Low Savings Current spending $423.5 $423.5 $423.5 Patent free cost $42.4 $63.5 $84.7 Additional research $48.0 $72.0 $108.0
Net savings $333.2 $288.0 $230.8 Source and notes: Author’s calculations, see text.
This would imply potential savings along the lines shown in Table 1. The low case assumes that
without patent protection drugs will cost 20 percent as much as they do now, and that we would
have to spend 1.5 times as much on research to maintain the same level of progress as with patent
supported research. The savings to the economy in this scenario would have been $210 billion in
2014 or 1.2 percent of GDP. In the high case, which assumes that drugs would only cost one-tenth
as much in the absence of patent protection and that publicly financed research was 50 percent more
efficient than patent supported research, the savings would have been $312 billion in 2014 or 1.8
percent of personal income.
Drugs are an extreme case where the patent monopoly rent is largely the price of the product.
However there are other sectors, most notably chemicals (e.g. fertilizers and pesticides), bio-
engineered seeds, and medical equipment where the situation is similar. In all of these sectors, prices
in a free market would be a small fraction of the patent protected price. For computer software,
patents together with copyright protection are the entire price of the product. In the absence of
these legal monopolies, the vast majority of software could be transferred instantly at no cost.
9 PhRMA (2015). 10 Several economists, most notably Joseph Stiglitz have advocated a patent buyout system, where the government would buy up
useful patents and place them in the public domain, as an alternative method of financing research (Stiglitz and Jayadev, 2010). This has the disadvantage that it leaves in place the incentives for secrecy in the research process. An alternative would be direct public funding, as now occurs with the National Institutes of Health. This funding could be expanded to cover the development and clinical testing of drugs instead of just basic research. These issues are discussed in Baker (2004).
Working Paper: The Upward Redistribution of Income: Are Rents the Story? 7
As is the case with pharmaceuticals, it would be necessary to find a mechanism to replace the patent
supported research. In cases like prescription drugs, where the patent protection is essentially the
price of the product, it likely makes sense to rely on direct public funding for research and
development costs. In other sectors, where patents provide a subsidy to innovation, but have less
impact on the final price, it is likely that more efficient subsidies could be found. For example, an
increase in the size of the research and development tax credit to 10 percent of all research costs
would likely provide a comparable incentive to patent protection in most areas, especially if coupled
with an additional spending on basic research to reduce the cost of carrying through research.11
In the case of books and other written material, recorded music, videos, movies and other creative
work, there are almost certainly more efficient mechanisms for financing the production than
copyright monopolies. One possibility is a tax credit for individuals that can be used to support
creative workers of their choice, who would give up the right to copyright protection.12 In principle,
this could create a vast amount of creative work that would be instantly available at no cost over the
Internet.
It will take further research to produce rigorous estimates of the total savings to the economy from
the use of alternatives to patent and copyright monopolies throughout the economy, but if the
savings from all other areas are just equal to the savings in the prescription drug sector, the
implication would be that the economy would have saved between $460 billion and $670 billion in
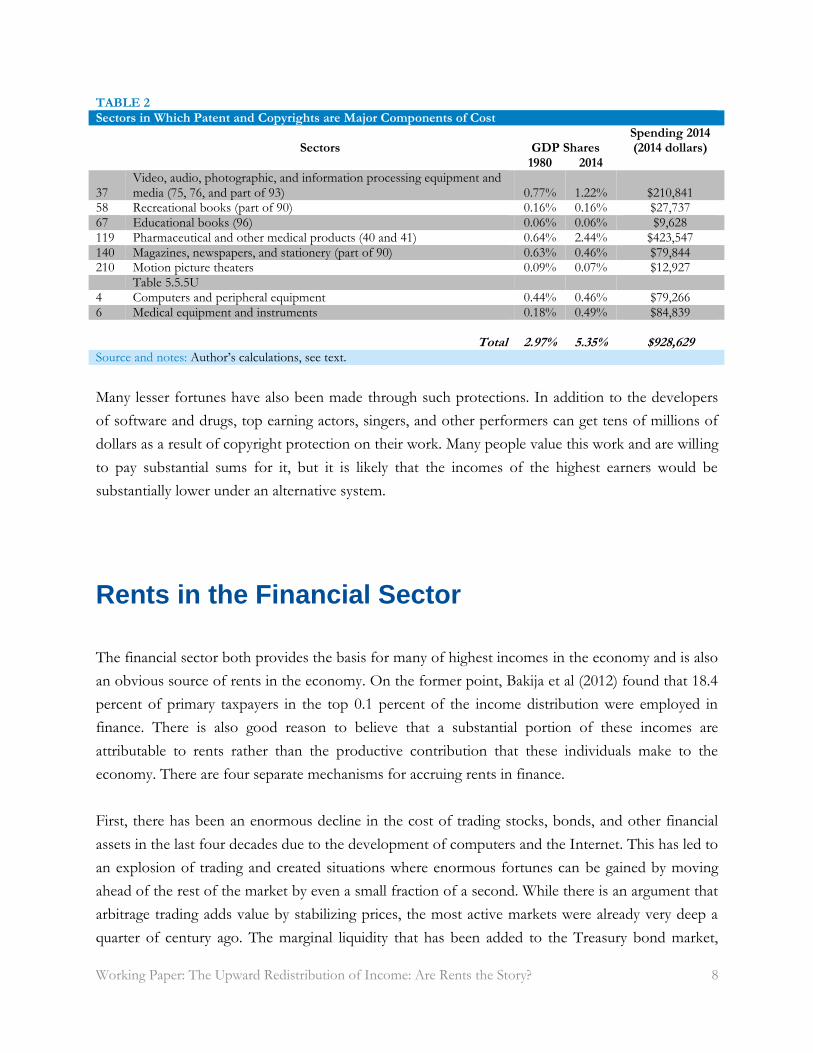
2014, or 2.4-3.7 percent of GDP from the use of these alternative mechanisms.13 Table 2 shows
some of the major industries in which patent and copyright protection account for a large portion of
the sale price.14 Clearly not all of these savings would have come at the expense of the wealthy, but
certainly large shares would. The list of the country’s wealthiest people includes numerous examples
of people who have made their fortunes from these protections, starting at the top with Bill Gates
and Oracle’s Larry Ellison, who Forbes placed as the third wealthiest person in 2014.
11 Lanjouw et al. (1998) gives a useful summary of the estimates of the implicit value of patents as subsidies to research. 12 Baker (2003). 13 Assuming that all other patent and copyright related waste is just equal to the waste in the pharmaceutical sector is a very
conservative assumption. Spending on medical equipment alone came to $84.8 billion in 2014 (BEA, 2015, National Income and Product Accounts, Table 5.5.5U, Line 6). The items in this category, such as MRIs and surgical tools, raise largely the same set of issues as pharmaceuticals.
14 Table 2 excludes many sectors where patent and copyright protection are an important factor, like pesticides and broadcasting, because directly comparable data is not available.
Working Paper: The Upward Redistribution of Income: Are Rents the Story? 8
TABLE 2
Sectors in Which Patent and Copyrights are Major Components of Cost
Sectors GDP Shares
Spending 2014 (2014 dollars)
1980 2014
37 Video, audio, photographic, and information processing equipment and media (75, 76, and part of 93) 0.77% 1.22% $210,841
58 Recreational books (part of 90) 0.16% 0.16% $27,737 67 Educational books (96) 0.06% 0.06% $9,628 119 Pharmaceutical and other medical products (40 and 41) 0.64% 2.44% $423,547 140 Magazines, newspapers, and stationery (part of 90) 0.63% 0.46% $79,844 210 Motion picture theaters 0.09% 0.07% $12,927 Table 5.5.5U 4 Computers and peripheral equipment 0.44% 0.46% $79,266 6 Medical equipment and instruments 0.18% 0.49% $84,839 Total 2.97% 5.35% $928,629 Source and notes: Author’s calculations, see text.
Many lesser fortunes have also been made through such protections. In addition to the developers
of software and drugs, top earning actors, singers, and other performers can get tens of millions of
dollars as a result of copyright protection on their work. Many people value this work and are willing
to pay substantial sums for it, but it is likely that the incomes of the highest earners would be
substantially lower under an alternative system.
Rents in the Financial Sector The financial sector both provides the basis for many of highest incomes in the economy and is also
an obvious source of rents in the economy. On the former point, Bakija et al (2012) found that 18.4
percent of primary taxpayers in the top 0.1 percent of the income distribution were employed in
finance. There is also good reason to believe that a substantial portion of these incomes are
attributable to rents rather than the productive contribution that these individuals make to the
economy. There are four separate mechanisms for accruing rents in finance.
First, there has been an enormous decline in the cost of trading stocks, bonds, and other financial
assets in the last four decades due to the development of computers and the Internet. This has led to
an explosion of trading and created situations where enormous fortunes can be gained by moving
ahead of the rest of the market by even a small fraction of a second. While there is an argument that
arbitrage trading adds value by stabilizing prices, the most active markets were already very deep a
quarter of century ago. The marginal liquidity that has been added to the Treasury bond market,
Working Paper: The Upward Redistribution of Income: Are Rents the Story? 9
which may reduce the average time for completing a buy or sell order by a fraction of a second,
cannot have any substantial value to the economy. Furthermore, in many cases active traders are
acting as momentum traders, trying to jump ahead of large buy or sell orders. In these cases, the
traders are doing nothing to add liquidity to the market. This is pure rent-seeking. It has also made
many traders at large banks as well as hedge fund partners extremely wealthy.
The most direct way to deal with this form of waste is with a financial transactions tax. The revenue
raised by a tax will come largely or completely out of the pockets of the financial industry, since it
will lead to a sharp decline in trading volume. It will make most trading based on rapid turnaround
unprofitable. To get a rough idea of the amount of money at stake, the Tax Policy Center of the
Brookings Institution and the Urban Institute recently estimated that a scaled tax along the lines
being proposed in the European Union (0.1 percent on stock trade, 0.01 percent on derivatives)
would raise $50 billion a year in the United States.15 This analysis assumed an elasticity of -1.5, which
implies a reduction in annual trading volume of roughly $75 billion or 0.4 percent of GDP.16 This is
all revenue lost to the financial sector, with a disproportionate share likely coming from some of the
industry’s highest earners.
A second way in which actors in the financial sector have been able to accrue substantial rents is by
taking advantage of implicit too big to fail (TBTF) insurance from the government for large financial
institutions. The logic of this subsidy is that large financial institutions are able to borrow at lower
interest rates than would be justified by their financial situations, since lenders assume the
government would act to support the institution if it faced financial difficulty. A recent estimate
from the I.M.F. put the value of the implicit subsidy to the country’s largest financial firms at
between $25 billion–$50 billion annually.17 The main beneficiaries of this subsidy would likely be the
top executives at the banks, as well as shareholders. This implicit subsidy can be addressed by either
requiring banks to downsize or penalizing them by an amount that offsets the value of the subsidy.
A third way in which the finance industry can be seen as drawing rents is when tasks that could be
performed more efficiently by the government, or a monopoly private provider, are instead parceled
out to private firms. Social Security would be an obvious example, since the economics of
privatization have been examined extensively. There is now a large body of literature showing that
15 Burman et al. (2015). 16 Another recent estimate (Baker et al. 2009) calculated that a somewhat higher FTT could raise an amount equal to roughly 1
percent of GDP. However, this assumed a much smaller elasticity of trading, so the implied reduction in trading volume would be comparable to the reduction implied by the Tax Policy Center estimate.
17 International Monetary Fund (2014). A recent study from the Government Accountability Office (2014) concluded that the value of the implicit TBTF subsidy had shrunk to zero. It is worth noting that this study also found the value of the subsidy to be zero as of 2006. It seems likely that the GAO methodology cannot effectively price the subsidy in conditions where credit spreads are relatively small, as was the case in 2014.
Working Paper: The Upward Redistribution of Income: Are Rents the Story? 10
the administrative costs of running a decentralized privatized system is far greater than the costs of
the current Social Security system. This is because of the economies of scale in a single large system,
the costs that inevitably accompany competition, such as marketing, the cost of government
oversight, the higher pay that top management earns in the financial sector, and also the profits
earned by the industry (see, e.g., Orszag and Stiglitz 2001; National Academy for Social Insurance
1998).
The United States did not privatize its Social Security system, but the same argument would apply to
many sectors that are privatized, most obviously the privately run system of defined contribution
pensions. This system has average costs of 0.95 percent of the assets under management.18 By
comparison the Thrift Savings Plan (TSP) for federal employers has administrative costs equal to
0.29 percent of assets.19 Even if these were doubled to account for the greater costs associated with
contributions from a diverse set of employers it would still imply a gap of 0.37 percentage points. If
this were applied to the full $13.84 trillion in assets of defined contribution plans it would imply a
savings of $51 billion per year coming directly at the expense of the financial sector.20 If these assets
were managed at the same cost as the TSP, the savings would be $91 billion annually.
There is a similar situation with the management of defined benefit pension plans. These plans often
pay excessive fees to managers who provide no better returns than could be obtained if they
invested in index funds. While some pension funds are efficiently managed, many are still avenues
for cronyism, with politically connected managers able to rack up fees that far exceed market rates.21
The assets of all defined benefit pension plans were $11.36 trillion at the end of the first quarter of
2015.22 If the savings from reducing excessive fees were between 0.1 percent and 0.3 percent of
assets, this would come to between $11 and $34 billion annually.
Another major source of waste is the administrative costs associated with the private health
insurance industry. Administrative costs in the sector are equal to 13.7 percent of the benefits paid
out compared to less than 2.0 percent in a government run system like the one in Canada. 23 With
spending on administrative costs at more than $120 billion in 2014, the savings from getting to
18 Munnell et al. (2011). 19 Thrift Savings Plan (2015). 20 The figure for defined contribution plan assets comes from the Federal Reserve Board (2015), Flow of Funds Accounts, Table
L.117, Line 26 and Line 27. 21 For example, Steven Rattner, an investment fund manager who later oversaw the bailout of the auto industry in the Obama
administration, agreed to make a payment of $6.2 million to the Securities and Exchange Commission, Bloomberg New, November 18, 2010, “Rattner Settles with SEC on Kickbacks as Cuomo Sues,” http://www.bloomberg.com/news/articles/2010-11-18/sec-sues-steven-rattner-in-new-york-for-kickbacks-with-politcal-consultant.
22 Federal Reserve Board (2015), Flow of Funds Table L.117, Line 25. 23 The calculation for the United States is taken from the Centers for Medicare and Medicaid Services, National Health Care
Expenditures Historical Data for 2013; CMS (2014). Net insurance expenditures from private insurers are taken from Table 4, insurance payments from Table 2. The estimate for administrative costs in Canada is taken from Woolhander et al. (2003).
Working Paper: The Upward Redistribution of Income: Are Rents the Story? 11
Canadian levels would be over $100 billion annually. Even if the costs were twice as high as in the
Canadian system, the savings would still have been over $80 billion in 2014. (It is worth noting that a
universal Medicare type system would also provide large administrative savings to providers who
would no longer have to deal with a variety of complex insurance rules and forms, as well to
patients.)
A final source of rents in the financial sector is the tax shelter industry. There has been considerable
focus on tax shelters as a mechanism for corporations and wealthy individuals to escape their tax
liability. A neglected aspect of this issue is that large rents are earned by the individuals and
corporations that engineer the tax shelters. This is perhaps mostly clearly visible in the case of the
private equity (PE) industry. While there are examples of PE companies doing what their promoters
claim, providing capital and managerial expertise to companies that badly need both, much of the
gains from private equity stem from their ability to game the tax code.24 Most obviously, it is
standard for PE companies to load up acquisitions with debt. The interest on this debt is deducted
from taxable profits, as opposed to the dividends that would otherwise be paid to shareholders. PE
companies will typically take advantage of many other loopholes in the tax code. After all, they have
access to accountants who are experts in gaming the tax code while small companies generally do
not.
The PE industry had almost $3.5 trillion in assets under management in 2013.25 If management fees,
including incentive pay, averages 3.0 percent of this amount, then the industry’s income would be
$105 billion annually. If one third of its income was eliminated by closing the tax and regulatory
loopholes that it exploits, the savings would be $35 billion annually. Eliminating half would provide
an annual savings of $53 billion. This is undoubtedly a conservative estimate of the potential savings
from reducing access to tax shelters, since there are many law and accounting firms that are
unconnected to private equity companies also profit from exploiting these shelters. Of course, many
private equity partners are among the very richest people in the country, so reducing the ability for
this sector to profit would be an effective way to reverse the upward redistribution of the last three
decades.
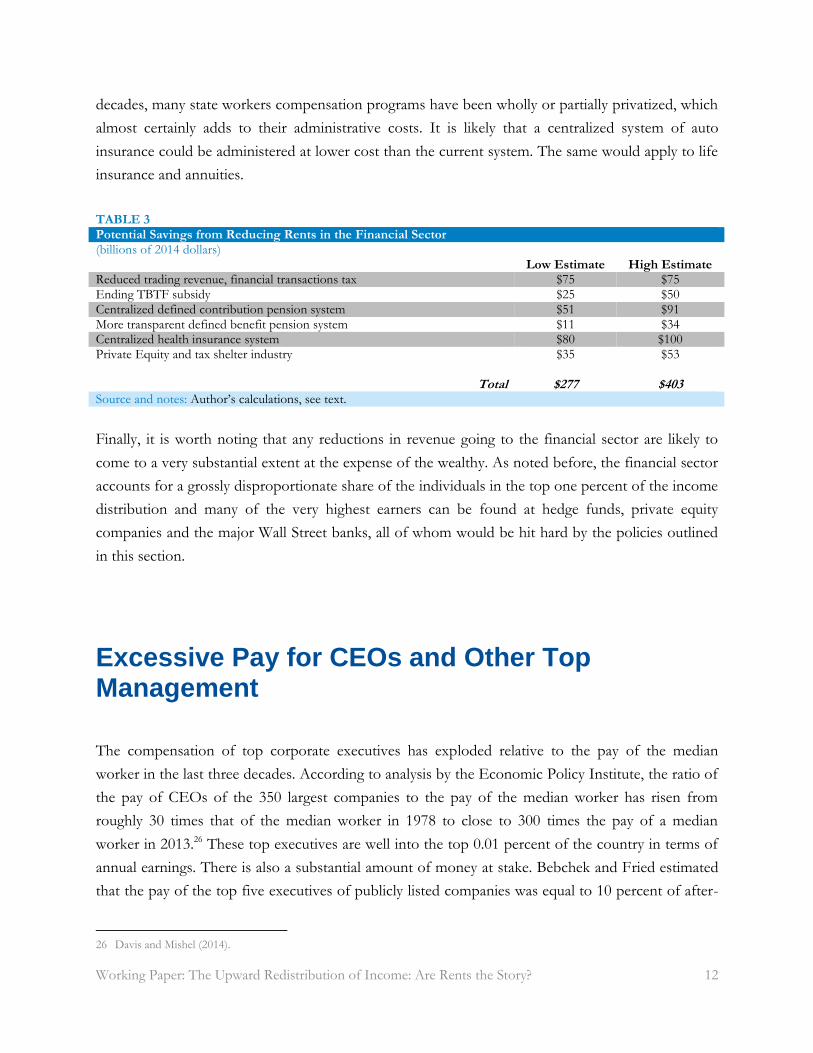
Table 3 shows the potential gains from eliminating the various sources of rents in the financial
sector. The total for the range of estimates included is between $280 and $400 billion in 2014, or
between 1.6 and 2.2 percentage points of personal income. It is worth noting that there are still
some potentially large sources of rents that have not been included in this calculation. In the last two
24 Appelbaum and Batt (2014). 25 Prequin (2014).
Working Paper: The Upward Redistribution of Income: Are Rents the Story? 12
decades, many state workers compensation programs have been wholly or partially privatized, which
almost certainly adds to their administrative costs. It is likely that a centralized system of auto
insurance could be administered at lower cost than the current system. The same would apply to life
insurance and annuities.
TABLE 3
Potential Savings from Reducing Rents in the Financial Sector
(billions of 2014 dollars) Low Estimate High Estimate
Reduced trading revenue, financial transactions tax $75 $75 Ending TBTF subsidy $25 $50 Centralized defined contribution pension system $51 $91 More transparent defined benefit pension system $11 $34 Centralized health insurance system $80 $100 Private Equity and tax shelter industry $35 $53
Total $277 $403
Source and notes: Author’s calculations, see text.
Finally, it is worth noting that any reductions in revenue going to the financial sector are likely to
come to a very substantial extent at the expense of the wealthy. As noted before, the financial sector
accounts for a grossly disproportionate share of the individuals in the top one percent of the income
distribution and many of the very highest earners can be found at hedge funds, private equity
companies and the major Wall Street banks, all of whom would be hit hard by the policies outlined
in this section.
Excessive Pay for CEOs and Other Top Management The compensation of top corporate executives has exploded relative to the pay of the median
worker in the last three decades. According to analysis by the Economic Policy Institute, the ratio of
the pay of CEOs of the 350 largest companies to the pay of the median worker has risen from
roughly 30 times that of the median worker in 1978 to close to 300 times the pay of a median
worker in 2013.26 These top executives are well into the top 0.01 percent of the country in terms of
annual earnings. There is also a substantial amount of money at stake. Bebchek and Fried estimated
that the pay of the top five executives of publicly listed companies was equal to 10 percent of after-
26 Davis and Mishel (2014).
Working Paper: The Upward Redistribution of Income: Are Rents the Story? 13
tax corporate profits in the late 1990s.27 If this relationship continues to hold, their pay in 2014
would have come to $141 billion in 2014.
In addition to the direct impact of excessive pay for top executives in the corporate world, there is
also a substantial indirect impact. The high pay of corporate executives puts upward pressure on the
pay of top executives in the non-corporate sector as well. It is now common for heads of
universities, non-profit hospitals, and private charities to earn compensation in excess of $1 million
annually. This is justified by the fact that a person with comparable responsibilities in the corporate
sector would easily be earning much more.
The high pay of top executives in the non-corporate sector amplifies the impact of excessive CEO
pay, both in producing another route through which a small number of people can earn large
paychecks, and providing another mechanism through which income is redistributed from the bulk
of the population to the very wealthy. The high pay of top management at universities, in addition to
the predictable proliferation of high level managers, is one of the main reasons that college costs
have consistently outpaced inflation over the last thirty five years.
While the explosion of top executive pay and its economic significance is not really debatable, the
key question for this analysis is whether this increase in pay reflects the greater productivity of
CEOs or whether it is simply a matter of CEOs being able to secure rents. In this situation
productivity of the CEO is interpreted narrowly as meaning their ability to secure returns for
shareholders, since in principle the shareholders are the ones determining CEO pay. The implication
of CEO rents would be that they are getting more pay than is required to get the same return for
shareholders. In this case, the excessive CEO pay would be largely coming at the expense of
shareholders.28
It is debatable whether CEO pay can be justified based on returns to shareholders. Lucien Bebchuk
and Jesse Fried compiled much of the evidence available at the time supporting the case that a large
portion of CEO pay is rents.29 For example, they note research showing that superstar CEOs, those
who win awards or are featured on business magazine covers, get a large pay premium in subsequent
years even though shareholders get below normal returns. CEOs at companies that score highly by
measures of good corporate governance get lower pay than those at companies that score poorly.
27 Bebchek and Fried (2006) 28 Insofar as the rise in CEO pay can be seen as rents coming at the expense of shareholders, one implication would be that
effectively there has been a redistribution of income from wages to profits that is hidden by a portion of corporate profits taking the form of rents earned by top executives. One fact that goes in the opposite direction is the carried interest earned by managers of hedge funds and private equity funds. In the national accounts this would be recorded as capital gains income even though the bulk of it is actually labor income.
29 Bebchek and Fried (2006).
Working Paper: The Upward Redistribution of Income: Are Rents the Story? 14
And, CEO pay responds strongly to factors affecting company profits that can only be viewed as
luck, such as a sharp rise in world oil prices for oil company CEOs.30
If the argument here is correct, that the compensation of CEOs is not justified by their returns to
shareholders, then the main beneficiaries of lower CEO pay would be owners of capital who would
benefit from higher corporate profits and presumably higher share prices.31 This would still be a step
towards a more progressive distribution of income for two reasons. First, while the wealthy own a
hugely disproportionate share of corporate stock, a substantial portion is held by more middle-
income people through retirement accounts or through defined benefit pensions. Almost by
definition, every dollar of excessive CEO pay is going to a person who is in the top 0.01 percent of
the income distribution.
The other reason why increasing profits at the expense of the pay of top executives would reverse
the upward redistribution of income is the spillover effect that lower CEO pay is likely to have on
top management in other sectors. If the pay of CEOs at the largest companies was in the low
millions, instead of the tens or even hundreds of millions, the presidents of universities, or heads of
hospitals and major charities would be less able to demand million dollar pay packages for
themselves. This would have the effect of both freeing up funds for lower paid employees and also
reducing the cost of college and health care, thereby raising real wages of other workers.
If CEOs are earning rents at the expense of shareholders, then the appropriate policies would
involve strengthening the hand of shareholders in containing CEO pay. As it stands, CEO
compensation is determined by corporate boards that are likely to have more allegiance to top
management than the shareholders who they are supposed to represent. This is a failing of the
corporate governance structure. In other countries, there are often long-term investors (often banks)
with major interests in companies that can act to ensure that top management does not gain at the
expense of shareholders. In the United States the largest shareholders are often mutual funds, which
typically act as short-term investors and take little interest in the running of the company.
Top management usually plays a role in selecting directors, who enjoy a rather lucrative position.
Directors typically earn stipends of several hundred thousand dollars a year for attending six to ten
meetings. It is extremely rare for a director to be removed because they allowed the company’s CEO
to be overpaid. By contrast, if a director were to make a point of objecting to a pay increase that her
30 A now somewhat dated analysis found no clear effect on stock prices when CEOs died unexpectedly, for example in a place crash
or heart attack, see Etebari et al. (1987). 31 If this is the case, then there has been an implicit redistribution from labor to capital over the last three decades, but it has been
hidden by the rise in compensation for top executives.
Working Paper: The Upward Redistribution of Income: Are Rents the Story? 15
colleagues had assented to, they could anticipate at the least a serious argument. If they persisted in
pressing their case against an overwhelming majority of the board they could find their future as a
director put in danger.
With this asymmetry in incentives, it should not be surprising that directors are generally happy to
go along with high CEO pay. To bring CEO pay down to more reasonable levels, it would be
necessary to alter the incentive structure for directors. An example of a policy that would change
incentives would be to attach some meaning to the shareholder “Say on Pay” votes that were put in
place as part of the Dodd-Frank financial reform bill. Under the current law, the votes are purely
advisory. It is an embarrassment to a board if shareholders vote no on the CEOs pay package (less
than 3.0 percent lose), but it is has no direct consequence. However, the law could be altered so that
directors would lose their stipend if a compensation package is rejected by shareholders. This risk
would give directors a serious incentive to ensure that their pay package was not excessive.
Whether attaching this sort of directors’ penalty would be sufficient to reverse the upward spiral of
CEO pay would have to be seen, but it is the type of measure that could restore some symmetry to
the incentives directors currently face in determining pay. It is also important to point out in the
context of the larger topic, that setting rules of corporate governance are not government
interference in the market. They are the rules through which the government structures the market,
in the same way that drawing a yellow line in the middle of the road is not an interference with the
flow of traffic. There are already extensive rules on governance, many of which are designed to
protect to the rights of minority shareholders.32 Rules that make it easier for shareholders to protect
against excessive pay for top management would be in the same spirit as the rules that already exist.
They are essentially an adjustment for changes in patterns of share ownership that have made the
old rules inadequate.
It is also possible to envision measures to directly put a check on the pay of top executives at
universities, foundations, and other non-profit organizations. These organizations enjoy tax exempt
status and/or government funding. This means that the government can impose conditions on this
support just as it imposes conditions on the checks received by TANF beneficiaries. One condition
could be a cap on the salaries allowed at these organizations.33 Note that a cap would not prevent
these organizations from paying as much as they want to their top executives. It would only limit
what they could pay if they opted to accept money from the government.
32 This is to protect against the risk of a party getting control of 50.1 percent of shares and effectively expropriated the value of the
minority’s shares. 33 The president of the United States earns $400,000 a year; this would be a reasonable cap for a president at major university or
foundation.
Working Paper: The Upward Redistribution of Income: Are Rents the Story? 16
If checks on the pay of top executives in the corporate world and non-profit sectors reduced their
pay by an average of 50 percent, the savings would have been $70 billion in 2014. If the reduction
had been 75 percent, the savings would have been $105 billion. Even the 75 percent pay cut would
still leave the ratio of CEO pay to median pay in the range of 60 to 1, more than twice the late 1970s
ratio. It is worth noting that this all money taken from the richest one percent of the population,
since by definition these people all fit into this group. It is almost certain that there would be a
substantial spillover effect from the reduction of the pay of top executives in the form of lower pay
for other high level management personal in the corporate sector and a reduction in pay for top
management at hospitals, universities and other non-profits. If this spillover doubles the impact then
the savings would be between $140 billion and $210 billion.
Pay of Professionals The most highly educated professionals, most notably doctors, enjoy far higher pay than their
counterparts in other wealthy countries. This is due to the fact that they have been largely able to
protect themselves from both domestic and international competition. In the United States, doctors’
organizations largely set the rules for determining who can practice as a doctor. They have acted to
restrict both medical school enrollments and the inflow of foreign doctors. They also largely
determine the standards of care, limiting the extent to which other health care professionals can
perform many tasks. They also set standards of care among physicians, determining which
conditions can be treated by a primary care physician and what requires the involvement of a
specialist.
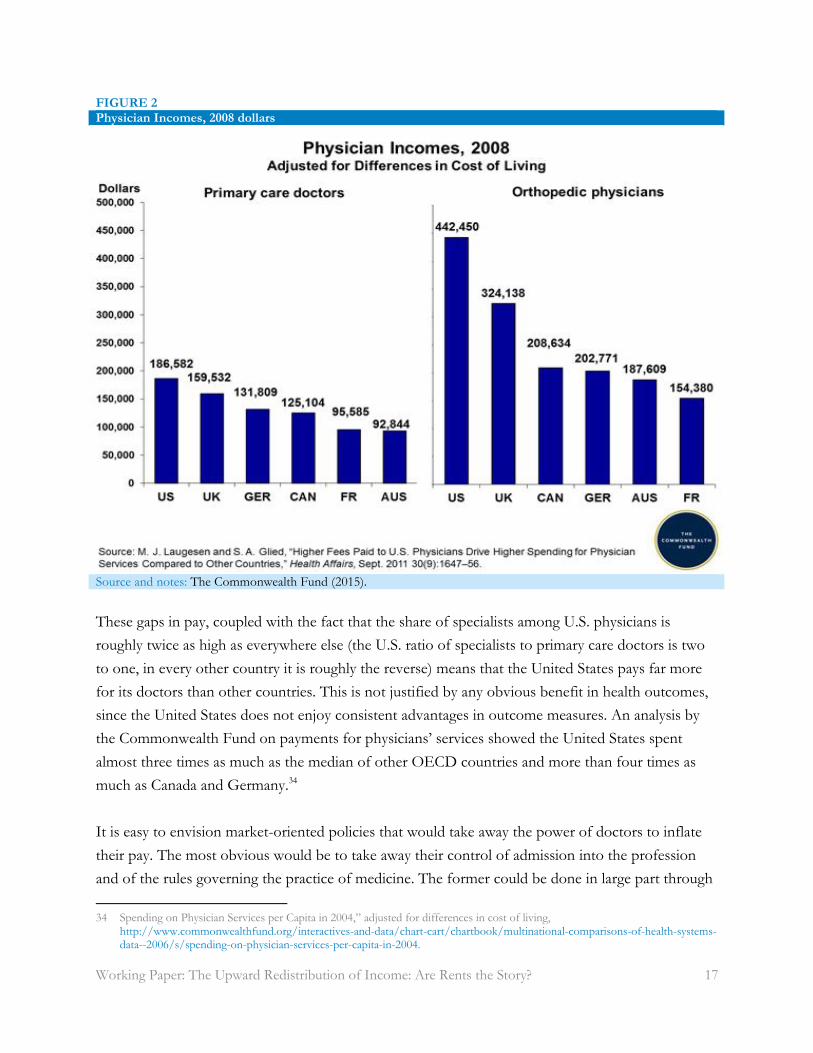
Given this structure of the profession, it is not surprising that doctors in the United States are paid
twice as much on average as doctors in other OECD countries. There is a modest gap among
primary care physicians, but a much larger gap among specialists. For example, a recent study found
that the average annual pay in the United States in 2008 for primary care physicians was $186,600 in
2008. This compared to $125,100 in Canada and $95,600 in France, as shown in Figure 2 (all
numbers are adjusted for purchasing power parity). The gap among specialists is even larger. For
example, orthopedic physicians earned an average of $442,500 in the United States, compared to
$208,600 in Canada and $154,000 in France.
Working Paper: The Upward Redistribution of Income: Are Rents the Story? 17
FIGURE 2
Physician Incomes, 2008 dollars
Source and notes: The Commonwealth Fund (2015).
These gaps in pay, coupled with the fact that the share of specialists among U.S. physicians is
roughly twice as high as everywhere else (the U.S. ratio of specialists to primary care doctors is two
to one, in every other country it is roughly the reverse) means that the United States pays far more
for its doctors than other countries. This is not justified by any obvious benefit in health outcomes,
since the United States does not enjoy consistent advantages in outcome measures. An analysis by
the Commonwealth Fund on payments for physicians’ services showed the United States spent
almost three times as much as the median of other OECD countries and more than four times as
much as Canada and Germany.34
It is easy to envision market-oriented policies that would take away the power of doctors to inflate
their pay. The most obvious would be to take away their control of admission into the profession
and of the rules governing the practice of medicine. The former could be done in large part through
34 Spending on Physician Services per Capita in 2004,” adjusted for differences in cost of living, http://www.commonwealthfund.org/interactives-and-data/chart-cart/chartbook/multinational-comparisons-of-health-systems-
data--2006/s/spending-on-physician-services-per-capita-in-2004.
Working Paper: The Upward Redistribution of Income: Are Rents the Story? 18
trade agreements. Just as there has been an effort to standardize and make transparent a wide range
of safety and consumer rules across countries, there could be an effort to standardize licensing
practices so that foreigners could train to U.S. standards and then be granted the same right to
practice in the United States as any domestically trained doctor.35
Medical travel could also help to reduce the market power of doctors in the United States. Major
medical procedures such as open heart surgery can cost several hundred thousand dollars in the
United States. These procedures can be performed for 10–20 percent of the price in high quality
facilities in India, Thailand, and elsewhere. It is likely that more people would take advantage of the
potential savings if there were a widely accepted accreditation system for foreign facilities and also
clear rules in legal liability. The enormous gap in prices would allow for patients and family members
to travel to these countries and spend time there recovering and still save tens of thousands of
dollars from the cost in the United States. If these savings were shared between patients and third
party payers (insurers or the government) it would provide large incentives for medical travel.36
The potential gain from lowering the pay of doctors and other highly paid professionals is
substantial. In the case of doctors alone, if their pay could be reduced to the average of other
wealthy countries, it would imply an annual savings of more than $100 billion a year.37 According to
a recent study, the average pay of dentists is more than 80 percent of doctors’ pay, although it is
actually slightly higher on an hourly basis.38 There were 147,000 dentists in 2012.39 There were over
700,000 people working as lawyers. If the combined savings from a full opening of these and other
high-paying professions to international competition (e.g. engineers, architects, economists, and
accountants) the total savings to the economy is likely to be at least as large as the savings from
exposing doctors alone to international competition. This implies savings of more than $200 billion
a year. Almost all of this would come from people in the top one percent of households.40
This calculation will have to be refined by further research, but there is no obvious reason that the
35 One issue would be the test-taking process, which can by itself be a substantial barrier. It should be possible to allow testing in
foreign countries (by U.S.-authorized testers) so that foreign students need not endure the expense and risk of testing in the United States.
36 There is a risk that diverting doctors and other health care professionals in developing countries to caring for people in the United States could jeopardize the quality of care in developing countries. This problem could be addressed by a taxing the earnings of foreign trained physicians (in the case of doctors who come into the United States) or taxing the procedures in developing countries. This money could be used to train more doctors and health care professionals, ensuring that developing countries benefit from this trade as well.
37 There are more than 900,000 active physicians in the United States with average pay of more than $250,000 a year. If this was reduced to an average of $130,000, the savings would $108 billion annually. (See Kaiser Family Foundation (2015).)
38 Seabury et al. (2012). 39 BLS (2014). 40 Many of the people in these professionals will not be in the top one percent, but they would only account for a small portion of
the savings, since their pay could not fall by a large amount in absolute terms. For example, if one million professionals who are not in the top one percent saw an average decline in pay of $15,000 a year, this would only come to $15 billion.
Working Paper: The Upward Redistribution of Income: Are Rents the Story? 19
United States should be paying more for its professionals than other wealthy countries. Removing
the protectionist barriers that have been put in place over the decades should bring them more
closely into line. The resulting reduction in the price of the services they provide will lead to a
substantial improvement in living standards for the other 99 percent of the population.
Conclusion: Markets Can Be Progressive This paper outlines four major areas in which markets can be restructured in ways that help to
reverse the upward redistribution of the last three and a half decades. In each area there are
substantial rents that now accrue to people at the top end of the income distribution that could be
taken away with a different structure of the market.
While the potential gains in each area are large, the cumulative effect of acting in all four areas would
be even larger than simply the sum of the gains. The reason is that the cumulative effect on the labor
supply for high income earners is likely to put further downward pressure on their wages. If
potential doctors no longer have the option to make large salaries as Wall Street traders or private
equity fund managers, then they lose well-paying alternatives to being a physician. In the same vein,
scaling back patent and copyright protections, as well as eliminating loopholes in the tax code, will
substantially reduce the amount of work in areas that are very lucrative for lawyers.
It will take further research to refine these estimates and better outline alternative structures, but it
should be evident that a considerable amount of money is at stake from reducing or eliminating the
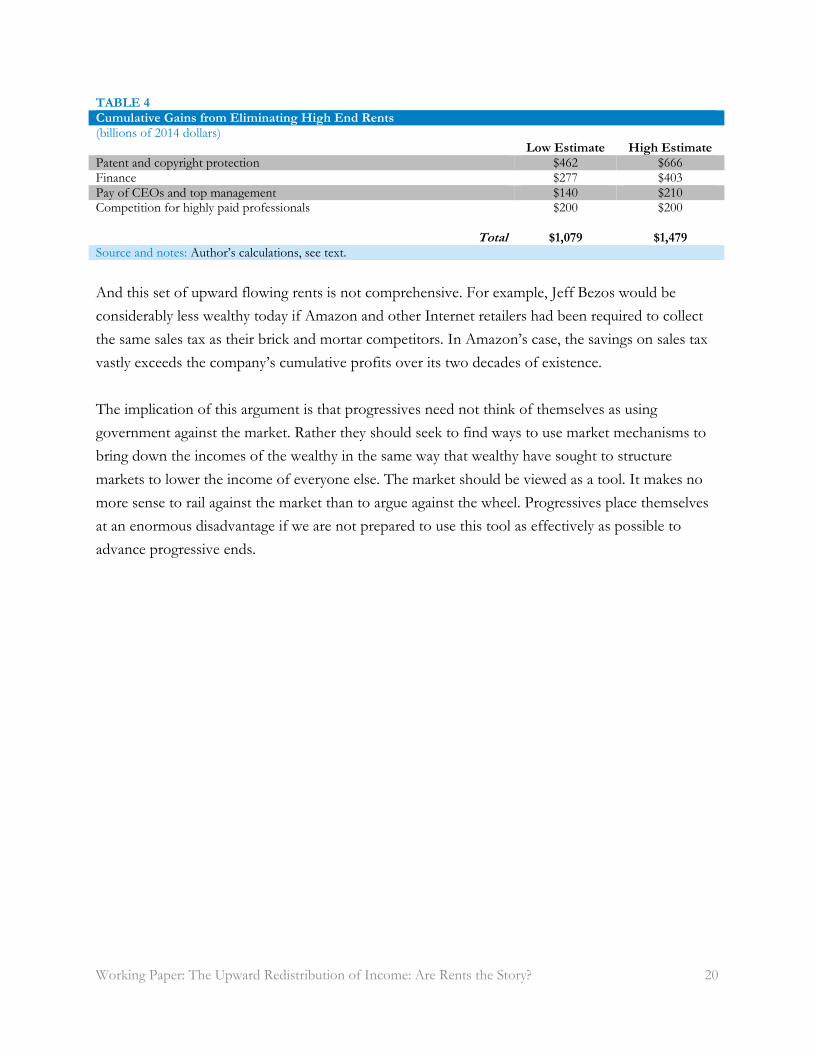
rents outlined in this paper. Table 4 sums the projected savings from the four categories of rents
outlined in the paper. The totals range from $1,080 billion using the low-end estimates and $1,480
billion using the high-end estimates, between 6.2 and 8.5 percent of GDP in 2014. The high-end
estimate is roughly equal to the rise in the share of income that has gone to the richest one percent
of households between 1979 and 2012.
Working Paper: The Upward Redistribution of Income: Are Rents the Story? 20
TABLE 4
Cumulative Gains from Eliminating High End Rents
(billions of 2014 dollars) Low Estimate High Estimate
Patent and copyright protection $462 $666 Finance $277 $403 Pay of CEOs and top management $140 $210 Competition for highly paid professionals $200 $200
Total $1,079 $1,479
Source and notes: Author’s calculations, see text.
And this set of upward flowing rents is not comprehensive. For example, Jeff Bezos would be
considerably less wealthy today if Amazon and other Internet retailers had been required to collect
the same sales tax as their brick and mortar competitors. In Amazon’s case, the savings on sales tax
vastly exceeds the company’s cumulative profits over its two decades of existence.
The implication of this argument is that progressives need not think of themselves as using
government against the market. Rather they should seek to find ways to use market mechanisms to
bring down the incomes of the wealthy in the same way that wealthy have sought to structure
markets to lower the income of everyone else. The market should be viewed as a tool. It makes no
more sense to rail against the market than to argue against the wheel. Progressives place themselves
at an enormous disadvantage if we are not prepared to use this tool as effectively as possible to
advance progressive ends.
Working Paper: The Upward Redistribution of Income: Are Rents the Story? 21
References Appelbaum E. and R. Batt. 2014. Private Equity at Work: When Wall Street Manages Main Street. New
York: Russell Sage Foundation. Baker, D. 2004. “Financing Drug Research: What Are the Issues?” Washington, D.C.: Center for
Economic and Policy Research. http://www.cepr.net/documents/publications/intellectual_property_2004_09.pdf.
Baker, D. 2003. “The Artistic Freedom Voucher: An Internet Age Alternative to Copyrights.”
Washington, D.C.: Center for Economic and Policy Research. http://www.cepr.net/publications/reports/the-artistic-freedom-voucher-internet-age-alternative-to-copyrights.
Baker, D. and J. Bernstein, 2013. Getting Back to Full Employment: A Better Bargain for Working People.
Washington, D.C.: Center for Economic and Policy Research. http://www.cepr.net/documents/Getting-Back-to-Full-Employment_20131118.pdf.
Baker, D, R. Pollin, T. MacArthur, and M. Sherman, 2009. “The Potential Revenue From Financial
Transactions Taxes,” Washington, D.C.: Center for Economic and Policy Research. http://www.cepr.net/documents/publications/ftt-revenue-2009-12.pdf.
Bakija, J., A. Cole, and B. Heim. 2012. “Jobs and Income Growth of Top Earners and the Causes of Changing Income Inequality: Evidence from U.S. Tax Return Data.” Manuscript, Williams College. Bebchuk, L. and J. Fried, 2006. Pay Without Performance: The Unfulfilled Promise of Executive Compensation. Cambridge, MA: Harvard University Press. Bureau of Economic Analysis (BEA). 2015. “National Economic Accounts.” Washington, D.C.:
BEA. http://www.bea.gov/national/. Bureau of Labor Statistics (BLS). 2014. “Occupational Outlook Handbook: Healthcare, Dentists.”
Washington, D.C.: BLS. http://www.bls.gov/ooh/healthcare/dentists.htm. Burman, L., w. Gales, S. Gault, B. Kim, J. Nunns, and S. Rosenthal, 2015. “Financial Transactions
Taxes in Theory and Practice,” Washington, DC: Tax Policy of the Urban Institute and the Brookings Institution. http://www.taxpolicycenter.org/UploadedPDF/2000287-Financial-Transaction-Taxes-in-Theory-and-Practice.pdf.
Centers for Medicare and Medicaid Services (CMS). 2014. “National Health Care Expenditures
Historical Data for 2013.” Woodlawn, Maryland: CMS. https://www.cms.gov/Research-Statistics-Data-and-Systems/Statistics-Trends-and-
Working Paper: The Upward Redistribution of Income: Are Rents the Story? 22
Reports/NationalHealthExpendData/Downloads/Tables.zip. Davis and Mishel. 2014. “CEO Pay Continues to Rise as Typical Workers Are Paid Less.”
Washington, D.C.: Economic Policy Institute. http://www.epi.org/publication/ceo-pay-continues-to-rise/.
Etebari et al. 1987. “To Be Or Not to Be—Reaction of Stock Returns to Sudden Deaths of
Corporate Chief Executive Officers.” Journal of Business Finance & Accounting, Vol. 14, No. 2, pp. 255–278.
Federal Reserve Board of Governors (Federal Reserve Board). 2015. “Financial Accounts Guide.”
Washington, D.C.: Federal Reserve. http://www.federalreserve.gov/apps/fof/FOFTables.aspx.
Government Accountability Office, 2014. “Large Bank Holding Companies: Expectations of
Government Support,” United States Government, Government Accountability Office, July 2014, 14-612.
International Monetary Fund, 2014. “How Big Is the Implicit Subsidy for Banks Considered Too
Big to Fail?” 2014 Global Financial Stability Report, Chapter 3. Washington, DC: International Monetary Fund.
Kaiser Family Foundation. 2015. “Total Professionally Active Physicians.” Washington, D.C.: Kaiser
Family Foundation. http://kff.org/other/state-indicator/total-active-physicians/. Lanjouw, Jean O., Ariel Pakes, and Jonathan Putnam. 1998. “How to Count Patents and Value
Intellectual Property: The Uses of Patent Renewal and Application Data.” The Journal of Industrial Economics, Vol. 46, No. 4, pp. 405-432.
Munnell et al. 2011. “A ROLE FOR DEFINED CONTRIBUTION PLANS IN THE PUBLIC
SECTOR." Chestnut Hill, MA: Trustees of Boston College, Center for Retirement Research. http://crr.bc.edu/wp-content/uploads/2011/04/slp_16-508.pdf.
National Academy for Social Insurance. 1998. Evaluating Issues in Privatizing Social Security: Report of the
Panel on Privatization of Social Security. Washington, D.C.: National Academy of Social Insurance.
National Association of Chain Drug Stores. 2010. NACDS Foundation Industry Profile, Alexandria,
VA: NACDS Foundation. Orszag, Peter R., and Joseph E. Stiglitz. 2001. Rethinking Pension Reform: Ten Myths About Social
Security Systems. In New Ideas About Old Age Security: Toward Sustainable Pension Systems in the 21st Century, eds. Robert Holzmannand Joseph E. Stiglitz, 17-56. Washington, D.C.: World Bank.
PhRMA. 2015. 2015 Profile Biopharmaceutical Research Industry. Washington, DC: Pharmaceutical
Research and Manufacturers of America.
Working Paper: The Upward Redistribution of Income: Are Rents the Story? 23
Prequin. 2014. “2014 Preqin Global Private Equity Report.” London, UK: Prequin. https://www.preqin.com/docs/samples/The_2014_Preqin_Global_Private_Equity_Report_Sample_Pages.pdf.
Saez, Emmanuel. 2015. Updated Tables for "Income Inequality in the United States, 1913-1998"
with Thomas Piketty, Quarterly Journal of Economics, 118(1), 2003, 1-39. http://eml.berkeley.edu/~saez/TabFig2014prel.xls.
Seabury et al. 2012. “Trends in the Earnings of Health Care Professionals in the United States, 1987-
2010.” The Journal of the American Medical Association, Vol. 308, No. 20, pp. 2083–2085. http://jama.jamanetwork.com/article.aspx?articleid=1456053.
Stiglitz, J. and A. Jayadev. 2010. “Medicine for Tomorrow: Some Alternative Proposals to Promote
Socially Beneficial Research and Development in Pharmaceuticals,” Journal of Generic Medicines Vol. 7, 3, 217–226. https://www0.gsb.columbia.edu/faculty/jstiglitz/download/papers/2010_Medicine_For_Tomorrow_pub.pdf.
The Commonwealth Fund. 2015. “Spending on Physician Services per Capita in 2004.” New York,
NY: The Commonwealth Fund. http://www.commonwealthfund.org/interactives-and-data/chart-cart/chartbook/multinational-comparisons-of-health-systems-data--2006/s/spending-on-physician-services-per-capita-in-2004.
Thrift Savings Plan, 2015. “Administrative Expenses.”
https://www.tsp.gov/planparticipation/administrative/administrativeExpenses.shtml. Woolhander et al. 2003. “Costs of Health Care Administration in the United States and Canada.”
New England Journal of Medicine, Vol. 349, pp. 768–775.