Embed Size (px)
Citation preview

NBER WORKING PAPER SERIES
ANTI-DISCRIMINATION OR REVERSE DISCRIMINATION:THE IMPACT OF CHANGING DEMOGRAPHICS,
TITLE VII AND AFFIRMATIVEACTION ON PRODUCTIVITY
Jonathan S. Leonard
Working Paper No. l2O
NATIONAL BUREAU OF ECONOMIC RESEARCH1050 Massachusetts Avenue
Cambridge, MA 02138November 1983
I thank Richard Freeman and Zvi Griliches for their advice. I alsothank Chris Maxwell, Charles Brown and the referees for their use-ful comments, and the Harvard—M.I.T. Joint Center for Urban Studiesfor support of this research through a Stouffer Fellowship. Theresearch reported here is part of the NBERVs research program inLabor Studies. Any opinions expressed are those of the author andnot those of the National Bureau of Economic Research.

NBER Working Paper #1240November 1983
Anti—Discrimination or Reverse Discrimination:The Impact of Changing Demographics, Title VII and
Affirmative Action on Productivity
ABSTRACT
Opponents of the integration by race and gender of the American workplace have argued that forced equity will entail reduced productivity asemployers are forced to hire lower quality females and minorities. Thenumerous wage equation studies always reach the same dead-end: residualdifferences across race or gender are due either to discrimination or tounobserved quality differences. This study takes a new approach, anddirectly estimates over time the ratio of minority to white male, and offemale to white male productivity, using a new two-digit SIC industry bystate production function data set for 1966 and 1977. The major finding isthat there is no significant evidence that the productivity of minoritiesor females decreased relative to that of white males as relative minorityand female employment increased during the 1960's and 1970's. This studyalso presents evidence that Title VII litigation has played a significantrole in increasing black employment. This suggests that the employment ofminorities and females has not entailed large efficiency costs, and thatTitle VII litigation has had some success in fighting racial discrimina-tion. Direct tests of the impact of Title VII litigation and affirmativeaction regulation also find no significant evidence that these policieshave contributed to a productivity reduction.
Jonathan S. Leonard350 Barrows HallSchool of Business AdministrationUniversity of CaliforniaBerkeley, California 94720
(415) 642-7048

The EEOC has sometimes been credited with opening up new pools of labor that corpora-
tions somehow contrived to ignore, and occasionally with hastening the breakdown of tradi-
tional barriers to labor mobility . . . But in the context of the market's endless search for
efficiency, these anomalies would have been eliminated anyway, leaving only the question of
whether they were worth the expenditure compelled by law. Affirmative action is a net cost
to the economy. . . . And the true dynamic effects - the opportunity cost of all this expense
and effort, the diminuation of competition, inefficiencies due to the employment and promo-
tion of marginal labor and the consequent demoralization of good workers — can only be a
matter of conjecture, although they are clearly the most important of all.
-- Senator Orrin Hatch, 1980
The last two decades have witnessed a massive influx of minorities and females into the manufac-
turing sector. Between 1966 and 1978 the number of women employed in manufacturing rose by 32
percent, and the number of blacks and Hispanics by 82 percent, while total employment increased by
only 10 percent. This paper seeks to answer three questions. First, in promoting this influx, what have
been the respective roles of affirmative action and of federal anti-discrimination law under Title VII of
the Civil Rights Act of 1964? Is affirmative action still effective when Title VII pressure is controlled
for? Second, has employment discrimination decreased, or shifted to the extent that there is now evi-
dence of reverse discrimination? Third, what effect has the influx had on productivity? In particular,
has the manufacturing sector been able to employ more minorities and women without a decline in
their productivity relative to that of white men?
Between 1965 and 1977 the Federal District Courts decided more than 1,700 class action suits
brought under Title VII of the Civil Rights Act of 1964. This paper will present the first evidence of
the impact of this largely private Title VII litigation on the employment of minorities, and of the rela-
tive importance of Title VII and Executive Order 11246.
The integration of the American workforce, by race and gender, has been among the most far-
reaching and controversial goals of domestic policy in the past two decades. Opponents of this goal
-2-
have argued that integration can only be achieved at great cost in terms of reduced productivity and
profits, that forced equity will entail reduced productivity. However, productivity has proved difficult to
measure. Economists have developed a large and refined body of research on racial wage differentials.
This approach will not easily detect discrimination on the basis of racially correlated, but facially neutral
criteria, such as education.1 Moreover, after considerable efforts to correct for the quality or ability of a
worker, these wage equation studies always conclude that the remaining racial wage differential is due
either to discrimination or to unobserved quality differences. In this sense such studies have reached a
dead end.
This paper will approach the question of discrimination from a fresh angle. Productivity will be
measured not through indirect indices such as earnings or education, but by measures of worker output.
I will directly estimate over time the ratio of minority to white, and of female to male productivity.
Both the changes in these ratios over time, and their comparison with earnings ratios, will have impor-
tant implications concerning the extent of discrimination.
The following section will analyze the changing distribution of minorities and females, and present
evidence of the role of Title VII in promoting members of protected groups. Section 2 will describe a
simple model of discrimination, a technique for estimating relative marginal products, and a new state
by 2-digit SIC industry data set to be used in estimation. The estimated relative marginal products will
be discussed in Section 3, and compared to relative wages. This section will also consider the implica-
tions of these results for the issue of reverse discrimination and the induced productivity effects of
employment regulation. Since the empirical work here is based on highly aggregated data the infer-
ences drawn here are by nature tentative. This is the initial, not the final, word on this issue.
-3-
Section 1: The Impact of Anti-Discrimination Policy on Work-Place Demographics
The last two decades have witnessed an influx of minorities and women into the manufacturing
work force, and the concurrent growth of government anti-discrimination policy. In this section I shall
examine the changing distribution of minorities and females in manufacturing, and the extent to which
government policy has directly affected this distribution. Government policy has been established
through Executive Order 11246 which mandated affirmative action for federal contractors, and through
the Civil Rights Act of 1964, which established the Equal Employment Opportunity Commission
(EEOC) and provided the basis for private litigation under Title VII, which outlawed employment
discrimination.
The results in this section are based on a sample of 555 state by 2-digit S.I.C. industry cells within
manufacturing with data from the 1966 and 1978 EEOC Reports. The data is assembled from Equal
Employment Opportunity forms which must be filed by all establishments with more than 24 employees
affiliated with companies with more than 99 employees, or more than 50 employees and a government
contract of $50,000 or more. Flow representative is this sample? A comparison with the B.L.S.
Employment and Earning for March 1978 shows that 74.1% of all manufacturing employees are
reported on EEO-1 forms. Employers with small or temporary workforces are underrepresented.2
Both minority and female employment in manufacturing have shown marked growth. In 1964,
only 8% of manufacturing workers were non-white males, 26% were female. By 1978 the proportion
non-white male had increased to 11%, while the proportion female had grown to 31%. The bulk of this
increase occurred in the clerical and blue-collar occupations (see Table 1). The greatest percentage
increases occurred among professionals and managers, but this accounts for relatively few people.
Between 1966 and 1977 the number of non-white male blue-collar workers increased by nearly half,
until they accounted for 14% of the blue-collar workers. Most of the incoming females entered tradi-
tional jobs in the clerical occupations, increasing their proportion from 48 to 58 percent.
The white-collarization of manufacturing is also apparent in Table 1. This increase in the white-
collar proportion of the workforce may have played some role the recent decline in the growth rate of
productivity. While blue-collar workers have fallen from 72 to 69 percent of the workforce, profes-

-4.
sional and managerial workers have increased from 11 to 15 percent of all workers in manufacturing.
Anti-discrimination law and affirmative action regulation are often thought of as bringing pressure
to bear on firms with few minority or female employees relative to the industry and region average. If
this is the case, we would expect enforcement of Title VII and of Executive Order 11246 to reduce the
variance of minority and female representation. I find, however, that the standard deviation across
state by industry cells of the percent of white-collar, managerial, or blue-collar workers who are minor-
ity or female did not, in general, fall from 1966 to 1977. This finding, coupled with the increase in the
means, is consistent with an enforcement effort that brings direct pressure to bear on only a few firms,
and not necessarily those with the fewest minorities or females.3
The Civil Rights Act of 1964 must get some of the credit for increasing opportunities for minori-
ties and females.4 Class action suits under Title VII of this Act are likely to have been among the most
powerful prods to increasing minority and female employment.5
The major contribution of the EEOC, which oversees Title VII enforcement, has probably been in
helping to establish far-reaching principles of Title VII law in the courts which can then be used by
private litigants, rather than in directly providing relief from systematic discrimination through its own
enforcement activity. A 1976 General Accounting Office review of direct EEOC enforcement activity
concluded that it was generally ineffective. Most individual charges were closed administratively before
a formal investigation. Charges took about two years to be resolved, and only 11 percent resulted in
successful negotiated settlements. There was little EEOC followup to ensure compliance with concilia-
tion agreements, and entering into a conciliation agreement caused no significant change in a firm's
employment of blacks or females. Between 1973 and 1975, among 12,800 charges for which the EEOC
found evidence of discrimination and was unable to negotiate settlements, fewer than 1 percent had
been brought to litigation resulting in favorable court decisions.6 Between fiscal years 1972 and 1976 the
EEOC brought 462 cases to court.7 The much publicized charges brought by the EEOC against AT&T,
GM, Ford, Sears, GE and the IBEW in the early seventies were largely anomalous. This major legal
and public relations offensive was atypical of the Commission, which has normally been a reactive body
slowly working its way through a mountain of individual complaints, many of which it discards as lack-

-5-
ing substance.8
Between 1964 and 1981 more than 5000 cases of litigation under Title VII, many of which were
private suits, were decided in the Federal District courts. More than 1,700 of these were class action
Suits. These are the tip of an iceberg consisting of cases settled out of court, or decided in state courts,
but these class action decisions are likely to generate the most publicity, result in the largest awards,
and affect the most people. What has been the impact of this Title VII class action litigation?
The enforcement of Title VII through the courts has contributed to a significant improvement of
the employment and occupational status of blacks. In regressions of the change in the percentage of
workers in an occupation who are members of a protected group on number of Title VII class action
suits per corporation, percentage of employment in an industry by state cell that is in federal contractor
establishments under the affirmative action obligation, and a lagged dependent variable, Title VII litiga-
tion leads to sometimes negative but generally insignificant changes for white females, but to a
moderate and significant improvement in the employment of blacks.9 Table 2 presents the regression
results, and Table 3 summarizes the impact of Title VII litigation. In these tables Title VII litigation
plays a significant role in increasing blacks' employment share.
For example, between 1966 and 1978 the proportion of all workers in manufacturing who were
black increased from .08 to .12. On average, a Title VII class action suit per corporation raises this pro-
portion by .277. Since there were an average of .011 such suits per corporation in a state by industry
cell, about 7 percent of the improvement in black employment share can be attributed directly to Title
VII litigation. The impact is even more pronounced for black females. This counts only the direct
effects of litigation on firms in the same industry and state. In particular it does not count the spillover
effects onto firms in other industries and states from establishing credible threats and wide-ranging legal
precedents. In fact, the greater such spillover, the less the differential impact of Title VII estimated
here.
The proportionate impact of Title VII litigation is summarized in Table 3. This litigation has had
its strongest impact in the white-collar occupations. Black gains through Title VII have been most strik-
ing in professional and management positions, suggesting that Title VII litigation has created pressure

-6-
for occupational advancement as well as employment.10
Title VII litigation plays a significant role even when concurrent affirmative action pressure under
Executive Order 11246, the effect of which has already been established11, is controlled for. In previ-
ous discussions of establishment level results, the possibility was raised that the observed impact of
affirmative action might be exaggerated because it included part of the impact of the omitted Title VII
variable. There is little evidence here to support this omitted variable bias conjecture. Across state by
industry cells, the correlation between Title VII suits and contractor status weighted by employment is
only .19. While this does not speak directly to the issue of covariance at the establishment level, it is
unlikely that the contractor effect found in previous work is really a Title VII effect. Of course, this is
not to deny the probable indirect effects of Title VII in advancing affirmative action under Executive
Order 11246. In detailed establishment level tests in other work I find that affirmative action works in
complicated ways, and that establishment growth and composition also have significant impacts on pro-
tected group employment. The results in Table 2 are at a much higher level of aggregation in which
these important control variables are omitted. In their absence, affirmative action still increases black
employment, but the effect is not as large or significant. The impact is larger for black females, and in
white-collar occupations.
Considering the level of aggregation, and the omitted complex interactions, the relatively small
impact of affirmative action is not surprising. If similar omitted variable and aggregation biases are at
work, the relatively large impact of Title VII is even more striking. The advantage of aggregation to the
state by industry level is that it may reveal something about spillover. Suppose contractor establish-
ments increased their employment of minorities and females by hiring them away from non-contractor
establishments in the same industry and state. In this inelastic supply case, total minority and female
employment within a state by industry cell need show no relation to the prevalence of contractors in a
cell. Such negative spillover may help explain the relatively small impact of affirmative action in the
aggregated sample. In contrast, while affirmative action regulation applies only to federal contractors,
Title VII law applies to nearly all employers with at least 15 employees, so the likelihood of such nega-
tive spillover is correspondingly diminished. When the analysis is replicated with disaggregated data at

-7-
the company level between 1974 and 1980, both Title VII and affirmative action have strong and
significant effects on the employment of black males.
We have seen the absolute numbers of minorities and females increase rapidly in clerical and blue
collar jobs in manufacturing. And while few women or minorities are employed as managers or profes-
sionals, their proportional representation in these occupations has more than doubled for women, and
quadrupled for minority men. Government policies, through the enforcement of anti-discrimination
and affirmative action laws, have played a significant role in increasing employment opportunities for
blacks, although the same policies appear ineffective in shifting the demand for females. In the next
section we turn to the question of whether the integration of the workforce has had significant produc-
tivity costs.
Section 2: The Framework for Measuring Employment Discrimination
Opponents of civil rights and affirmative action have argued that employers were discriminating on
the basis of merit, not on the basis of race or gender. If their contention is correct, then government
policies that favor the hiring and promotion of minorities and women should cause a decline in their
relative productivity. Equal pay restrictions will compound the inefficiency.12 The hypothesis inherent
in this argument and to be tested in the following sections is that the relative marginal productivities of
minorities and females have declined as their employment has increased, and has not moved toward
equality with relative wages.
The Model
To clarify the issues to be resolved, we use a simple model of discrimination of the type originally
proposed by Becker. As is well known, such models cannot support an equilibrium with persistent
discrimination, absent an ongoing flow of people with wealth to spend on discrimination. We assume
competition weeds out the unprofitable discriminators slowly, so at any point in time we can observe a
temporary equilibrium with discrimination in which firms are slowly running down their wealth.
Assume there are two types of firms, distinguished by whether or not they discriminate. The
firms that discriminate against blacks will hire them only at a rate of pay below their marginal product.

-8-
If we observe that the ratio of black to white marginal products is greater than the ratio of black to
white wages, we infer discrimination against blacks. The extent of the divergence is a measure of the
prevalence and intensity of discrimination.
Let firms produce output Y from capital K and labor L of two colors: A and B.
Y= ealKa2(LA + CLB)a (1)
We assume labor of type A is a perfect substitute for labor of type B except for a scaling factor C,
the ratio of marginal product of B to A. We shall relax this restriction in later empirical work.
A non-discriminating firm taking the prices of labor WA and WB as given will hire labor to satisfy
the first order conditions for profit maximization:
C=--- (2)
Where C is the ratio of the marginal product of labor of type B to that of type A. Corner solutions are
readily obtained.
A discriminating firm is assumed to maximize a utility function separable in profits ir,
U=ir—dLfi (3)
where d is an index of the taste for discrimination. Solving the first order condition for utility maximi-
zation yields
WB+d(4)
WA
If both types of firms hire in the same labor markets, a temporary equilibrium will be at
WB = CWA — d, where d now measures both the intensity and the prevalence of discrimination.
Mobile labor will enforce the constancy at the margin of d across markets.
It is crucial to realize that what distinguishes the color and gender blind from the discriminator in
this model is the divergence of relative productivity from relative wage at the firm's optimum.13 We
shall measure both the levels and the change in that divergence.
We can also make inferences concerning discrimination by comparing the change in relative pro-
ductivity over time with the change in other indicators of ability, such as relative education. If the
measured relative productivity of minorities and females has increased more than their relative ability,

-9-
then we are led to suspect a diminution of past discrimination.
Estimation
The effect of the changing race and gender composition of the work force on productivity can be
estimated using production-function techniques similar to those which have been used to investigate
the effect of differences in worker quality (Griliches, 1967) and of unionization (Brown and Medoff,
1978) on output.
We begin with a modified Cobb-Douglas production function, which in logarithms can be thought
of as a first-order approximation to a more general production function.
y e"' KBI (LWM + CILRM + C2LF)B2 (5)
where Y is output, K is capital, L1 is white-male labor, LRAI is non-white male labor, and LF is
female labor. The D are a vector of regional and industry dummy variables.
The parameters C1 and C2 reflect differences in the productivity of non-white male to white male
and of all female to white male labor respectively; females being C2 times as productive as white males.
Because of their relatively small numbers in manufacturing, we must group white and non-white
females together. We assume that non-white male labor and female labor are both perfect substitutes
for white-male labor, except for the scaling factors C1 and C2, which are the ratios of marginal pro-
ducts. We relax this restriction to perfect substitutes in the trans-log production functions presented
later.
Let L LW( + LRJI1 + LF
— LRAI
L
Factoring out L from equation (5) we find:
y e'' KBI LP2 (1 + (C1 —1) P1 + (C2 — 1)P2) (6)
Taking natural logarithms:
In Y cx1D1 + B1 /nK+B2jnL+B2!p,[1+(C3—1)p1-l-(C2—1)P2] (7)

- 10 -
Applying the Taylor series approximation that ln(1 +x) is approximately equal to x for x < 1 yields:
In Y= a,D1 + B1InK+B2InL+B2(Ci—l)Pi+B2(C2—l)p21 (8)
which is our basic estimating equation.
The error of approximation goes to zero as P1 and P2 go to zero, and as C1 and C2 go to 1. In
other words, for work forces with small proportions of black and female workers or with small
differences in productivity across groups the error will be small. Under the hypothesis that there is no
productivity differential across groups, the approximation is exact.
Equation (8) is the key relationship to be estimated here. The productivity differential C1 is
identified as one plus the ratio of the coefficient on P1 to the coefficient on L. This yields productivity
differentials between minority and white males, and between females and white males, controlling for
occupational distribution and industry and regional characteristics.
With data from two years we can pool cross-sections to get more accurate estimates of the average
productivities across time, and of the change in production over time. For the first we estimate:
LlnY,=BAlnX, (9)
where X, is the vector of inputs into the production function. This specification assumes constant elas-
ticities, B, over time.
For the second we estimate the equation:
In Y — In }' = B1InX1 — B,_1lnX1 (10)
This specification allows us to difference out any unobserved industry by state specific constants with
stable impact over time, without imposing the restriction of constant elasticities over time on the vari-
ables of interest.
Data
The model will be estimated for 1966 and 1977 at the state by 2-digit S.I.C. industry level of
aggregation in manufacturing.14 This required the formation of a new data-set, merging data from
Census of Manufactures, Annual Survey of Manufacturers, Equal Employment Opportunity Commis-
sion Reports, and B.L.S. input-output studies. A description follows of the construction of the major
variables. Capital, materials, and outputs are expressed as the natural logarithms of thousands of 1972

— 11 —
dollars per establishment. Labor is measured in the natural logarithm of thousands of hours worked
per year per establishment.
Capital
For this study a new consistent measure of real capital stock by state by industry was created.
Using the perpetual inventory technique, the B.L.S. developed net capital stock measures by 2-digit
industry nationally in 1972 prices. I allocated this net real stock of capital by industry for 1964 across
states according to each state's share of 1964 book-value of capital. For example, if Ohio accounted for
10% of the book value of capital in the food industry in 1964, it was allocated 10% of total 1964 real
depreciated capital. The 1964 A.S.M. contains data on capital rentals and book value of owned capital
by industry by state. The rental payments are capitalized at 10% and added to user owned capital to
arrive at total book value.
To arrive at real capital stock in other years, the 1964 starting value is depreciated by an industry
and year specific depreciation rate, and real investment by state by industry is added. The depreciation
rate is the weighted average of the industrial buildings rate of 3.61 and the industrial equipment rate of
12.25 given by Hulten and Wykoff (1981). The weights are the annual shares in national real net capi-
tal of plant and equipment, by industry, as measured by the B.L.S.
Investment by state by industry is from the A.S.M. or C.O.M., and is deflated by the industry and
year specific price index (1972 = 1.0) for gross-investment implicit in the B.L.S. historical and constant
dollar gross-investment series.
Value Added
Value added, is from the 1966 A.S.M. and the 1977 C.O.M. It is expressed in 1972 prices, using
the G.N.P. implicit price deflator. I assume that discriminating and non-discriminating firms compete in
the same product markets, so that the impact of demographics on value-added can be interpreted as a
productivity effect rather than a price effect.

12 -
Labor
Total labor inputs by industry by state in yearly hours for production workers and in bodies for
non-production workers are available from the 1966 A.S.M. and the 1977 C.O.M. Non-production
workers are roughly assumed to work 2,080 hours yearly.15 The proportion blue-collar is the ratio of
reported production workers hours to constructed total hours.
The 1966 and 1978 EEOC Reports on Minority and Female Employment provided data on the
demographic composition of the work force by industry by state. In 1978 I grouped Asians and Native
Americans with whites so as to be consistent with the EEOC's 1966 grouping. The percent non-white
is the percent of male workers who are black or Hispanic.16 Females of all races have been grouped
together because of their relatively small numbers.
Section 3: Estimated Productivity Differentials
Relative minority and female productivity increased between 1966 and 1977, a period coinciding
with government anti-discrimination policy to increase employment opportunities for members of these
groups. There is no significant evidence here to support the contention that this increase in employ-
ment equity has had marked efficiency costs. The relative marginal productivities of minorities and
women have increased as they have progressed into the work force suggesting that discriminatory
employment practices have been reduced.
In separate cross section regressions in 1966 and 1977 of value added on capital, total labor, per-
cent non-white male and percent female, controlling for percent blue-collar, industry and region (Table
4) only the coefficient on percent non-white male in 1966 is significantly negative. At the 95%
confidence level we cannot say non-white males were less productive than white males in 1977, or that
females were less productive than non-white males in 1966 or 1977. The point estimates indicate that
non-white males were .68 times as productive as their white counterparts, and that females were .75
times as productive as white males in 1966. As equation (2) of Table 4 shows, both these ratios had
increased by 1977, to .71 and 1.01 respectively. On their face, these numbers suggest increases in the
productivity of protected groups, particularly females, as the work force has been integrated. However,
this increase in productivity is not very significant. For example, in the case of females the estimated

- 13 -
ratios of marginal products, C, is identified as (BF/BLJ!)+1. Taking the covariance structure of the
estimated coefficients into account in constructing the confidence interval, the estimated Bjj1 decreases
by .27 standard errors when BE increases by one. Using this technique, as BF varies by 2 standard
errors, the ratio of marginal products varies from .44 to .91 in 1966, and from .66 to 1.38 in 1977. For
non-white males, the intervals are .41 to .95 in 1966, and .42 to 1.01 in 1977. The width of this
confidence interval makes strong policy conclusions questionable, since the ratios of marginal products
are not precisely measured.
Comparing these estimated productivity ratios with wage ratios, we find stronger evidence of
gender discrimination than of racial discrimination. From the 1968 and 1978 Current Population Sur-
veys I obtained the yearly earnings of full-time full-year workers in manufacturing. Over this time
period, the earnings ratio of black to white males increased from .69 to .73 while the ratio of female to
white male earnings increased slightly from .53 to .54. Wage ratios show similar patterns.17 Across
races, the earnings ratios do not differ significantly from the productivity differentials. Across sexes, in
1977, the earnings ratio is significantly less than the productivity ratio. The stability of the female to
male wage ratio contrasts with the estimated increase in relative productivity, and suggests women have
been able to increase their employment in manufacturing in part by accepting wages below their margi-
nal products. Again, I stress that these comparisons are only suggestive in light of the imprecision of
the estimated relative productivities.
The general results found above are not dependent upon the assumption that workers of all races
and both sexes are perfect substitutes, nor are they dependent upon the assumption that the elasticity
of output with respect to capital is constant across industries. I dispense with both of these simplifying
assumptions in Table 6, in which a partial trans-log production function is estimated in which capital is
interacted with industry dummies. This specification places no restrictions on the elasticity of substitu-
tion between types of labor, or on capital's share of output by industry.18 The sample means and stan-
dard deviations are reported in Table 5.
The estimated elasticities of substitution, a , are closer to one than to infinity, but this matters lit-
tle for the estimated marginal products. Between white males and non-white males a-drops from 1.11
4*
- 14 -
in 1966 to .69 in 1977. Between white males and females o- declines slightly from .65 to .61. As the
skills and training of females and non-whites approximated those of white males, one would have
expected these elasticities of substitution to increase. These elasticities are all calculated at sample
means, controlling for occupational distribution.19
In the trans-log specification, between 1966 and 1977, the ratio of non-white male to white male
productivity increased from .49 to .62. Over the same period, the ratio of female to white male produc-
tivity increased from .92 to 1.10. Compared to the results obtained assuming perfect substitutes, the
ratio of non-white male to white male productivity starts at a lower level but increases more, while the
ratio of female to male productivity starts at a higher level but increases less, Concerning the bottom
line, even when the assumptions of perfect substitutes and constant capital share are relaxed, I still find
no significant evidence of a decline in the relative productivity of minorities or females. The point esti-
mates suggest that their relative productivity has increased.
The finding that the increased employment of minorities and females has not brought about a
decline in their relative marginal productivity is logically distinct from the question of the impact on the
average marginal productivity of labor of this change in the composition of the workforce. The point
estimates for 1977 in Table 6 indicate that minority males are roughly sixty percent as productive as
white males at the margin, and that females are ten percent more productive than white males. Multi-
plying these relative marginal productivities by the change in minority and female employment share in
manufacturing between 1966 and 1977, 1 find that the ratio of the marginal product of the average
worker to the marginal product of a white male worker fell by only .007 due to the changing composi-
lion of the workforce. This decline is small because non-white males are still a small minority of the
workforce, and because the productivity of females is estimated to be greater than that of white males.
One interpretation of the increase in the relative productivity of non-whites and females is that
they have been reallocated to jobs more suitable to their skills under the inducement of anti-
discrimination law. An index of occupational status in manufacturing formed by weighting the occupa-
tional distribution by the median earnings in 1969 of full-year male workers increased by 7.7°h for non-
white males from 1966 to 1978. Over the same period the female index increased by just 2.3% . For

- 15 -
comparison the white male index rose by 3.6%. Put another way, the ratio of non-white male to white
male occupational index increased from .84 to .88, while the female to white male ratio actually
declined slightly from .88 to .87. This evidence of net occupational advance across broad occupations
in manufacturing may play a role in explaining part of the increase in the relative productivity of non-
white males, though not that of females.
Productivity increases may accompany higher levels of education as well as employment in more
skilled occupations. We would expect to observe the same increase in relative productivity, absent
anti-discrimination efforts in the labor market, if minorities and females became relatively better edu-
cated. Are our observed productivity increases due then to improved education rather than integration?
Taking the median number of years of school completed from March CPS samples in 1966 and 197720,
we find that the ratio of non-white males' education to that of white males has increased from .81 to
.95. Among professionals and managers, relative non-white male education has actually fallen towards
equality. In 1966 a non-white male manager or professional was likely to be more highly educated than
his white counterpart. By 1977 this was no longer the case. This also suggests that employers did not
find it necessary to lower their standards to increase their non-white employment. Among blue-collar
workers, relative education increased from .83 to .97.
The level of female schooling relative to that of males has not increased, and so cannot explain
the estimated productivity ratio increase. Just as in the racial comparisons, female relative schooling
has fallen to equality among managers and professionals, and increased toward equality among blue-
collar workers. Education levels are rising more rapidly among blue-collar workers, and especially
among minorities and women. However neither increases in education nor broad occupational changes
are sufficient to explain the relative productivity increase among women.
The observed increase in both non-white and female productivity persists when data from the
1966 and 1977 cross-sections are pooled to difference out unchanging unobserved variables. If
In Y,=B,lnX+&lnZ+e1 (11)
where Xt is a vector of observed production inputs and Z a vector of unobserved inputs, then taking
first differences as in eq. (12) eliminates the Z, which are assumed not to change over time.

- 16 -
In Y1 — In }' = b+tin',+i — + (e+1—e1) (12)
This specification is relatively non-restrictive. It allows cell-specific constants and it allows the
coefficients to vary freely over time.
This specification yields point-estimates, and confidence intervals similar to the unpooled cross-
sections. In Table 7, for the 445 industry by state cells with observations in both 1966 and 1977, I find
that the ratio of non-white male to white male productivity increased from .52 in 1966 to .60 in 1977.
Over the same time, the ratio of female to white-male productivity increased from .73 to .85. In Table
7 note that the imprecision of the cross-sectional relative productivities is not due to omitted unchang-
ing cell-specific variables. The estimated productivities from pooled data are also imprecise, as are esti-
mates not shown here of the average productivity over time. Even when cell-specific constants are
corrected for, the evidence still points toward an increase in minority and female relative productivity.
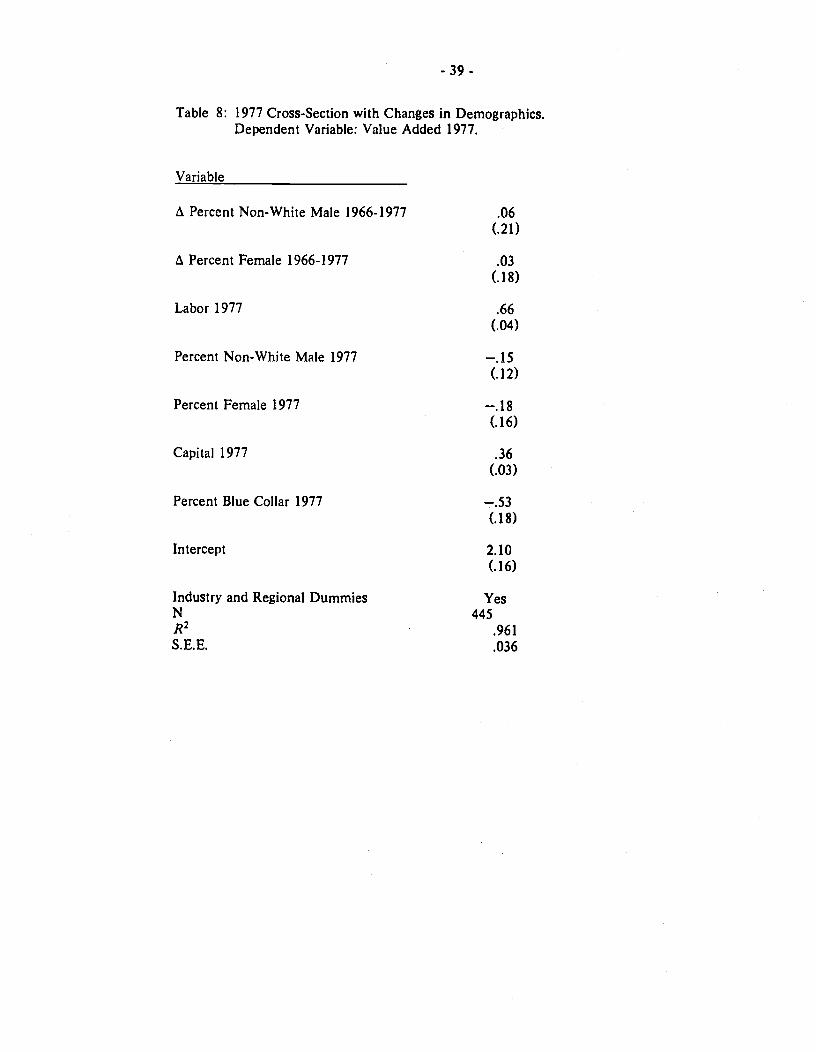
The argument that the influx of minorities and women has caused a decline in productivity can
also be tested in a more direct fashion. In the 1977 cross-section production function regression in
Table 8 we include directly as independent variables the change in percent non-white male and percent
female from 1966 to 1977. Increases in the proportion of the workforce that were minority or female
had no significant effect on productivity.
The evidence here is that government anti-discrimination and affirmative action pressure has led
to the increased employment of members of protected groups, most significantly in the case of blacks.
The most divisive question raised by affirmative action is whether it constitutes reverse discrimination.
Opponents of this regulation argue that it causes a double misallocation of resources that reduces pro-
ductivity. First, it forces firms to employ relatively less qualified minorities and females, moving away
from first best efficiency. Call this the indirect productivity effect.21 Second, it forces the firm to reallo-
cate resources to comply directly with regulations involving paperwork, test validations and personnel
procedures. Call this the direct productivity effect.
What are the direct costs imposed on firms by compliance with equal employment opportunity
regulations? According to a number of simple measures, compliance costs about as much as most firms
spend on annual bonuses. A Business Roundtable study developed for the purpose of questioning the
expense of government regulation, found 40 companies spending $217 million in 1977, or $78 per

- 17 -
employee.22 This is .1% of sales and 1.3% of profits for a group of companies accounting for 5% of U.S.
non-agricultural employees, and 8% of U.S. sales. The range was from $10 to $150 per employee, with
AT&T at the top. Of this total equal employment opportunity cost of $78 per employee, 76% was for
affirmative action programs. The Equal Employment Advisory Council imputed a cost of $1.5 billion
for the Fortune 500 based on a sample of 21 companies.23 The Congressional Research Service guessed
that $1.6 billion would pay for the cost of affirmative action for all non-construction contractors in
1976, based on a sample of two: the Warner-Lambert Company spent $55 per employee and Atlantic-
Richfield spent $46 per employee.24 Concerning just the direct cost of an affirmative action compliance
review, a 1981 National Association of Manufacturers survey of 42 companies with an average work-
force of 50,000 found that 80% of the reviewed were requested to submit data in addition to the AAP,
at an average cost of $3000.25 A similar survey by Senator Hatch's Labor Committee of 245 contractors
with an average workforce of 2584 in 1981 reported that 60% were asked to submit additional data
beyond the AAP, at an average cost of $24,000.26 The low incidence of financial penalties in the form
of back-pay awards through conciliation agreements has already been discussed.
The finding here is that neither affirmative action, nor Title VII litigation, have had a significant
impact on productivity. Table 9 presents a semi-reduced form pooled cross-section production function.
This equation includes two variables indicating government policy: T7, the number of Title VII class
action suits by state by industry decided between 1966 and 1977 in the Federal District Courts per
establishment; and PC74, the percent of employment in a state by industry cell in 1974 that is in
federal contractor establishments. There were an average of .0023 Title VII suits per establishment per
cell, and .71 of the employees were in federal contractor establishments. These policy variables are
used to test both for direct and indirect productivity effects. The change in minority and female
employment between 1966 and 1977 can be partitioned into a voluntary change and a forced, or
government induced, change. As well as capturing the direct productivity effects, the government pol-
icy variables also reflect the indirect effect on productivity of a forced change in firm demographics.27
There is no significant evidence of a productivity effect in Table 9. Title VII litigation has a negative
effect, but one that is not significantly different from zero.28 The greater the percent of employment in

- 18 -
a cell that is in contractor establishments, the higher the productivity, although this coefficient is also
insignificant.29
These results from aggregate production functions are supported by independent tests in a com-
panion paper of the impact of changing demographics on corporate profitability at a sample of more
than 500 large corporations between 1974 and 1980. EEO data on corporate demographics is matched
with publicly available information on corporate profits, assets, and sales. In this disaggregated analysis,
there is no significant evidence that corporations that increased their employment of non-whites or
females suffered lower profit rates.
While the conclusions drawn in this section must be tempered by the low significance levels of
most tests, conclusions of a similar nature may be drawn from a very detailed study of plant level pro-
ductivity by Katz, Kochan, and Gobeille.30 This study of industrial relations performance at eighteen
automotive assembly plants during the 1970's finds that the race or gender of workers generally has no
significant impact on productivity, corroborating some of the findings here for manufacturing in gen-
eral.
Conclusion.
This paper first shows that largely private litigation under Title VII has significantly increased
black employment. It then presents evidence suggesting that this has reduced racial discrimination, but
has not gone so far as to engender significant reverse discrimination. Using a novel approach, the
direct estimation of productivity in pooled time-series cross-section production functions, we ask
whether the productivity of minorities and females has decreased relative to that of white males as rela-
tive minority and female employment has increased over the past two decades. If, for example, we had
observed that relative black productivity fell while relative black wages increased, one might suspect
that government pressure under Title VII and Executive Order 11246 (affirmative action) had led to
reverse discrimination. We find no such evidence of reverse discrimination, nor of any significant
decline in the relative productivity of minorities or females. At the same time, it must be remembered
that these marginal productivities are imprecisely estimated in this paper. The same result holds in esti-
mates of both Cobb-Douglas and trans-log production functions. An alternative specification that

- 19 -
directly tests the impact of governmental anti-discrimination and affirmative action regulation on pro-
ductivity again finds no significant evidence of a productivity decline. While further studies with more
detailed information at the firm level would be very informative, they are also unlikely to see the light
of day given firms' fears of legal liability.
The evidence presented here is consistent with effective federal anti-discrimination policies that
have led to increased employment opportunities for blacks without a significant decline in their relative
productivity. This suggests that job redistribution has not entailed a large efficiency cost, and that
governmental policy has made progress in fighting racial discrimination.

- 20 -
NOTES
For example, suppose firms arbitrarily limit employment to high-school graduates. Since rela-
tively fewer blacks are high-school graduates, this will effectively limit black employment oppor-
tunities. This type of pretext has given rise to legal tests of adverse impact, as in Griggs vs.
Duke Power. However, in a wage equation we will observe only a smaller return to all the poorly
educated, and no discrimination against blacks conditional on education.
2. I978EEOCReport, p.XI.
3. The pattern of targeting of compliance reviews by the OFCCP, and the impact of Executive Order
11246 and Title VII on employment patterns is examined at length in the author's "The Impact of
Affirmative Action".
4. Others have argued that the passage of the Civil Rights Act of 1964 reflected a diminished level
of discrimination on the part of the electorate that one would expect to see reflected in improved
employment opportunities for minorities and women even if the Act were never enforced. More-
over, this line of argument proceeds, only a small proportion of establishments have been directly
involved in Title VII litigation, so large effects are unlikely. This rosy view ignores the near
defeat of the Civil Rights Act of 1964, and the continuing stream of litigation since, some of
which has established broad precedents. Moreover the Kennedy administration believed the 1964
Act too strong to pass. Title VII, and in particular the clause extending protection to females, was
supported by some Congressmen because they believed it would doom the entire bill. It was pre-
cisely the provisions for enforcement through the courts that distinguished Title VII from its
toothless but equally noble forebears and gave it prospects for effecting change.
5. Before 1972, the Justice Department was empowered to bring suit for enforcement through the
courts of Title Vii's provisions. The EEOC's powers were limited to conciliation and persuasion.
Since 1972 the power of litigation has been entrusted to the EEOC, which in turn can pass it on to
individual plaintiffs. By such recourse to the courts, the EEOC can sometimes accomplish in
years what takes the OFCCP weeks. What it gives up in speed though it may sometimes win back
in power through the setting of sweeping legal precedents. For example, the celebrated case of
- 21 -
Griggs v. Duke Power did not simply aid Griggs, or affect only Duke Power. By establishing the
principle of disparate impact as prima facie evidence of discrimination, it placed a heavier burden
on all employers to avoid the appearance of discrimination.
6. U.S. General Accounting Office, "EEOC Has Made Limited Progress in Eliminating Employment
Discrimination", 1976.
7. U.S. General Accounting Office, "Further Improvements Needed in EEOC Enforcement Activi-
ties", April 19, 1981.
8. Despite its official mandate, the EEOC claims not to place great weight on such individual com-
plaints in targeting enforcement, considering them unreliable. Rather, in interviews it claims to
target by using EEO- 1 forms to screen out establishments whose entry level employment of pro-
tected groups compares poorly with that prevalent in the SMSA, and whose professional employ-
ment falls short of the national norm. But according to the 1976 General Accounting Office
report, " . . . the use of such [EEO-1] information in sophisticated methodologies for selecting
targets for systemic enforcement activities has been minimal." The EEOC also claims to take into
account community reputation, past charges, and the size of the company. It avoids large com-
panies, finding them too hard to digest. Yet this targeting system has produced relatively few sys-
temic charges. There is little evidence to suggest that the EEOC has focused its attention on large
firms that systematically discriminate. I argue, however, that litigation under Title VII by private
parties and by the EEOC constituted the cutting edge of government anti-discrimination policy.
9. The demand shifts for females may simply be swamped by the ongoing massive increase in labor
supply. In addition, many of the early Title VII cases focused on racial rather than gender
discrimination. The apparent ineffectiveness of anti-discrimination policy in promoting female
employment remains an interesting question for research.
10. Other work by the author examines Title VII litigation in greater detail at a disaggregated level.
The analysis here treats litigation under Title VII as exogenous. If one believes that Title VII
Suits that reach a decision in the federal District Courts are more prevalent in firms with growing
black employment, then the estimate presented here will be biased upwards. More plausibly in

- 22 -
my judgement, if discrimination leads to both stagnant levels of black employment and to litiga-
tion, then my estimate of the impact of Title VII will be biased downwards, and the positive
results shown here are that much more notable.
11. See Burman, Ashenfelter and Heckman, Goldstein and Smith, Heckman and Wolpin, and Leo-
nard.
12. See Beller for an analysis of the interaction of equal employment and equal pay pressures.
13. A finding that the wage ratio is equal to the productivity ratio need not prove the absence of
discrimination. Consider the extreme case in which productivity is a characteristic of the job
independent of the person who holds it, and in which discrimination takes the form of segregating
minorities and women in low productivity jobs. In this occupational segregation case, wages may
equal the value of marginal product despite ongoing discrimination because all discrimination
takes place at the level of job allocation rather than through paying employees less than their mar-
ginal product. Note again, this cannot be a full equilibrium if productivity is at all an individual
characteristic. But in this plausible world discrimination will not be observable as a divergence
between wage ratios and productivity ratios. To the extent that this occupational segregation
model accurately describes the world, our results will be biased against finding discrimination.
14. Estimates are presented from data grouped to the 2-digit S.I.C. by state level. In a number of
cases, geographically neighboring states with small manufacturing populations have been grouped
together, resulting in 29 state groups. All production function estimates include 19 industry dum-
mies for the 2-digit S.I.C manufacturing industries, and 3 regional dummies for the South, West,
and North-Central regions. Details are available on request from the author.
15. Non-production workers in headquarters and administrative establishments should be excluded
from both the EEO and Census of Manufactures samples used here.
16. The percent non-white in the EEO sample appears to overstate the expected percent non-white in
the manufacturing sector. In 1978 the EEO sample, in which small establishments are under-
counted, reported eighteen percent non-white employment in manufacturing, while the Current
Population Survey showed twelve percent. This will tend to understate differences in productivity.

- 23 -
There is a choice between two evils here: downward bias in productivity differences due to meas-
urement error in the smaller CPS sample, or due to the underrepresentation of small establish-
ments in the EEO sample. I have chosen the latter course. Note that specifications including the
ratio of EEO to CPS total employment by industry, a control for measurement error, do not
significantly alter the conclusions of this study.
17. Correcting for industry, occupation, age, age squared, and education in earnings equations for the
CPS, the earnings ratios of females or black males to white males are higher in both years, but
still show increases between 1968 and 1978.
18. To restrict the number of parameters to be estimated with the trans-log model, no attempt has
been made here to estimate capital-labor elasticities of substitution. Restricting the capital-labor
interaction terms to zero may introduce a complicated bias whose sign will depend on the true
elasticity.
19. The elasticities of substitution are computed directly from the estimated parameters of the trans-
log production function using the following formula:
1 l+f3jk—2f3j1 Thk—213kko f3+2/3 lnXj+EJ3, lnX—
13k+213kk lnXk+/3kJ lnA..1=1
The derivation does not depend upon assuming wages equal to value marginal product, is neither
short nor simple, and is available upon request from the author. The ratios of marginal products
are given by the following formula:
/3,+2f3 lnX,+Z/3, lnX,C,k
13k+213kk lnXk+E/3kj lnX,k
20. U.S. Bureau of Labor Statistics, Handbook of Labor Statistics 1980, Table 69, p.140. Since these
statistics on education refer to all employees, they may possibly obscure an influx of the highly
educated into manufacturing.
21. Concerning the indirect productivity effects, AT&T presents a remarkablecase study of the impact
of government regulation. On January 18, 1973, AT&T entered into a consent decree with the
federal government that represents an extreme of government intervention and pressure. During

- 24 -
the six year tenure of this initial decree female representation nearly doubled in management
from 8.8 to 17.4 percent, and tripled in craft jobs, from 2.8 to 9.5 percent. At the same time
minority representation in management and craft positions roughly doubled. In the face of this
forced and dramatic influx, a personnel official of AT&T stated in an interview that they had
found no effect of compliance on productivity or performance. But perhaps it is naive to expect
AT&T to speak out on this controversial issue so soon after feeling the weight of the government
and drawing public attention as an alleged discriminator. A recent AT&T internal study con-
cluded that female managers "managerial abilities are decidedly up to those of men of either yes-
terday or today," while noting that non-white managers where less motivated and less able than
whites. ( Howard and Bray) At AT&T where the government has imposed some of the most
stringent requirements for upgrading minorities and females, the company has complained far
more of temporary morale setbacks among white males, and of increased administrativeand train-
ing costs, than of a decline in productivity.
22. Arthur Anderson and Co., Cost of Government Regulation Study for the Business Roundtable A
Study of the Dfrect Incre,nental Cost Incurred by 48 Companies in Complying With the Regulations of
Six FederalAgencies in 1977, 1979.
23. Letter from Kevin S. McGuiness, Equal Employment Advisory Council, dated July 21, 1981.
24. Congressional Research Service, "Costs of Affirmative Action Programs in Employment",
memorandum from Paul Downing, dated April 2, 1976.
25. Letter from Brenda McChristian-Brooks, National Association of Manufacturers, to Staff Director,
Senate Committee on Labor and Human Resources, dated December 2, 1981.
26. "Survey of Federal Contractor Experiences with OFCCP", unpublished summary of questionnaire
results, 1981.
27. The positive sign on the change on proportion blue-collar here is puzzling.
28. Lest one suppose this data-set is incapable of discerning the productivity effect of regulation, note
that using data assembled by Wayne Gray on O.S.H.A. regulation, such regulation was found to
have an adverse impact on productivity in this same data-set.

—25—
29. All studies based on regate data, including this paper, may suffer from regaUon. In particu-
lar, it is theoretically possible that changes in demographics, and hence in productivity, are con-
centrated in a sub—sector. However, when the analysis is repeated at the level of the individual
corporation, similar results are obtained. M oreover, the conclusions drawn from Table 9 are not
altered when changes in demographics are interacted with the vaxab1es indicating government
pressure under Title VII and affirmative action
30. Harry Katz, Thomas Kochan, and Kenneth Gobeille, "Industrial Relations Performance,
Economic Performance, and the Effects of Quality of W orking Life Efforts An Inter-Plant
Analysis", unpublished paper, M.I.T., 1982.

- 26 -
REFERENCES
Arthur Anderson and Co. Cost ofGovernment Regulation Study for the Business Roundtable: A Study of the
Direct Incremental Cost Incurred by 48 Companies in Complying With the Regulations of Six Federal
Agencies in 1977, (New York: 1979).
Ashenfelter, Orley and Heckman, James. "Measuring the Effect of an Anti-discrimination Program"
in Orley Ashenfelter and James Bium, eds., Evaluating the Labor Market Effects of Social Programs,
(Princeton: Industrial Relations Section, Princeton University, 1976), PP. 46-84.
Becker, Gary. The Economics of Discrimination, 2nd edition, (Chicago: University of Chicago Press,
1971).
Belier, Andrea. "The Impact of Equal Employment Opportunity Laws on the Male/Female Earnings
Differential," in Cynthia Llyod, Emily Andrews, and Curtis Gilroy, eds., Women in the Labor
Market (New York: Columbia University Press, 1979) pp. 304-330.
Brown, Charles. "The Federal Attack on Labor Market Discrimination: The Mouse That Roared?"
National Bureau of Economic Research, working paper, 1981.
Brown, Charles, and Medoff, James. "Trade Unions in the Production Process", Journal of Political
Economy, vol. 86, no. 3, June, 1978.
Bureau of National Affairs, "Personnel Policies Forum Survey #1128, Equal Employment Opportunity
Programs and Results", March 1976.
Bureau of National Affairs, "Personnel Policies Forum Survey #114, Selection Procedures and Person-
nel Records", September 1976.
Burman, George. The Economics of Discrimination: The Impact of Public Policy, unpublished Ph.D.
thesis, Graduate School of Business, University of Chicago, 1973.
Freeman, Richard B. "Changes in the Labor Market for Black Americans, 1948-1972," Brookings
Papers on Economic Activity, 1973, pp. 67-131.
Freeman, Richard B. "Black Economic Progress After 1964: Who Has Gained and Why?" National
Bureau of Economic Research, working paper, June 1978.

- 27 -
Goldstein, Morris and Smith, Robert S. "The Estimated Impact of the Anti-discrimination Program
Aimed at Federal Contractors," Industrial andLabor Relations Review, vol. 29, no. 4, July 1976,
pp. 523-543.
Gregory, Charles and Katz, Harold. Labor and the Law, 3rd edition, (New York: W. W. Norton, 1979).
Griliches, Zvi. "Production Functions in Manufacturing: Some Preliminary Results", in Murray
Brown, ed., The Theory and Empirical Analysis of Production, (New York: National Bureau of
Economic Research, 1967).
Hatch, Orrin. "Loading the Economy", Policy Review, no. 12, Spring, 1980, pp. 23-38.
Heckman, James J. and Wolpin, Kenneth I. "Does the Contract Compliance Program Work? An
Analysis of Chicago Data," Industrial and Labor Relations Review, vol. 29, no. 4, July 1976, pp.
544-564.
Howard, Ann and Bray, Douglas. "Today's Young Managers: They Can Do It, But Will They?" Whar-
ton Magazine, vol. 5, no. 4, Summer 1981, pp. 23-38.
Hulten, Charles R. and Wykoff, Frank. "The Measurement of Economic Depreciation," unpublished
paper, 1981.
Katz, Harry, Thomas Kochan and Kenneth Gobeille. "Industrial Relations Performance, Economic
Performance, and the Effects of Quality uf Working Life Efforts: An Inter-Plant Analysis,"
unpublished paper, M.I.T., 1982.
Leonard, Jonathan S. "The Impact of Affirmative Action", unpublished, July, 1983.
Leonard, Jonathan S. "The Profitable Decline of Discrimination", unpublished paper, University of
California at Berkeley, October, 1983.
Northrop, Herbert R. and Larson, John A., The Impact of the AT&T-EEO Consent Decree; (Philadel-
phia, Pennsylvania: Industrial Research Unit, University of Pennsylvania, 1979).
U.S. Bureau of the Census, Annual Survey of Manufactures, (Washington: Government Printing Office,
various years).
U.S. Bureau of the Census, Census of Manufactures, 1972, (Washington: Government Printing Office,
1975).

- 28 -
U.S. Commission on Civil Rights, 1961 Report: Employment, Book 3, (Washington: Government Print-
ing Office, 1962).
U.S. Commission on Civil Rights, The Federal Civil Rights Enforcement E,ffort — 1974, volume 5, "To
Eliminate Employment Discrimination" (Washington: Government Printing Office, July 1975).
U.S. Civil Rights Commission, The Federal Civil Rights Enforcement Effort — 1977, "To Eliminate
Employment Discrimination: A Sequel" (Washington: Government Printing Office, December,
1977).
U.S. Department of Labor, Bureau of Labor Statistics, Capital Stock Estimates for Input-Output Industries:
Methods and Data, Bulletin 2034, (Washington: Government Printing Office, September, 1979).
U.S. Department of Labor, Bureau of Labor Statistics, Handbook of Labor Statistics, 1979, Bulletin 2070,
(Washington: Government Printing Office, December, 1980).
U.S. Equal Employment Opportunity Commission. EEOC Report: Minorities and Women in Private
Industry, Annual Volumes.

- 29 -
Table 1: Change in the Demographic Composition of the Work Forcein Manufacturing, 1966 to 1978.
1966 1978
Total Employment 12,504,627 13,821,226% Non-White Male .077 .109% White Female .240 .256% Non-White Female .023 .059
% Managerial and Professional—Total .113 .152% Non-White Male .008 .036% White Female .047 .095% Non-White Female .001 .007
% Clerical,Technical Sales—Total .165 .161
% Non-White Male .014 .032% White Female .480 .581% Non-White Female .006 .044
% Blue Collar—Total .722 .687% Non-White Male .100 .141% White Female .224 .235% Non-White Female .028 .070
Note: The statistics are derived from a sample of 555 state byindustry cells with data for both 1966 and 1977 from the EEOCReports. Asians and Native Americans are grouped with whites.

- 30 -
Table 2: The Impact of Title VII Litigation and the Contract Compliance Program onWorkplace Demographics.
Dependent Title LaggedEquation Occupation Variable VII PC74* Dependent Intercept R2 MSE
1 All Black! .277 .009 .933 .035 .65 .0042Total (.083) (.011) (.030) (.009)
2 All BlackMale! .250 .004 .869 .033 .68 .0036Total (.077) (.010) (.027) (.008)Male
3 All BlackFemale! .729 .041 .741 .058 .36 .0091Total (.121) (.017) (.047) (.013)Female
4 White- Black! .136 .010 1.39 .019 .26 .0008collar Total (.035) (.005) (.110) (.004)
5 White- Blackcollar Male! .111 .007 1.29 .016 .32 .0005
Total (.028) (.004) (.09) (.003)Male
6 White- Blackcollar Female! .270 .023 .898 .030 .17 .0017
Total (.052) (.007) (.1117) (.006)Female
7 Profes- Black! .158 .00008 .943 .023 .17sional & Total (.026) (.0036) (.124) (.003)Managerial
8 Profes- Blacksional & Male! .144 .0013 1.08 .019 .17 .0004Managerial Total (.025) (.0034) (.13) (.003)
Male
9 Profes- Blacksional & Female! .315 .020 —.001 .030 .09 .0017Managerial Total (.051) (.007) (.035) (.005)
Female
10 Blue- Black! .312 .010 .930 .043 .65 .0062collar Total (.100) (.014) (.031) (.011)
11 Blue- Blackcollar Male! .267 .0027 .857 .045 .65 .0060

- 31 -
Table 2: The Impact of Title VII Litigation and the Contract Compliance Program onWorkplace Demographics.
Dependent Title LaggedEquation Occupation Variable VII PC74* Dependent Intercept R2 MSE
Total (.099) (.014) (.028) (.011)Male
12 Blue- Blackcollar Female! .857 .062 .658 .068 .35 .0151
Total (.156) (.022) (.043) (.017)Female
*PC74 is the proportion of employment in a state by industry cell in estab-lishments that were federal contractors in 1974.

-32-
Table 3: Estimated Effect of the Number of Title VII Class Action Suits Decidedin the Federal District Courts on the 1978 Proportion of Employmentby Occupation, 1966-1978.
Change instandard
deviation ofChange in proportionproportion due to adue to a standard
change in deviationnumber of change in
MEAN Change cases per number of1966 1978 1966-78 firm cases
1. BlackProportionof AllEmployment .081 .120 33 3•4** .088
2. BlackMaleProportionof MaleEmployment .085 .112 32 2.9** .083
3. BlackFemaleProportionofFemaleEmployment .056 .135 141 13.0** .213
4. BlackProportionof AllWhite-CollarEmployment .011 .042 282 12.4** .150
5. BlackMaleProportionof MaleWhite-CollarEmployment .010 .034 240 11.0** .148

- 33 -
Table 3: Estimated Effect of the Number of Title VII Class Action Suits Decidedin the Federal District Courts on the 1978 Proportion of Employmentby Occupation, 1966-1978.
Change instandard
% deviation ofChange in proportionproportion due to adue to a standard
change in deviation% i number of change in
MEAN Change cases per number of1966 1978 1966-78 firm cases
6. BlackFemaleProportionofFemaleWhite-CollarEmployment .012 .060 400 22.5** .210
7. BlackProportionof AllProfessionalandManagerialEmployment .005 .029 480 31.6** .246
8. BlackMaleProportionof MaleProfessionalandManagerialEmployment .005 .026 420 28.8** .238
9. BlackFemaleProportionofFemaleProfessionalandManagerialEmployment .011 .048 336 28.6** .258

34 -
Table 3: Estimated Effect of the Number of Title VII Class Action Suits Decidedin the Federal District Courts on the 1978 Proportion of Employmentby Occupation, 1966-1978.
Change instandard
% i deviation ofChange in proportionproportion due to adue to a standard
change in deviationnumber of change in
MEAN Change cases per number of1966 1978 1966-78 firm cases
10. BlackProportionof AllBlue-CollarEmployment .104 .150 44 3•Ø** .082
11. BlackMaleProportionof MaleBlue-CollarEmployment .109 .144 32 2.4** .072
12. BlackFemaleProportionofFemaleBlue-CollarEmployment .082 .174 112 10.5** .196
Note: Estimated from regressions for 555 States by industry cells inmanufacturing, with 1966 proportion of blacks in relevant category, and cellproportion of employment in federal contractor establishments held fixed.**
Significant at 1% level.

- 35 -
Table 4: Cross-Section Production Functions, 1966 & 1977. Depen-dent Variable: Value Added.
Equation 1. 2.Variable 1966 1977
Labor .65 .71(.030) (.03 8)
Percent Non-White Male —.21 —.20
(.088) (.106)
Percent Female —.16 .007(.108) (.128)
Capital .38 .32(.025) (.028)
Percent Blue-Collar —.50 —.35
(.140) (.164)
Intercept 1.85 1.99(.112) (.146)
Industry andRegional Dummies Yes Yes
N 513 536R2 .978 .957
S.E.E..024 .040
Productivity RatiosC1: Non-white to white male .68 .71
C2: Female to white male .75 1.01
Note: Each equation includes 19 industry dummies and 3regional dummies. Standard errors in parentheses.

- 36 -
Table 5: Means and Standard Deviations of Variables Used in Trans-log Esti-mates.
Mean Standard-deviation
Variable 1966 1977 1966 1977
White-Male labor (WM) 4.33 4.12 .93 .88
Non-White Male labor (RM) 1.58 2.00 1.68 1.43
Female labor (F) 3.17 3.36 1.23 .97
WM2 19.58 17.75 8.21 7.39
RM2 5.32 6.05 5.61 5.44
F2 11.54 12.22 7.91 6.63
WM x RM 7.51 8.85 8.45 7.19
WM x F 14.26 14.28 7.27 6.17
RM x F 5.60 7.21 6.24 5.83
Capital 6.33 6.51 1.26 1.18
Capital2 41.65 43.73 16.86 16.18
Percent Blue Collar .766 .732 .096 .097
Value-added 6.90 7.06 1.03 .948
N 505 533

- 37 -
Table 6: Trans-log Production Functions with Capital x Industry Interactions,1966-1977. Dependent Variable: Value-added.
Equation 1. 2.Variable 1966 1977
White-Male labor (WM) .262 (.12) .54 (.14)
Non-White Male labor (RM) .048 (.027) .13 (.04)
Female labor (F) .32 (.06) .33 (.09)
WM2 .057 (.015) .040 (.019)
RM2 .00085 (.0023) .011 (.004)
F2 .041 (.009) .072 (.017)
WM x RM —.0026 (.007) —.010 (.012)
WM x F —.093 (.02) —.128 (.028)
RM x F —.0043 (.004) —.025 (.009)
Capital .56 (.19) —.11 (.22)
Capital2 —.005 (.01) .04 (.02)
Percent Blue Collar —.39 (.14) —.38 (.17)
Intercept 1.38 (.60) 3.13 (.79)
Regional Dummies Yes YesIndustry Dummies Yes YesCapital x Industry Dummies Yes YesN 505 533R2 .98 .96S.E.E. .022 .036Productivity RatiosC1: Non-white to white male .49 .62Csub2: Female to white male .92 1.10Elasticities of Substitution0j: Non-white males to white males 1.11 .69cr2. Females to white males .65 .61

38 -
Table 7: Pooled Time-Series CrOss-Section Production Function 1966and 1977. Dependent Variable: Change in Value Added.
Variable
Labor, 1966 .92 (.048)
Percent Non-White Male, 1966 —.44 (.19)
Percent Female, 1966 —.25 (.16)
Capital, 1966 .14 (.04)
Percent Blue Collar, 1966 —.65 (.24)
Labor, 1977 .82 (.05)
Percent Non-White Male, 1977 —.33 (.18)
Percent Female, 1977 —.12 (.17)
Capital, 1977 .22 (.04)
Percent Blue Collar, 1977 —.50 (.23)
Intercept .21 (.15)
Industry and Regional Dummies YesN 445
.77S.E.E. .028
C1, 1966 .52C2, 1966 .73C1, 1977 .60C2, 1977 .85
- 39 -
Table 8: 1977 Cross-Section with Changes in Demographics.Dependent Variable: Value Added 1977.
Variable
Percent Non-White Male 1966-1977 .06(.2 1)
i Percent Female 1966-1977 .03(.18)
Labor 1977 .66(.04)
Percent Non-White Male 1977 —.15(.12)
Percent Female 1977 —.18(.16)
Capital 1977 .36(.03)
Percent Blue Collar 1977 —.53(.18)
Intercept 2.10(.16)
Industry and Regional Dummies YesN 445R2 .961S.E.E. .036

- 40 -
Table 9: The Impact of Government Policy On Productivity,Pooled Cross-Section Production Functions, 1966 &1977.Dependent Variable: Change in Value-Added.
Percent of Employment in .00095Federal Contractor Establishments (.00051)
Title VII Litigation per —.13
Establishment, 1966-1977 (1.01)
Labor .87(0.04)
Percent Non-white Male —.34(.17)
i Percent Female —.22(.15)
Capital .18(.04)
i Percent Blue-Collar .53(.22)
Intercept .16(.05)
Industry and Region Dummies yes
N 445
R2 .77
S.E.E .028