Embed Size (px)
Citation preview
Working Paper No. 190
Looking Beyond Literacy:Disparities in Levels of and Access to Education
in a Kerala Village
Suma Scaria
January 2009
Gujarat Institute of Development ResearchGota, Ahmedabad 380 060
Abstracts of all GIDR Working Papers are available on the Institute’s website.Working Paper No 121 onwards can be downloaded from the site.
All rights are reserved. This publication may be used with proper citation anddue acknowledgement to the author(s) and the Gujarat Institute of DevelopmentResearch, Ahmedabad.
© Gujarat Institute of Development Research
First Published January 2009ISBN 81-89023-47-0Price Rs. 35.00
Abstract
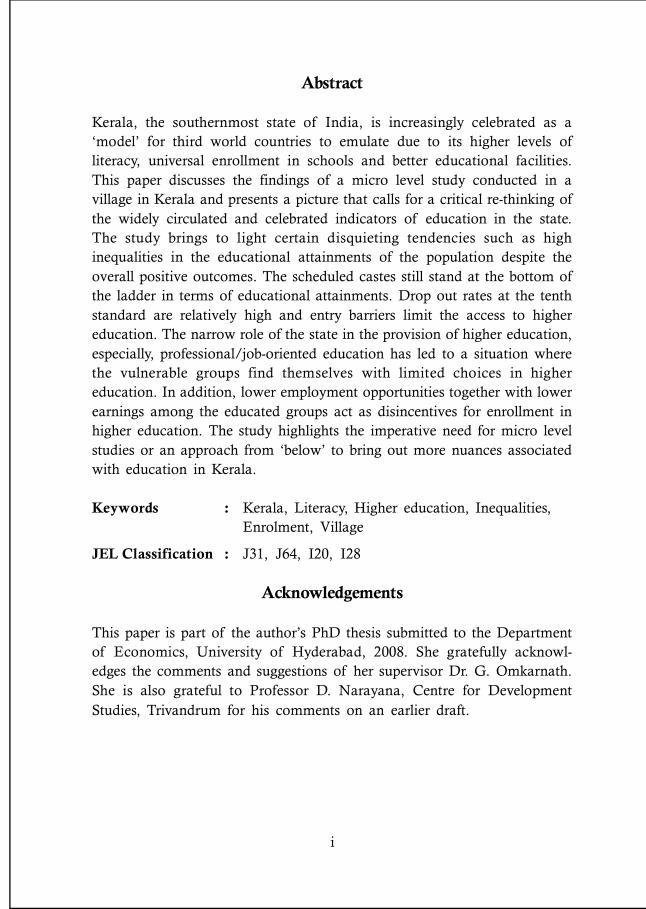
Kerala, the southernmost state of India, is increasingly celebrated as a‘model’ for third world countries to emulate due to its higher levels ofliteracy, universal enrollment in schools and better educational facilities.This paper discusses the findings of a micro level study conducted in avillage in Kerala and presents a picture that calls for a critical re-thinking ofthe widely circulated and celebrated indicators of education in the state.The study brings to light certain disquieting tendencies such as highinequalities in the educational attainments of the population despite theoverall positive outcomes. The scheduled castes still stand at the bottom ofthe ladder in terms of educational attainments. Drop out rates at the tenthstandard are relatively high and entry barriers limit the access to highereducation. The narrow role of the state in the provision of higher education,especially, professional/job-oriented education has led to a situation wherethe vulnerable groups find themselves with limited choices in highereducation. In addition, lower employment opportunities together with lowerearnings among the educated groups act as disincentives for enrollment inhigher education. The study highlights the imperative need for micro levelstudies or an approach from ‘below’ to bring out more nuances associatedwith education in Kerala.
Keywords : Kerala, Literacy, Higher education, Inequalities,Enrolment, Village
JEL Classification : J31, J64, I20, I28
Acknowledgements
This paper is part of the author’s PhD thesis submitted to the Departmentof Economics, University of Hyderabad, 2008. She gratefully acknowl-edges the comments and suggestions of her supervisor Dr. G. Omkarnath.She is also grateful to Professor D. Narayana, Centre for DevelopmentStudies, Trivandrum for his comments on an earlier draft.
i
ii
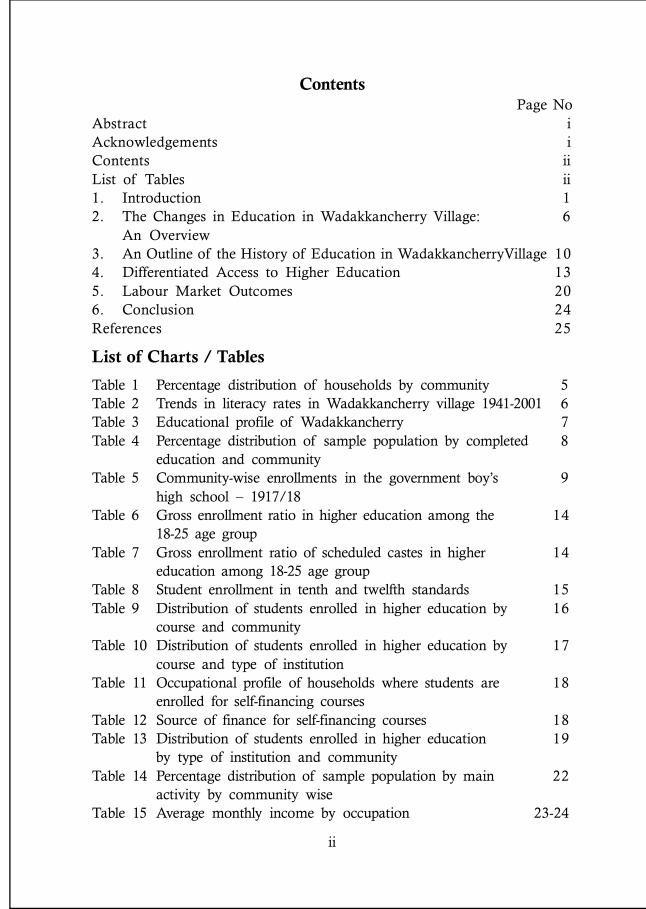
ContentsPage No
Abstract iAcknowledgements iContents iiList of Tables ii1. Introduction 12. The Changes in Education in Wadakkancherry Village: 6
An Overview3. An Outline of the History of Education in WadakkancherryVillage 104. Differentiated Access to Higher Education 135. Labour Market Outcomes 206. Conclusion 24References 25
List of Charts / Tables
Table 1 Percentage distribution of households by community 5Table 2 Trends in literacy rates in Wadakkancherry village 1941-2001 6Table 3 Educational profile of Wadakkancherry 7Table 4 Percentage distribution of sample population by completed 8
education and communityTable 5 Community-wise enrollments in the government boy’s 9
high school – 1917/18Table 6 Gross enrollment ratio in higher education among the 14
18-25 age groupTable 7 Gross enrollment ratio of scheduled castes in higher 14
education among 18-25 age groupTable 8 Student enrollment in tenth and twelfth standards 15Table 9 Distribution of students enrolled in higher education by 16
course and communityTable 10 Distribution of students enrolled in higher education by 17
course and type of institutionTable 11 Occupational profile of households where students are 18
enrolled for self-financing coursesTable 12 Source of finance for self-financing courses 18Table 13 Distribution of students enrolled in higher education 19
by type of institution and communityTable 14 Percentage distribution of sample population by main 22
activity by community wiseTable 15 Average monthly income by occupation 23-24
Looking Beyond Literacy: Disparities in Levels ofand Access to Education in a Kerala Village
Suma Scaria
1. Introduction
Kerala, the southernmost Indian state, occupies a unique position in theeducational map of India. This tiny state with a population of 32 millionis having a literacy rate of 90.86 per cent with a male-female literacy gapof only 6.52 per cent (Department of Economics and Statistics, 2007).This is in complete contrast with the all India situation, where literacy rateis only around 64.84 per cent with a huge gap in male-female literacy.Another noteworthy feature of educational development in Kerala is thenarrow urban-rural disparities in literacy rates and the near total enrollmentin schools among the school going age group.1 The dropout rate in classesI-X is only 8.58 per cent, which is the lowest among the states in India.These achievements of Kerala in conventional indicators of education havebeen increasingly celebrated as a ‘model’ for developing countries to emulatewithout high economic growth (UN/CDS, 1975; Franke and Chasin, 1999;Sen, 2000).
Of late there has been a growing recognition of ‘disturbances’ within theconventional indicators in terms of socio-economic disparities in literacylevels, enrollment rates and drop out rates, besides unequal access to qualityeducation, especially, at the school level (Mencher,1980; Kurien,1995;Varghese, 1999; Deshpande, 2000; Chandrasekhar, 2001; Omvedt, 2006;Saradamoni, 2006). There are only a few studies that look beyond the levelof school education and bring to our attention the problems that confrontthe higher education sector in Kerala (Nair and Nair, 2008). These studiesmainly focus on the entry barriers in higher education, particularly, inprofessional/job oriented education, drop out rates and wastages in highereducation. A few studies also highlight the issue of relatively lowerenrollment in higher education in the state compared to many less literateones in India (George, 2006; Prakash, 2007).
1 The rural and urban literacy rates in India are 58.74 and 79.92 per cent respectively,see Department of Economics and Statistics (2007:74-5).
1
The issue of inequality in educational attainments, however, has notprominently figured in the extant academic deliberations on education inKerala. This paper aims to augment the scanty literature on higher educationin the state by drawing attention to the inequalities prevalent in theeducational attainments of the population. The paper also strives to bringout the complex processes through which social hierarchies are perpetuatedin Kerala through education. In other words, this paper makes an attemptat understanding why inequalities continue to exist in the educational profileof the population despite high literacy, universal enrollment in schools andrelatively better infrastructural facilities. In this connection, the questionsrelating to entry barriers in higher education and labour market outcomesgain considerable significance.
The academic discussions on education in Kerala have so far been largelybased on macro level studies that tend to homogenize the various divergentunits within a system. Only an approach from ‘below’ could reveal theheterogeneities and interrelationships in the development process relating toeducation.2 These insights would unravel the complexities that get sweptunder the carpet in macro level understandings of education in Kerala. Avillage as a micro unit provides an appropriate framework for such a closeenquiry. Further, a caste or community framework is also necessary sincecommunity organizations like the Nair Service Society (NSS), Sree NarayanaDharma Paripalana Yogam (SNDP), Muslim Educational Society (MES)and the churches are involved in the provision of education in the state.The current academic discussions on education are, however, largelydominated by the class discourse.
Paradoxically, education is increasingly becoming an important mediumthrough which inequality is perpetuated. Addressing inequality is importantsince it is the root cause of poverty (Saith, 2005; Breman, 2007). Thepresent micro level study reveals the wide disparity in educationalattainments among the population. This inequality is more apparent in theeducational attainments of different social groups, especially betweenscheduled castes and others. Unlike in earlier times, there are no explicitentry barriers in education, but they exist in different obscure forms at
2 For a discussion on micro versus macro level studies, see Bardhan (1989) andBreman et al. (1997).
2
different levels. The share of population enrolled for higher education isquite low and the number of drop outs at the tenth standard is very high.Substantial share of population, especially, of the scheduled castes, are stilldependent on manual labour for their livelihood. The increasing privatizationof higher education or the narrowing role of the state has limited the accessof socially and economically vulnerable groups to higher education,particularly, to job- oriented/professional education despite the efforts ataffirmative policy action. This is clearly reflected in their poor labour marketoutcomes. The lower employment opportunities together with lower earningsamong the educated groups act as disincentive for enrollment in highereducation. The questions relating to education and inequality are quiteimportant in the context of Kerala since social mobility is largely perceivedthrough education due to high fragmentation of landholdings anddiversification of livelihoods from agriculture to non-agricultural sources.3
Wadakkancherry village, situated in Thrissur district of Kerala, provides anappropriate setting for a closer scrutiny of processes linked with thedevelopment of education in the state. This village shares certain generalcharacteristics associated with the state as a whole and also shows certainspecific features of its own. Like the rest of the state, Wadakkancherryvillage is multi-communitarian in character where there are Hindus, Muslimsand Christians.4
Secondly, the village is having a higher level of literacy and many communityorganizations like the NSS, the SNDP and the Churches are engaged in theprovision of education. This village also has a long history of moderneducation and had its first modern school even by the second half of thenineteenth century. Importantly, since Wadakkancherry village was surveyedby Gilbert Slater and his students in the first half of the twentieth century,longitudinal data is available for mapping out the changes from a long time
3 The proportion of the population engaged in non-agricultural occupation in Keralais around 77 per cent compared to 47 per cent in India. See, Economic Review(2006)
4 The community configuration in Kerala is Hindus 56.2 per cent, Muslims24.7 per cent, Christians 19.02 per cent and Others 0.12 per cent respectivelycompared to the all-India situation of 80.5 per cent, 13.4 per cent, 2.3 per centand 3.8 per cent respectively. Op. cit.
3
historical perspective. The dominance of Christians in the total populationof the village and a higher population density compared to the rest ofKerala constitute unique features of this village.
We have drawn on a variety of secondary sources apart from the primarysources based on field work. The important secondary sources used areCensus Reports (1875-2001) and Development Reports of WadakkancherryPanchayat (1997, 2002). The geographical area covered for the primarylevel field work is Wadakkancherry revenue village which comprises eightwards. The primary level field work is done in two stages: first, a householdcensus and second, a sample survey. The household census was conductedduring December 2005, mainly to understand the caste/communityconfiguration in the village as neither the official Census nor any othersecondary sources provides information on it.
According to the household census conducted by the author, there are2381 households in the village distributed across 14 communities (Table 1).In the second stage, a sample survey was conducted during the periodfrom June to September, 2006 to collect details on education. A stratifiedsystematic random sampling method was followed in selecting thesample households from among each community present in the village.This exercise resulted in a sample of 327 households. Each of thesehouseholds was interviewed using a structured questionnaire. Case studiesand oral testimonies were also used to capture the complexities relatingto education.
4
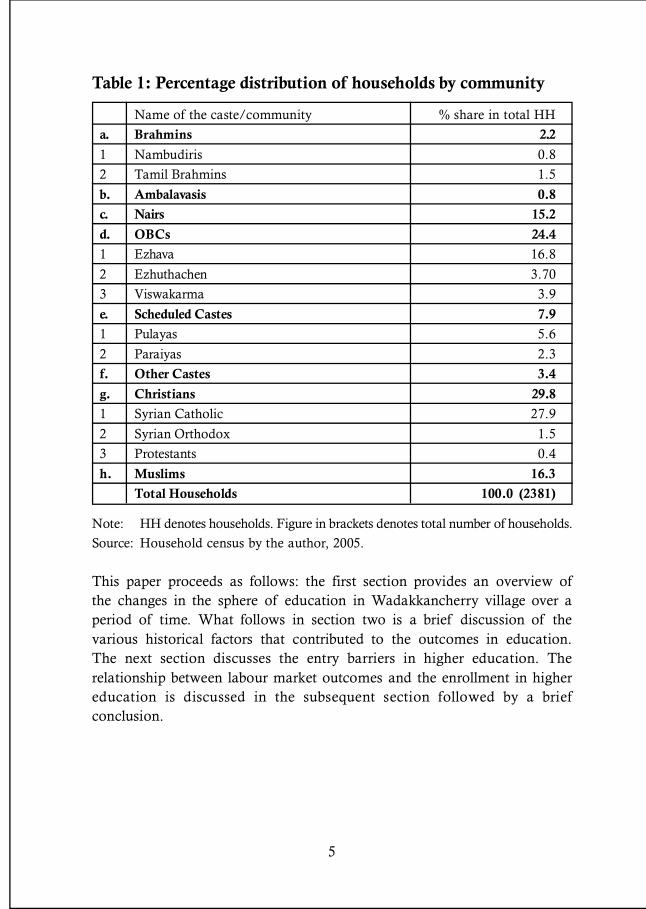
Table 1: Percentage distribution of households by community
Name of the caste/community % share in total HH
a. Brahmins 2.2
1 Nambudiris 0.8
2 Tamil Brahmins 1.5
b. Ambalavasis 0.8
c. Nairs 15.2
d. OBCs 24.4
1 Ezhava 16.8
2 Ezhuthachen 3.70
3 Viswakarma 3.9
e. Scheduled Castes 7.9
1 Pulayas 5.6
2 Paraiyas 2.3
f. Other Castes 3.4
g. Christians 29.8
1 Syrian Catholic 27.9
2 Syrian Orthodox 1.5
3 Protestants 0.4
h. Muslims 16.3
Total Households 100.0 (2381)
Note: HH denotes households. Figure in brackets denotes total number of households.
Source: Household census by the author, 2005.
This paper proceeds as follows: the first section provides an overview ofthe changes in the sphere of education in Wadakkancherry village over aperiod of time. What follows in section two is a brief discussion of thevarious historical factors that contributed to the outcomes in education.The next section discusses the entry barriers in higher education. Therelationship between labour market outcomes and the enrollment in highereducation is discussed in the subsequent section followed by a briefconclusion.
5
2. The Changes in Education in Wadakkancherry Village:An Overview
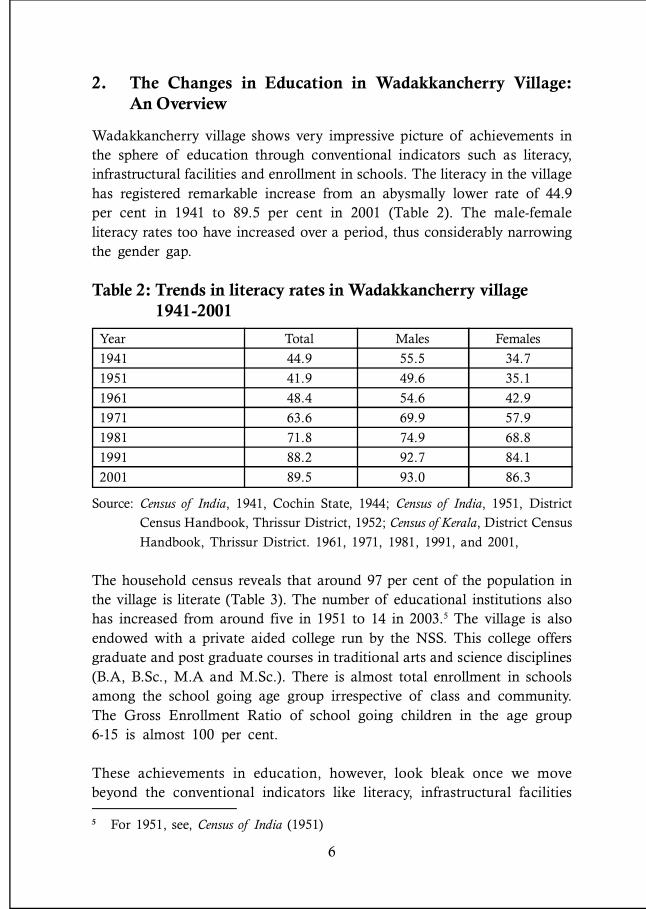
Wadakkancherry village shows very impressive picture of achievements inthe sphere of education through conventional indicators such as literacy,infrastructural facilities and enrollment in schools. The literacy in the villagehas registered remarkable increase from an abysmally lower rate of 44.9per cent in 1941 to 89.5 per cent in 2001 (Table 2). The male-femaleliteracy rates too have increased over a period, thus considerably narrowingthe gender gap.
Table 2: Trends in literacy rates in Wadakkancherry village 1941-2001
Year Total Males Females
1941 44.9 55.5 34.7
1951 41.9 49.6 35.1
1961 48.4 54.6 42.9
1971 63.6 69.9 57.9
1981 71.8 74.9 68.8
1991 88.2 92.7 84.1
2001 89.5 93.0 86.3
Source: Census of India, 1941, Cochin State, 1944; Census of India, 1951, District
Census Handbook, Thrissur District, 1952; Census of Kerala, District Census
Handbook, Thrissur District. 1961, 1971, 1981, 1991, and 2001,
The household census reveals that around 97 per cent of the population inthe village is literate (Table 3). The number of educational institutions alsohas increased from around five in 1951 to 14 in 2003.5 The village is alsoendowed with a private aided college run by the NSS. This college offersgraduate and post graduate courses in traditional arts and science disciplines(B.A, B.Sc., M.A and M.Sc.). There is almost total enrollment in schoolsamong the school going age group irrespective of class and community.The Gross Enrollment Ratio of school going children in the age group6-15 is almost 100 per cent.
These achievements in education, however, look bleak once we movebeyond the conventional indicators like literacy, infrastructural facilities
5 For 1951, see, Census of India (1951)
6
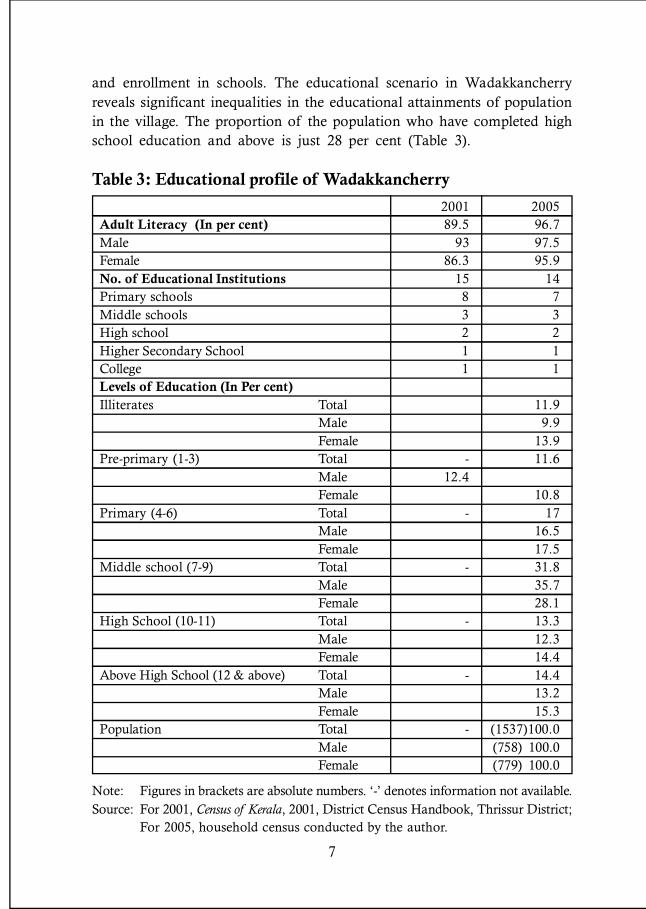
and enrollment in schools. The educational scenario in Wadakkancherryreveals significant inequalities in the educational attainments of populationin the village. The proportion of the population who have completed highschool education and above is just 28 per cent (Table 3).
Table 3: Educational profile of Wadakkancherry
2001 2005Adult Literacy (In per cent) 89.5 96.7Male 93 97.5Female 86.3 95.9No. of Educational Institutions 15 14Primary schools 8 7Middle schools 3 3High school 2 2Higher Secondary School 1 1College 1 1Levels of Education (In Per cent)Illiterates Total 11.9
Male 9.9Female 13.9
Pre-primary (1-3) Total - 11.6Male 12.4Female 10.8
Primary (4-6) Total - 17Male 16.5Female 17.5
Middle school (7-9) Total - 31.8Male 35.7Female 28.1
High School (10-11) Total - 13.3Male 12.3Female 14.4
Above High School (12 & above) Total - 14.4Male 13.2Female 15.3
Population Total - (1537)100.0Male (758) 100.0Female (779) 100.0
Note: Figures in brackets are absolute numbers. ‘-’ denotes information not available.Source: For 2001, Census of Kerala, 2001, District Census Handbook, Thrissur District;
For 2005, household census conducted by the author.
7
The highest proportion of the population belongs to the educational categoryof middle school completed (32 per cent) followed by high school completed(28 per cent) and then primary school completed (17 per cent). This meansthat the majority of the population (73 per cent) has not progressed beyondthe high school level.
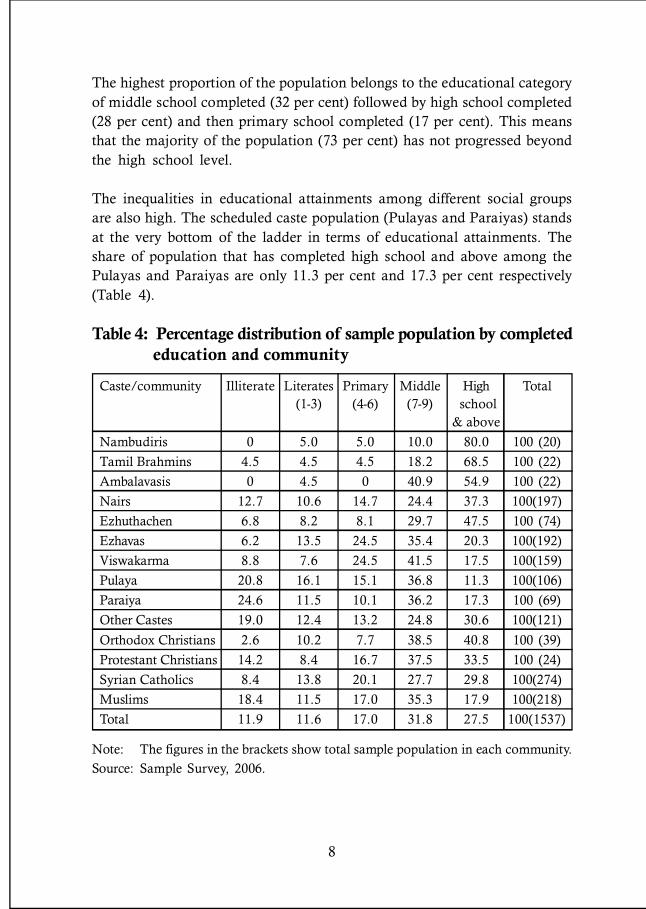
The inequalities in educational attainments among different social groupsare also high. The scheduled caste population (Pulayas and Paraiyas) standsat the very bottom of the ladder in terms of educational attainments. Theshare of population that has completed high school and above among thePulayas and Paraiyas are only 11.3 per cent and 17.3 per cent respectively(Table 4).
Table 4: Percentage distribution of sample population by completed education and community
Caste/community Illiterate Literates Primary Middle High Total(1-3) (4-6) (7-9) school
& above
Nambudiris 0 5.0 5.0 10.0 80.0 100 (20)
Tamil Brahmins 4.5 4.5 4.5 18.2 68.5 100 (22)
Ambalavasis 0 4.5 0 40.9 54.9 100 (22)
Nairs 12.7 10.6 14.7 24.4 37.3 100(197)
Ezhuthachen 6.8 8.2 8.1 29.7 47.5 100 (74)
Ezhavas 6.2 13.5 24.5 35.4 20.3 100(192)
Viswakarma 8.8 7.6 24.5 41.5 17.5 100(159)
Pulaya 20.8 16.1 15.1 36.8 11.3 100(106)
Paraiya 24.6 11.5 10.1 36.2 17.3 100 (69)
Other Castes 19.0 12.4 13.2 24.8 30.6 100(121)
Orthodox Christians 2.6 10.2 7.7 38.5 40.8 100 (39)
Protestant Christians 14.2 8.4 16.7 37.5 33.5 100 (24)
Syrian Catholics 8.4 13.8 20.1 27.7 29.8 100(274)
Muslims 18.4 11.5 17.0 35.3 17.9 100(218)
Total 11.9 11.6 17.0 31.8 27.5 100(1537)
Note: The figures in the brackets show total sample population in each community.
Source: Sample Survey, 2006.
8
The Muslims and the Viswakarmas too account for a lower share ineducational attainments. The share of the population who have completedhigh school and above are highest among upper castes such as the Brahmins(Nambudiris and Tamil Brahmins) and the Ambalavasis (55 per cent).
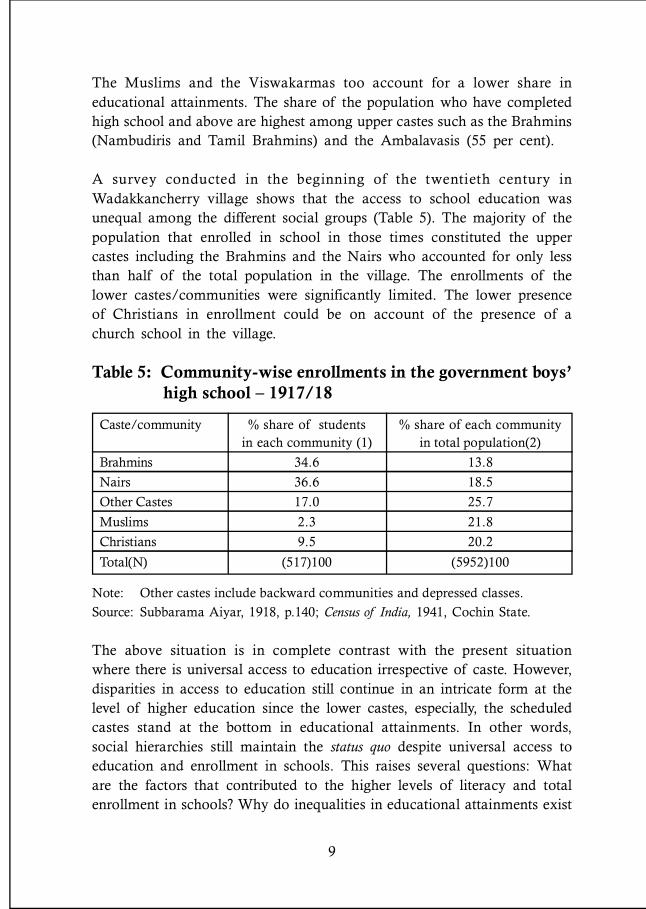
A survey conducted in the beginning of the twentieth century inWadakkancherry village shows that the access to school education wasunequal among the different social groups (Table 5). The majority of thepopulation that enrolled in school in those times constituted the uppercastes including the Brahmins and the Nairs who accounted for only lessthan half of the total population in the village. The enrollments of thelower castes/communities were significantly limited. The lower presenceof Christians in enrollment could be on account of the presence of achurch school in the village.
Table 5: Community-wise enrollments in the government boys’ high school – 1917/18
Caste/community % share of students % share of each communityin each community (1) in total population(2)
Brahmins 34.6 13.8
Nairs 36.6 18.5
Other Castes 17.0 25.7
Muslims 2.3 21.8
Christians 9.5 20.2
Total(N) (517)100 (5952)100
Note: Other castes include backward communities and depressed classes.
Source: Subbarama Aiyar, 1918, p.140; Census of India, 1941, Cochin State.
The above situation is in complete contrast with the present situationwhere there is universal access to education irrespective of caste. However,disparities in access to education still continue in an intricate form at thelevel of higher education since the lower castes, especially, the scheduledcastes stand at the bottom in educational attainments. In other words,social hierarchies still maintain the status quo despite universal access toeducation and enrollment in schools. This raises several questions: Whatare the factors that contributed to the higher levels of literacy and totalenrollment in schools? Why do inequalities in educational attainments exist
9
despite remarkable indicators in education? What are the various processesthrough which social hierarchies are reproduced through education regardlessof the ‘progressive’ intervention of the state? These issues are addressed inthe following sections.
3. An Outline of the History of Education in Wadakkancherry Village
Prior to the formation of unified Kerala, Wadakkancherry village was partof the erstwhile Cochin State, one of the princely states indirectly ruled bythe English under the subsidiary alliance system.6 The larger developmentsin the Cochin state such as the spread of commercialization, establishmentof modern bureaucracy, formulation of educational policies of the stateand emergence of community reform movements had their ownrepercussions on the educational scenario of the village of Wadakkancherry.It had its first modern school established in 1873 as part of Munro’s largerpolicy to create clerks and accountants for the state service.7 As discussedbefore, the access to education was monopolized by the upper castes in thevillage even as late as the dawn of the twentieth century. The access oflower castes/communities was substantially limited. According to the 1875Census of the Cochin state, the average daily attendance of the stateschool was nineteen and all the students were upper caste Hindus.8
The educational needs of the lower castes, during the early days whenmodern education was introduced, were met mainly through missionaryschools since Sirkar schools were not accessible or open to them.Wadakkancherry had one missionary school established by the ChurchMissionary Society (CMS).9 This was one of the first schools establishedin those times in the village. The fieldwork done in the village reveals thatmost of those who attended this school were from the Ezhava, non-catholic
6 The present state of Kerala was formed in 1956. Prior to this, the entire region was
divided into three political units, Travancore, Cochin and Malabar. Travancore,
like Cochin, was a princely state under the subsidiary alliance, while Malabar was
part of the Madras presidency directly ruled by the British.7 For a discussion on the emergence of modern bureaucracy, see, Jeffrey (1976:1-8)8 A General Report on the Census of Native Cochin (1875:49)9 The school authorities are not clear about the year of its establishment. According
to them it existed even in 1916.
10
Christian and poor Nair families. The teachers were mainly Christians andNairs. It should be noticed that the wealthy upper castes in the villagenever attended this school due to the social stigma attached to it on accountof the lower castes attending it. For instance, Valiayaparambu Mana, aNambudiri family who had ruling powers in the village, never sent theirwards for education in this school even though the family resided nearby.The elder son in this family received education through private tutors athome and the younger one attended a primary school established by a Nairfamily in the village. At present this school is an aided primary schoolunder the direct management of the Church of South India (CSI).
Besides the state school and the missionary school, there were a few schoolsthat were established and maintained by different communities that includedthe Syrian Catholics and Nairs. These schools mainly served the specificeducational needs of the respective communities.10 The Native SyrianCatholics established a school in 1916 in the village. Initially this schoolwas run in a building attached to the Church. Even though the majority ofthe students were drawn from the Catholic community, the school admittedstudents from all other communities. This school too is an aided primaryschool currently, managed directly by the Roman Catholic Church.
The growing demands for education by the Nairs in the village were mainlymet through a school established by a Nair family in 1938. The majorityof the teachers, both male and female, were drawn from the community.Prior to the establishment of this school, the Nairs were mainly dependenton the Ezhuthachens or the hereditary schoolmasters for their education. Itis possible that by the time the school was established a strong educatedgroup had already emerged within the community. In 1978 this primaryschool was taken over by the NSS, which also runs a private aided collegein the village.
10 These schools were mainly established as a result of social reform movements,
which emphasized the entry into modern education and government service as
the only way for emancipation. In the post-independent period these schools
were brought within the ambit of the private aided category. For a discussion
on social reform movements, see, Ramachandran (1999:308) and Saradamoni
(1980: 139-45).
11
It may be noted that the private educational institutions under the grant-in-aid system were brought within the ambit of the private aided categoryfollowing the formation of the Kerala state in 1956. Measures were alsoadopted to bring uniformity between private aided schools and state schoolsin the matter of pay scales and in terms of service conditions of theteachers. The state undertook the responsibility of direct payment of thesalaries to the teachers employed in the private aided sector, though theright to appoint the teachers still rests with the private managements.11
These institutions were mostly established under the aegis of communityorganizations who acted as pressure groups in demanding educationalinstitutions during the post–unification period. The need for more ‘resources’in education and the promise of employment opportunities encouragedthem to agitate for more educational institutions.12
At the same time, measures such as mid-day meals scheme, compulsoryeducation and compulsory promotion scheme were also adopted to increasethe enrollment rates in schools. The mid-day meal scheme, initially startedby the rulers of the princely states, continued even after the unification andproved to be a real inducement for the children to go to school. The statealso declared primary education as compulsory and education up to highersecondary as free, while the fee rates were kept extremely low. Anotherimportant measure to reduce the dropout rates in schools was thecompulsory promotion scheme enunciated in 1972-73. It came to the noticeof the educational authorities in the 1960s that the dropout rates werehigher among the grade repeaters. In order to rectify this, the ‘wholepromotion scheme’ was introduced. Initially it was applied to standards Iand II and later on was extended to the other standards too with an allowanceof about 10 per cent of the strength as the maximum which may bedetained in each standard. This policy succeeded in reducing the dropoutrates, though it has been criticized for the deterioration in the quality ofeducation in Kerala. Apart from these, the students are entitled to travelconcessions – they pay about 25 per cent of the actual fare - to and fromthe school.13
11 Usually these private managements make appointments against heavy donation.12 For a discussion of educational policies during post-independent period, see, Salim
and Nair (2002:174-213).13 Ibid.
12
Thus, the state both in the pre- and post-independence periods has playedan active role in the popularization of education among the masses. Theeducational policies in the post-independence period were largely a corollaryof the policies during the pre-independence period. The outcomes of thesemeasures are reflected in the higher levels of literacy, universal enrollmentin schools irrespective of class and caste and better educational facilities inthe village. But, as mentioned before, alongside the positive outcomes certaindisquieting tendencies relating to education exist in Wadakkancherry villagethat deserve serious attention.
4. Differentiated Access to Higher Education
The differentiated access to higher education played a decisive role inperpetuating disparities in Wadakkancherry village. Unequal anddiscriminatory access to higher education reproduces not only economicinequalities but also social inequalities.
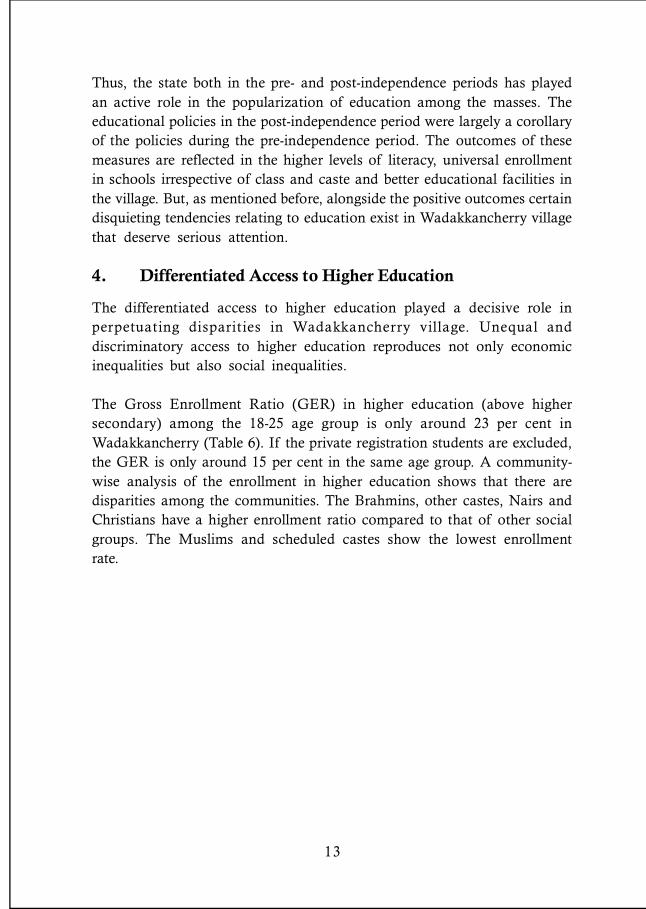
The Gross Enrollment Ratio (GER) in higher education (above highersecondary) among the 18-25 age group is only around 23 per cent inWadakkancherry (Table 6). If the private registration students are excluded,the GER is only around 15 per cent in the same age group. A community-wise analysis of the enrollment in higher education shows that there aredisparities among the communities. The Brahmins, other castes, Nairs andChristians have a higher enrollment ratio compared to that of other socialgroups. The Muslims and scheduled castes show the lowest enrollmentrate.
13
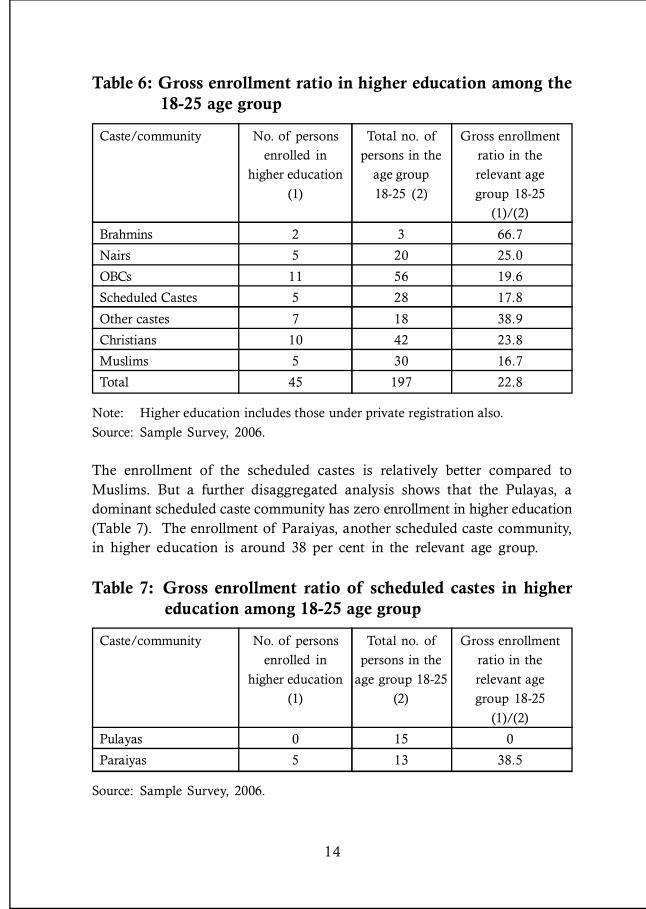
Table 6: Gross enrollment ratio in higher education among the 18-25 age group
Caste/community No. of persons Total no. of Gross enrollment
enrolled in persons in the ratio in the
higher education age group relevant age
(1) 18-25 (2) group 18-25
(1)/(2)
Brahmins 2 3 66.7
Nairs 5 20 25.0
OBCs 11 56 19.6
Scheduled Castes 5 28 17.8
Other castes 7 18 38.9
Christians 10 42 23.8
Muslims 5 30 16.7
Total 45 197 22.8
Note: Higher education includes those under private registration also.
Source: Sample Survey, 2006.
The enrollment of the scheduled castes is relatively better compared toMuslims. But a further disaggregated analysis shows that the Pulayas, adominant scheduled caste community has zero enrollment in higher education(Table 7). The enrollment of Paraiyas, another scheduled caste community,in higher education is around 38 per cent in the relevant age group.
Table 7: Gross enrollment ratio of scheduled castes in higher education among 18-25 age group
Caste/community No. of persons Total no. of Gross enrollment
enrolled in persons in the ratio in the
higher education age group 18-25 relevant age
(1) (2) group 18-25
(1)/(2)
Pulayas 0 15 0
Paraiyas 5 13 38.5
Source: Sample Survey, 2006.
14
An important reason for the lower enrollment in higher education could bethe higher dropouts in the tenth standard. The ratio of students in the 12th
standard in proportion to the 10th standard is only 0.68 (Table 8). Thismeans that major dropout happens soon after the 10th standard.
Table 8: Student enrollment in tenth and twelfth standards
Levels of education No. of students Ratio of students
currently enrolled in 12th standard
to 10th standard
Tenth standard 63
12th standard 43 0.68
Source: Sample Survey, 2006.
The share of the population who has completed the 9th standard is thehighest followed by those finished the 10th standard. This implies thatmajority of the population in this village fail to complete the 10th standardand those who do so fail to enroll for higher education. To address thequestion of why many persons drop out from education after the 10th
standard, certain tentative explanations are attempted.
One possible reason for higher dropouts in the 10th standard could be thelack of adequate educational facilities in Wadakkancherry village forpursuing higher secondary education. More than half of the students enrolledfor higher secondary education depend on the unaided private schools inthe neighbouring villages because of the inadequate government initiativeat that level. In fact, Wadakkancherry village has only one government-runhigher secondary school for both boys and girls. Another possible reasoncould be the lower pass percentage in the 10th standard. The pass percentagein the 10th standard in the Wadakkancherry boy’s high school (the onlyhigh school for boys) and the girl’s high school (the only high school forgirls) is only 40 per cent and 61 per cent respectively (Development Report,2002:61). Such a lower pass percentage naturally compels many to dropout of the education at this stage. The failure to complete the 10th standardis in a sense an upshot of the compulsory education scheme promoted bythe state. The scheme has succeeded in reducing the dropout rates in thelower standards, but has increased dropouts at the higher levels. This findingfortifies our hypothesis that the fewer enrollments in higher education could
15
be because of the higher dropouts in the 10th standard and also due to theentry barriers in higher education.
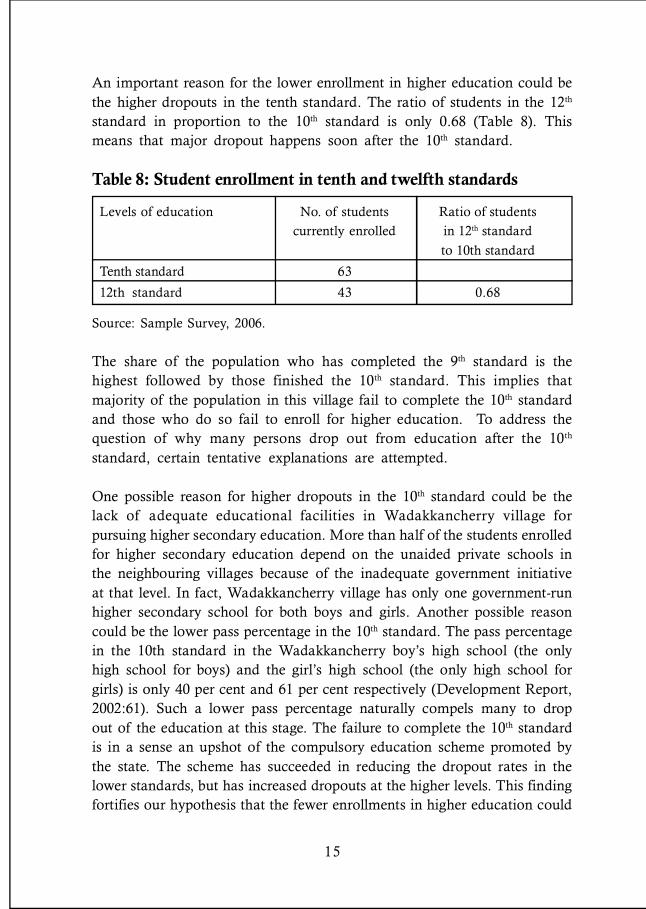
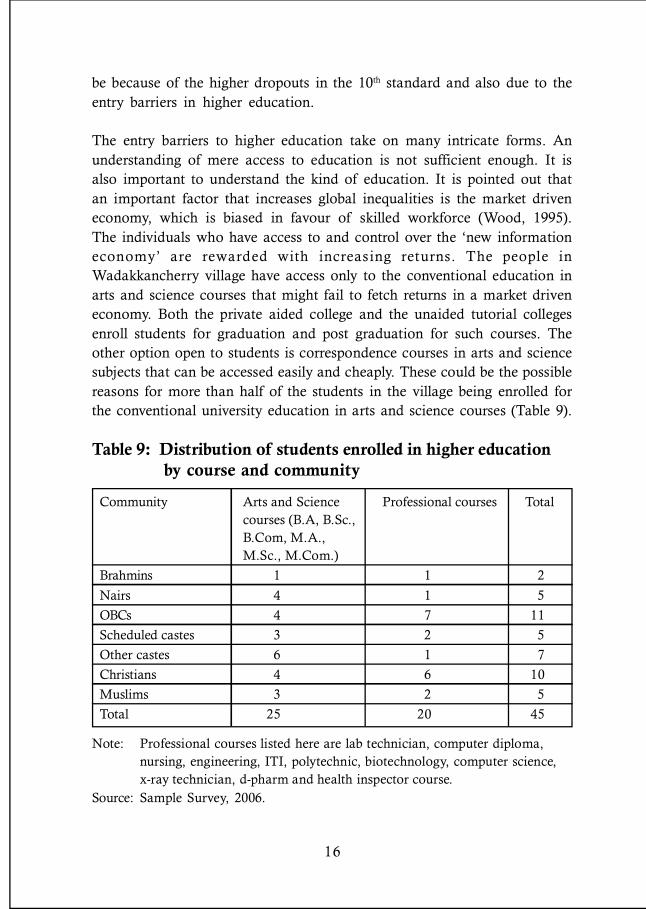
The entry barriers to higher education take on many intricate forms. Anunderstanding of mere access to education is not sufficient enough. It isalso important to understand the kind of education. It is pointed out thatan important factor that increases global inequalities is the market driveneconomy, which is biased in favour of skilled workforce (Wood, 1995).The individuals who have access to and control over the ‘new informationeconomy’ are rewarded with increasing returns. The people inWadakkancherry village have access only to the conventional education inarts and science courses that might fail to fetch returns in a market driveneconomy. Both the private aided college and the unaided tutorial collegesenroll students for graduation and post graduation for such courses. Theother option open to students is correspondence courses in arts and sciencesubjects that can be accessed easily and cheaply. These could be the possiblereasons for more than half of the students in the village being enrolled forthe conventional university education in arts and science courses (Table 9).
Table 9: Distribution of students enrolled in higher education by course and community
Community Arts and Science Professional courses Totalcourses (B.A, B.Sc.,B.Com, M.A.,M.Sc., M.Com.)
Brahmins 1 1 2
Nairs 4 1 5
OBCs 4 7 11
Scheduled castes 3 2 5
Other castes 6 1 7
Christians 4 6 10
Muslims 3 2 5
Total 25 20 45
Note: Professional courses listed here are lab technician, computer diploma,nursing, engineering, ITI, polytechnic, biotechnology, computer science,x-ray technician, d-pharm and health inspector course.
Source: Sample Survey, 2006.
16
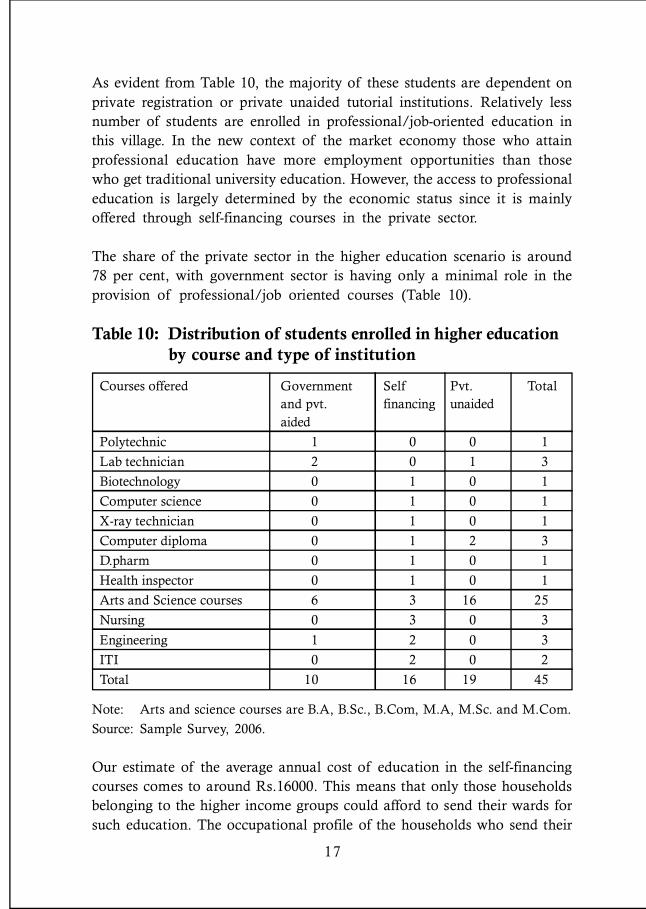
As evident from Table 10, the majority of these students are dependent onprivate registration or private unaided tutorial institutions. Relatively lessnumber of students are enrolled in professional/job-oriented education inthis village. In the new context of the market economy those who attainprofessional education have more employment opportunities than thosewho get traditional university education. However, the access to professionaleducation is largely determined by the economic status since it is mainlyoffered through self-financing courses in the private sector.
The share of the private sector in the higher education scenario is around78 per cent, with government sector is having only a minimal role in theprovision of professional/job oriented courses (Table 10).
Table 10: Distribution of students enrolled in higher education by course and type of institution
Courses offered Government Self Pvt. Totaland pvt. financing unaidedaided
Polytechnic 1 0 0 1
Lab technician 2 0 1 3
Biotechnology 0 1 0 1
Computer science 0 1 0 1
X-ray technician 0 1 0 1
Computer diploma 0 1 2 3
D.pharm 0 1 0 1
Health inspector 0 1 0 1
Arts and Science courses 6 3 16 25
Nursing 0 3 0 3
Engineering 1 2 0 3
ITI 0 2 0 2
Total 10 16 19 45
Note: Arts and science courses are B.A, B.Sc., B.Com, M.A, M.Sc. and M.Com.
Source: Sample Survey, 2006.
Our estimate of the average annual cost of education in the self-financingcourses comes to around Rs.16000. This means that only those householdsbelonging to the higher income groups could afford to send their wards forsuch education. The occupational profile of the households who send their
17
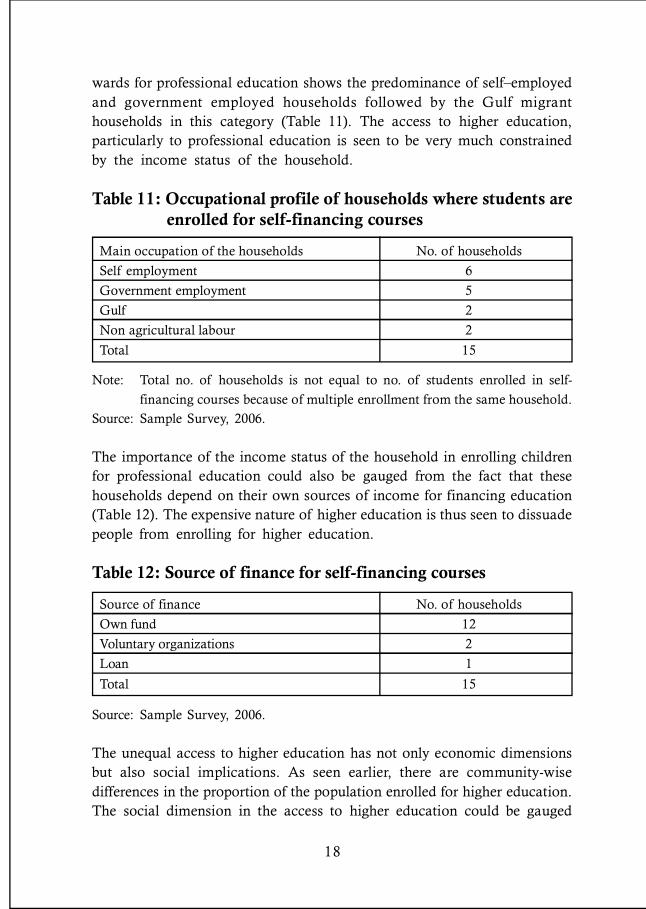
wards for professional education shows the predominance of self–employedand government employed households followed by the Gulf migranthouseholds in this category (Table 11). The access to higher education,particularly to professional education is seen to be very much constrainedby the income status of the household.
Table 11: Occupational profile of households where students are enrolled for self-financing courses
Main occupation of the households No. of households
Self employment 6
Government employment 5
Gulf 2
Non agricultural labour 2
Total 15
Note: Total no. of households is not equal to no. of students enrolled in self-
financing courses because of multiple enrollment from the same household.
Source: Sample Survey, 2006.
The importance of the income status of the household in enrolling childrenfor professional education could also be gauged from the fact that thesehouseholds depend on their own sources of income for financing education(Table 12). The expensive nature of higher education is thus seen to dissuadepeople from enrolling for higher education.
Table 12: Source of finance for self-financing courses
Source of finance No. of households
Own fund 12
Voluntary organizations 2
Loan 1
Total 15
Source: Sample Survey, 2006.
The unequal access to higher education has not only economic dimensionsbut also social implications. As seen earlier, there are community-wisedifferences in the proportion of the population enrolled for higher education.The social dimension in the access to higher education could be gauged
18
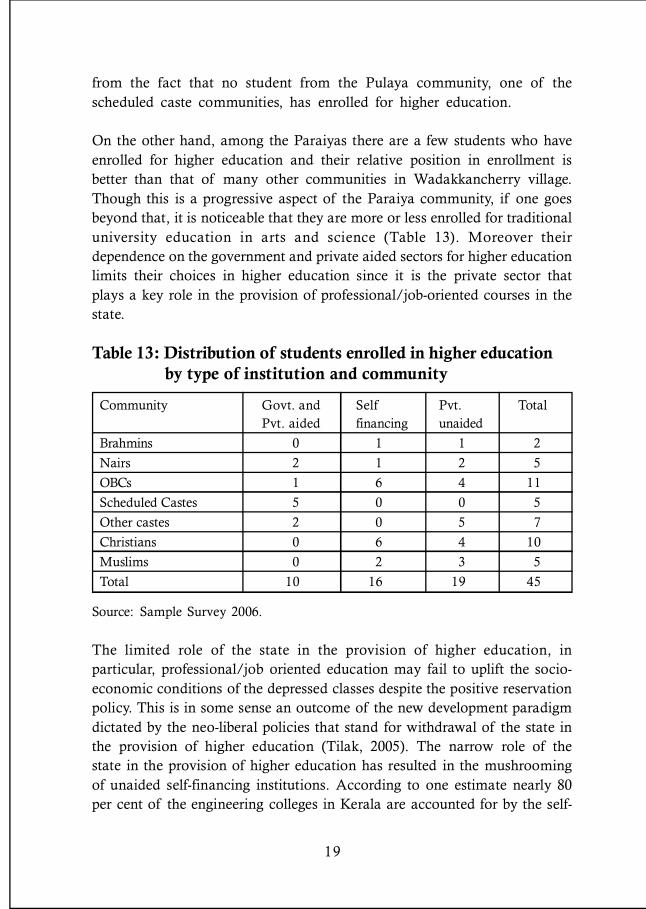
from the fact that no student from the Pulaya community, one of thescheduled caste communities, has enrolled for higher education.
On the other hand, among the Paraiyas there are a few students who haveenrolled for higher education and their relative position in enrollment isbetter than that of many other communities in Wadakkancherry village.Though this is a progressive aspect of the Paraiya community, if one goesbeyond that, it is noticeable that they are more or less enrolled for traditionaluniversity education in arts and science (Table 13). Moreover theirdependence on the government and private aided sectors for higher educationlimits their choices in higher education since it is the private sector thatplays a key role in the provision of professional/job-oriented courses in thestate.
Table 13: Distribution of students enrolled in higher education by type of institution and community
Community Govt. and Self Pvt. TotalPvt. aided financing unaided
Brahmins 0 1 1 2
Nairs 2 1 2 5
OBCs 1 6 4 11
Scheduled Castes 5 0 0 5
Other castes 2 0 5 7
Christians 0 6 4 10
Muslims 0 2 3 5
Total 10 16 19 45
Source: Sample Survey 2006.
The limited role of the state in the provision of higher education, inparticular, professional/job oriented education may fail to uplift the socio-economic conditions of the depressed classes despite the positive reservationpolicy. This is in some sense an outcome of the new development paradigmdictated by the neo-liberal policies that stand for withdrawal of the state inthe provision of higher education (Tilak, 2005). The narrow role of thestate in the provision of higher education has resulted in the mushroomingof unaided self-financing institutions. According to one estimate nearly 80per cent of the engineering colleges in Kerala are accounted for by the self-
19
financing system (Nair and Nair, 2008:6). This privatization policy makesprofessional/job-oriented courses virtually inaccessible to economically andsocially vulnerable groups.
There are several instances in the village where many of the students hadto discontinue studies because of their inability to pay for self-financingcourses. To cite a typical case, Suja is the daughter of a railway gang-manand belongs to the Paraiya caste. She is a graduate in library science andwanted to pursue her studies up to the master’s level as she found itnecessary for employment prospects. But to her dismay she could not findany government institution that offers post graduation in library sciencewith good infrastructure facilities. Most of the institutions both in thegovernment and in the private aided sectors offer this course as a self -financing one. Since she was unable to pay the fees demanded by suchinstitutions, she had to drop the idea of pursuing higher studies. Subsequently,she had to settle for a job as an accountant in a private enterprise in thevillage earning just around Rs. 2000 per month.
This case study signals the limited choices that economically and sociallyvulnerable groups in this village have in higher education. The peripheralrole that the government plays renders higher education beyond the reachof vulnerable groups. As a result higher education fails to assume the roleof an ‘equalizer’. Such a situation is especially relevant for the scheduledcastes, who are mostly labourers.
5. Labour Market Outcomes
The enrollment in higher education depends on the potentialities of bothemployment and earnings. As indicated earlier, the share of the populationenrolled for higher education is less in Wadakkancherry village despitehigher levels of literacy, universal enrollment among school going age groupsand reasonably better facilities available for pursuing higher education. Peopleseem to be discouraged from pursuing higher education as chances ofemployment and levels of earnings are less among the educated groups.
The fact that mere access to education has failed to uplift the economicallyand socially vulnerable groups is quite evident from the employment patternof the Scheduled castes in Wadakkancherry village. Barring the dependantsincluding students and housewives who form half of village population,
20
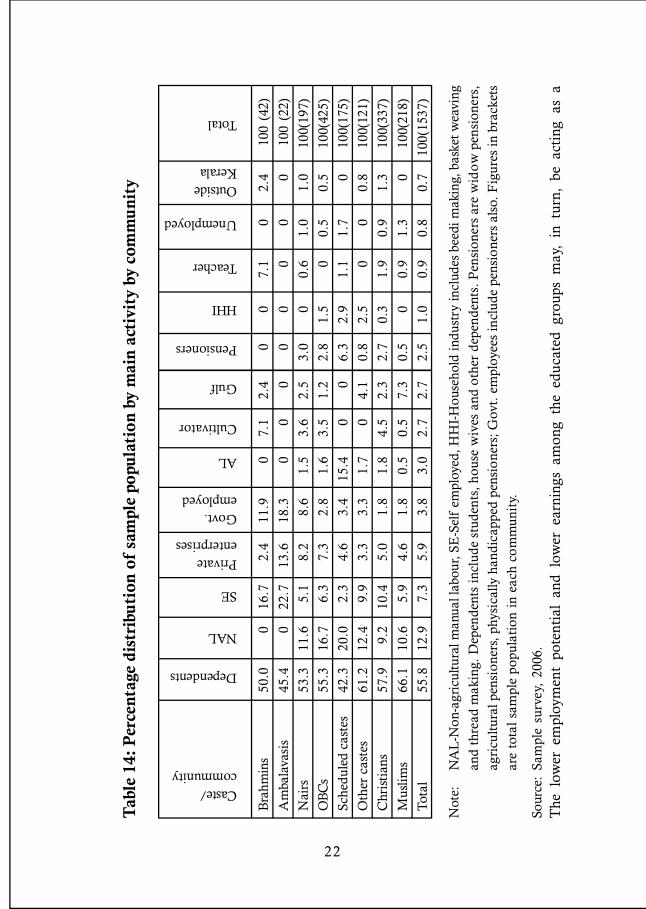
majority of the people in the village are engaged in non-agricultural pursuits(Table 14). This is quite unlike the villages in other parts of India. Thehighest proportion of the working population is engaged in occupationssuch as non-agricultural labour (12.9 per cent), self- employment (7.3 percent), working with private enterprises (5.9 per cent), governmentemployment (3.8 per cent), agricultural labor (3.0 per cent) and cultivators(2.7 per cent).
The differences in the employment patterns between the scheduled andother castes in the village are also noteworthy. Firstly, the share of manuallabour both in the agricultural and the non-agricultural labour sectors is thehighest among the scheduled castes. This means that access to education/higher education has failed to elevate them from their downtrodden status.Secondly, their presence in the new sources of ‘mobility’ like migration,both within and outside the country, is nil. The total absence of the scheduledcastes in the migration profile of the village needs special enquiry and isbeyond the scope of the present study. Thirdly, the scheduled castes arealso conspicuously absent in the traditional sources of ‘power’ likecultivation. This is not surprising given the fact that these castes - theformer slave castes - continue to position at the bottom of the ladder interms of land ownership (Scaria, 2008). Lastly but not less importantly, thehighest incidence of unemployment in the village is among these castes.Within the scheduled castes, unemployment is especially prevalent amongthe Paraiyas. This is surprising since the Paraiyas as a community showvery impressive enrollment rates in higher education. The lower employmentpotential of traditional university education and the minimal role of thestate in the provision of professional/job oriented courses could be thepossible reasons for the higher rates of unemployment among scheduledcastes.
21
Bra
hmin
s50
.00
16.7
2.4
11.9
07.
12.
40
07.
10
2.4
100
(42)
Am
bala
vasi
s45
.40
22.7
13.6
18.3
00
00
00
00
100
(22)
Nai
rs53
.311
.65.
18.
28.
61.
53.
62.
53.
00
0.6
1.0
1.0
100(
197)
OB
Cs
55.3
16.7
6.3
7.3
2.8
1.6
3.5
1.2
2.8
1.5
00.
50.
510
0(42
5)
Sche
dule
d ca
stes
42.3
20.0
2.3
4.6
3.4
15.4
00
6.3
2.9
1.1
1.7
010
0(17
5)
Oth
er c
aste
s61
.212
.49.
93.
33.
31.
70
4.1
0.8
2.5
00
0.8
100(
121)
Chr
isti
ans
57.9
9.2
10.4
5.0
1.8
1.8
4.5
2.3
2.7
0.3
1.9
0.9
1.3
100(
337)
Mus
lims
66.1
10.6
5.9
4.6
1.8
0.5
0.5
7.3
0.5
00.
91.
30
100(
218)
Tot
al55
.812
.97.
35.
93.
83.
02.
72.
72.
51.
00.
90.
80.
710
0(15
37)
Not
e:N
AL
-Non
-agr
icul
tura
l man
ual l
abou
r, S
E-S
elf
empl
oyed
, HH
I-H
ouse
hold
indu
stry
incl
udes
bee
di m
akin
g, b
aske
t wea
ving
and
thr
ead
mak
ing.
Dep
ende
nts
incl
ude
stud
ents
, hou
se w
ives
and
oth
er d
epen
dent
s. P
ensi
oner
s ar
e w
ido
w p
ensi
oner
s,
agri
cult
ural
pen
sion
ers,
phy
sica
lly h
andi
capp
ed p
ensi
one
rs; G
ovt.
em
ploy
ees
incl
ude
pens
ione
rs a
lso.
Fig
ures
in b
rack
ets
are
tota
l sa
mpl
e po
pula
tion
in
each
co
mm
unit
y.
Sour
ce:
Sam
ple
surv
ey,
2006
.T
he l
ower
em
ploy
men
t po
tent
ial
and
low
er e
arni
ngs
amon
g th
e ed
ucat
ed g
roup
s m
ay,
in t
urn,
be
acti
ng a
s a
Tab
le 1
4: P
erce
ntag
e di
stri
buti
on o
f sa
mpl
e po
pula
tion
by
mai
n a
ctiv
ity
by c
omm
uni
tyCaste/community
Dependents
NAL
SE
Privateenterprises
Govt.employed
AL
Cultivator
Gulf
Pensioners
HHI
Teacher
Unemployed
OutsideKerala
Total
22
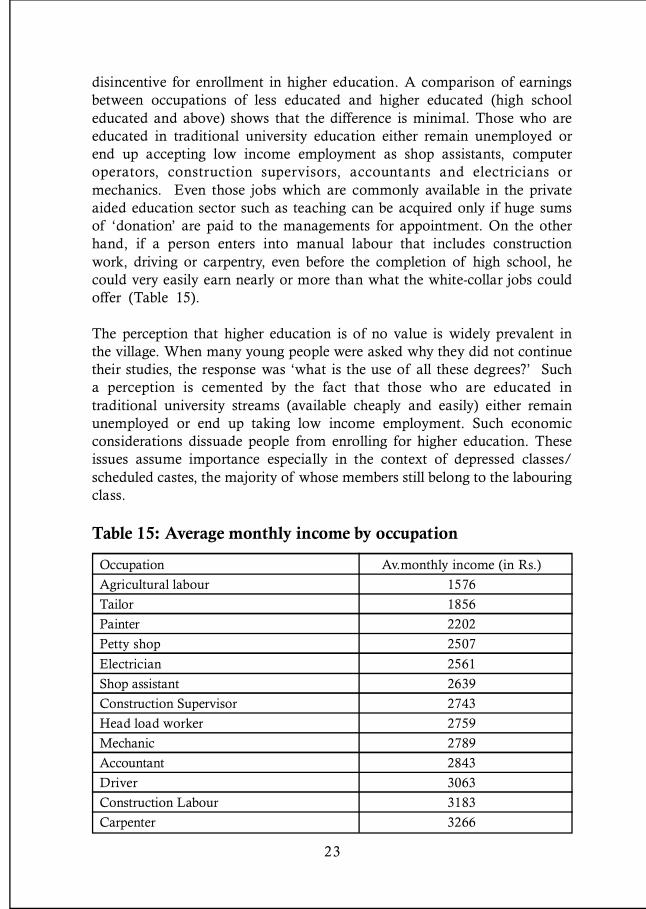
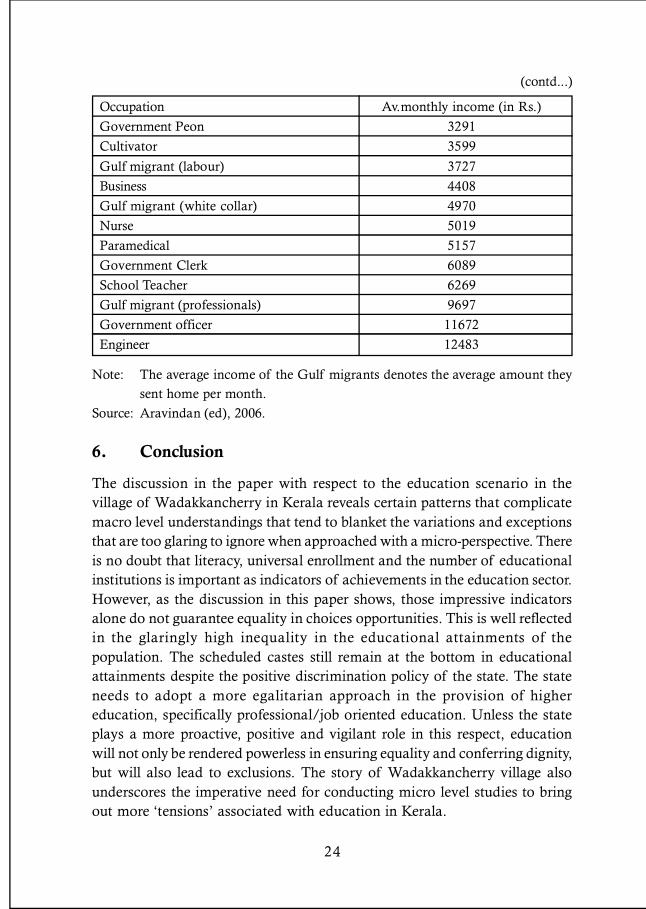
disincentive for enrollment in higher education. A comparison of earningsbetween occupations of less educated and higher educated (high schooleducated and above) shows that the difference is minimal. Those who areeducated in traditional university education either remain unemployed orend up accepting low income employment as shop assistants, computeroperators, construction supervisors, accountants and electricians ormechanics. Even those jobs which are commonly available in the privateaided education sector such as teaching can be acquired only if huge sumsof ‘donation’ are paid to the managements for appointment. On the otherhand, if a person enters into manual labour that includes constructionwork, driving or carpentry, even before the completion of high school, hecould very easily earn nearly or more than what the white-collar jobs couldoffer (Table 15).
The perception that higher education is of no value is widely prevalent inthe village. When many young people were asked why they did not continuetheir studies, the response was ‘what is the use of all these degrees?’ Sucha perception is cemented by the fact that those who are educated intraditional university streams (available cheaply and easily) either remainunemployed or end up taking low income employment. Such economicconsiderations dissuade people from enrolling for higher education. Theseissues assume importance especially in the context of depressed classes/scheduled castes, the majority of whose members still belong to the labouringclass.
Table 15: Average monthly income by occupation
Occupation Av.monthly income (in Rs.)
Agricultural labour 1576
Tailor 1856
Painter 2202
Petty shop 2507
Electrician 2561
Shop assistant 2639
Construction Supervisor 2743
Head load worker 2759
Mechanic 2789
Accountant 2843
Driver 3063
Construction Labour 3183
Carpenter 3266
23
Occupation Av.monthly income (in Rs.)
Government Peon 3291
Cultivator 3599
Gulf migrant (labour) 3727
Business 4408
Gulf migrant (white collar) 4970
Nurse 5019
Paramedical 5157
Government Clerk 6089
School Teacher 6269
Gulf migrant (professionals) 9697
Government officer 11672
Engineer 12483
Note: The average income of the Gulf migrants denotes the average amount they
sent home per month.
Source: Aravindan (ed), 2006.
6. Conclusion
The discussion in the paper with respect to the education scenario in thevillage of Wadakkancherry in Kerala reveals certain patterns that complicatemacro level understandings that tend to blanket the variations and exceptionsthat are too glaring to ignore when approached with a micro-perspective. Thereis no doubt that literacy, universal enrollment and the number of educationalinstitutions is important as indicators of achievements in the education sector.However, as the discussion in this paper shows, those impressive indicatorsalone do not guarantee equality in choices opportunities. This is well reflectedin the glaringly high inequality in the educational attainments of thepopulation. The scheduled castes still remain at the bottom in educationalattainments despite the positive discrimination policy of the state. The stateneeds to adopt a more egalitarian approach in the provision of highereducation, specifically professional/job oriented education. Unless the stateplays a more proactive, positive and vigilant role in this respect, educationwill not only be rendered powerless in ensuring equality and conferring dignity,but will also lead to exclusions. The story of Wadakkancherry village alsounderscores the imperative need for conducting micro level studies to bringout more ‘tensions’ associated with education in Kerala.
24
(contd...)
References
Aravindan, K.P (ed), 2006, Keralam Engane Jeevikunne? Keralam EnganeChintikkunu? (Mal) (How Kerala lives? How Kerala Thinks?), Kozhikode:Kerala Shastra Sahitya Parishad.
Bardhan, Pranab (ed), 1989, Conversation between Economists andAnthropologists, New Delhi: Oxford University Press.
Breman, Jan, Peter Kloos and Ashwani Saith (eds), 1997, The Village inAsia Revisited, New Delhi: Oxford University Press.
Breman, Jan, 2007, The Poverty Regime in Village India: Half a Centuryof Work and Life at the Bottom of the Rural Economy in South Gujarat,New Delhi: Oxford University Press.
Chandrasekhar, C.P., V.K. Ramachandran and R.Ramakumar 2001,‘Issues in School Education in Contemporary Kerala’, Paper prepared forUNICEF, New Delhi.
Cochin, Census Operations, 1944, Census of India 1941, Vol. XIX, Cochin,Pt. I & II. Cochin.
Deshpande, Ashwini, 2001,’Does Caste Still Define Disparity? A Lookat Inequality in Kerala, India’, The American Economic Review, Vol.90 (2),January 7-9.
Franke, Richard W. and Barbara H. Chasin, 1999, ‘Is Kerala ModelSustainable? Lessons from the Past: Prospects for the Future’, in M.A.Oommen (ed) Kerala’s Development Experience, Vol.I, New Delhi: ConceptPublishing Company.
George, K.K., 2006, ‘Kerala’s Education System: an Insider’s View’, inJoseph Tharamangalam (ed) Kerala: the Paradoxes of Public Action andDevelopment, Hyderabad: Orient Longman.
Government of Kerala, 2007, Indicators of Kerala Development, Departmentof Economics and Statistics, Thiruvananthapuram.
Government of Kerala, 2007, Economic Review: 2006, State Planning Board,Trivandrum.
25
India Census, 1877, A General Report on the Census of Native Cochin, 1875,Madras.
India, Census Commissioner, 1952, Census of India, 1951, Travancore-Cochin, District Census Handbook, Thrissur District.
India, Census Commissioner, Census of Kerala, 1961, 1971, 1981, 1991,2001, District Census Handbook, Thrissur District.
Jeffrey, Robin, 1976, The Decline of Nair Dominance, New Delhi: ManoharPublishers.
Kurien, C.T., 1995, ‘Kerala’s Development Experience: Random Commentsabout the Past and Some Considerations for the Future’, Social Scientist,Vol.23 (1-3).
Mencher, Joan P., 1980, ‘The Lessons and Non-Lessons of Kerala:Agricultural Labourers and Poverty’, Economic and Political Weekly,Vol.15 (41/43), October.
Nair, K.N and P.R Gopinathan Nair (eds), 2008, Higher Education in Kerala:Micro level Perspectives, Delhi: Daanish Books.
Omvedt, Gail, 2006, ‘Kerala is part of India: The Kerala Model ofDevelopment, Dalits and Globalisation’, in Joseph Tharamangalam (ed)Kerala: The Paradoxes of Public Action and Development, New Delhi: OrientLongman.
Prakash, Ved, 2007, ‘Trends in Growth and Financing of Higher Educationin India’, Economic and Political Weekly, Vol.42 (31), August 4-10.
Ramachandran, V.K., 1999, ‘On Kerala’s Development Achievements’, inJean Dreze and Amartya Sen (eds) Indian Development: Selected RegionalPerspectives, New Delhi: Oxford University Press.
Saith, Ashwani, 2005, ‘Poverty lines versus the Poor: Method versusMeaning’, Economic and Political Weekly, Vol. 40 (43), October 22 – 28.
Scaria, Suma, 2008, Developmental Trajectories of a Kerala Village: Land,Education, Health and Women in Wadakkancherry, PhD thesis submitted tothe Department of Economics, University of Hyderabad, Hyderabad.
26
Saradamoni, K., 1980, Emergence of a slave Caste: Pulayas of Kerala, NewDelhi: People’s Publishing House.
Saradamoni, K., 2006, ‘Women and the Changed Family in Kerala: SomeMasked Realities’ in Joseph Tharamangalam (ed) Kerala: The Paradoxes ofPublic Action and Development, New Delhi: Orient Longman.
Salim, A. Abdul and P.R Gopinathan Nair., 2002, Educational Developmentin India: The Kerala Experience since 1800, New Delhi: Anmol PublishersPrivate Limited.
Sen, Amartya, 2000, Development as Freedom, New Delhi: Oxford UniversityPress.
Subbarama Aiyar, S., 1918, ‘Watakanchery, Talapally Taluk’, in GilbertSlater (ed) Some South Indian Villages, Humphrey Milford: Oxford UniversityPress.
Tilak, Jandhyala B.G., 2005, ‘Higher Education in ‘Trishanku’: Hangingbetween State and Market’, Economic and Political Weekly, Vol.40 (37),September 10 - 16.
United Nations and Centre for Development Studies (UN/CDS), 1975,Poverty, Unemployment and Development Policy: A Case Study of Selected Issueswith reference to Kerala, New York: United Nations.
Varghese, N.V., 1999, ‘Access versus Achievement: A Study of PrimaryEducation in Kerala’, in M.A. Oommen (ed) Kerala’s Development ExperienceII, New Delhi: Concept Publishing Company.
Wadakkancherry Gram Panchayat, 1997, 2002, Development Reports.
Wood, Adrian, 1995, ‘How Trade hurt Unskilled Workers’, in Journal ofEconomic Perspectives, Vol.9 (3).
27
THE GIDR WORKING PAPER SERIES (No. 140 onwards)
140*. Uma Rani, “Economic Growth, Labour Markets and Gender inJapan”, July 2003. Rs. 45.
141*. R. Parthasarathy and Jharna Pathak, “The Guiding Visible Hand ofParticipatory Approaches to Irrigation Management “, August 2003.Rs. 30.
142*. Keshab Das, “Competition and Response in Small Firm Clusters:Two Cases from Western India”, September 2003. Rs. 30.
143. B.L. Kumar, “Target Free Approach for Family Welfare in Gujarat:A Review of Policy and Its Implementation”, October 2003.Rs. 40.
144*. Amita Shah, “Economic Rationale, Subsidy and Cost Sharing forWatershed Projects: Imperatives for Institutions and MarketDevelopment”, March 2004. Rs. 35.
145. B.L. Kumar, “Tribal Education in Gujarat: An Evaluation ofEducational Incentive Schemes”, June 2004. Rs. 45.
146*. R. Parthasarathy, “Objects and Accomplishments of ParticipatoryIrrigation Management Programme in India: An Open Pair ofScissors”, July 2004. Rs. 40.
147. R. Parthasarathy, “Decentralisation Trajectories with MultipleInstitutions: The Case of PIM Programme in India”, August 2004.Rs. 30.
148*. Amita Shah, “Linking Conservation with Livelihood: Lessonsfrom Management of Gir-Protected Area in Western India”,September 2004. Rs. 40.
149. B.L. Kumar, “Primary Health Care in Gujarat: Evidence onUtilization, Mismatches and Wastage”, October 2004. Rs. 40.
28
150. B.L. Kumar, “Schools and Schooling in Tribal Gujarat: The QualityDimension”, November 2004. Rs. 35.
151*. N. Lalitha, “A Review of the Pharmaceutical Industry of Canada”,December 2004. Rs. 35.
152. Satyajeet Nanda, “Micro Determinants of Human Fertility: Studyof Selected Physiological and Behavioural Variables in SC and STPopulation”, January 2005. Rs. 35.
153*. Jaya Prakash Pradhan, “Outward Foreign Direct Investment fromIndia: Recent Trends and Patterns”, February 2005. Rs. 35.
154*. Puttaswamaiah S., “Drinking Water Supply: Environmental Problems,Causes, Impacts and Remedies – Experiences from Karnataka”,March 2005. Rs. 35.
155*. Keshab Das and Pritee Sharma, “Potable Water for the Rural Poorin Arid Rajasthan: Traditional Water Harvesting as an Option”,March 2005. Rs. 30.
156. Jaya Prakash Pradhan and Vinoj Abraham, “Attracting Export-Oriented FDI: Can India Win the Race?”, April 2005. Rs. 30.
157*. Jaya Prakash Pradhan and Puttaswamaiah S., “Trends and Patternsof Technology Acquisition in Indian Organized Manufacturing: AnInter-industry Exploration”, May 2005. Rs. 50.
158*. Keshab Das and Ruchi Gupta, “Management by Participation?Village Institutions and Drinking Water Supply in Gujarat”,June 2005. Rs. 30. (OS)
159*. Keshab Das, “Industrial Clusters in India: Perspectives and Issuesfor Research”, July 2005. Rs. 30. (OS)
160. Jeemol Unni and Uma Rani, “Home-based Work in India:A Disappearing Continuum of Dependence?”, August 2005.Rs. 35. (OS)
29
161*. N. Lalitha, “Essential Drugs in Government Healthcare: EmergingModel of Procurement and Supply”, September 2005. Rs. 35.(OS)
162*. Puttaswamaiah S., Ian Manns and Amita Shah, “PromotingSustainable Agriculture: Experiences from India and Canada”,October 2005. Rs. 35. (OS)
163. Amalendu Jyotishi, “Transcending Sustainability beyond CBA:Conceptual Insights from Empirical Study on Shifting Cultivationin Orissa”, November 2005. Rs. 30. (OS)
164. Sashi Sivramkrishna and Amalendu Jyotishi, “MonopsonisticExploitation in Contract Farming: Articulating a Strategy for GrowerCooperation”, December 2005. Rs. 30. (OS)
165. Keshab Das, “Infrastructure and Growth in a Regional Context:Indian States since the 1980s”, December 2005. Rs. 30. (OS)
166. Leela Visaria, Alka Barua and Ramkrishna Mistry, “MedicalAbortion: Some Exploratory Findings from Gujarat”, January 2006.Rs. 35.
167*. Manoj Alagarajan and P.M. Kulkarni, “Trends in ReligiousDifferentials in Fertility, Kerala, India: An Analysis of Birth Interval”,February 2006. Rs. 30. (OS)
168*. N. Lalitha and Diana Joseph, “Patents and Biopharmaceuticals inIndia: Emerging Issues, March 2006. Rs. 35.
169. Sashi Sivramkrishna and Amalendu Jyotishi, “Hobbes, Coase andBaliraja: Equity and Equality in Surface Water Distribution”,April 2006. Rs. 30.
170. Amita Shah, “Changing Interface Between Agriculture and Livestock:A Study of Livelihood Options under Dry Land Farming Systemsin Gujarat”, May 2006. Rs. 35.
30
171*. Keshab Das, “Micro and Small Enterprises during Reforms: Policyand Concerns”, July 2006. Rs. 25.
172*. Keshab Das, “Electricity and Rural Development Linkage”, August2006. Rs. 30.
173. Keshab Das, “Traditional Water Harvesting for Domestic Use:Potential and Relevance of Village Tanks in Gujarat’s Desert Region”,November 2006. Rs. 30.
174*. Samira Guennif and N. Lalitha, “TRIPS Plus Agreements and Issuesin Access to Medicines in Developing Countries”, May 2007.Rs. 30.
175*. N. Lalitha, “Government Intervention and Prices of Medicines:Lessons from Tamil Nadu”, July 2007. Rs. 30.
176*. Amita Shah and Jignasu Yagnik, “Estimates of BPL-households inRural Gujarat: Measurement, Spatial Pattern and Policy Imperatives”,August 2007. Rs. 35.
177*. P.K. Viswanathan, “Critical Issues Facing China’s Rubber Industryin the Era of Economic Integration: An Analysis in Retrospect andProspect”, September 2007. Rs. 35.
178. Rudra Narayan Mishra, “Nutritional Deprivation among IndianPre-school Children: Does Rural-Urban Disparity Matter?”,October 2007. Rs. 35.
179*. Amita Shah, “Patterns, Processes of Reproduction, and PolicyImperatives for Poverty in Remote Rural Areas: A Case Study ofSouthern Orissa in India”, November 2007. Rs. 40.
180*. N. Lalitha and Samira Guennif, “A Status Paper on thePharmaceutical Industry in France”, December 2007. Rs. 30.
181*. Keshab Das, “Micro, Small and Medium Enterprises in India: UnfairFare”, January 2008. Rs. 40.
31
* Also published elsewhere IP In Print OS Out of Stock
182. Bharat Ramaswami, Carl E Pray and N. Lalitha, “The Limits ofIntellectual Property Rights: Lessons from the spread of IllegalTransgenic Cotton Seeds in India”, February 2008. Rs. 45.
183. Keshab Das, “Drinking Water and Sanitation in Rural MadhyaPradesh: Recent Initiatives and Issues”, April 2008. Rs. 40.
184. N. Lalitha, “Doha Declaration and Compulsory License for Accessto Medicines”, June 2008. Rs. 40.
185*. Keshab Das and Aswini Kumar Mishra, “Ensuring HorizontalEquity: Challenges before the 13th Finance Commission”, July 2008.Rs. 35.
186*. Jeemol Unni, “Are Gender Differentials in Educational CapabilitiesMediated through Institutions of Caste and Religion in India?”,September 2008. Rs. 40.
187*. Amita Shah and Sajitha O.G., “Poverty and Livelihood among Tribalsin Gujarat: Status, Opportunities, and Strategies”, October 2008.Rs. 45.
188*. S. Visalakshi, “Role of critical infrastructure and incentives inthe commercialisation of Biotechnology in India: An analysis”,November 2008. Rs. 40.
189. P.K. Viswanathan, “Co-operatives and Collective Action: Case ofa Rubber Grower Co-operative in East Garo Hills in Meghalaya,North East India”, December 2008. Rs. 40 (IP).
32