Embed Size (px)
Citation preview

i
Working Paper 335
Doubling Agricultural Growth in Uttar
Pradesh: Sources and Drivers of
Agricultural Growth and Policy Lessons
Smriti Verma
Ashok Gulati
Siraj Hussain
March, 2017
INDIAN COUNCIL FOR RESEARCH ON INTERNATIONAL ECONOMIC RELATIONS

i
Table of Content
List of Abbreviations ................................................................................................................ i
Acknowledgements ................................................................................................................ iii
Abstract .................................................................................................................................... iv
Executive Summary ................................................................................................................. v
1. Introduction ........................................................................................................................ 1
1.1 The Context .................................................................................................................... 1
1.2 Uttar Pradesh: An Overview ......................................................................................... 2
2. Data and Methodology ...................................................................................................... 4
3. Agricultural Landscape of Uttar Pradesh ....................................................................... 4
3.1 Share of Agriculture in GSDP ....................................................................................... 5
3.2 Agricultural Growth Trends .......................................................................................... 6
3.3 Land-Use ........................................................................................................................ 7
3.4 Cropping Pattern ........................................................................................................... 9
4. Sources of Agricultural Growth in Uttar Pradesh........................................................ 11
4.1 Livestock ..................................................................................................................... 13
4.2 Sugarcane ................................................................................................................... 16
4.3 Food Grains ............................................................................................................... 19
4.4 Fruits and Vegetables ................................................................................................. 19
4.5 Fishery ........................................................................................................................ 20
5. Drivers of Agricultural Growth in Uttar Pradesh ........................................................ 20
5.1 Econometric Analysis................................................................................................ 20
6. Conclusions and Observations ........................................................................................ 25
7. Policy Interventions ......................................................................................................... 26
7.1 Procurement of Food Grains .................................................................................... 26
7.2 Electronic-National Agricultural Marketing (e-NAM) ............................................. 28
7.3 Dairy in UP ............................................................................................................... 29
7.4 Sugarcane ................................................................................................................. 29
7.5 Encouraging Farmer Producer Organizations in UP .............................................. 32
7.6 Enhancing Rural Road Connectivity ........................................................................ 33
7.7 Irrigation ................................................................................................................... 34

ii
7.8 Extension Services .................................................................................................... 35
7.9 Overcoming Power Shortages through Use of Solar Power .................................... 35
7.10 Innovations in Farming............................................................................................. 36
7.11 Diversification, Value-Chain Development and Agro-Processing Facilities ........... 36
8. Summing Up ..................................................................................................................... 37
APPENDIX ............................................................................................................................. 38
References ............................................................................................................................... 45
List of Tables
Table 1: Uttar Pradesh at a Glance: Demographic, Socio-Economic and Land-Use
Statistics ............................................................................................................. 3
Table 2: Agricultural Land-Use in Uttar Pradesh ............................................................ 9
Table 3: UP’s Share in All-India Area under Cultivation and All-India Production of
Major Crops ..................................................................................................... 11
Table 4: Variables Used in the Analysis and their Definitions ...................................... 21
Table 5: Correlation Matrix of Selected Variables ........................................................ 21
Table 6: Regression Results for Determining Drivers of Agricultural Growth in UP
between 2000-01 and 2013-14 ......................................................................... 22
Table 7: Position of Procurement of Wheat and Rice in UP in last 5 years .................. 28
Table 8: Year-wise Physical Target and Achievement of Uttar Pradesh under Pradhan
Mantri Gram Sadak Yojna (PMGSY).............................................................. 33
Table 9: Zone-wise Gross Cropped Area, Gross Irrigated Area and Irrigation Ratio in
Uttar Pradesh in 2013-14 ................................................................................. 38
Table 10: Status of Road Connectivity of Habitations as per the Pradhan Mantri Gram
Sadak Yojna Norms ......................................................................................... 40
Table 11: Status of Ground Water Resources Availability, Utilization and Stage of
Development in UP (as in 2009) (in bcm) ....................................................... 42
Table 12: Classification of Districts in the 4 Zones of Uttar Pradesh .............................. 43
Table 13: Land-Use for Agriculture ................................................................................. 43
Table 14: Summary of Budgetary Allocations and Expenditures for Sectors Related to
Agriculture and Allied Activities in UP (in Rs.Lakh) ..................................... 44

iii
List of Figures
Figure 1: Agro-Climatic Zones of Uttar Pradesh ................................................................. 3
Figure 2: Share of Agriculture in GSDP (GDP): Uttar Pradesh and India ........................... 6
Figure 3 Growth in Agriculture (at 2004-05 constant prices): Uttar Pradesh and India ..... 7
Figure 4: Land-Use In Uttar Pradesh: TE 2003-04 and TE 2013-14 ................................... 8
Figure 5: Share of Major Crops, Fruits and Vegetables in Gross Cropped Area in UP ..... 10
Figure 6: Shares of Sectors in the Value of Output of Agriculture and Allied Activities .. 12
Figure 7: Shares of Sectors in Average Annual Growth of Value of Output of Agriculture
and Allied Activities (4.3 percent) between 2000-01 and 2013-14 .................... 12
Figure 8: (a) Shares of Components of Livestock in Value of Output of Livestock (b) Shares
of Components of Livestock in Growth in Value of Output of Agriculture and
Allied Activities between 2000-01 and 2013-14 ................................................ 13
Figure 9: Milk Production and Organized Processing in Major Producing States: 2014-15 .. 14
Figure 10: Dairy Cooperative Sector in UP ......................................................................... 15
Figure 11: State-wise Shares in Production of Sugarcane and Sugar for TE 2014-15 ......... 17
Figure 12: Value-Chain of Sugar Production in India.......................................................... 17
Figure 13: Recovery Rate of Sugarcane in UP ..................................................................... 18
Figure 14: State-wise Production, Marketed Surplus, Procurement and Procurement
Centres/Agencies of Wheat in TE 2015-16 ........................................................ 23
Figure 15: Fair and Remunerative Price (FRP) (earlier known as Statutory Minimum Price
(SMP)) vis-à-vis State Advised Price (SAP) for Sugarcane in UP ..................... 30
Figure 16: Source-wise Irrigation in Uttar Pradesh and India in TE 2002-03 and TE 2013-14
............................................................................................................................. 39
Figure 17: Total Road Density, Surfaced Road Density and Proportion of Surfaced to Total
Roads in Uttar Pradesh........................................................................................ 40
Figure 18: Depth to Water Level Map of Uttar Pradesh (Pre-Monsoon 2016) .................... 41

i
List of Abbreviations
AIBP Accelerated Irrigation Benefits Programme
AMUL Anand Milk Union Limited
APMC Agriculture Produce Market Committee
BJP Bharatiya Janata Party
CACP Commission for Agricultural Costs and Prices
CM Chief Minister
CSO Central Statistical Organization
DCP De-Centralized Procurement
DES Directorate of Economics and Statistics
DWL Decadal Water Level
EP Eastern Plain
FCI Food Corporation of India
FRP Fair and Remunerative Price
GCA Gross Cropped Area
GDP Gross Domestic Product
GoUP Government of Uttar Pradesh
GSDP Gross State Domestic Product
GSDPA Gross State Domestic Product Agriculture
ICRIER Indian Council for Research on International Economic Relations
IPC Irrigation Potential Created
ISAM Integrated Scheme for Agricultural Marketing
ISMA Indian Sugar Mills Association
JEL Journal of Economic Literature
MIDH Mission for Integrated Development of Horticulture
MOSPI Ministry of Statistics & Programme Implementation
MMT Million Metric Tonnes
MP Madhya Pradesh/Mid-Plain
MRIN Marketing Research and Information Network
MSP Minimum Support Price
MWP Mid-Western Plain
NABARD National Agricultural Bank for Rural Development
NAM National Agriculture Market
NARP National Agricultural Research Project
NAS National Account Statistics
NEP North-Eastern Plain
NIC National Informatics Centre
NMAET National Mission on Agricultural Extension and Technology
NSS National Sample Survey
OLS Ordinary Least Square
PMGSY Pradhan Mantri Gram Sadak Yojana
PMKSY Pradhan Mantri Krishi Sinchai Yojana
PPP Public-Private-Partnerships

ii
RS Revenue Sharing
SAP State Advised Price
SMP Statutory Minimum Price
SNF Solid Non-Fat
SWSDP South-Western Semi-Dry Plain
TE Triennium Ending
UHD Ultra-High Density
UIP Ultimate Irrigation Potential
UN United Nations
UP Uttar Pradesh
USA United States of America
WP Western Plain

iii
Acknowledgements
This paper forms a part of the study on agricultural growth and its linkages to poverty
alleviation in six selected states of India, namely, Bihar, Uttar Pradesh (UP), Odisha, Punjab,
Gujarat and Madhya Pradesh (MP). Bihar, UP and Odisha have experienced low-to-moderate
growth in agriculture over the period 2000-01 to 2014-15. Punjab has been the seat of green
revolution and was a front-runner in agriculture during late 1960s, but slipped to low levels of
agri-growth in recent period. Gujarat and Madhya Pradesh have shown some extra-ordinary
growth in their agriculture sectors (almost three times the all-India agri-growth) in the last
decade or so. The key idea of this study was to look for policy lessons from each other within
the Indian context, and see how to propel growth in agriculture for faster alleviation of poverty.
The study has been financially supported by Bill and Melinda Gates Foundation, and we are
deeply touched by their generous support and cooperation. In particular, we are grateful to
those who have been in close association with us on this project from its conception till now:
Hari Menon, Brantley Browning and Purvi Mehta. Our sincere thanks to them for their very
positive and encouraging attitude, cooperation and understanding.
We would also like to express our sincere gratitude to Mr. Alok Ranjan (Former Chief
Secretary, Government of Uttar Pradesh) and Mr. Pravesh Sharma (Former Principal Secretary
of Agriculture, Government of Madhya Pradesh; presently Senior Visiting Fellow, ICRIER)
for reviewing the paper in its draft form and providing valuable insights and useful comments
for revision. While we are thankful to a lot of people who have contributed directly and/or
indirectly in producing this paper, we would especially like to convey our heartfelt thanks to
the following people – Mr. Suresh Malhotra (Agriculture and Horticulture Commissioner,
Government of India), Mr. B.R. Shah (Former Director of Agriculture, Government of Uttar
Pradesh), Mr. Gyan Singh (Director of Agriculture, Government of Uttar Pradesh), Mr. Vinod
Kumar Singh (Director - Agricultural Statistics, Government of Uttar Pradesh), Mr. S.P. Joshi
(Director of Horticulture, Government of Uttar Pradesh), Ms. Sangeeta Verma (Former
Economics and Statistics Advisor, Government of India), Mr. Abinash Verma (Director-
General, Indian Sugar Mills Association), Mr. Vipin Kumar Dwivedi (Cane Commissioner,
Government of Uttar Pradesh) and Mr. V.K. Shukla (Additional Cane Commissioner of Uttar
Pradesh) – for providing us with crucial statistical data along with useful insights, thus
rendering practical significance to our paper.

iv
Abstract
Landslide victory of the Bharatiya Janata Party in state assembly elections of Uttar Pradesh in
March 2017 offers a golden opportunity to change the face of UP’s agriculture and thus the
fate of millions that depend on it. UP with a population of more than 220 million is the most
populous state of India. As per Census 2011, 59 percent of its workforce was engaged in
agriculture; average holding size was just 0.76 ha with 92 percent of holdings being small and
marginal; and 29 percent of its population was below the poverty line in 2011-12. As per the
Situation Assessment Survey of NSS (2012-13), average monthly income of an agri-household
in UP was the third lowest in the country. UP’s agri-GSDP grew at 2.5 percent per annum over
the period FY2001 to FY2015.
The research in this paper about sources and drivers of agri-growth in UP indicates that UP has
the potential to double its agri-growth from 2.5 percent to 5 percent per annum. This can be
achieved if the UP government focuses on erecting a robust procurement system of wheat and
paddy ensuring the Minimum Support Price to farmers; propelling the dairy sector by raising
milk processing levels from about 12 to at least 30 percent over the next five years; rationalizing
sugarcane pricing based on the Rangarajan Committee (2012) formula and freeing up molasses
from all reservations; and finally introducing innovative farming practices and technologies in
cultivation of fruits and vegetables. These policies can be backed by infrastructural investments
in rural roads, power supply to rural areas, and improved irrigation, especially in the
Bundelkhand region.
If the new regime in UP puts this package of policy reforms on priority, it can fulfill the Prime
Minister’s vision of “sabka saath, sabka vikas” and also reap rich political and economic
dividends through faster poverty alleviation and development for all, making UP truly an
“Uttam Pradesh”.
_________
Key words: Uttar Pradesh agriculture; agricultural growth; “sabka saath, sabka vikas”
JEL classification: Q10, Q18.
Authors’ Email: [email protected]; [email protected]; [email protected]
__________ Disclaimer: Opinions and recommendations in the report are exclusively of the author(s) and not of any other
individual or institution including ICRIER. This report has been prepared in good faith on the basis of information
available at the date of publication. All interactions and transactions with industry sponsors and their
representatives have been transparent and conducted in an open, honest and independent manner as enshrined
in ICRIER Memorandum of Association. ICRIER does not accept any corporate funding that comes with a
mandated research area which is not in line with ICRIER’s research agenda. The corporate funding of an ICRIER
activity does not, in any way, imply ICRIER’s endorsement of the views of the sponsoring organization or its
products or policies. ICRIER does not conduct research that is focused on any specific product or service provided
by the corporate sponsor.

v
Executive Summary
The 2017 assembly election in Uttar Pradesh (UP) has given a clear mandate to the Bhartiya
Janata Party (BJP) with 77 percent of seats in the state assembly. This is a historic change in
the political landscape of UP. Yogi Adityanath’s appointment as Chief Minister of the state hit
the headlines with sharp comments from various spheres. However, administrative decisions
announced by him in his first week as CM are in line with the government’s stated principle of
“sabka saath, sabka vikas”. Our research presented in this paper shows that this motto can be
turned into reality only by revving up agriculture in UP, given that it employed 59 percent of
its workforce in 2011 (as per Census 2011)1. If agriculture can be made to grow at 5 percent
per annum, which it clearly has the potential for, the CM’s dream of making UP an “Uttam
Pradesh” can easily come true.
This paper presents the issues that have kept agriculture and farmers in UP repressed in the
past decade and also suggests the way forward with policy interventions that will enhance
agricultural production and growth and assist in alleviating poverty in the state at a faster pace
and to a greater extent.
UP is the fifth largest state of India (24.1 million hectares) with a projected population of 220.7
million people (roughly 16.7 percent of all-India population) in 2016. It is also one of the
poorest states in India with 29.4 percent of its population below the poverty line (Tendulkar
Poverty Line, 2011-12). Agriculture forms an integral part of UP’s economy and the lives of
its people. Nearly 69 percent of land in the state is under cultivation. UP accounted for 13.15
percent (25.9 mha) of the Gross Cropped Area in the country in TE 2013-14, and 77.9 percent
of this was under irrigation (20.17 mha – roughly 21.6 percent of Gross Irrigated Area in the
country in TE 2013-14). UP has more than 18 million agricultural households in the state and
approximately 59 percent of its workforce was dependent on agriculture for a livelihood in
2011 (as per NSS 2012-13; and Census 2011). Marginal (< 1 ha) and small (1 – 2 ha) farmers
cultivate 92.5 percent of all landholdings in UP which accounts for 64.8 percent of the total
area cultivated in UP. Average monthly income of an agricultural household in UP is third
lowest (Rs.4701) in the country and the state also accounts for the largest share (16.9 percent)
of all indebted agricultural households in India – 90.4 percent of these being marginal and small
agricultural households (Agricultural Statistics at a Glance, 2015).
It has been widely recognized that agriculture is one of the most effective instruments for
achieving growth and reducing poverty. However, the promise of agriculture to reduce poverty
and unleash development in any economy can be realized if the state lends its hand in providing
core public goods, investing in physical and institutional infrastructure and regulating natural
resource management apart from facilitating the private sector to pitch in profitably (World
Development Report - Agriculture for Development, 2008). Given the vast importance of
agriculture in UP and the prevalence of high poverty in the state, agricultural growth assumes
1 The Labour Bureau (Chandigarh) gives the share of agriculture in employment as 47 percent in 2015-16

vi
great significance in achieving sustainable economic growth in the state and development of
its people.
Agriculture’s share in UP’s Gross State Domestic Product has been declining in the past
decade, but it still contributed 29 percent to the state’s GSDP in TE 2014-15 at market prices.
Growth in agriculture and allied activities in UP has averaged at 2.5 percent per annum between
2000-01 and 2014-15, which is below the all-India average of 2.9 percent during this period,
at 2004-05 constant prices. UP is a prominent producer of a wide variety of crops, and is
commonly known as the “granary of the nation”. Food grains occupy the largest share of the
Gross Cropped Area in UP followed by other crops such as sugarcane, oilseeds, vegetables,
etc.
Decomposing the growth in agriculture and allied sectors in UP brings us to the sources of this
growth in the state. The largest source of growth is the livestock sector, followed by sugar,
forestry, cereals, fruits and vegetables, and fisheries. The livestock sector has contributed
nearly 39.4 percent to growth in agricultural value in UP between 2000-01 and 2013-14. Milk
has the biggest share in this, followed by meat, other livestock products (wool, hides, etc.), and
eggs. UP is the largest producer of milk (25 million metric tonnes) in the country but processes
less than 12 percent of it through the organized sector. UP is also one of the top contributors to
buffalo meat exports from the country. Among crops, sugarcane has contributed 14 percent,
forestry 11 percent, cereals 10 percent and fruits and vegetables 8 percent to the growth of
agriculture in UP (the remaining 16 percent coming from several other miscellaneous crops)
during FY2001 to FY2014.
UP produced around 45 million tonnes of cereals and 1.8 million tonnes of pulses in TE 2014-
15. The state accounted for 38.5 percent of sugarcane production and 27.3 percent of sugar
production in the country. UP is the largest producer of many fruits and vegetables such as
potato, pea, mango, watermelon, amla, etc. From our econometric analysis to determine drivers
of agricultural growth in UP, it turns out that irrigation, total road density and relative prices
for agriculture are the most important drivers of agricultural growth in the state. On an average,
a 1 percent increase in irrigation ratio increases UP’s agri-GSDP by 1.25 percent; a 1 percent
increase in total road density in the state increases its agri-GSDP by 0.5 percent; and a 1 percent
increase in relative prices for agriculture increases UP’s agri-GSDP by 0.6 percent. But given
that much of UP's irrigation is groundwater based, it is also influenced by price environment
that UP farmers face. In that sense, the prices that farmers receive for their produce is the most
important incentive for them to invest in improving productivity and propelling agri-growth.
But unfortunately, farmers in UP fail to get remunerative prices or even the basic Minimum
Support Price (MSP) for their main produce – wheat and rice. Procurement operations in UP,
usually carried out by state agencies, are grossly inadequate and the state fails to procure wheat
and paddy at MSP. Quite often, in several state mandis, market prices of wheat and paddy rule
10 to 25 percent below MSP. This is especially glaring in eastern UP with respect to paddy.
Similar problems face the dairy sector where farmers get roughly 15-20 percent lower prices
from the cooperative sector vis-à-vis the private sector. These prices are also about 15 percent
below the prices received by milk farmers in Gujarat. Sugarcane, another prominent crop in

vii
UP, has suffered in the clutches of distortionary pricing policies. In addition to lack of proper
price incentives, lack of adequate infrastructure – rural road connectivity, rural power, cold-
storages, warehouses, etc. – has impeded agricultural growth in UP. Many rural habitations
continue to remain unconnected by roads. Roads, especially in the rural areas, are imperative
for enabling farmers to carry their produce to the markets to sell in the mandis or to the
consumers directly.
Based on our empirical and econometric analysis of the sources and drivers of agricultural
growth in UP beginning 2000-01, we present a set of policy interventions that have the potential
to achieve much higher (almost double) the agri-growth in a sustainable manner.
Getting Incentives right
1. Procurement of food grains especially that of paddy and wheat in Eastern and Central UP:
a. Improved recording of price and arrival data in Agmarknet portal;
b. Incentivizing increased arrivals into mandis;
c. Ensuring timely payment of MSP to farmers especially for wheat and paddy but also
for pulses, directly into farmers' accounts (as MP and Chhattisgarh have demonstrated
lately with their wheat and paddy farmers, respectively).
2. e-NAM: Removal of all restrictions on licensing and trading; creation of assaying facilities
in mandis so as to increase trade through e-NAM in the state
3. Dairy in UP
a. First and foremost is the need to ensure that milk producers in the state get a
remunerative price. Since there is no MSP for milk, it would be pertinent to ensure that
there are enough processing units in the organized sector to process milk into value-
added products. Although UP is the largest producer of milk in the country (about 17
percent of all-India production), it processes less than 12 percent of its milk production
compared to almost half in Gujarat. UP must target increasing the processing of milk
to at least 30 percent in the next five years, and for that the GoUP should invite
cooperative milk giants like AMUL as well as other private players to create
competition in the demand for milk. Farmers are willing to supply provided there is a
remunerative market for their produce.
b. Increasing productivity of milk in UP should follow immediately as demand increases.
This can be done through pure Indian breeds as well as through cross-breeds where
yields are 3 to 4 times higher. Further, advanced technology for sex-selection can also
be used to ensure that more cows are born through artificial insemination.
4. Sugarcane development
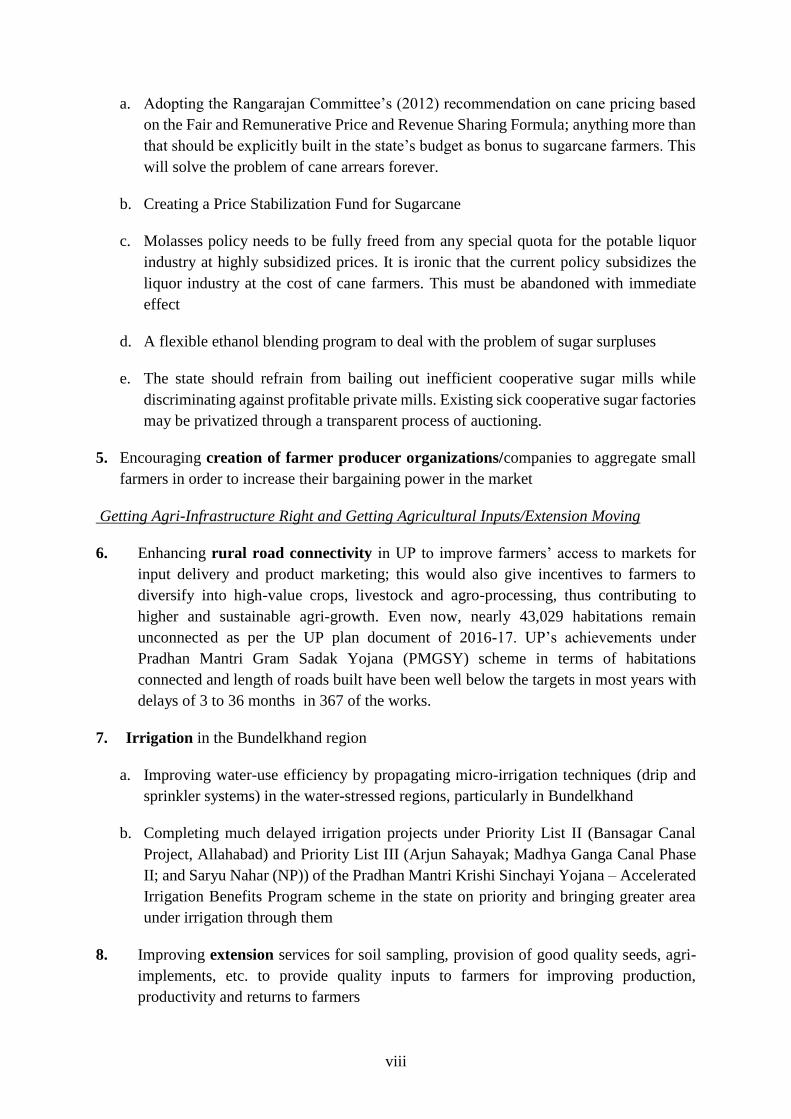
viii
a. Adopting the Rangarajan Committee’s (2012) recommendation on cane pricing based
on the Fair and Remunerative Price and Revenue Sharing Formula; anything more than
that should be explicitly built in the state’s budget as bonus to sugarcane farmers. This
will solve the problem of cane arrears forever.
b. Creating a Price Stabilization Fund for Sugarcane
c. Molasses policy needs to be fully freed from any special quota for the potable liquor
industry at highly subsidized prices. It is ironic that the current policy subsidizes the
liquor industry at the cost of cane farmers. This must be abandoned with immediate
effect
d. A flexible ethanol blending program to deal with the problem of sugar surpluses
e. The state should refrain from bailing out inefficient cooperative sugar mills while
discriminating against profitable private mills. Existing sick cooperative sugar factories
may be privatized through a transparent process of auctioning.
5. Encouraging creation of farmer producer organizations/companies to aggregate small
farmers in order to increase their bargaining power in the market
Getting Agri-Infrastructure Right and Getting Agricultural Inputs/Extension Moving
6. Enhancing rural road connectivity in UP to improve farmers’ access to markets for
input delivery and product marketing; this would also give incentives to farmers to
diversify into high-value crops, livestock and agro-processing, thus contributing to
higher and sustainable agri-growth. Even now, nearly 43,029 habitations remain
unconnected as per the UP plan document of 2016-17. UP’s achievements under
Pradhan Mantri Gram Sadak Yojana (PMGSY) scheme in terms of habitations
connected and length of roads built have been well below the targets in most years with
delays of 3 to 36 months in 367 of the works.
7. Irrigation in the Bundelkhand region
a. Improving water-use efficiency by propagating micro-irrigation techniques (drip and
sprinkler systems) in the water-stressed regions, particularly in Bundelkhand
b. Completing much delayed irrigation projects under Priority List II (Bansagar Canal
Project, Allahabad) and Priority List III (Arjun Sahayak; Madhya Ganga Canal Phase
II; and Saryu Nahar (NP)) of the Pradhan Mantri Krishi Sinchayi Yojana – Accelerated
Irrigation Benefits Program scheme in the state on priority and bringing greater area
under irrigation through them
8. Improving extension services for soil sampling, provision of good quality seeds, agri-
implements, etc. to provide quality inputs to farmers for improving production,
productivity and returns to farmers

ix
Innovating for Sustainable Futuristic Agri-Growth and Development
9. Overcoming power shortages: utilizing solar power for powering irrigation pumps;
harnessing solar power as a third crop in the fields and enabling farmers to sell surplus
power to the state grid
10. Adopting innovative farming techniques such as high- and ultra-high-density
cultivation of mangoes to improve its productivity;
11. Value-Chain development (solar-powered cold-storages), capacity expansion of
existing units and setting up of new agro-processing units for utilizing the state’s vast
production of agricultural, horticultural and livestock produce
The political change in UP presents a unique opportunity for the state to overcome its long-
drawn laggardness, particularly in agriculture. If these policy suggestions are taken seriously,
agriculture in UP can be quickly turned around by unlocking its potential to grow at nothing
less than 5 percent per annum. And that would be a giant step toward fulfilling the vision of
"sab ka saath, sab ka vikas".
1
Doubling Agricultural Growth in Uttar Pradesh: Sources and Drivers of
Agricultural Growth and Policy Lessons
Smriti Verma, Ashok Gulati, Siraj Hussain*
1. Introduction
1.1 The Context
The Uttar Pradesh Legislative Assembly Election of 2017 has dramatically changed the
political landscape of Uttar Pradesh. The Bharatiya Janata Party (BJP) and its allies, in an
unprecedented victory (winning a whopping 325 of the 403 seats in the legislative assembly),
received a loud and clear mandate for their promise of good governance in UP. The anointment
of CM-elect left the media abuzz with strong opinions on the party’s unconventional move.
However, the Chief Minister, on the day of his appointment made very clear that the Prime
Minister’s vision of “sabka sath, sabka vikas” will be the guiding principle in all actions of the
new government. If the newly formed government is really keen on fulfilling this promise in
letter and spirit, there cannot be a better time and opportunity to do so. Our in-depth research
and analysis indicates that it is agriculture (employing 59 percent of the workforce in Uttar
Pradesh (as per Census 2011) which needs to be revved up to make this dream a reality. The
initial announcements of the CM, particularly his decision of doubling procurement of wheat
in UP from 4 to 8 million tonnes in the Rabi Marketing Season of 2017-18 and ensuring
payments are made directly to farmers’ bank accounts are in the right direction.
Our research reveals that agriculture in UP has the potential to grow at a minimum of 5 percent
per annum – double of what its annual growth rate has been in the period between 2000-01 and
2014-15. Our analysis indicates that the livestock sector can be the key to agricultural growth
and development in UP making it a dairy-led development. The dairy sector has not only
contributed most to agricultural growth in UP during this period but also has the promise of
enhancing farm incomes by utilizing the state’s natural advantage of being the largest producer
of milk in the country. Setting up dairy processing plants in the state and inviting large players
such as AMUL and other private and multinational companies to invest in dairy processing
through appropriate incentives will be the right way to go. Yields of existing indigenous breeds
of cattle can be increased phenomenally by cross-breeding with high-yielding varieties. At the
crop front, erecting a robust procurement system in the state will not only benefit farmers across
the state with 10-20 percent higher prices for wheat and rice, but also get the new government
rich political and economic mileage2. Also, given the enormously advantageous location that
Uttar Pradesh enjoys in the fertile Gangetic Plains with relatively abundant water resources, its
large production of a wide variety of fruits and vegetables must be utilized effectively through
development of efficient value-chains. Solar-powered cold-storages for potatoes could be a
* Smriti is a Consultant, Ashok is Infosys Chair Professor for Agriculture, and Siraj is Visiting Senior Fellow
at ICRIER. 2 See Gulati & Hussain, 2017; and Gulati & Verma, 2017
2
good starting point. Increasing the food processing capacity within the state can be the next
step. Innovative farming techniques such as cultivation of mangoes in high-density (350 trees
per hectare) and ultra-high density (1675 tress per hectare) orchards can improve yield of the
fruit manifold. These measures will give the farmers in UP a competitive advantage,
significantly augmenting their incomes.
If the new government can intervene in the agricultural sector on the lines of the
recommendations made in this paper in the short-to-medium run, it is not long before Uttar
Pradesh could be turned around from pulling back India’s growth and development to driving
it. We present ahead our research that may help the UP government to get its agricultural sector
growing at 5 percent per annum – that is, double the rate at which it has grown during FY2001
to FY2015.
1.2 Uttar Pradesh: An Overview
Uttar Pradesh (UP) located in the northern part of India is surrounded by Uttarakhand,
Himachal Pradesh, Haryana and Delhi in the North and West; Rajasthan, Madhya Pradesh and
Chhattisgarh in the South-West and South; and Jharkhand and Bihar in the East. It is the fifth
largest state of India in terms of geographical area covering roughly 240,928 square kilometers.
This is nearly 7.33 percent of the total area of the country. In terms of population, UP is the
largest state of India with a population of about 199.8 million people (Census 2011) accounting
for nearly 16.5 percent of the total population of India. UP had more than 220 million people
in 2016, only less than China (1.38 billion), India (1.31 billion), USA (321.8 million) and
Indonesia (257.6 million) as per UN population projections for 2015. UP's population exceeds
that of France, Germany and United Kingdom put together!
UP is a large state divided into 75 revenue districts3, 312 tehsils, 648 Statutory Towns, 267
Census Towns and 1.06 lakh villages as per the Census 2011. It is also among the most densely
populated states of India with 829 persons inhabiting every square kilometer. Nearly 77.7
percent of the people in the state live in rural areas making Uttar Pradesh primarily a rural
economy. Not just that, poverty levels in UP (29.4 percent) exceed the national average (21.9
percent) and so does rural poverty – 30.4 percent of the rural people are below the poverty line
whereas in India as a whole, 25.7 percent of the rural people are classified as poor.4
Given the large size of the state and its diverse geography, climate and topography, UP is
generally divided into 4 zones or regions – Western, Central, Eastern and Bundelkhand. An
earlier state government, in 2011, had recommended breaking up UP into 4 smaller states,
namely, Paschim Pradesh, Awadh Pradesh, Purvanchal and Bundelkhand, broadly based on
these regions. In order to develop strategic research and development for increasing agricultural
production, India has been divided into 127 agro-climatic zones based on soil, climate
(temperature, rainfall) and other agro-meteorological characteristics under the National
3 UP had a total of 71 districts as per the Census 2011. Later, 4 districts – Sultanpur, Ghaziabad, Moradabad
and Muzaffarnagar – were bifurcated to create 4 new districts, namely, Bhimnagar, Prabudhhnagar,
Panchsheel Nagar and Amethi, respectively. Thus, the total number of districts in UP now stands at 75 4 Poverty levels are for 2011-12 based on the Tendulkar Poverty Line
3
Agricultural Research Project (NARP) undertaken by the erstwhile Planning Commission. Of
these 127 zones, 9 agro-climatic zones have been recognized in the state of UP, namely – (1)
Tarai; (2) Western Plain (WP); (3) Mid-Western Plain (MWP); (4) South-Western Semi-Dry
Plain (SWSDP); (5) Mid-Plain (MP); (6) Bundelkhand; (7) North-Eastern Plain (NEP); (8)
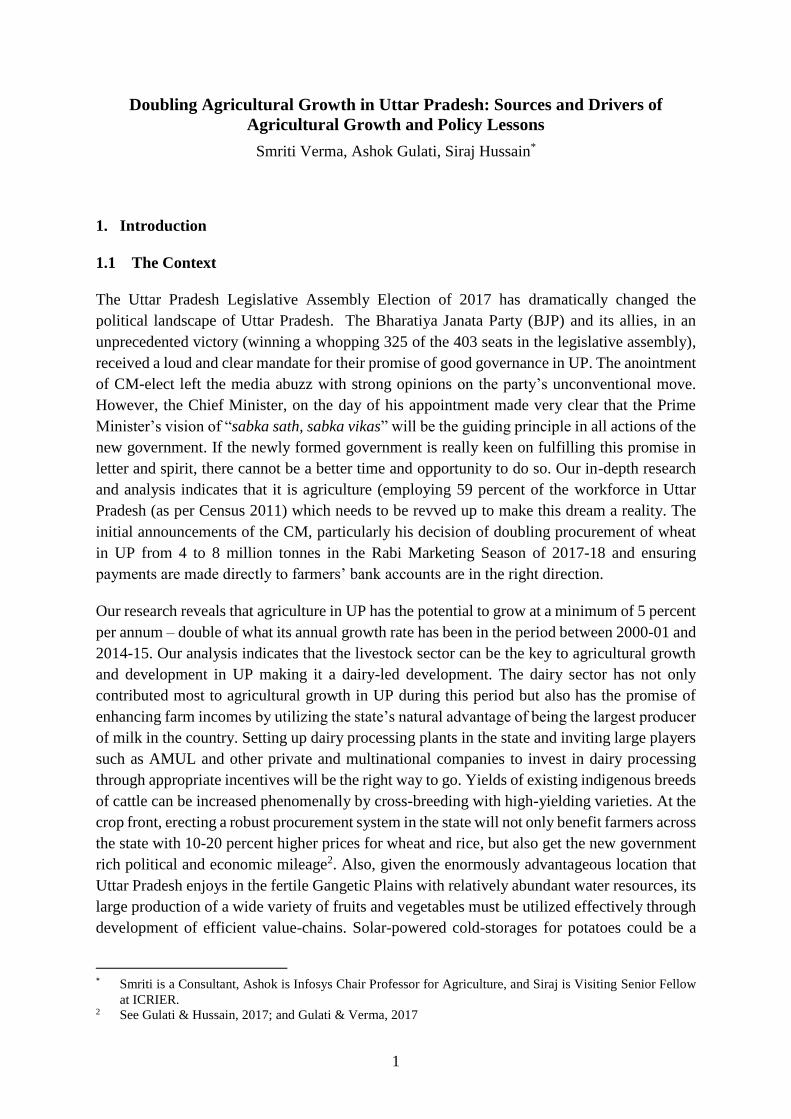
Eastern Plain (EP); and (9) Vindhyan. Figure 1 shows these zones on the map of Uttar Pradesh.
Figure 1: Agro-Climatic Zones of Uttar Pradesh
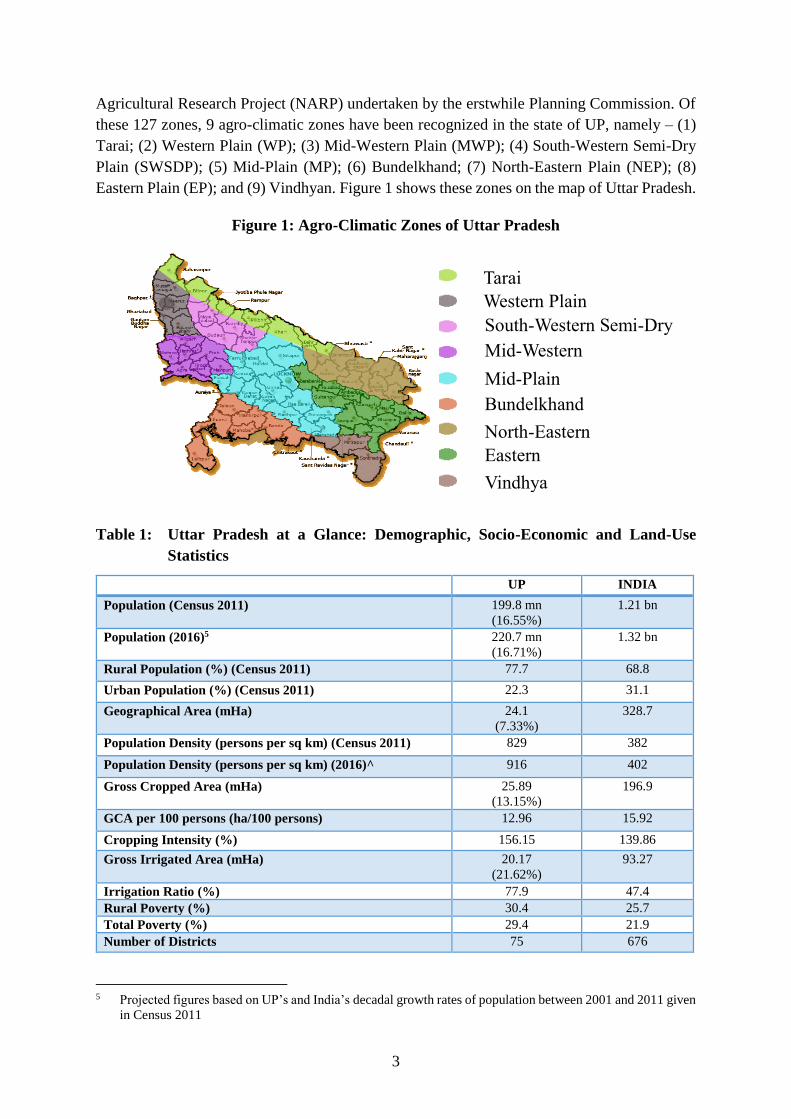
Table 1: Uttar Pradesh at a Glance: Demographic, Socio-Economic and Land-Use
Statistics
UP INDIA
Population (Census 2011) 199.8 mn
(16.55%)
1.21 bn
Population (2016)5 220.7 mn
(16.71%)
1.32 bn
Rural Population (%) (Census 2011) 77.7 68.8
Urban Population (%) (Census 2011) 22.3 31.1
Geographical Area (mHa) 24.1
(7.33%)
328.7
Population Density (persons per sq km) (Census 2011) 829 382
Population Density (persons per sq km) (2016)^ 916 402
Gross Cropped Area (mHa) 25.89
(13.15%)
196.9
GCA per 100 persons (ha/100 persons) 12.96 15.92
Cropping Intensity (%) 156.15 139.86
Gross Irrigated Area (mHa) 20.17
(21.62%)
93.27
Irrigation Ratio (%) 77.9 47.4
Rural Poverty (%) 30.4 25.7
Total Poverty (%) 29.4 21.9
Number of Districts 75 676
5 Projected figures based on UP’s and India’s decadal growth rates of population between 2001 and 2011 given
in Census 2011
Tarai
Western Plain
South-Western Semi-Dry
Plain Mid-Western
Plain Mid-Plain
Bundelkhand
North-Eastern
Plain Eastern
PlainVindhya
n
4
Note: Poverty figures are for 2011-12 based on Tendulkar Poverty Line; land-use statistics are for TE 2013-14; ^
based on projected population for 2016
Source: Directorate of Economics and Statistics (DES); Census of India; Central Statistical
Organization (CSO)
2. Data and Methodology
The study uses secondary data from various sources published by the Government of India and
the Government of Uttar Pradesh. The study covers the period between 2000-01 and 2013-14
to analyze the sources and drivers of agricultural growth in UP. The erstwhile state of Uttar
Pradesh was divided into Uttarakhand and the current state of Uttar Pradesh in the year 2000.
In order to maintain comparability of data and continuity in analysis, we have chosen the period
after the division took place. Our main sources of data are the websites of the Ministry of
Agriculture and Farmers’ Welfare, Directorate of Economics and Statistics (DES) of the
Government of India, the Central Statistical Organization (CSO), the Census of India, National
Account Statistics (NAS), UP Plan Documents, Fertilizer Statistics of India (Fertilizer
Association of India) and Basic Road Statistics of India (Ministry of Road Transport and
Highways).
In order to identify sources of agricultural growth in UP, we decompose the value of output of
agriculture and allied activities into different sectors to study the shares of various sectors. We
also decompose the growth in the value of output of agriculture and allied activities to see the
contribution of different sectors to agri-growth. For trend analysis, we use a moving average
of three years (Triennium Ending (TE) average) to even out the annual fluctuations in shares
in value of output and growth rates. To examine the relationship between agricultural growth
and certain selected variables, the Karl Pearson Correlation Matrix has been presented in the
paper. We identify and determine the drivers of agricultural growth in UP using the Ordinary
Least Square (OLS) method in alternate models and present the relevant models in the paper.
In this study, we do a state-wide analysis to examine the sources and determine the drivers of
agricultural growth in Uttar Pradesh in the 14-year period specified above.
3. Agricultural Landscape of Uttar Pradesh
Agriculture forms an integral part of the daily lives of majority of people in Uttar Pradesh. In
the agricultural year July 2012 – June 2013, UP had approximately 18 million agricultural
households which accounted for 20 percent of the total agricultural households in rural India.
In the same year, UP had an estimated 24.1 million rural households which is an estimated 15.5
percent of all rural households in the country. Average monthly income per agricultural
household is the third lowest in Uttar Pradesh (Rs.4701; Bihar and West Bengal being lower
than UP)6, portraying the grim state of UP’s farmers. In UP, marginal (< 1 ha) and small (1 –
2 ha) farmers cultivate 92.5 percent of all landholdings in the state which accounts for 64.8
6 (Agricultural Statistics at a Glance, 2015)
5
percent of UP’s total area of landholdings7. The average size of landholding in UP in 2010-11
was about 0.76 ha (All-India Report on Agriculture Census 2010-11, 2015). So, UP's
agriculture is smallholder dominated, some of whom are subsistence farmers, but many are
also commercial farmers trying to get whatever best they can from these small holdings and
markets that are in nearby mandis.
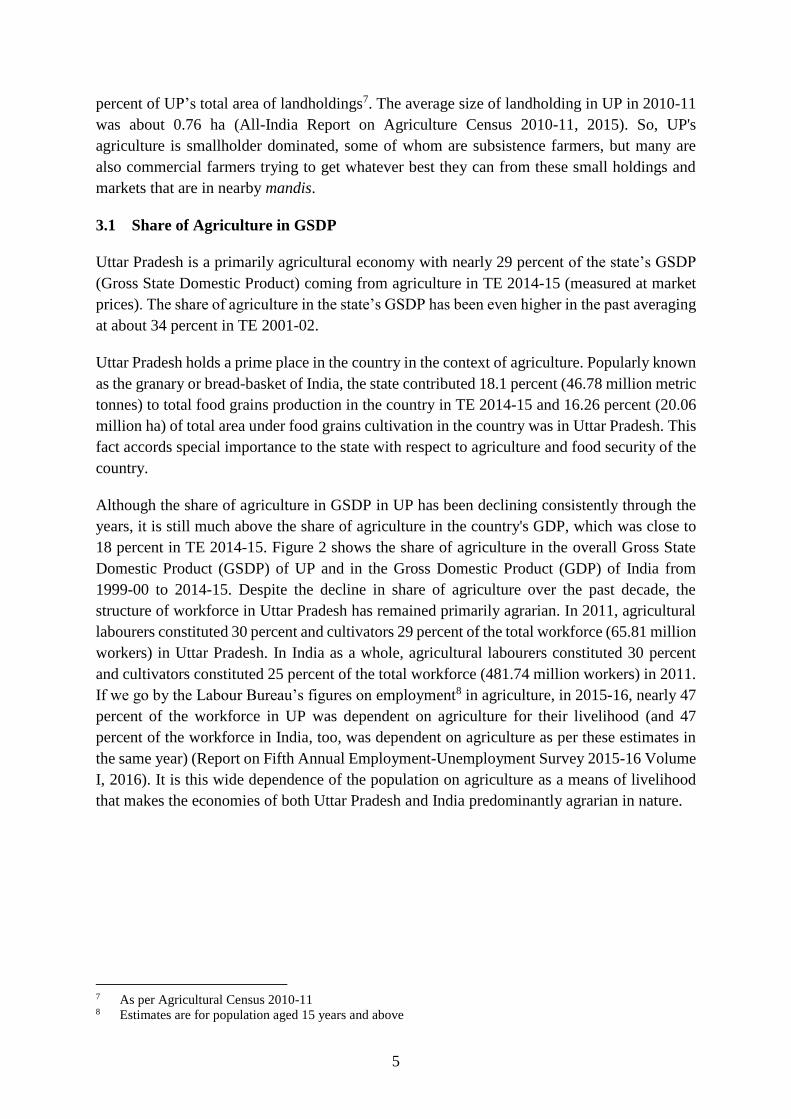
3.1 Share of Agriculture in GSDP
Uttar Pradesh is a primarily agricultural economy with nearly 29 percent of the state’s GSDP
(Gross State Domestic Product) coming from agriculture in TE 2014-15 (measured at market
prices). The share of agriculture in the state’s GSDP has been even higher in the past averaging
at about 34 percent in TE 2001-02.
Uttar Pradesh holds a prime place in the country in the context of agriculture. Popularly known
as the granary or bread-basket of India, the state contributed 18.1 percent (46.78 million metric
tonnes) to total food grains production in the country in TE 2014-15 and 16.26 percent (20.06
million ha) of total area under food grains cultivation in the country was in Uttar Pradesh. This
fact accords special importance to the state with respect to agriculture and food security of the
country.
Although the share of agriculture in GSDP in UP has been declining consistently through the
years, it is still much above the share of agriculture in the country's GDP, which was close to
18 percent in TE 2014-15. Figure 2 shows the share of agriculture in the overall Gross State
Domestic Product (GSDP) of UP and in the Gross Domestic Product (GDP) of India from
1999-00 to 2014-15. Despite the decline in share of agriculture over the past decade, the
structure of workforce in Uttar Pradesh has remained primarily agrarian. In 2011, agricultural
labourers constituted 30 percent and cultivators 29 percent of the total workforce (65.81 million
workers) in Uttar Pradesh. In India as a whole, agricultural labourers constituted 30 percent
and cultivators constituted 25 percent of the total workforce (481.74 million workers) in 2011.
If we go by the Labour Bureau’s figures on employment8 in agriculture, in 2015-16, nearly 47
percent of the workforce in UP was dependent on agriculture for their livelihood (and 47
percent of the workforce in India, too, was dependent on agriculture as per these estimates in
the same year) (Report on Fifth Annual Employment-Unemployment Survey 2015-16 Volume
I, 2016). It is this wide dependence of the population on agriculture as a means of livelihood
that makes the economies of both Uttar Pradesh and India predominantly agrarian in nature.
7 As per Agricultural Census 2010-11 8 Estimates are for population aged 15 years and above
6
Figure 2: Share of Agriculture in GSDP (GDP): Uttar Pradesh and India
Source: CSO, MOSPI
3.2 Agricultural Growth Trends
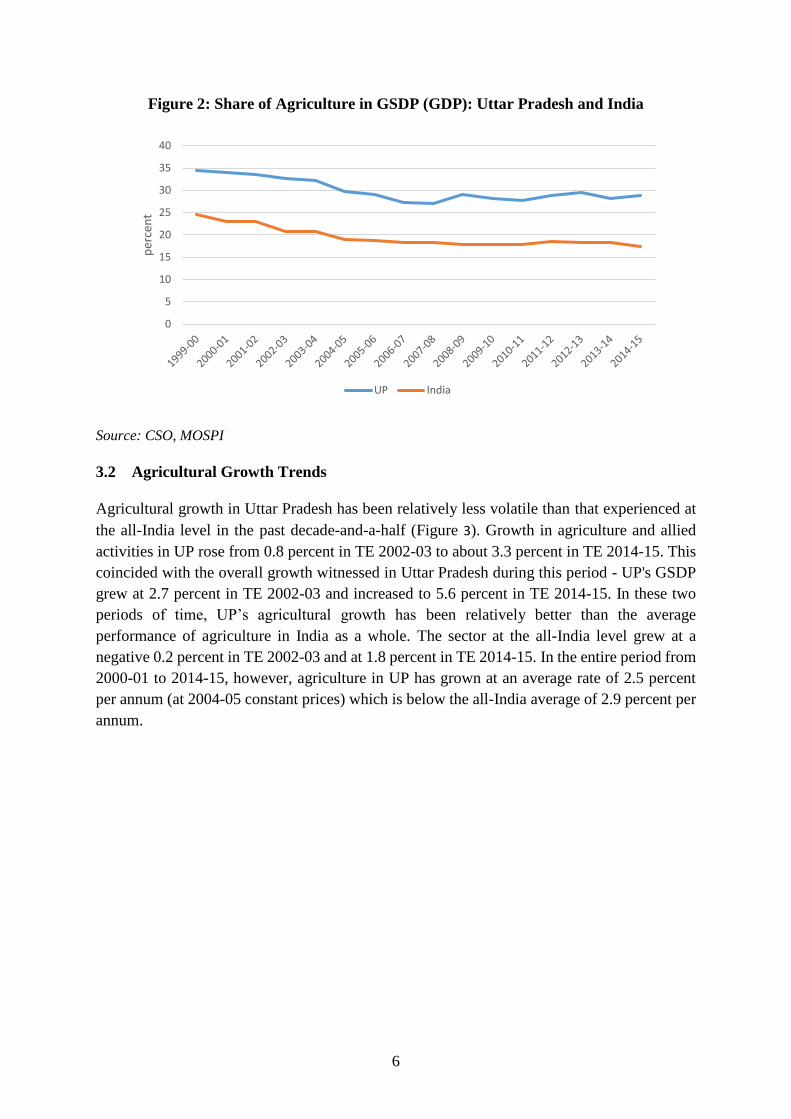
Agricultural growth in Uttar Pradesh has been relatively less volatile than that experienced at
the all-India level in the past decade-and-a-half (Figure 3). Growth in agriculture and allied
activities in UP rose from 0.8 percent in TE 2002-03 to about 3.3 percent in TE 2014-15. This
coincided with the overall growth witnessed in Uttar Pradesh during this period - UP's GSDP
grew at 2.7 percent in TE 2002-03 and increased to 5.6 percent in TE 2014-15. In these two
periods of time, UP’s agricultural growth has been relatively better than the average
performance of agriculture in India as a whole. The sector at the all-India level grew at a
negative 0.2 percent in TE 2002-03 and at 1.8 percent in TE 2014-15. In the entire period from
2000-01 to 2014-15, however, agriculture in UP has grown at an average rate of 2.5 percent
per annum (at 2004-05 constant prices) which is below the all-India average of 2.9 percent per
annum.
0
5
10
15
20
25
30
35
40p
erce
nt
UP India

7
Figure 3 Growth in Agriculture (at 2004-05 constant prices): Uttar Pradesh and India
Source: CSO, MOSPI
3.3 Land-Use
Agriculture is the impetus that drives the economy of UP. About 69 percent of the total land
available in the state was used for agriculture in TE 2013-14 as it was in TE 2003-04. Land-
use pattern in UP has largely remained unchanged through the decade under study. Nearly 7
percent of all land available is under forests, and another 7 percent is classified as fallow. Other
uncultivated land excluding fallows has fallen from 4 percent in TE 2003-04 to 3 percent in TE
2013-14, increasing the land unavailable for cultivation from 13 to 14 percent during this
period.
-8
-6
-4
-2
0
2
4
6
8
10
per
cen
t
UP India

8
Figure 4: Land-Use In Uttar Pradesh: TE 2003-04 and TE 2013-14
Source: DES
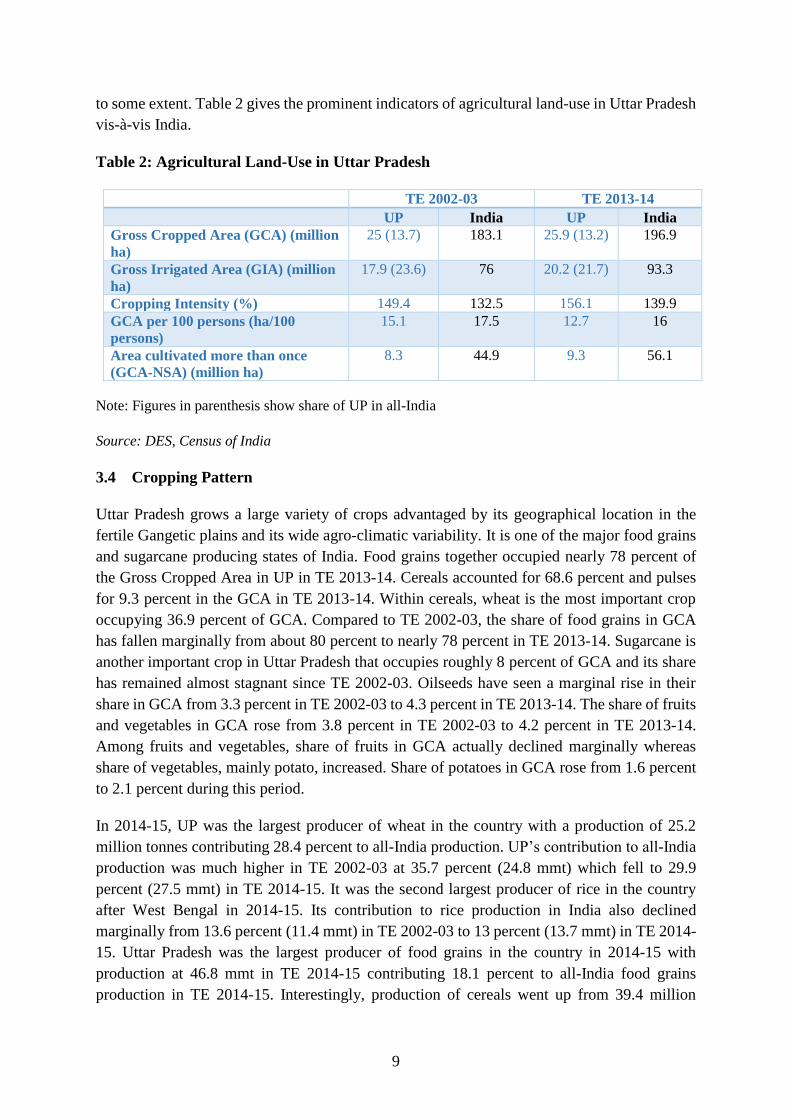
Gross Cropped Area (GCA) in UP increased slightly from 25 million ha (mha) to about 26
million ha between TE 2002-03 and TE 2013-14 Its share in all-India GCA actually declined
marginally from 13.7 percent to 13.2 percent. Gross Irrigated Area has also increased from
17.9 mha to 20.2 mha during the same period. GCA per 100 persons is an indicator of where
food surpluses are coming from at present and where they can come from in future. In UP,
GCA/100 persons has fallen from 15.1 ha in TE 2002-03 to 12.7 ha in TE 2013-14. This shows
the increasing pressure of population on land in UP and the declining capacity of the state to
generate surpluses from area expansion. If Uttar Pradesh is to continue playing an important
role in surplus production of food grains to ensure food security of its own people as well as to
contribute to the central pool for the country, productivity levels must rise substantially.
Despite the significance of food grains in UP, yield has failed to increase significantly: rice
yield in UP has increased from 1.98 tonnes/ha in TE 2002-03 to 2.26 tonnes/ha in TE 2014-15,
and productivity of wheat has fluctuated between 2.6 tonnes/ha and 3.1 tonnes/ha during this
period. UP lags far behind states like Punjab where rice yield is 3.9 tonnes/ha and yield of
wheat is nearly 4.7 tonnes/ha in TE 2014-15. The challenge is, therefore, to increase
productivity. But this can rise only when farmers are assured of at least receiving the MSP as
farmers are in Punjab-Haryana. Cropping intensity has gone up in Uttar Pradesh from 149.4
percent to 156.1 percent over the last decade representing intensification of agricultural land
and input use. This is a good sign because horizontal expansion of area under agriculture is a
remote possibility and increasingly infeasible. In TE 2002-03, only 8.3 mha was cultivated
more than once – this increased to 9.3 mha in TE 2013-14. Cropping intensity in UP has been
higher than the national average across this time period but is much lower than that in some
other states such as Punjab (190.1 percent) and Haryana (183.8 percent). Sugarcane is an
important crop in UP and the fact that it is a longer duration crop, masks the cropping intensity
7%
14%
3%
7%
69%
TE 2013-14
Total Reporting Area: 24.20 mHa Total Reporting Area: 24.17 mHa
9
to some extent. Table 2 gives the prominent indicators of agricultural land-use in Uttar Pradesh
vis-à-vis India.
Table 2: Agricultural Land-Use in Uttar Pradesh
TE 2002-03 TE 2013-14
UP India UP India
Gross Cropped Area (GCA) (million
ha)
25 (13.7) 183.1 25.9 (13.2) 196.9
Gross Irrigated Area (GIA) (million
ha)
17.9 (23.6) 76 20.2 (21.7) 93.3
Cropping Intensity (%) 149.4 132.5 156.1 139.9
GCA per 100 persons (ha/100
persons)
15.1 17.5 12.7 16
Area cultivated more than once
(GCA-NSA) (million ha)
8.3 44.9 9.3 56.1
Note: Figures in parenthesis show share of UP in all-India
Source: DES, Census of India
3.4 Cropping Pattern
Uttar Pradesh grows a large variety of crops advantaged by its geographical location in the
fertile Gangetic plains and its wide agro-climatic variability. It is one of the major food grains
and sugarcane producing states of India. Food grains together occupied nearly 78 percent of
the Gross Cropped Area in UP in TE 2013-14. Cereals accounted for 68.6 percent and pulses
for 9.3 percent in the GCA in TE 2013-14. Within cereals, wheat is the most important crop
occupying 36.9 percent of GCA. Compared to TE 2002-03, the share of food grains in GCA
has fallen marginally from about 80 percent to nearly 78 percent in TE 2013-14. Sugarcane is
another important crop in Uttar Pradesh that occupies roughly 8 percent of GCA and its share
has remained almost stagnant since TE 2002-03. Oilseeds have seen a marginal rise in their
share in GCA from 3.3 percent in TE 2002-03 to 4.3 percent in TE 2013-14. The share of fruits
and vegetables in GCA rose from 3.8 percent in TE 2002-03 to 4.2 percent in TE 2013-14.
Among fruits and vegetables, share of fruits in GCA actually declined marginally whereas
share of vegetables, mainly potato, increased. Share of potatoes in GCA rose from 1.6 percent
to 2.1 percent during this period.
In 2014-15, UP was the largest producer of wheat in the country with a production of 25.2
million tonnes contributing 28.4 percent to all-India production. UP’s contribution to all-India
production was much higher in TE 2002-03 at 35.7 percent (24.8 mmt) which fell to 29.9
percent (27.5 mmt) in TE 2014-15. It was the second largest producer of rice in the country
after West Bengal in 2014-15. Its contribution to rice production in India also declined
marginally from 13.6 percent (11.4 mmt) in TE 2002-03 to 13 percent (13.7 mmt) in TE 2014-
15. Uttar Pradesh was the largest producer of food grains in the country in 2014-15 with
production at 46.8 mmt in TE 2014-15 contributing 18.1 percent to all-India food grains
production in TE 2014-15. Interestingly, production of cereals went up from 39.4 million

10
tonnes in TE 2002-03 to 45 million tonnes in TE 2014-15, whereas production of pulses
declined significantly from 2.25 million tonnes to 1.82 million tonnes during the same period.
In 2014-15, Uttar Pradesh was the largest producer of sugarcane in the country, followed by
Maharashtra and Karnataka. Sugarcane production in UP has increased significantly from 115
million tonnes in TE 2002-03 to 133.4 million tonnes in TE 2014-15. It has also been among
the leading producers of vegetables (ranked second in 2013-14) producing 18.5 million tonnes
of vegetables and making up 11.4 percent of all-India production of vegetables in 2013-14. UP
lags behind in the production of fruits in the country, and was the fifth largest producer in 2013-
14 producing 6.9 million tonnes and contributing 7.7 percent to all-India production of fruits
in that year. Among fruits, mango is an important crop in Uttar Pradesh and among vegetables,
potato is a widely grown crop. UP is the largest producer of potatoes in the country with a
production of 14.2 million tonnes sharing 32.3 percent in all-India production in TE 2014-15.
In 2014-15, UP was the largest producer of both mangoes (4.3 million tonnes and 23.5 percent
of all-India production) and potatoes (14.9 million tonnes and 31 percent of all-India
production) in the country. Figure 5 shows the respective shares of major crops, fruits and
vegetables in UP’s Gross Cropped Area in TE 2002-03 and TE 2013-14.
Figure 5: Share of Major Crops, Fruits and Vegetables in Gross Cropped Area in UP
Source: Directorate of Economics, and Statistics, GoI
Table 3 shows the share of Uttar Pradesh in all-India area under cultivation of major crops and
all-India production of major crops for TE 2002-03 and TE 2014-15. The figures in parenthesis
show the actual area under cultivation and actual production of these crops in Uttar Pradesh for
the respective periods.
Gross Cropped Area: 25 mha Gross Cropped Area: 25.9 mha

11
Table 3: UP’s Share in All-India Area under Cultivation and All-India Production of
Major Crops
TE 2002-03 TE 2014-15
Area %
(mHa)
Production %
(mmt)
Area %
(mHa)
Production %
(mmt)
Rice 13.1 (5.7) 13.6 (11.4) 13.5 (5.9) 13 (13.7)
Wheat 35.7 (9.2) 35.7 (24.8) 32 (9.8) 29.9 (27.5)
Maize 13.1 (0.9) 10.5 (1.3) 8.2 (0.7) 5.4 (1.3)
Total Coarse
Cereals
8 (2.3) 10.9 (3.3) 8 (2) 8.8 (3.7)
Total Cereals 17.6 (17.3) 21.5 (39.4) 17.8 (17.7) 18.8 (45)
Gram 14.5 (0.8) 16.9 (0.8) 6.5 (0.6) 5.9 (0.5)
Tur 11.2 (0.4) 19.5 (0.4) 7.7 (0.3) 8.6 (0.3)
Total Pulses 12.8 (2.7) 18.9 (2.2) 9.7 (2.3) 10 (1.8)
Total Oilseeds 5.7 (1.3) 5.7 (1) 4.2 (1.1) 3 (0.9)
Sugarcane 46.2 (2) 39.2 (115) 43.7 (2.2) 37.9 (133.4)
Source: DES
4. Sources of Agricultural Growth in Uttar Pradesh
Agricultural growth can be viewed in terms of growth in the value of output of agriculture and
allied activities. When we decompose this number, we arrive at the contribution of different
sectors in the growth of agriculture in UP during the period under study.
Figure 6 shows the shares of different sectors in the value of output of agriculture and allied
activities for three periods – TE 2001-02, TE 2007-08 and TE 2013-14. There is significant
decline in the share of food grains in the value of output of agriculture – the share of cereals
declined from 32.1 percent in TE 2001-02 to 24.9 percent in TE 2013-14, and that of pulses
declined from 4.3 percent to 2.9 percent. The share of fruits and vegetables has also declined
from 11.8 percent to 8.3 percent during this period. Livestock and fisheries have shown
significant increases in their respective shares in the value of output – share of livestock
increased from 24.1 percent to 29.7 percent between TE 2001-02 and TE 2013-14, and that of
fisheries increased from 0.9 percent to 1.2 percent during this period.
In the 14-year period between 2000-01 and 2013-14, value of agriculture and allied activities
in UP grew at an average annual rate of 4.32 percent at 2015-16 constant prices. Decomposing
this growth into various sectors, the largest share (39.4 percent) comes from the livestock
sector, followed by the sugar sector (13.8 percent) – almost all of it coming from sugarcane
and gur. Forestry is the next most important contributor (10.8 percent), followed by cereals
(10.7), fruits and vegetables (8.5 percent) and fisheries (1.5 percent). Oilseeds contribute a
meagre 0.1 percent to agri-growth, whereas pulses, during this period, have actually
contributed negatively (-0.7 percent) to agri-growth in UP. Livestock has been the largest
contributor to agri-growth in UP during this period. Within the livestock sector, milk has the
highest share in agri-growth at 28.9 percent followed by meat at 5.6 percent.

12
Figure 7 shows the shares of different sectors in the average annual growth in the value of
output of agriculture and allied activities in Uttar Pradesh between 2000-01 and 2013-14.
Figure 6: Shares of Sectors in the Value of Output of Agriculture and Allied Activities
Source: Authors’ Calculations based on CSO, MOSPI
Figure 7: Shares of Sectors in Average Annual Growth of Value of Output of
Agriculture and Allied Activities (4.3 percent) between 2000-01 and 2013-14
Source: Authors’ Calculations based on CSO, MOSPI
32.13 28.01 24.93
4.253.27
2.92
1.841.79
1.62
12.15
11.5512.76
11.78
10.798.83
24.07
24.22 29.68
0.93
0.97 1.21
12.8519.41 18.04
0%
10%
20%
30%
40%
50%
60%
70%
80%
90%
100%
TE 2001-02 TE 2007-08 TE 2013-14
Forestry, Fibres, others
Total Fisheries
Total Livestock
Total F&V
Total Sugar
Total Oilseeds
Total Pulses
Total Cereals
Livestock39%
Others16%
Sugar14%
Forestry11%
Cereals10%
F&V8%
Fisheries1%
Oilseeds0%
Pulses-1%

13
4.1 Livestock
Uttar Pradesh has done a pretty good job in the animal husbandry sector. Livestock is the largest
contributor to the growth of agriculture and allied sectors between 2000-01 and 2013-14
accounting for 39.4 percent of the growth in value of output of agriculture and allied activities
in UP during this period. Its share in the value of output of agriculture and allied activities has
also increased consistently from 24.1 percent in TE 2001-02 to 29.7 percent in TE 2013-14.
Within livestock, milk accounts for the largest share (28.9 percent) in the growth of agriculture
in UP between 2000-01 and 2013-14, followed by meat (5.6 percent), other livestock products
such as wool, skin, etc. taken together (4.5 percent) and eggs (0.3 percent). Figure 8 shows the
decomposition of the value of output of the livestock sector and their contribution to overall
growth in agriculture in UP during the period under study.
Figure 8: (a) Shares of Components of Livestock in Value of Output of Livestock (b)
Shares of Components of Livestock in Growth in Value of Output of Agriculture and
Allied Activities between 2000-01 and 2013-14
Source: Authors’ Calculations based on CSO, MOSPI
4.1.1 Milk
Uttar Pradesh has been the largest producer of milk in India since 2001-02 contributing roughly
17 percent to all-India production of milk in 2015-16. But its processing levels through
organized dairies remain much below (less than 12 percent) the all-India average (17 percent)
and those in states like Gujarat (49 percent) (Figure 9). While milk accounts for about 28.9
83.0576.83
68.08 66.43
0.51
0.65
3.36 3.49
11.2412.93
16.81 20.4
5.19 9.59 11.75 9.67
0%
10%
20%
30%
40%
50%
60%
70%
80%
90%
100%
TE 2001-02
TE 2013-14
TE 2001-02
TE 2013-14
UP UP India India
Others
Meat
Eggs
Milk
28.9
5.64.5
0.3
0
5
10
15
20
25
30
35
per
cen
t
(a) (b)

14
percent of the growth in agriculture and allied sectors in the 14-year period starting 2000-01,
its share in the value of output of the livestock sector has been declining from 83.1 percent in
TE 2001-02 to 76.8 percent in TE 2013-14 (Figure 8 (a)). The Kamdhenu Dairy Scheme which
provided interest subsidy to farmers in getting 100 animals or 50 animals of high-class breed
has been a tremendous success in the state. Amul has set up two new processing plants of 5
lakh liters per day each and is coming up with a third one.
Figure 9: Milk Production and Organized Processing in Major Producing States: 2014-15
Source: National Dairy Development Board (NDDB)
The Pradeshik Cooperative Dairy Federation (PCDF) was established in Uttar Pradesh in 1962
with the aim to develop organized dairying on the lines of a cooperative in the state9. Over the
years, PCDF has expanded its horizon to include various technical, training and R&D activities.
At present, PCDF lends its support and services to rural milk producers through 59 District
Milk Unions and about 7,255 Village Dairy Cooperatives (VDCs) in the State. In the recent
past, however, there has been a consistent decline in the number of Village Dairy Cooperatives
in the state (16,856 in 2006-07 to 7,255 in 2015-16) and farmers’ membership in these VDCs
(5.9 lakh in 2006-07 to 3.1 lakh in 2015-16). As shown in Figure 10, procurement of milk and
liquid milk sale in the cooperative sector in UP have also fallen significantly. The PCDF has
incurred huge losses amounting to Rs.23.86 crores in TE 2014-15.
9 “Parag” is the brand name for a range of milk and milk products produced by the cooperative sector in Uttar
Pradesh
0
10
20
30
40
50
60
0
5
10
15
20
25
30
per
cen
t
MM
T
Production (MMT) (LHS) Organised Processing as a Share of Production (%) (RHS)

15
Figure 10: Dairy Cooperative Sector in UP
Source: Pradeshik Cooperative Dairy Federation (PCDF), Uttar Pradesh
The population shares of in-milch Crossbred Cows (CBC) is 4 percent, Non-Descript (Desi)
Cows (NDC) is 30 percent and Buffaloes is 66 percent in the total in-milch cattle population
in UP. Their milk production shares are 8 percent (CBC), 19 percent (NDC) and 73 percent
(Buffalo), respectively. Average yield of milk per animal in UP has increased for CBC from
6.5 kg/day in 2001-02 to 7.1 kg/day in 2014-15, for NDC from 2.3 to 2.6 kg/day, and for
Buffaloes from 4.1 to 4.5 kg/day during this period. Despite this marginal increase in
productivity, UP lags behind states such as Punjab (CBC: 11.2; NDC: 6.8; Buff: 8.7 kg/day in
2014-15), Haryana (CBC: 8.8; NDC: 5.4; Buff: 7.8 kg/day in 2014-15) and Gujarat (CBC: 9.1;
NDC: 4.2; Buff: 5.0 kg/day in 2014-15) who have much higher productivity of milk. Average
yield per animal has increased only slightly from 3.0 kg/day in 1992-93 to 4.03 kg/day in 2014-
15, compared to Kerala where it increased from 3.9 kg/day to 8.2 kg/day and Punjab where
yield per animal increased from 5.8 to 9.2 kg/day in the same period. With appropriate
measures to improve productivity of milk, and increased participation of successful
cooperatives like AMUL and other private players in the processing of milk, the dairy sector
can revolutionize agri-growth in the state and can lead to a significant increase in the incomes
of farmers, thus reducing rural poverty.
4.1.2 Meat, Egg and other Livestock Products
The share of meat, egg and other livestock products such as wool, hides, etc. has been
increasing in the total value of output of livestock in UP. The share of meat increased from
11.2 percent to 12.9 percent, that of egg from 0.5 percent to 0.7 percent and the share of other
products from 5.2 percent to 9.6 percent between TE 2001-02 and TE 2013-14. Meat
contributed a significant 5.6 percent and other products another 4.5 percent to overall growth
in value of output of agriculture and allied activities between 2000-01 and 2013-14. Eggs only
marginally contributed to agri-growth during this period (Figure 8).
0
2000
4000
6000
8000
10000
12000
14000
16000
18000
0
200
400
600
800
1000
1200
2006-07 2007-08 2008-09 2009-10 2010-11 2011-12 2012-13 2013-14 2014-15 2015-16
Nu
mb
ers
'00
0 k
g/d
ay
Milk Procurement ('000 kg/day)) Liquid Milk Sale ('000 kg/day)
Functional Societies (Village Dairy Cooperatives)

16
Total meat production in registered slaughter houses (including meat processing plants) in UP
was close to 1.1 million tonnes in 2014-15. Of this, buffalo meat accounted for 69 percent, goat
meat for 16 percent, pig meat for 13 percent and sheep meat for 2 percent. Production of eggs
has also increased from about 747.6 million eggs (1.9 percent) in 2002-03 to 2.1 billion eggs
(2.6 percent) in 2014-15. A special poultry scheme where interest subsidy has been given seems
to have given good results.
The state government should invest in modernizing the large number of state (municipal
corporation)-owned slaughterhouses in UP which have continued to operate in particularly
unhygienic conditions in violation of the municipal, FSSAI and pollution control norms. This
will ensure that the environment does not get polluted or contaminated and the people can
continue to have access to hygienic meat.
Livestock rearing is an important activity that can enhance incomes of small farmers. Engaging
in animal husbandry along with crop cultivation can fetch farmers, especially those with
uneconomic size of holdings, incomes in addition to the returns they get from crop cultivation,
enhancing their overall income. Given that livestock is the biggest contributor of agricultural
growth in Uttar Pradesh, mixed farming (crop cultivation and animal husbandry) could bear
good results for farmers as well as for the agricultural sector in Uttar Pradesh.
4.2 Sugarcane
Sugarcane cultivation in India is majorly confined to two distinct regions – tropical comprising
the southern cane producing states of Andhra Pradesh, Karnataka, Maharashtra and Tamil
Nadu, and the sub-tropical cane producing states of Bihar, Uttarakhand and Uttar Pradesh. The
sub-tropical region encompasses 55 percent of total cane area but contributes only 48 percent
to total cane production and 35 percent to total sugar production in the country. On the other
hand, the tropical region has a 41 percent share in total cane area in the country but it contributes
49 percent to total cane production and 64 percent to total sugar production in the country. The
average cane productivity in the sub-tropical region was 61 tonnes/ha whereas that in the
tropical region was 84 tonnes/ha in 2014-15. However, one must not read too much into these
figures given the varying lengths of crop duration in these two regions.
Sugarcane is a thriving cash crop in Uttar Pradesh and the state is the largest producer of
sugarcane in the country providing employment to a large section of the rural population and
contributing to their socio-economic development. UP is also the second largest producer of
sugar in the country, after Maharashtra. Figure 11 shows the state-wise share in production of
sugarcane and sugar for TE 2014-15. Sugarcane and gur have together contributed 13.8 percent
to overall growth in value of output of agriculture and allied sectors between 2000-01 and
2013-14 in UP.
17
Figure 11: State-wise Shares in Production of Sugarcane and Sugar for TE 2014-15
Source: Commission for Agricultural Costs and Prices (CACP)
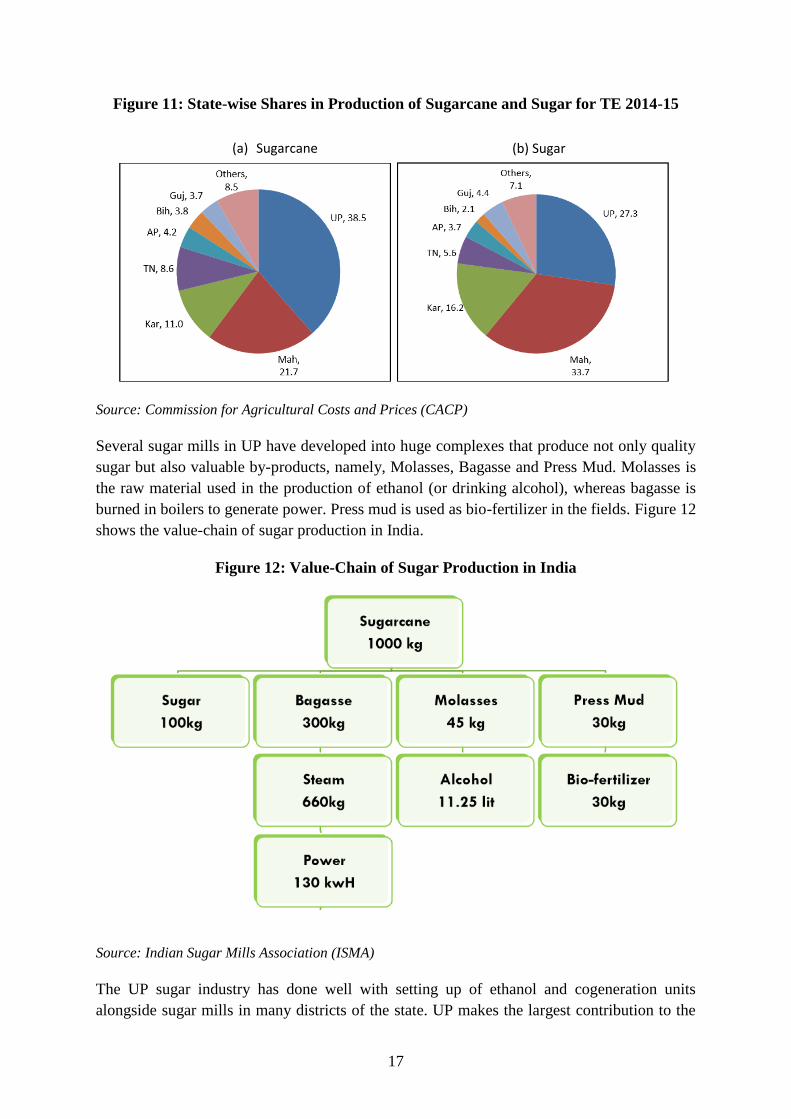
Several sugar mills in UP have developed into huge complexes that produce not only quality
sugar but also valuable by-products, namely, Molasses, Bagasse and Press Mud. Molasses is
the raw material used in the production of ethanol (or drinking alcohol), whereas bagasse is
burned in boilers to generate power. Press mud is used as bio-fertilizer in the fields. Figure 12
shows the value-chain of sugar production in India.
Figure 12: Value-Chain of Sugar Production in India
Source: Indian Sugar Mills Association (ISMA)
The UP sugar industry has done well with setting up of ethanol and cogeneration units
alongside sugar mills in many districts of the state. UP makes the largest contribution to the
(a) Sugarcane (b) Sugar

18
ethanol blending program of the Government of India supplying crores of litres each year
through Oil Marketing Companies (OMCs). In 2014-15, the annual installed capacity of
ethanol production in UP was 699.9 million litres from 33 units, whereas that in Maharashtra
was 751.5 million litres from roughly double the number of units (64). It is also supplying
nearly 1000 Megawatts of co-generated power to UP’s state electricity grid. In the same year,
UP had an installed cogeneration capacity (exportable) of 1464.25 Megawatt from 61 units,
next only to Maharashtra with an installed capacity of 1547.8 Megawatt from 90 units.
Production of sugarcane in UP increased from about 115 million tonnes in TE 2002-03 to 133.4
million tonnes in TE 2014-15. Its share in GCA increased only marginally from 8.2 percent in
TE 2002-03 to 8.5 percent in TE 2013-14 as did its area under irrigation from 89.7 percent to
92.9 percent. Productivity of sugarcane in UP increased from 56.3 tonnes/ha to nearly 61
tonnes/ha during this period. Yield of sugarcane in Uttar Pradesh has, however, remained
below the all-India average. This is attributed to the sub-tropical climate of UP and shorter
duration of the crop (9-10 months versus 14 months in Maharashtra). Under the Rastriya Krishi
Vikas Yojana (RKVY), special emphasis has been given to develop better varieties of cane.
Newer varieties like Co 0238 are early maturing and tend to give a higher yield (125-150
tonnes/ha) as compared to the popular varieties such as CoS 747 and CoS 8432 (50-62.5
tonnes/ha). This new variety can be assumed to have increased recovery rates in UP by about
1.25 percentage points on an average. The use of early varieties (such as 0238 and 98014) has
increased tremendously with roughly 52 percent of sugar mills using them at present as against
only 10-20 percent of mills using them earlier. This varietal replacement on a wide-scale has
improved recovery rates in UP to more than 10 percent as shown in Figure 13.
Figure 13: Recovery Rate of Sugarcane in UP
Source: Indian Sugar Mills Association (ISMA)
8
8.5
9
9.5
10
10.5
11
per
cen
t
19
4.3 Food Grains
UP is the largest producer of food grains in India. Production of cereals stood at 45 million
tonnes and that of pulses at 1.8 million tonnes in TE 2014-15. Within cereals, wheat and rice
occupy the most important place. Production of wheat increased from 24.8 million tonnes in
TE 2002-03 to 27.5 million tonnes in TE 2014-15, and production of rice increased from 11.4
million tonnes to 13.7 million tonnes during the same period. While the share of food grains
in total value of output of agriculture and allied activities in UP has fallen consistently, it has
contributed significantly (about 10 percent) to the growth in value of output of agriculture and
allied activities between 2001-02 and 2013-14. Within food grains, pulses contributed
negatively to agri-growth during this period. This clearly shows that cereals have been an
important source of agricultural growth in UP during this period.
4.4 Fruits and Vegetables
Uttar Pradesh is naturally endowed with a wide range of agro-climatic conditions prevailing
across the state which makes it suitable for growing a vast variety of horticultural crops.
Horticulture, which includes fruits, vegetables, flowers, spices, medicinal and aromatic plants,
has gained importance in the state for its role in enhancing rural incomes per unit area,
providing nutritional security not just to the people of the state but to the country as a whole,
providing raw materials for various agro-processing industries and as a source of considerable
amount of foreign exchange. This sector, therefore, plays an important role in the socio-
economic upliftment of the people of Uttar Pradesh.
UP comprises 5.7 percent of the total area under cultivation of fruits in India, and produced 7.9
percent (86.4 million tonnes) of the total fruits production in the country in TE 2014-15. In the
case of vegetables, UP comprises 9.9 percent of all-India area under cultivation of vegetables
and produced 12.1 percent (164.5 million tonnes) of all-India production of vegetables in TE
2014-15. In 2013-14, Maharashtra was the largest producer of fruits in the country producing
15.1 percent (13.5 million tonnes) of all-India production. West Bengal, on the other hand, was
the largest producer of vegetables in the country with a share of 14.1 percent (23 million tonnes)
in all-India production in that year. Fruits and vegetables have together contributed 8.5 percent
to overall growth in agriculture in UP between 2000-2001 and 2013-14. However, share of
fruits and vegetables in value of output has declined consistently from 11.8 percent in TE 2001-
02 to 8.8 percent in TE 2013-14.
In 2012-13, UP was the largest producer of mango, muskmelon and watermelon among fruits,
and potato and peas among vegetables. It was also a major producer of other fruits and
vegetables such as Amla, Guava, Bottle Gourd, Carrot and Sweet Potato. Banana has been a
tremendous success story in UP’s horticultural sector, though area under its cultivation is still
very small.
Given the huge potential for growing fruits, vegetables and other horticultural crops in Uttar
Pradesh because of its agro-climatic and geographical advantage, agricultural diversification
into this sector has remained rather limited as obvious from the falling share of value of output
of fruits and vegetables in the total value of output of agriculture and allied activities in the
state in the past decade. The state government has offered a special subsidy of Rs.3000 per
hectare for horticultural crops in the Bundelkhand region. Horticulture cultivation has both pros
– of a high return, high labour intensity requirement, short production cycles, and cons – of
high risks of crop failure from pest attacks, climatic disasters, and price fluctuations. The short
shelf-life normally requires good infrastructure to store as well as to move the produce to longer

20
distances. Although UP has almost 43 percent of all-India cold storage capacity, yet the highly
priced and unreliable power in rural areas hampers the tapping of its full potential, raising the
risk for farmers growing fruits and veggies. Only when farmers perceive that pros outweigh
the cons can one expect to see diversification of agriculture into horticulture in some significant
way. Lack of efficient value-chains and processing facilities for fruits and vegetables limits UP
from tapping its full agri-potential.
4.5 Fishery
Fisheries in UP contributed 1.5 percent to overall growth in agriculture and allied activities
between 2000-01 and 2013-14 and its share in the value of output of agriculture and allied
activities has risen significantly from 24.1 percent in TE 2001-02 to 29.7 percent in TE 2013-
14. Fish production in the state has increased from 28,958 tonnes (4.4 percent of all-India
production) in 2005-06 to 494,265 tonnes (4.9 percent of all-India production) in 2014-15.
Fish is an important source of protein and with dietary patterns of Indians undergoing a shift
toward higher-value proteins such as milk, meat, fish, etc., this sector plays an important role
in achieving nutritional security in the country in the present and in the future. UP is endowed
with plenty of inland water resources – 28,500 km of rivers and canals, and 4.32 lakh ha of
other inland water bodies such as reservoirs, tanks and ponds, and flood plain lakes and derelict
water bodies. The Gangetic riverine system offers immense scope for development of fisheries
in the state. Lack of technical know-how in the business has kept inland fish production from
reaching its optimal level in UP despite availability of resources.
5. Drivers of Agricultural Growth in Uttar Pradesh
5.1 Econometric Analysis
The performance of agriculture, especially growth in the sector, is dependent on a host of
factors. Farmers need incentives in terms of good profitability in farming of crops and animals.
This requires not only institutions but also infrastructure to get the markets right, and to get
incentives right. Some of these factors can be put in various categories such as : (a) physical
inputs used (seeds, fertilizer, insecticides, pesticides); (b) irrigation; (c) rainfall; (d) availability
of affordable credit; (e) availability of physical infrastructure (such as roads, electricity,
warehouses, etc.); (f) soundness of institutional infrastructure such as the procurement
agencies, state machinery providing extension services (soil sampling and testing, plant
protection, disease control, access to inputs, access to markets, etc.), and so on. However, it
may not be possible to examine the effects of such a large number of variables simultaneously
in a model. For this reason, in our study we select certain indicators and try to analyze their
effect on agricultural growth in UP.
We use the Ordinary Least Squares (OLS) method of regression to determine the drivers of
agricultural growth in Uttar Pradesh. The time period of study is 2000-01 to 2013-14, that is, a
period of 14 years. While we have used three alternative models, all of them can be represented
in their general form as the following equation:
Yt = β0 + β1X1 + β2X2 + β3X3
In all the three models, Yt is the natural log of the Gross State Domestic Product of Agriculture
(GSDPA) in UP at 2015-16 constant prices measured in Rs. Lakh; X1 is the natural log of the
Irrigation Ratio in UP calculated as the ratio of Gross Irrigated Area to Gross Cropped Area
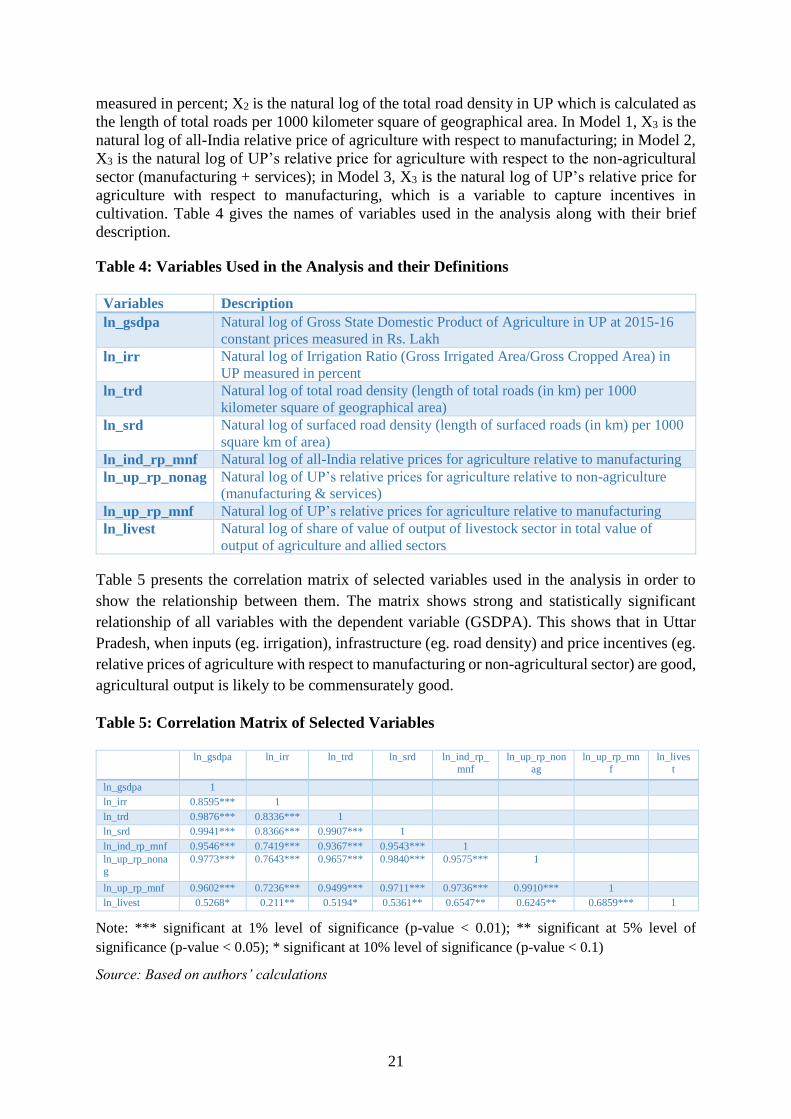
21
measured in percent; X2 is the natural log of the total road density in UP which is calculated as
the length of total roads per 1000 kilometer square of geographical area. In Model 1, X3 is the
natural log of all-India relative price of agriculture with respect to manufacturing; in Model 2,
X3 is the natural log of UP’s relative price for agriculture with respect to the non-agricultural
sector (manufacturing + services); in Model 3, X3 is the natural log of UP’s relative price for
agriculture with respect to manufacturing, which is a variable to capture incentives in
cultivation. Table 4 gives the names of variables used in the analysis along with their brief
description.
Table 4: Variables Used in the Analysis and their Definitions
Variables Description
ln_gsdpa Natural log of Gross State Domestic Product of Agriculture in UP at 2015-16
constant prices measured in Rs. Lakh
ln_irr Natural log of Irrigation Ratio (Gross Irrigated Area/Gross Cropped Area) in
UP measured in percent
ln_trd Natural log of total road density (length of total roads (in km) per 1000
kilometer square of geographical area)
ln_srd Natural log of surfaced road density (length of surfaced roads (in km) per 1000
square km of area)
ln_ind_rp_mnf Natural log of all-India relative prices for agriculture relative to manufacturing
ln_up_rp_nonag Natural log of UP’s relative prices for agriculture relative to non-agriculture
(manufacturing & services)
ln_up_rp_mnf Natural log of UP’s relative prices for agriculture relative to manufacturing
ln_livest Natural log of share of value of output of livestock sector in total value of
output of agriculture and allied sectors
Table 5 presents the correlation matrix of selected variables used in the analysis in order to
show the relationship between them. The matrix shows strong and statistically significant
relationship of all variables with the dependent variable (GSDPA). This shows that in Uttar
Pradesh, when inputs (eg. irrigation), infrastructure (eg. road density) and price incentives (eg.
relative prices of agriculture with respect to manufacturing or non-agricultural sector) are good,
agricultural output is likely to be commensurately good.
Table 5: Correlation Matrix of Selected Variables
ln_gsdpa ln_irr ln_trd ln_srd ln_ind_rp_
mnf
ln_up_rp_non
ag
ln_up_rp_mn
f
ln_lives
t
ln_gsdpa 1
ln_irr 0.8595*** 1
ln_trd 0.9876*** 0.8336*** 1
ln_srd 0.9941*** 0.8366*** 0.9907*** 1
ln_ind_rp_mnf 0.9546*** 0.7419*** 0.9367*** 0.9543*** 1
ln_up_rp_nonag
0.9773*** 0.7643*** 0.9657*** 0.9840*** 0.9575*** 1
ln_up_rp_mnf 0.9602*** 0.7236*** 0.9499*** 0.9711*** 0.9736*** 0.9910*** 1
ln_livest 0.5268* 0.211** 0.5194* 0.5361** 0.6547** 0.6245** 0.6859*** 1
Note: *** significant at 1% level of significance (p-value < 0.01); ** significant at 5% level of
significance (p-value < 0.05); * significant at 10% level of significance (p-value < 0.1)
Source: Based on authors’ calculations

22
The results of the regression are shown in Table 6. It can clearly be seen that irrigation, road
density and relative prices for agriculture have a positive and statistically significant effect on
agriculture-GSDP in Uttar Pradesh. The three variables – irrigation ratio, total road density per
1000 square kilometers and relative prices for agriculture explain 98-99 percent of the variation
in GSDPA in UP during this 14-year period.
Table 6: Regression Results for Determining Drivers of Agricultural Growth in UP
between 2000-01 and 2013-14
Model 1 Model 2 Model 3
Constant 5.17
(3.57)***
4.30
(3.41)***
4.16
(2.87)**
ln_irr 1.09
(2.60)**
1.26
(3.51)***
1.40
(3.34)***
ln_trd 0.64
(5.11)***
0.43
(3.11)**
0.51
(3.56)***
ln_ind_rp_mnf 0.46
(3.07)**
ln_up_rp_nonag 0.81
(4.20)***
ln_up_rp_mnf 0.57
(3.45)***
R-squared 0.989 0.992 0.990
Adjusted R-squared 0.986 0.990 0.987
Number of
Observations
14 14 14
Note: *** significant at 1% level (p-value < 0.01); ** significant at 5% level (p-value < 0.05); *
significant at 10% level (p-value < 0.1)
Source: Based on authors’ calculations
In all the three models, the largest positive and statistically significant effect on GSDPA of UP
is that of irrigation ratio, and then the effects of total road density and relative prices for
agriculture become more or less than the other based on the model we use. On an average, all
the three models show that a 1 percent increase in irrigation ratio increases UP’s agri-GSDP
by more than 1 percent (roughly 1.25 percent on an average); a 1 percent increase in total road
density in UP increases agri-GSDP in the state by about 0.5 percent (roughly 0.52 percent on
an average); and a 1 percent increase in relative prices of agriculture increases the state’s agri-
GSDP by about a little more than 0.5 percent (0.61 percent on an average).
Farmers are rational decision-makers who require appropriate incentives to invest in improving
production and productivity. It is no surprise that getting the right prices for their produce is
the most important incentive for farmers to invest in agricultural production, productivity and
land development. Farmers producing wheat and rice in UP are not offered remunerative prices
for their produce. In reality, they are even deprived of the basic Minimum Support Price (MSP)
that the government is obliged to pay in return for all the wheat and rice that they may like to
produce. From a field visit to Sitapur district in January 2017, we gathered that government

23
procurement of paddy was negligible in the region and the farmers had to sell their produce in
open markets for prices ranging between Rs.1000 and Rs.1125, which was much below the
MSP (Rs.1470 for Common and Rs.1510 for Grade A) fixed for paddy for the Kharif season
of 2016-17. We made similar observations from our field visit to Amroha district in UP where
farmers complained of the absence of procurement operations altogether. This is the case in
most of the other districts of UP - farmers are forced to sell their main produce for prices that
are 10-20 percent lower than MSP. This is a result of inadequate procurement operations in
UP.
Procurement of wheat and rice by state agencies in UP has been historically poor. The state-
wise production, marketed surplus, procurement and procurement centres/agencies of wheat in
TE 2015-16 are given in Figure 14. In UP, which is the largest producer of wheat in the country,
with nearly 4912 procurement centres (as in 2014-15), only 4 percent of total marketed surplus
was procured in 2015-16 down from 14.4 percent in 2014-15. It accounted for a meagre 4.8
percent of total wheat procurement in TE 2015-16. This is among the lowest procurements
from the major wheat-producing states of India. Uttar Pradesh is a non-DCP (De-Centralized
Procurement) state and with so many procurement centres at work, such poor levels of
procurement raises concerns regarding the resource-use efficiency of procurement operations
in UP and the drain it imposes on the public exchequer of the state (Price Policy for Rabi Crops
- The Marketing Season 2017-18, 2016).
This is the reason behind low productivity (2-3 tonnes/ha) of wheat and rice in UP. Farmers
invest in productivity-enhancing inputs/techniques (fertilizers, pesticides which are often very
expensive) when they get assured returns for their investment. The failure of the UP
government in procuring farmers’ produce and ensuring timely payment of MSP to them has
been the most prominent deterrent to improvements in productivity in the state.
Figure 14: State-wise Production, Marketed Surplus, Procurement and Procurement
Centres/Agencies of Wheat in TE 2015-16
Note: Procurement Centres are of 2014-15
Source: Commission for Agricultural Costs and Prices (CACP)
0
1000
2000
3000
4000
5000
6000
7000
0
5
10
15
20
25
30
Punjab Haryana MP Rajasthan UP Bihar
Pro
cure
men
t C
entr
es
Mill
ion
To
nn
es
Production Marketed Surplus Procurement Procurement Centres

24
In the case of dairy, farmers in UP receive approximately 35-40 rupees per litre of milk (6.5
percent fat and 9 percent Solid Non-Fat) depending on whether they sell to the cooperative or
private sector. However, the cooperative sector is bogged down by excessive bureaucratic
control and thus offers lower prices (35-37 rupees) than the private sector (approximately 37-
42 rupees) for the same fat and SNF levels. This is a major cause of falling procurement of
milk by the cooperative sector. The presence of private players in UP is, at best, patchy, forcing
many farmers to sell their produce to cooperatives in lieu of benefits of membership in a village
dairy cooperative. The procurement price in Gujarat, on the other hand, is nearly 42.5 rupees
per litre of milk (7 percent fat and 9 percent SNF). Farmers fetch at least 20 percent lower
prices from cooperatives than they do from the private sector in UP. And UP milk farmers get
15 percent lower prices for their milk produce than farmers in Gujarat. This makes a huge
difference given the large production of milk in UP. This is another case of a skewed incentive
structure. Another reason for the difference between procurement prices of cooperatives and
private players is that the latter produce a large variety of processed value-added products (milk
powder, ghee, yoghurt, etc.) apart from liquid milk which makes it a more profitable venture
for them, unlike the cooperative sector in UP which largely produces liquid milk and some
milk-based indigenous products (kheer, paneer, sweetmeats, etc.).
Similar is the case with sugarcane. The state's politically motivated and arbitrary price policies
have distorted the incentive structure for sugarcane farmers to invest in land development and
productivity enhancement. (The issues related to sugarcane in UP have been discussed in
greater detail in another section ahead.)
Apart from getting incentives right, it is also important to get the physical and institutional
infrastructure in place which is lacking in UP. Rural road connectivity10 is one such crucial
infrastructure. In addition to investments that are targeted directly at agriculture, public
expenditure on rural infrastructure such as roads contributes to growth in agricultural
production and even more to poverty reduction in rural areas (Fan, Gulati and Thorat, 2007).
While total road density in UP is reasonably high (1727.5 km per 1000 square kilometers in
TE 2014-15), rural connectivity is still an issue. A well-developed rural road network is
imperative for sustainable and inclusive development through provision of last mile
connectivity to interior areas. This enhances efficiency in production, distribution and
consumption. In its absence farmers find it difficult to get their produce to the markets/mandis.
Nearly 43,029 habitations are still unconnected in the state based on the status of road
connectivity as per the Pradhan Mantri Gram Sadak Yojana (PMGSY) norms.
As far as irrigation11 is concerned, UP has a reasonably high irrigation ratio (77.9 percent in
TE 2013-14) compared to the all-India average (47.4 percent) and even a few agriculturally
better-performing states of India. Tubewells and wells are the most widely used sources of
irrigation in the state accounting for 79.8 percent of the Net Irrigated Area in TE 2013-14.
However, due to erratic and short power supply in the fields, a majority of marginal and small
farmers in the state depend on diesel pump sets for irrigation and this is a major cause of
10 See Appendix 1 for status of agri-rural infrastructure in UP 11 See Appendix 1 for status of agri-rural infrastructure in UP

25
inadequate utilization of irrigation facilities. Bundelkhand is the least irrigated region in the
state (41 percent) where there is certainly scope for improvement especially by using micro-
irrigation
The new government must take into account these issues in setting their agenda for agriculture
in UP.
6. Conclusions and Observations
While the share of agriculture and allied activities in UP’s GSDP has been declining
consistently, it still makes a significant contribution to the same
Agriculture has grown at snail’s pace in these 14 years at 2.5 percent per annum – worse
than the all-India average annual growth rate of agriculture (2.9 percent)
GCA in UP has grown only marginally; cropping intensity has increased somewhat but
remains much below that in other states such as Punjab, Haryana
While food grains are of immense significance to agriculture in UP, their share in value
of output of agriculture and allied activities has consistently declined – productivity
levels remain much below those in Punjab despite better endowment of natural
resources
Cultivation of sugarcane, another important crop in UP, and the related sugar industry
is fret with inefficiencies and has largely been marred by politically motivated myopic
policy decisions
Diversification in agriculture in UP has come mainly from the livestock sector,
fisheries, and forestry
Milk has played the most important role as a source of agri-growth in UP during
FY2001 to FY2014, and can play an even more significant role in the years to come
provided efficient organized processing facilities are developed. Local milk
cooperatives in UP have not taken off very well, and milk growth is largely led by the
private sector. UP’s dairy cooperative must, therefore, make way for cooperative giants
like AMUL and other private players who may be able to propel agri-growth in UP
through the milk sector Meat has also contributed to growth in agriculture in UP, and it
may be noted that UP is one of the top suppliers of buffalo meat for exports, which has
lately made India the largest exporter of buffalo meat in the world.
In general, encouraging private sector to engage in procurement of food grains or
contract farming in horticulture, and crowding-in private investment in dairy
processing, rural infrastructure development and modernization of old, unhygienic
abattoirs, could free agriculture in UP of the institutional, infrastructural and political
constraints that it presently faces
Given the rich natural endowments that UP is bestowed with and that irrigation ratio
and road density in UP are relatively better than in many other better performing states,
26
it is right incentives (MSP for wheat and rice; FRP for sugarcane; procurement prices
for dairy) that can really get agriculture moving in UP
Poor rural connectivity, power shortages often leading to inadequate irrigation must
also be addressed for UP to harness its full potential
Poor incentives, poor infrastructure and poor governance largely explain the lack-lustre
performance of agriculture in UP in the past decade-and-a-half
7. Policy Interventions
In light of the analysis put forth in this paper, we flag certain areas that need immediate policy
attention and intervention in order to improve the state of agriculture and farmers in Uttar
Pradesh. Agriculture in UP has immense potential and can easily achieve a growth rate of 5
percent per annum - double of what it has been able to achieve in the last 14 years under study.
While UP has lagged behind in some sense, we must realize that it gives us the opportunity and
advantage of looking at what other high-performing states did right, and replicating the same,
while also reflecting on their mistakes and learning from them. Based on our analysis of the
sources and drivers of agricultural growth in UP in the period between 2000-01 and 2013-14,
the following policy interventions are recommended to achieve higher and sustainable
agricultural growth in the state.
Getting Incentives Right
7.1 Procurement of Food Grains
The Eastern Zone of UP is flood prone and in order to ensure household food security, emphasis
on food grains cultivation is very high here. Of all zones in Uttar Pradesh, Eastern UP has the
highest share (87.2 percent in 2013-14) of its Gross Cropped Area under food grains
cultivation. The Eastern Zone abounds in paddy cultivation (35.1 percent of GCA) because of
easy availability of water. While wheat is a prominent crop in almost all districts of UP, the
share of wheat in GCA is highest in the Eastern and Central Zones. Taken together, wheat and
rice occupy the largest share of the Gross Cropped Area in the Eastern Region (75.5 percent in
2013-14) followed by the Central Region (60 percent in 2013-14). It is critical to address the
most important problem faced by wheat and paddy farmers in these regions – non-remunerative
prices for their produce.
The poor procurement of wheat and rice in Uttar Pradesh is primarily due to weaknesses of the
state procurement machinery. Firstly, the primary problem of the procurement machinery in
Uttar Pradesh lies in the fact that arrival data is not regularly and accurately recorded in
Agmarknet portal by mandi personnel who are paid an honorarium by Govt of India for the
purpose. The Marketing Research and Information Network (MRIN) is a sub-scheme of the
Integrated Scheme for Agricultural Marketing (ISAM) of the Government of India, and has
been functioning since March 2000. The prices and arrival data is reported by the APMCs and
jointly monitored by the DMI, NIC and Marketing Boards of the states/UTs. An incentive of
Rs.1000 per month is provided to the data reporting officials of the APMCs for reporting of

27
data for more than 20 days in a month. Despite these provisions, out of a total of 257 market
nodes in UP, only 151 markets are reporting, and only 84 reporting for more than 20 days. As
many as 106 markets are not reporting at all (as on December, 2016). This could either be a
matter of pure negligence or it could well be the rent-seeking interests of the personnel
involved. Unless there is officially recorded data on price and arrivals in mandis on a public
portal, farmers are likely to be exploited by middlemen.
Secondly, market arrivals are very low in Uttar Pradesh. The state has not developed adequate
infrastructure – there are no proper rural roads for farmers to get their produce to the
procurement centres, the facilities at these centres are also unsatisfactory, there is no electricity,
and so on. Earlier there were also problems of inadequate storage facilities, which have been
addressed to some extent.
Thirdly, even when farmers bring their produce to the mandis and data is recorded, they do not
receive the minimum support price for their produce and there is significant delay in payment.
Traders reduce the price offered much below the MSP on the pretext of high moisture content,
poor quality, impurity, etc. Small village traders and aggregators also charge arbitrary rates of
commission. As a result, only the large farmers get into contractual agreements at the mandis
forcing the marginal and small farmers to either accept much lower prices at the mandi or to
sell their produce to middlemen at prices lower than MSP to avoid delayed payment.
The new government must strive to erect a sound procurement system on the lines of Madhya
Pradesh where procurement of wheat rose from 0.37 million tonnes in TE 2002-03 to about 6.1
million tonnes in TE 2015-16 increasing its share in total procurement of wheat in the country
from about 2 percent in TE 2002-03 to 23.3 percent in TE 2015-16. The following interventions
are suggested for improving the procurement mechanism to ensure that farmers receive the
MSP and earn adequate returns for their investment in production.
First, ensuring timely and accurate recording of price and arrival data in mandis across the state
in the Agmarknet portal is critical. Without a sound database, no comprehensive analysis can
be carried out for the betterment of the state procurement machinery. Second, arrivals in the
mandis in UP are much below production levels as described above, especially in the case of
wheat and rice. This indicates weak linkages between the farm and markets and poor incentives
for the farmers to bring their produce to the Agriculture Produce Market Committee (APMC)
mandis. Adequate infrastructure (roads, electricity, transportation services, godowns, etc.)
must be created and put in place to enable farmers to get their produce to the mandis.
Additionally, receiving prices that are 10-20 percent lower than MSP dissuades farmers from
selling their produce at the mandi, thus lowering arrivals and also depressing farmers' incomes.
Third, ensuring payment of MSP in a timely fashion directly into the bank accounts of farmers
is crucial to incentivize farmers to get their produce to the procurement centres which would
also improve arrival of agricultural produce at the mandis.
Improving the physical and institutional infrastructure of public procurement in UP will go a
long way in enhancing farmer incomes and lifting agricultural households out of poverty.

28
Involving the private sector in procurement can be contemplated if the government can devise
a payment mechanism for the same.
The UP government tried to implement the Arhatiya Model (the system implemented in Punjab
and Haryana where Government of India bears the Arhatiya Commission of 2.5 percent) in
wheat and paddy in 2015-16 at its own cost bearing the Arhatiya Commission of 2.5 percent,
and the results were amazing. Nearly 22.67 lakh tonnes of wheat and 43.43 lakh tonnes of
paddy were procured as a result in 2015-16. The position of procurement of wheat and rice in
UP in the last 5 years is given in Table 7. This is evidence of the effect that remunerative prices
can have on procurement in UP.
Table 7: Position of Procurement of Wheat and Rice in UP in last 5 years
Wheat Rice
Year MSP
(Rs/qtl)
Wheat Procurement at
MSP (lakh tonnes)
MSP (Rs/qtl) Rice Procurement at
MSP (lakh tonnes) Common Grade-A
2012-13 1285 50.63 1250 1280 22.21
2013-14 1350 6.83 1310 1345 11.07
2014-15 1400 6.28 1360 1400 16.97
2015-16 1450 22.67 1410 1450 28.93
2016-17 1525 7.97 1470 1510 (Procurement in
progress)
Source: Food Corporation of India (FCI), UP Region
UP could have benefitted most from the price policy for food grains because of its high
production levels of wheat and rice. However, a weak procurement system has proved to be a
major disadvantage for the farming community in the state. The focus of reforms must,
therefore, be on improving agricultural marketing in the state in order to get the incentive
strucrureright.
7.2 Electronic-National Agricultural Marketing (e-NAM)
Uttar Pradesh is the largest participant in the Central Government’s e-NAM project in terms of
the number of mandis. As on December 3, 2017, 66 mandis in UP have come under e-NAM
out of which 62 were live and traded. By this date, UP had achieved a total sales of 317,031.20
tonnes making up Rs.480.63 crores of trade value through electronic trading. The state
government must strive to bring progressively greater number of mandis under e-NAM. This
has the potential to make trading of food grains more transparent and therefore, equitable. By
eliminating rent-seeking opportunities, it also eliminates the bias that exists in favour of large
farmers in a physical mandi. It is high time that participation of mandis in e-NAM be increased
substantially given the appalling state of procurement in UP that has come up from recorded
data and interviews with farmers in the field. In this respect, Haryana has done a commendable
job by achieving Rs.6110.13 crores worth of trade value under NAM, which accounts for 78.9
percent of the total trade value under NAM in India. The state must ensure that auction is also
done through the e-NAM portal so that formation of cartels among traders is eliminated and
price discovery becomes transparent.

29
7.3 Dairy in UP
7.3.1 Improving Dairy Processing through Private Participation in the Dairy Sector
The cooperative model has largely failed in the dairy sector in UP. Daily procurement of milk
by dairy coops is a meagre 0.4 percent of daily milk production in the state. The cooperative
sector in UP has been running into losses for many consecutive years in the recent past. Thus,
the cooperative model for dairy has not taken off in UP. While the private sector is doing better
in this sector, its involvement can be increased enormously through appropriate policies and
incentives. What UP’s dairy sector needs immediately is more milk processing units. The
GoUP could invite AMUL and private sector dairies, tapping NABARD funds for dairy
development, to set up several medium-sized plants to process at least 30 percent of UP's milk
production in the next five years. Although UP is the largest milk producer of the country with
17 percent share (over 25 mmt), it has lagged far behind in processing (<12 percent) compared
to, say, Gujarat which processes almost half of its milk production through organized dairies.
As a result, farmers in UP get a lower price for milk. Therefore, ramping up milk processing
with several value-added products can prove to be a game-changer. Some private dairies like
‘Namaste’ and ‘Gyan’ are investing in the state. The state government must provide attractive
incentives (as had been done to develop the sugar industry in UP some years ago) to crowd-in
greater private investment in dairy processing. Such efforts along with development of efficient
dairy value-chains in the state will provide a great boost to dairy in UP which is the leading
source of agricultural growth in the state.
7.3.2 Improving Productivity of Milk
Technological innovations have developed methods to improve the variety of cattle through
artificial insemination using sexed semen. This not only increases (to about 90 percent) the
probability of female offspring through sex-selection, but also reduces risks of diseases in the
offspring as compared to that in purchased replacements. Thus, milk productivity in UP can be
increased tremendously (by nearly 3 to 4 times) by upgrading existing breeds to more superior,
higher quality breeds through cross-breeding of indigenous varieties with imported semen from
such high-yielding varieties (eg. Holstein, Jersey). The technology for sex-sorted semen is only
available with one company - Sexing Technologies, USA. There is a need to develop
indigenous technology in this area to upgrade indigenous breeds and improve productivity.
7.4 Sugarcane
The Western Zone of Uttar Pradesh is known as the food and sugar basket of UP. Of the total
area under sugarcane cultivation in UP in 2013-14, about 55.8 percent fell in the Western Zone.
Nearly 14.4 percent of the Gross Cropped Area in this region was under sugarcane in 2013-14,
followed by the Central region where 10.1 percent was under sugarcane cultivation.
Sugarcane occupies an important place in UP's agriculture, not only because it has contributed
significantly to agricultural growth in UP in the last 14 years but also because the state accounts
for the largest share of sugarcane production in the country. UP’s sugarcane feeds into its large
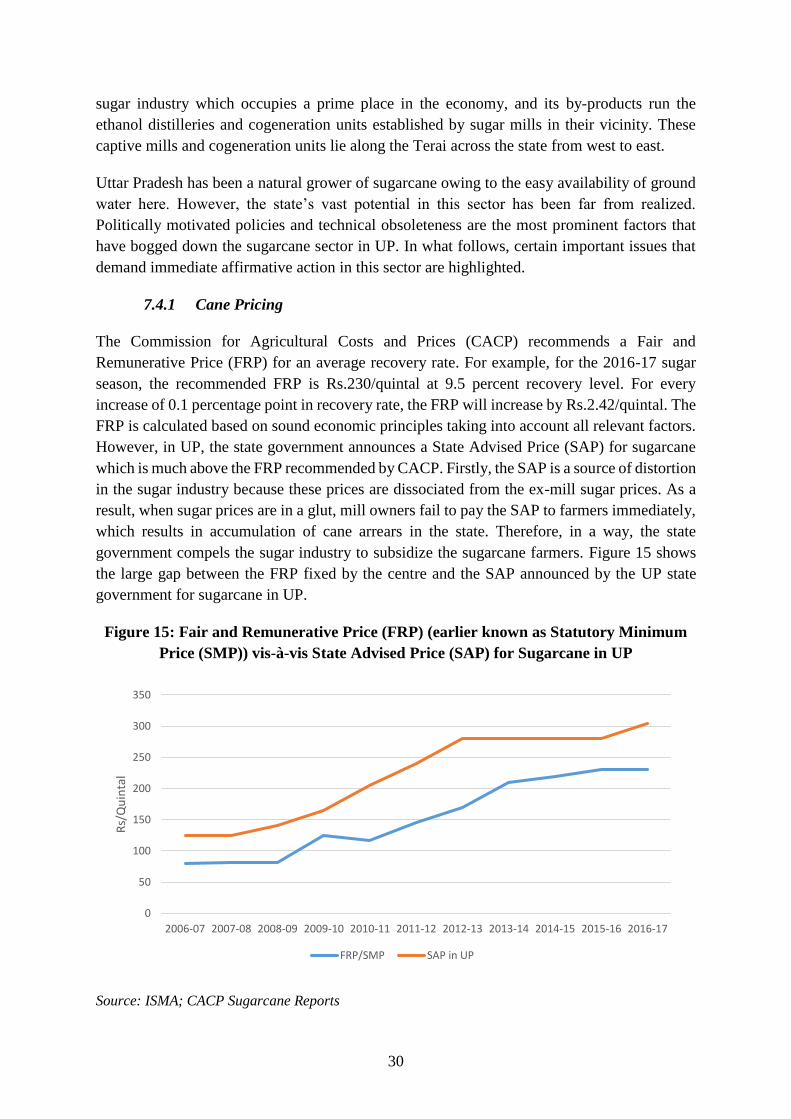
30
sugar industry which occupies a prime place in the economy, and its by-products run the
ethanol distilleries and cogeneration units established by sugar mills in their vicinity. These
captive mills and cogeneration units lie along the Terai across the state from west to east.
Uttar Pradesh has been a natural grower of sugarcane owing to the easy availability of ground
water here. However, the state’s vast potential in this sector has been far from realized.
Politically motivated policies and technical obsoleteness are the most prominent factors that
have bogged down the sugarcane sector in UP. In what follows, certain important issues that
demand immediate affirmative action in this sector are highlighted.
7.4.1 Cane Pricing
The Commission for Agricultural Costs and Prices (CACP) recommends a Fair and
Remunerative Price (FRP) for an average recovery rate. For example, for the 2016-17 sugar
season, the recommended FRP is Rs.230/quintal at 9.5 percent recovery level. For every
increase of 0.1 percentage point in recovery rate, the FRP will increase by Rs.2.42/quintal. The
FRP is calculated based on sound economic principles taking into account all relevant factors.
However, in UP, the state government announces a State Advised Price (SAP) for sugarcane
which is much above the FRP recommended by CACP. Firstly, the SAP is a source of distortion
in the sugar industry because these prices are dissociated from the ex-mill sugar prices. As a
result, when sugar prices are in a glut, mill owners fail to pay the SAP to farmers immediately,
which results in accumulation of cane arrears in the state. Therefore, in a way, the state
government compels the sugar industry to subsidize the sugarcane farmers. Figure 15 shows
the large gap between the FRP fixed by the centre and the SAP announced by the UP state
government for sugarcane in UP.
Figure 15: Fair and Remunerative Price (FRP) (earlier known as Statutory Minimum
Price (SMP)) vis-à-vis State Advised Price (SAP) for Sugarcane in UP
Source: ISMA; CACP Sugarcane Reports
0
50
100
150
200
250
300
350
2006-07 2007-08 2008-09 2009-10 2010-11 2011-12 2012-13 2013-14 2014-15 2015-16 2016-17
Rs/
Qu
inta
l
FRP/SMP SAP in UP
31
This wide gap has led to large cane arrears in UP. Out of 30 sugar mills in India having cane
arrears in excess of Rs.100 crores each, 27 (90 percent) were located in UP in 2014-15. The
Rangarajan Committee on Sugar (2012) has recommended that sugarcane prices must be
rationalized based on a combination of a minimum guaranteed price (Fair and Remunerative
Price or FRP) and a revenue sharing (RS) formula. Farmers have a legitimate right to share in
the value created in the sugarcane value-chain between the farmers and the millers in a fair and
equitable manner. This should be in proportion to the respective costs incurred by the sugarcane
farmers and sugar mill owners in producing sugarcane and sugar, respectively. Thus, the
Committee recommended that either 70 percent of the revenue generated from sugar (ex-mill
value of sugar) and each of the saleable primary by-products produced in the process of sugar
production, namely, molasses, bagasse and press mud (all ex-mill), or simply 75 percent of the
revenue generated from sugar (ex-mill value of sugar) alone be fixed as the cane dues payable
to the farmer for the sugarcane supplied. However, the farmers must be paid up-front the Fair
and Remunerative Price as the minimum under all circumstances. The above cane pricing
strategy recommended by the Rangarajan Committee must be implemented in UP with
immediate effect. It will not only relieve the farmers from the distress of delayed payments or
even non-payment that result in mounting cane arrears but will also provide a transparent
method of sharing the value created from the joint efforts of farmers and mill owners in a fair
and equitable way.
In a scenario where the state government, notwithstanding the FRP+RS formula for cane
pricing, decides to announce a State Advised Price for sugarcane, the amount by which the
SAP exceeds the FRP should be provisioned for explicitly in the state budget and should be
paid by the state directly to the farmers. This will help resolve the issue of cane arrears forever.
The UP government last year commendably paid more than Rs.2500 crores directly from the
state budget into the farmers’ accounts for cane dues. This is the right way to go and the state
should institutionalize the payment of the gap between the SAP and the FRP from the state
budget rather than through the industry. Mill owners must not be obligated to pay for a state
announced "subsidy" (effectively that is what a SAP is) to sugarcane farmers, especially as the
SAP bears little correlation with the ex-mill price of sugar and rules much above the FRP
(Figure 15).
7.4.2 Creating a Price Stabilization Fund for Sugarcane
In order to safeguard farmers against uncertainties of sugar prices, the state government should
allocate funds from its budget to create a price stabilization fund as a buffer for payment of
cane dues to farmers in years when sugar prices plummet. In years of depressed sugar prices,
this fund could be used to fulfill the gap between what mill owners can pay to farmers and the
FRP or SAP, whichever applies.
32
7.4.3 Molasses
The UP government’s policy on molasses for the sugar season 2015-16 obligates sugar mills
to reserve 25 percent of their balance stock12 for sale to country liquor producers. Because of
monopoly of certain big producers of country liquor, this is sold at approximately four times
lower the price it would fetch if sold freely in the open market. The sugar mills are also bound
to first release the reserved quantity to the country liquor producers before they can sell the rest
of the molasses in the open markets. Additionally, even though the captive mills are, by law,
allowed to use the molasses produced in their mills for their own distilleries, they require a
permit from the Excise Department to carry the molasses to their own distillery. However, in
practice, these mills find it extremely difficult to obtain these permits. The law, thus, in effect,
subsidizes country liquor production at the cost of the sugarcane farmers. Such a law is not
only counter-intuitive but also anti-welfare and exploitative in its motive as well as its outcome
and must be done away with immediately.
7.4.4 Flexible Ethanol Blending Program
UP is the largest supplier of ethanol in the country. UP also supplies ethanol to other states like
Uttarakhand, Delhi, Haryana, Punjab, Rajasthan and West Bengal. In 2014-15, the supply of
ethanol was 25 crore litres within UP and 21 crore litres outside UP. With the large capacity of
ethanol production in UP, a flexible ethanol blending program is desirable in order to take care
of the problem of sugar surpluses causing volatility in sugar prices. It would enable sugar mills
to divert molasses for ethanol production when there is likelihood of surplus sugar production
depressing the prices of sugar.
7.4.5 Unbiased State Policy
The UP state government provides assistance to cooperative mills in the form of loans (which
later get converted to state shares but are never recovered) to clear cane arrears to farmers. We
recommend that either all sugar mills (cooperative as well as private) be provided the assistance
without any discrimination or the state refrain from bailing out inefficient mills that are unable
to clear arrears. Any bias in such support tendered would encourage inefficient units of the
industry to continue operation and hamper the profitability of efficient sugar mills working on
their own merit.
7.5 Encouraging Farmer Producer Organizations in UP
A large proportion of land holdings in UP belong to smallholders and the latter also cultivate a
large share of the total area of landholdings. As a result, their marketable surplus is low and
they often sell their produce to middlemen in their villages at much lower prices rather than
going to the mandi or Government Purchase Centres. Therefore, development of farmer
producer organizations/companies needs greater emphasis in order to improve the bargaining
12 Balance stock for the purpose for 2015-16 sugar season is defined as unreserved initial stock + production of
molasses in 2015-16 sugar season – own consumption of captive sugar mills (sugar mills with their own
distilleries)

33
position of marginal and small farmers in the market. This is particularly important since the
cooperative system in the state has not been able to deliver as expected and trade cartels that
control agricultural markets in UP have continued to function and get political patronage across
regimes.
Getting Agri-Infrastructure Right and Getting Agricultural Inputs/Extension Moving
7.6 Enhancing Rural Road Connectivity
Road density turns out to be an important driver of agricultural growth in UP. Roads, especially
in the rural areas, are imperative for connecting farmers to markets. A poor rural road network
hampers access of farmers to inputs and restricts marketing of outputs. A well-connected rural
road network, on the other hand, eliminates the scope for middlemen to a great extent and
fetches the farmers much better prices for their produce. Both road density and the proportion
of surfaced roads has been on the rise in UP over the 14 years under study. However, despite
this seemingly good performance of the state in terms of road density, rural connectivity in UP
continues to remain inadequate leaving many habitations/villages unconnected. Table 8 shows
the physical targets and achievements of UP under the Pradhan Mantri Gram Sadak Yojna
(PMGSY) in the five years ending 2014-15. The achievements of the state in terms of both
habitations connected and length of roads built have been well below the targets in most years.
Delays of 3 to 36 months have been reported in the execution of 367 of the works as per the
Report of the Comptroller and Auditor General of India on Performance Audit of Pradhan
Mantri Gram Sadak Yojna, 2016. The state must ensure efficient utilization of resources
allocated for building rural roads and connecting remote habitations in order for farmers to
achieve greater and easier access to markets. The state must also ensure timely completion of
works and put already delayed works on a fast-track mode for completion as soon as possible.
This will provide strong incentives for agricultural diversification toward high-value crops,
livestock and agro-processing making higher agricultural growth more achievable and
sustainable.
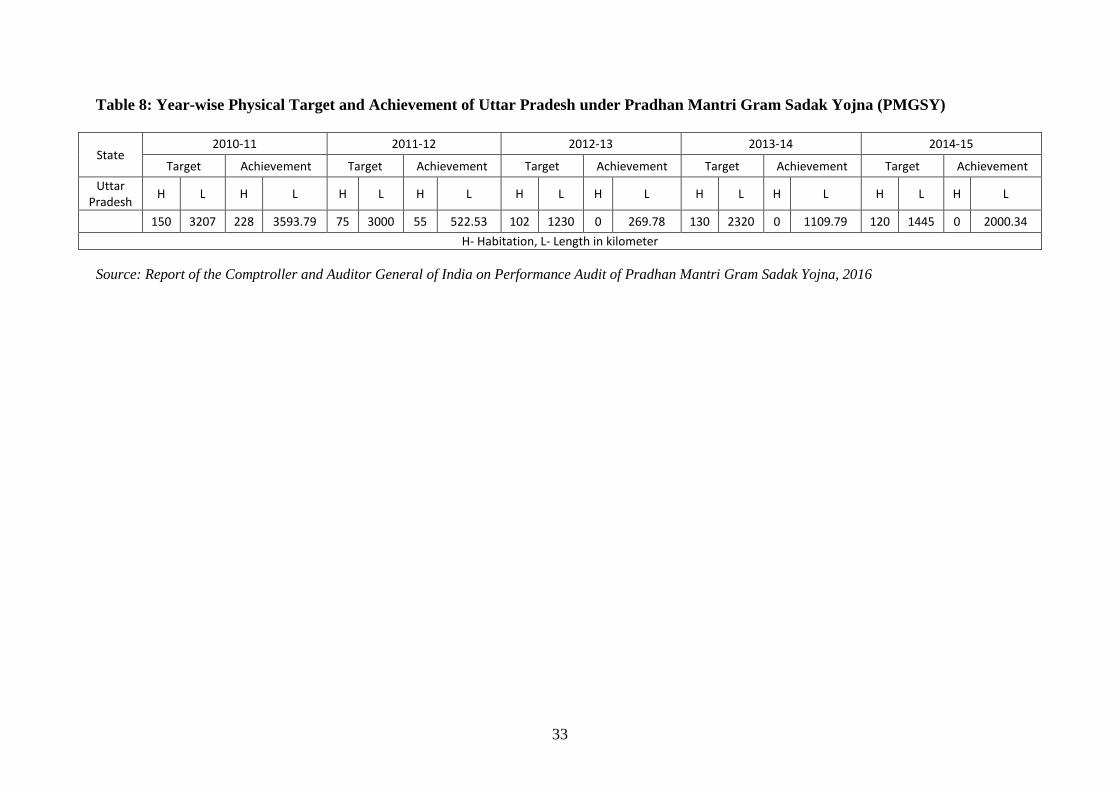
33
Table 8: Year-wise Physical Target and Achievement of Uttar Pradesh under Pradhan Mantri Gram Sadak Yojna (PMGSY)
State 2010-11 2011-12 2012-13 2013-14 2014-15
Target Achievement Target Achievement Target Achievement Target Achievement Target Achievement
Uttar Pradesh
H L H L H L H L H L H L H L H L H L H L
150 3207 228 3593.79 75 3000 55 522.53 102 1230 0 269.78 130 2320 0 1109.79 120 1445 0 2000.34
H- Habitation, L- Length in kilometer
Source: Report of the Comptroller and Auditor General of India on Performance Audit of Pradhan Mantri Gram Sadak Yojna, 2016

34
7.7 Irrigation
While the Western and Central Zones of UP are relatively well-irrigated, and the Eastern Zone
naturally receives large amounts of rainfall for crop production as well as ground-water
recharge, the Bundelkhand region lags far behind in irrigation development with average
irrigation ratio for the region being only 41 percent in 2013-14. The Bundelkhand region is
characterized by scanty rainfall and vast dry marginal lands. Around 44.3 percent of the Gross
Cropped Area in the Bundelkhand region was under pulses in 2013-14. The low rainfall in this
region impedes irrigation development here. We must, therefore, target improvement in water-
use-efficiency in the drier regions through use of water-saving micro irrigation
devices/techniques and watershed-based programmes to efficiently manage water resources.
7.7.1 Improving Water-Use Efficiency through Micro-Irrigation Techniques
Micro-irrigation techniques such as drip and sprinkler systems of irrigation have not been
adequately publicized in UP. These water conservation technologies need to be appropriately
incentivized and aggressively propagated by the state government in the water-scarce regions
of the state, especially in Bundelkhand and Western UP which are relatively more water-
stressed than the rest of UP, to encourage their adoption here (See Appendix 2 for status of
ground water in UP). As on 31.03.2015, 36,682 ha was under micro irrigation in UP out of
which 15,519 ha was under drip and 21,164 ha was under sprinkler. Drip irrigation is being
experimented in rice cultivation in Punjab (where it is seen to save 40-60 percent water) and is
being widely used for sugarcane in Maharashtra. Encouraging farmers in the Bundelkhand
region to shift to drip irrigation will ensure wider irrigation coverage and sustainable use of
available ground water resources, thus improving agricultural production and growth. In most
of our interactions with farmers in various field visits, farmers showed admirable keenness to
adopt the technology with the government support that subsidizes the cost of the equipment.
However, while on the one hand, government mechanism to propagate schemes among farmers
are completely absent in most districts, on the other hand, private sector and mill owners (in
the case of sugarcane cultivators) write the schemes off at their own judgement without
consulting the farmers or even giving them a choice.
7.7.2 Ongoing Irrigation Projects
The large irrigation potential of the state must be realized by taking water to farmers’ fields
and this needs highest priority. Large dams have to be completed on time and Bundelkhand
needs creation of more irrigation potential. The Centre, under the AIBP component of the
Pradhan Mantri Krishi Sinchai Yojana (PMKSY) scheme, has accorded priority to 99 irrigation
projects across the country for early completion. Among these 99 projects, three priority lists
– I, II and III – have been prepared for completion by 2016-17, 2017-18 and December, 2019,
respectively. In UP, none of the incomplete projects have been identified for Priority List I.
Bansagar Canal Project, Allahabad, with a total cost of Rs. 3,862.64 crores, has been taken up
under Priority List II. This project has achieved an overall weighted physical progress of 81.8

35
percent so far and Irrigation Potential Created (IPC) by it is estimated to be 50,000 ha. Under
Priority List III, three projects have been identified in UP: Arjun Sahayak (the total cost for
which is Rs.2,593.93 crores) which has achieved 42.3 percent physical progress so far; Madhya
Ganga Canal Phase II (with a total cost of Rs.2,865.11 crores); and Saryu Nahar (NP) (with a
total cost of Rs. 3,011.54 crores). There is no data on IPC estimates for the latter two projects
mentioned.
The state government should strive to complete the projects under Priority List II and III of the
PMKSY-AIBP scheme at the earliest and bring greater area under irrigation through them. The
state government should also identify other projects which are nearly complete and seek
funding from Centre under the AIBP component of the PMKSY for their rapid completion.
7.8 Extension Services
Extension services such as soil sampling, nutrient testing, soil health testing, agri-implements,
good quality seeds for wheat, rice, sugarcane are either absent from the government’s end or
of extremely poor quality. In one of our field visits to Amroha, farmers complained that there
was no laboratory anywhere near the region where soil samples could be tested. Sending their
samples to an outside laboratory took them more than a year before they could get the results
– that is after passage of 2-3 seasons of cultivation, rendering those results useless for the
farmers. On another field visit to Sitapur, we found that farmers were distressed because they
had absolutely no support from the government on plant diseases and their remedies. As a
result, they have to rely on bits and pieces of unreliable advice from private sellers of
insecticides/pesticides or do as they think best. Under the National Mission on Agricultural
Extension and Technology (NMAET), the Central Government was providing 90 percent of
the salary of extension staff but starting from December 2015, the Centre's share was reduced
to 50 percent which delayed salary payments to extension staff. There is also need for better
coordination between Krishi Vigyan Kendras (KVKs) and the extension machinery of State
Govt.
The sugarcane sector in UP has witnessed relatively better extension services from private
sugar mills in the form of introduction of new varieties of sugarcane, provision of facilities for
soil-testing, guidance on fertilizer and nutrient requirements of the soil, etc. These initiatives
for land and crop development have borne good results and have been successful in improving
sugarcane yield in UP.
Innovating for Sustainable Futuristic Agri-Growth and Development
7.9 Overcoming Power Shortages through Use of Solar Power
Uttar Pradesh receives large amounts of sunshine for very long periods of time during the year.
Harnessing solar power can be a long term solution for the problems of short and erratic power
supply to farmers for irrigation in the fields in UP. Replacing diesel pumps with solar pumps
can ensure assured power supply for the farmers at an upfront cost of installing the solar panels
and no substantial additional costs in successive years. Additionally, farmers could place solar
36
panels as a third crop (Gulati, Manchanda, & Kacker, 2016) at a height of 6-10 feet above their
usual crops depending on the height of the crop cultivated on the ground. This is shown not to
affect productivity negatively and farmers could, in fact, gain from feeding the additional
power to the grid for a given price. This would be an additional earning for the farmers apart
from the returns from crop cultivation. The state government should consider provision of
additional subsidy for the installation of solar panels for farmers. In the face of irregular and
insufficient power supply in most districts of Uttar Pradesh, the vast potential of solar power
at lower-than-thermal-power-costs must be tapped into adequately. Higher budgetary
allocations for the above initiatives could also prove helpful in propagating the idea widely.
7.10 Innovations in Farming
UP despite being the largest producer of mango in the country has relatively low levels of yield
(16 tonnes/ha in TE 2014-15). On an average, about 100 trees of mango are grown per hectare
in UP which yields roughly 7.5 to 10 tonnes of mango per hectare. Innovation in farming
practices have proven to improve yields drastically. In Maharashtra, Jain Irrigation Systems
Limited has experimented with innovative farming techniques which can increase yield
considerably. One such innovation is the cultivation of mango at High Density (350 trees per
hectare) and Ultra-High Density (UHD) (1,675 trees per hectare), the latter yielding 30-37.5
tonnes of the fruit per hectare. This is achieved through pruning of trees on a regular basis to
keep their size under control and mulching to keep the fruits from getting damaged on the
ground. Experimenting with such innovative farming techniques in UP can provide a huge
boost to productivity of mango in the state which abounds in area for cultivation.
7.11 Diversification, Value-Chain Development and Agro-Processing Facilities
Diversification toward high-value commodities is a sustainable source of agricultural growth
that also enhances farmers’ incomes. UP has a large and diverse production base consisting of
a vast variety of fruits, vegetables and livestock products. Of the total production in India, Uttar
Pradesh produced roughly 30 percent of amla, 22.9 percent of guava, 23.3 percent of mango,
49.5 percent of peas, 31.9 percent of potato, and 26.7 percent of watermelons in 2014-15. Also,
17.2 percent of milk production and 4.9 percent of fish production in India came from UP in
2014-15. There is a need to develop efficient and reliable value chains for these products to
encourage more farmers to diversify into high-value agriculture. Building of infrastructure –
warehouses, solar-powered cold storages (especially for potato), cold-chains, efficient
transportation mechanisms and food processing facilities – is required to utilize this vast
production of high-value commodities optimally. Encouraging investments (private or through
Public-Private-Partnerships (PPP)) in cold-chains will help keep quality of food products intact
and enable farmers to get better prices for their produce. Under the Scheme for Cold Chain,
Value Addition and Preservation Infrastructure, the Ministry of Food Processing Industries
(MoFPI) has approved six cold-chain projects in UP out of which the projects at Unnao, Agra
and Noida have already started their commercial operations. All the 75 districts of Uttar
Pradesh (rather than 45 districts at the moment) need to be taken under the Mission for
Integrated Development of Horticulture (MIDH) and special interest subvention schemes need
to be taken up to increase growth of horticulture in the state. UP has an abundant and perpetual

37
supply of raw materials from agriculture and to utilize this effectively and efficiently, food
processing capacity in the state must be expanded manifold. Availability of markets, cheap
labour and low production costs are other prevailing factors in the state which favour the
development of food processing in UP. The prices of agricultural commodities sometimes fall
so low that farmers feel compelled to discard their produce rather than incurring the cost of
bringing it to the market, in absence of the opportunity to supply their harvest to food
processing units. With development of appropriate processing facilities, the products can be
converted into different forms (puree, dehydrated pieces, powder, pulp, etc.) which have longer
shelf-lives and can fetch much higher prices for the farmer to share in. Solar-powered cold
storages would be a one-time investment with a continuous flow of returns and at marginal
variable costs. Development of reliable value-chains for high-value commodities (fruits,
vegetables, other horticultural crops, livestock products, etc.) will serve the same purpose as a
robust procurement mechanism in the case of food grains – ensuring adequate and
commensurate returns to farmers for the investments made by them in the production process,
thus improving productivity, increasing production and enhancing farmers’ incomes.
8. Summing Up
It is rare for any political party to win assembly elections with the kind of majority that the new
government in UP has. This is the right time and opportunity for UP to revive its performance,
especially in agriculture. The new government must focus on stimulating and rejuvenating
agriculture in UP to unlock its enormous potential that has remained dormant for over a decade.
If this can be done on priority, it will be their biggest step toward truly achieving “sabka saath,
sabka vikas”. The BJP governments in Madhya Pradesh and Chhattisgarh have achieved an
average annual growth rate of 7.2 percent and 6 percent in agriculture and allied sectors,
respectively, in the period between 2000-01 and 2014-15 (at 2004-05 constant prices). The
governments of both states have worked to strengthen the state machinery to boost procurement
of wheat and paddy in MP and paddy in Chhattisgarh enabling farmers to get fair and
remunerative prices for their produce. UP, in contrast, has achieved a much lower agricultural
growth rate during this period. Despite being endowed with fertile land and abundant water,
and having a relatively high irrigation ratio and road density, UP has not achieved its full
potential for growth in agriculture. Agriculture in UP is urgently in need of well-founded
structural reforms in agricultural marketing, dairy development, sugarcane pricing, and also
development of agri-rural-infrastructure, adoption of innovative farming technologies and
creation of efficient, reliable value-chains to make farming in UP competitive.. While the state
has done well on many aspects of agriculture and allied activities, it has a huge potential that
is yet to be tapped. Policy interventions suggested in this paper will assist the new government
of Uttar Pradesh in realizing this untapped potential to double the rate of agricultural growth in
UP, from what it has been over the last decade. The new government's efforts in this regard
can be game-changing for farmers and agriculture in UP. Agricultural growth alone can lead
UP to a higher trajectory of economic development and help in alleviating poverty in the state
at a faster pace and to a greater extent.

38
APPENDIX
APPENDIX 1: Status of Agri-Rural Infrastructure in UP
Irrigation
Uttar Pradesh possesses rich water resources in the form of canals, reservoirs, lakes, ponds and
a vast network of seasonal rivers flowing through the Gangetic plain. At present, there are
approximately 74659.57 kilometers of canals, 28 major and medium lift canals, 249 minor lift
canals, 69 reservoirs/bundhis and 32,047 running state tubewells, apart from a number of
private tubewells (UP Plan Document, 2016-17). Irrigation ratio has been growing steadily in
UP from about 69.9 percent in 2000-01 to 78.8 percent in 2013-14.
The four zones in UP have their own specific geographic, climatic, environmental and
demographic characteristics. Rainfall in UP increases from west to east and from south to north.
The problem of floods also follows a similar pattern: the danger increases from west to east
and from south to north. The irrigation ratio was highest in the Western Zone (87.6 percent),
followed by the Central (83 percent) and Eastern Zones (74.6 percent) in 2013-14. It was
extremely low in the Bundelkhand Zone (41 percent) in 2013-14.
Table 9: Zone-wise Gross Cropped Area, Gross Irrigated Area and Irrigation Ratio in
Uttar Pradesh in 2013-14
Gross Cropped
Area (mha)
Gross Irrigated
Area (mha)
Irrigation Ratio
(percent)
Western Zone 8.6 7.7 87.6
Central Zone 4.6 3.9 83
Bundelkhand Zone 2.8 1.4 41
Eastern Zone 9.8 7.4 74.6
UP State 25.9 20.4 78.8
Source: www.aps.dacnet.gov.in
Figure 16 shows the shares of various sources of irrigation in Uttar Pradesh in TE 2002-03 and
TE 2013-14 vis-à-vis their shares in irrigation in the country as a whole in the same two time
periods. Tubewells and wells are the dominant and most widely used sources of irrigation in
UP followed by canals, tanks, and other sources. In TE 2002-03, tubewells and wells were used
to irrigate 76.9 percent of the Net Irrigated Area in UP which further rose to 79.8 percent in TE
2013-14. The use of tubewells and wells in UP is much more than that in all-India irrigation
(62 percent).
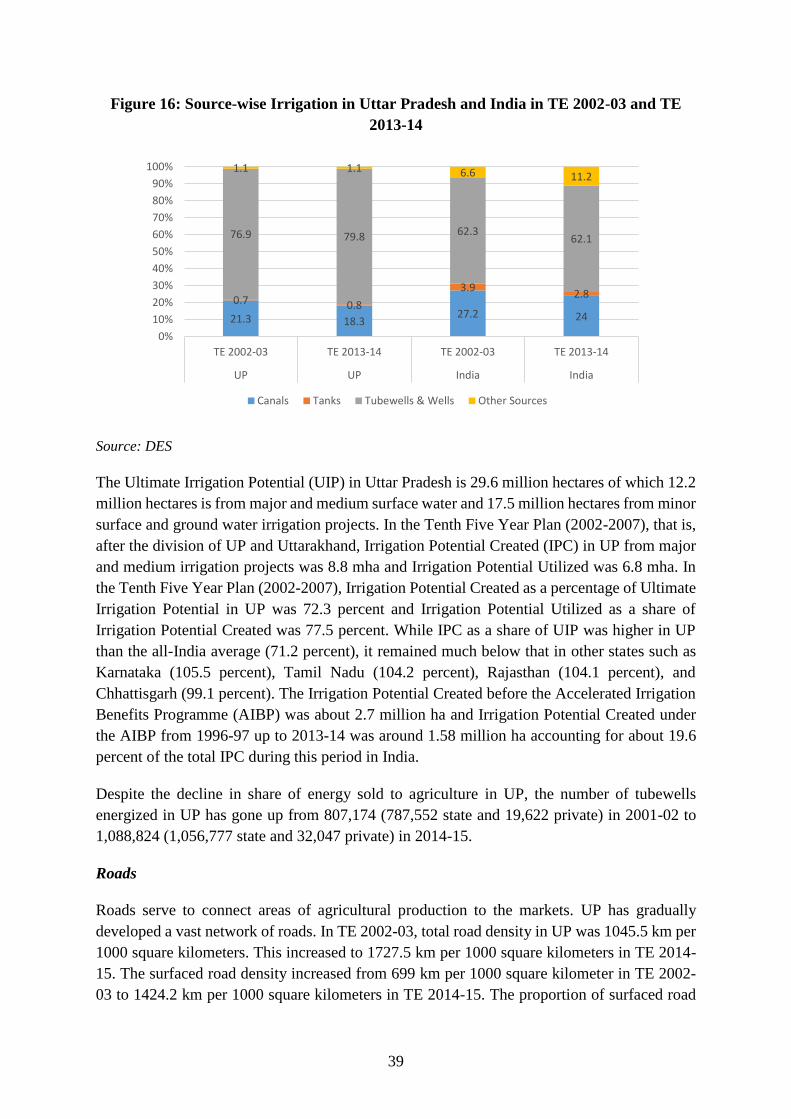
39
Figure 16: Source-wise Irrigation in Uttar Pradesh and India in TE 2002-03 and TE
2013-14
Source: DES
The Ultimate Irrigation Potential (UIP) in Uttar Pradesh is 29.6 million hectares of which 12.2
million hectares is from major and medium surface water and 17.5 million hectares from minor
surface and ground water irrigation projects. In the Tenth Five Year Plan (2002-2007), that is,
after the division of UP and Uttarakhand, Irrigation Potential Created (IPC) in UP from major
and medium irrigation projects was 8.8 mha and Irrigation Potential Utilized was 6.8 mha. In
the Tenth Five Year Plan (2002-2007), Irrigation Potential Created as a percentage of Ultimate
Irrigation Potential in UP was 72.3 percent and Irrigation Potential Utilized as a share of
Irrigation Potential Created was 77.5 percent. While IPC as a share of UIP was higher in UP
than the all-India average (71.2 percent), it remained much below that in other states such as
Karnataka (105.5 percent), Tamil Nadu (104.2 percent), Rajasthan (104.1 percent), and
Chhattisgarh (99.1 percent). The Irrigation Potential Created before the Accelerated Irrigation
Benefits Programme (AIBP) was about 2.7 million ha and Irrigation Potential Created under
the AIBP from 1996-97 up to 2013-14 was around 1.58 million ha accounting for about 19.6
percent of the total IPC during this period in India.
Despite the decline in share of energy sold to agriculture in UP, the number of tubewells
energized in UP has gone up from 807,174 (787,552 state and 19,622 private) in 2001-02 to
1,088,824 (1,056,777 state and 32,047 private) in 2014-15.
Roads
Roads serve to connect areas of agricultural production to the markets. UP has gradually
developed a vast network of roads. In TE 2002-03, total road density in UP was 1045.5 km per
1000 square kilometers. This increased to 1727.5 km per 1000 square kilometers in TE 2014-
15. The surfaced road density increased from 699 km per 1000 square kilometer in TE 2002-
03 to 1424.2 km per 1000 square kilometers in TE 2014-15. The proportion of surfaced road
21.3 18.327.2 24
0.7 0.8
3.92.8
76.9 79.8 62.362.1
1.1 1.1 6.6 11.2
0%
10%
20%
30%
40%
50%
60%
70%
80%
90%
100%
TE 2002-03 TE 2013-14 TE 2002-03 TE 2013-14
UP UP India India
Canals Tanks Tubewells & Wells Other Sources
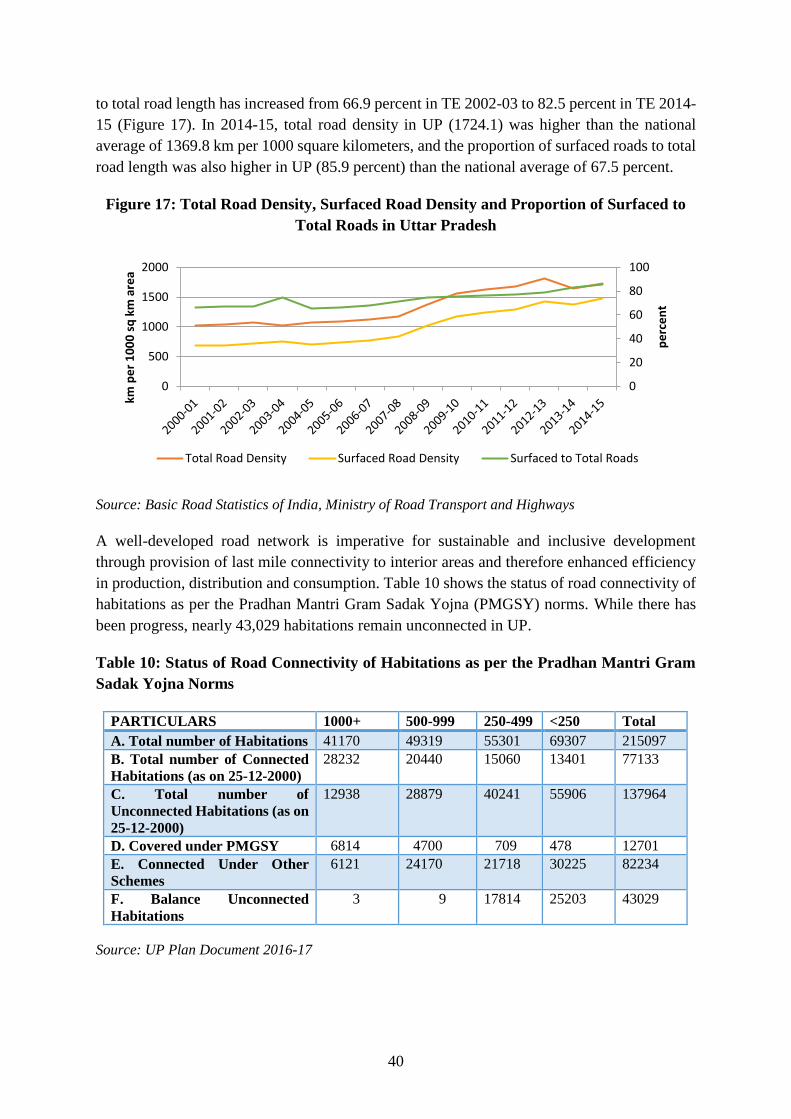
40
to total road length has increased from 66.9 percent in TE 2002-03 to 82.5 percent in TE 2014-
15 (Figure 17). In 2014-15, total road density in UP (1724.1) was higher than the national
average of 1369.8 km per 1000 square kilometers, and the proportion of surfaced roads to total
road length was also higher in UP (85.9 percent) than the national average of 67.5 percent.
Figure 17: Total Road Density, Surfaced Road Density and Proportion of Surfaced to
Total Roads in Uttar Pradesh
Source: Basic Road Statistics of India, Ministry of Road Transport and Highways
A well-developed road network is imperative for sustainable and inclusive development
through provision of last mile connectivity to interior areas and therefore enhanced efficiency
in production, distribution and consumption. Table 10 shows the status of road connectivity of
habitations as per the Pradhan Mantri Gram Sadak Yojna (PMGSY) norms. While there has
been progress, nearly 43,029 habitations remain unconnected in UP.
Table 10: Status of Road Connectivity of Habitations as per the Pradhan Mantri Gram
Sadak Yojna Norms
PARTICULARS 1000+ 500-999 250-499 <250 Total
A. Total number of Habitations 41170 49319 55301 69307 215097
B. Total number of Connected
Habitations (as on 25-12-2000)
28232 20440 15060 13401 77133
C. Total number of
Unconnected Habitations (as on
25-12-2000)
12938 28879 40241 55906 137964
D. Covered under PMGSY 6814 4700 709 478 12701
E. Connected Under Other
Schemes
6121 24170 21718 30225 82234
F. Balance Unconnected
Habitations
3 9 17814 25203 43029
Source: UP Plan Document 2016-17
0
20
40
60
80
100
0
500
1000
1500
2000
pe
rce
nt
km p
er
10
00
sq
km
are
a
Total Road Density Surfaced Road Density Surfaced to Total Roads

41
Appendix 2: Ground-Water Depletion in UP
The primary source of irrigation in UP is ground water. Unsustainable use of ground water for
irrigation is another major problem the state. While ground water availability in UP at present
is better than in many other states in India, unsustainable use of the same will soon lead to a
water crisis that other states have already begun facing. The map in Figure 18 shows the depth
to water level in the different regions of Uttar Pradesh. The maximum stress is in the Western
and Bundelkhand regions due to over-exploitation of ground water in these areas.
Figure 18: Depth to Water Level Map of Uttar Pradesh (Pre-Monsoon 2016)
Source: http://www.cgwb.gov.in/
Out of a total of 820 blocks assessed in UP in 2009, 76 (9 percent) were over-exploited, 32 (4
percent) were critical and 107 semi-critical (13 percent). While majority (605 accounting for
74 percent) of these blocks was safe, there is no reason for complacence. In the period
between 2005 and 2014, both the Pre- and Post-Monsoon Decadal Water Level (DWL) in UP
showed a declining trend with the extent of decline differing across wells. 73.1 percent of
wells in UP showed a decline of 0-20 cm per year in pre-monsoon DWL, 15.8 percent of
wells showed a decline of 20-40 cm per year and 10.7 percent showed a decline of more than
40 cm per year. Similarly, about 71 percent of the wells showed a decline of 0-20 cm per year
in post-monsoon DWL during this period, 13.9 percent showed a 20-40 cm decline per year
and 13.9 percent showed a decline of more than 40 cm per year.
Table 11 shows the status of availability, utilization and stage of development of ground water
resources in UP as in 2009.
42
Table 11: Status of Ground Water Resources Availability, Utilization and Stage of
Development in UP (as in 2009) (in bcm)
Annual Replenishable Ground Water Resource Natural
Discharge
during
non-
monsoon
season
Net Annual
Ground
Water
Availability
Annual Ground Water Draft
Monsoon Season Non-monsoon Season Total
Irrigation Domestic
and
industrial
uses
Total
Recharge
from
rainfall
Recharge
from
other
sources
Recharge
from
rainfall
Recharge
from
other
sources
40.78 11.37 5.41 17.7 75.25 6.68 68.57 46 3.49 49.48
Projected demand for
Domestic and Industrial uses
up to 2025
Ground Water Availability
for future irrigation use
Stage of Ground Water
Development (percent)
Depth to Water Level
(m bgl)
Min Max
5.36 17.22 72 0 37.1
Source: Ground Water Year Book 2013-14

43
Appendix 3: Classification of Districts in Uttar Pradesh and Comparative Agricultural
Land-Use Statistics
Table 12: Classification of Districts in the 4 Zones of Uttar Pradesh
Zones No. of
Districts
Division Districts
Western
Zone
4 Agra Agra, Firozabad, Mainpuri, Mathura
4 Bareilly Bareilly, Budaun, Pilibhit, Shahjahanpur
6 Meerut Baghpat, Bulandshahr, Gautam Buddha
Nagar, Ghaziabad, Meerut, Hapur
5 Moradabad Bijnor, Jyotiba Phulenagar, Moradabad,
Rampur, Sambal
3 Saharanpur Mujaffarnagar, Saharanpur, Shamli
4 Aligarh Aligarh, Hathras, Etah, Kashganj
Central Zone 6 Kanpur Auraiya, Etawah, Farrukhabad, Kannauj,
Kanpur Nagar, Kanpur Dehat
6 Lucknow Hardoi, Kheri, Lucknow, Rae Bareli,
Sitapur, Unnao
Bundelkhand
Zone
4 Chitrakoot Banda, Chitrakoot, Hamirpur, Mahoba
3 Jhansi Jalaun, Jhansi, Lalitpur
Eastern Zone 4 Allahabad Allahabad, Fatehpur, Kaushambi,
Pratapgarh
3 Azamgarh Azamgarh, Ballia, Mau
3 Basti Basti, Sant Kabir Nagar, Siddharthnagar
4 Devipatan Balrampur, Bahraich, Gonda, Shravasti
5 Faizabad Ambedakar Nagar, Barabanki, Faizabad,
Sultanpur, Amethi
4 Gorakhpur Deoria, Gorakhpur, Kushinagar,
Maharajganj
4 Varanasi Chandauli, Ghajipur, Jaunpur, Varanasi
3 Vindhyachal Mirzapur, Sant Ravidas Nagar,
Sonbhadra
Table 13: Land-Use for Agriculture
State
Gross Cropped Area
(Million Ha)
Gross Irrigated Area
(Million Ha)
Cropping Intensity (%)
TE 2003-04 TE 2012-
13
TE 2003-04 TE 2012-13 TE 2003-04 TE 2012-13
Bihar 7.9 7.5 4.6 5.0 138.3 140.8
Odisha 8.4 8.9 2.3 3.2 145.4 166.7
Uttar Pradesh 25.1 25.8 18.2 19.9 149.9 155.4
Gujarat 10.9 12.6 3.8 5.9 114.6 122.8
Punjab 7.9 7.9 7.6 7.7 186.0 190.1
Madhya
Pradesh
18.9 22.6 5.1 8.2 128.4 148.1
India 183.9 195.9 76.5 91.1 133.4 139.1
Source: DES, Government of India

44
Appendix 4: Budgetary Allocations and Expenditures for Sectors Related to Agriculture and Allied Activities in UP
Table 14: Summary of Budgetary Allocations and Expenditures for Sectors Related to Agriculture and Allied Activities in UP (in Rs.Lakh)
2014-15 2016-17
Outlay Actual Expenditure Outlay
State
Budgetar
y
Support
Central
Assistance
(Central
Share/ACA/SCA/
Block Grant)
Total Of
Which
Capital
Content
State
Budgetary
Support
Central
Assistance
(Central
Share/ACA/SC
A/Block Grant)
Total Of
Which
Capital
Content
State
Budgetary
Support
Central
Assistance
(Central
Share/ACA/SCA
/Block Grant)
Total Of
Which
Capital
Content
Agriculture Department
41273.32 173379 214652.3
49200 46380.61 76494.56 12287
5.2 0 128984.2 87755.85
216740
Cane
Development 10420 0
1042
0 8920 11252.39 0
11252.
39 9759.31 14472.18 1447
2.18
12472.1
8
Small and
Marginal
Farmers Programmes
7100 0 7100 7100 7097 0 7097 7097 7453 7453 7453
Horticulture 1758 7017 8775 140 801.61 2407.49 3209.1 94.7 4045.9 4696.65
8742.
55 820.2
Food
Processing 1111.37 2961.35
4072.
72 0 720.33 1823
2543.3
3 0 4602 4602
Animal
Husbandry 12830.78 5444.43
1827
5.21 2064.54 13598.2 3183.79
16781.
99 6972.45 41375.04 12461.37
5383
6.41
14336.4
6
Dairy Development
5873.1 262.28 6135.
38 772.53 11047.4 282.28
11329.68
284.34 57955.77 1200 59155.77
10285
Fisheries
Development 1257.79 0
1257.
79 400 2186.58 0
2186.5
8 1687.58 1728.64 0
1728.
64 1000
Agriculture Research and
Education
9439.33 0 9439.
33 8129.33 10016.89 0
10016.
89 8889.69 10544.92 0
1054
4.92 9319.82
Major and
Medium Irrigation
302473.4 196500 4989
73.4 498973.4 282467.6 30799.05
31326
6.7 313266.7 491821.3 129934.1
6217
55.4
621755.
4
Minor
Irrigation 73142.71 0
7314
2.71 63009 70204.6 0
70204.
6 59745.31 67001.09 0
6700
1.09
54631.7
9
Other Agricultural
Programmes
239850 2398
50 239850 253996 25399
6 253996 270297.8 2702
97.8
270297.
8
Source: UP Plan Document 2016-17

45
References
Agricultural Statistics at a Glance. (2015). New Delhi: Ministry of Agriculture and Farmers'
Welfare.
(2015). All-India Report on Agriculture Census 2010-11. Department of Agriculture,
Cooperation and Farmers' Welfare, Ministry of Agriculture and Farmers' Welfare,
Government of India. New Delhi: Agriculture Census Division.
Dairy India. (2017). New Delhi: Dairy India Yearbook.
Fan, S., Gulati, A., & Thorat, S. (2008). Investment, subsidies, and pro-poor growth in rural
India. The Journal of the International Association of Agricultural Economists, 39(2),
163-170.
Ground-Water Yearbook. (2013-14). Faridabad: Central Ground-Water Board, Ministry of
Water Resources.
Gulati, A., & Hussain, S. (2017, February 13). Can UP farmers expect a better deal? The
Financial Express.
Gulati, A., Manchanda, S., & Kacker, R. (2016, September). Harvesting Solar Power in
India. ZEF Working Paper 152. Bonn, Germany: ZEF Centre for Development
Research.
Gulati, A., & Verma, S. (2017, March 27). Cow, culture and agriculture in UP. The
Financial Express.
Horticultural Statistics at a Glance. (2015). New Delhi: Minstry of Agrciulture and Farmers'
Welfare.
(2016). Price Policy for Rabi Crops - The Marketing Season 2017-18. Ministry of Agriculture
and Farmers' Welfare, Department of Agriculture, Cooperation and Farmers' Welfare.
New Delhi: Commission for Agricultural Costs and Prices (CACP).
(2016). Report of the Comptroller and Auditor General of India on Performance Audit of
Pradhan Mantri Gram Sadak Yojna. Union Government (Civil); Ministry of Rural
Development, Indian Audit and Accounts Department, New Delhi.
(2016). Report on Fifth Annual Employment-Unemployment Survey 2015-16 Volume I.
Ministry of Labour and Employment, Government of India. Chandigarh: Labour
Bureau.
Water and Related Statistics. (2015). New Delhi: Central Water Commission.
World Development Report - Agriculture for Development. (2008). Washington, DC: The
World Bank.

46
(2015 Revision). World Population Prospects - Key findings and advance tables. United
Nations, Department of Economic and Social Affairs, Population Division. New York:
United Nations.
Websites:
http://agcensus.nic.in/
http://www.agricoop.nic.in/
http://eands.dacnet.nic.in/
http://mospi.nic.in/
http://morth.nic.in/
http://www.censusindia.gov.in/
http://www.eaindustry.nic.in/
http://agmarknet.gov.in/
http://animalhusb.up.nic.in/
http://planning.up.nic.in/
http://www.nddb.org/
http://nhb.gov.in/Default.aspx
http://dahd.nic.in/
http://agriculture.up.nic.in/
http://www.worldbank.org/
http://paragmilkup.in/index.aspx
http://www.cwc.nic.in/
47
LATEST ICRIER’S WORKING PAPERS
NO. TITLE AUTHOR YEAR
334 DESTRUCTION OR
POLARIZATION: ESTIMATING
THE IMPACT OF
TECHNOLOGY ON JOBS IN
INDIAN MANUFACTURING
PANKAJ VASHISHT MARCH
2017
333 INDIA-PAKISTAN TRADE:
OPPORTUNITIES FOR
MEDICAL VALUE TRAVEL
NISHA TANEJA
SAMRIDHI BIMAL
ISHA DAYAL
TAHER NADEEM
MARCH
2017
332 DOMESTIC VALUE ADDITION
AND FOREIGN CONTENT: AN
ANALYSIS OF INDIA’S
EXPORTS FROM 1995 TO 2011
BISHWANATH GOLDAR
DEB KUSUM DAS
SREERUPA SENGUPTA
PILU CHANDRA DAS
JANUARY
2017
331 LABOUR REGULATIONS IN
INDIA: IMPROVING THE
SOCIAL SECURITY
FRAMEWORK
ANWARUL HODA
DURGESH K. RAI
JANUARY
2017
330 LAW, SKILLS AND THE
CREATION OF JOBS AS
‘CONTRACT’ WORK IN INDIA:
EXPLORING SURVEY DATA
TO MAKE INFERENCES FOR
LABOUR LAW REFORM
JAIVIR SINGH
DEB KUSUM DAS
HOMAGNI CHOUDHURY
PRATEEK KUKREJA
SEPTEMBER
2016
329 HARVESTING SOLAR POWER
IN INDIA!
ASHOK GULATI
STUTI MANCHANDA
RAKESH KACKER
AUGUST
2016
328 A MORE SUSTAINABLE
ENERGY STRATEGY FOR
INDIA
MONTEK AHLUWALIA
HIMANSHU GUPTA
NICHOLAS STERN
JULY 2016
327 INDIA’S INFORMAL TRADE
WITH PAKISTAN
NISHA TANEJA
SAMRIDHI BIMAL
JULY 2016
326 INDIA – PAKISTAN TRADE:
TEXTILES AND CLOTHING
NISHA TANEJA
SAON RAY
DEVYANI PANDE
JUNE 2016
325 IMPROVING TAXATION
ENVIRONMENT: ATTRACTING
FOREIGN DIRECT
INVESTMENT
R. R. SINGH JUNE 2016
324 FINANCIAL SECTOR
LEGISLATIVE REFORMS
COMMISSION (FSLRC) &
FINANCIAL SECTOR
REGULATION IN INDIA
JAIMINI BHAGWATI
M. SHUHEB KHAN
RAMAKRISHNA REDDY
BOGATHI
JUNE 2016
323 URBAN WATER SYSTEMS IN
INDIA: A WAY FORWARD
MIHIR SHAH MAY 2016
1
About ICRIER
Established in August 1981, ICRIER is an autonomous, policy-oriented, not-for-profit, economic policy
think tank. ICRIER's main focus is to enhance the knowledge content of policy making by undertaking
analytical research that is targeted at informing India's policy makers and also at improving the interface
with the global economy. ICRIER's office is located in the institutional complex of India Habitat Centre,
New Delhi.
ICRIER's Board of Governors includes leading academicians, policymakers, and representatives from
the private sector. Dr. Isher Ahluwalia is ICRIER's chairperson. Dr. Rajat Kathuria is Director and Chief
Executive.
ICRIER conducts thematic research in the following eight thrust areas:
Macroeconomic Management Financial Liberalisation and Regulation
Global Competitiveness of the Indian Economy-Agriculture, Manufacturing and Services
Multilateral Trade Negotiations and FTAs
Challenges and Opportunities of Urbanization
Climate Change and Sustainable Development
Physical and Social Infrastructure including Telecom, Transport, Energy and Health
Asian Economic Integration with focus on South Asia
Promoting Entrepreneurship and Skill Development
To effectively disseminate research findings, ICRIER organises workshops, seminars and
conferences to bring together academicians, policymakers, representatives from industry and
media to create a more informed understanding on issues of major policy interest. ICRIER
routinely invites distinguished scholars and policymakers from around the world to deliver public
lectures and give seminars on economic themes of interest to contemporary India.