Embed Size (px)
Citation preview

!PROJECT SAMPLES!

PRODUCT DEVELOPMENT!

TECHNICAL CAD FLATS!
• Conducted consumer, market, and trend analysis in the development of a spring 2015 product line for Zara Men’s. !
• Created technical flats for each garment through the use of Adobe Illustrator. !

TECHNICAL CAD FLATS!

TECHNICAL CAD FLATS!

-‐
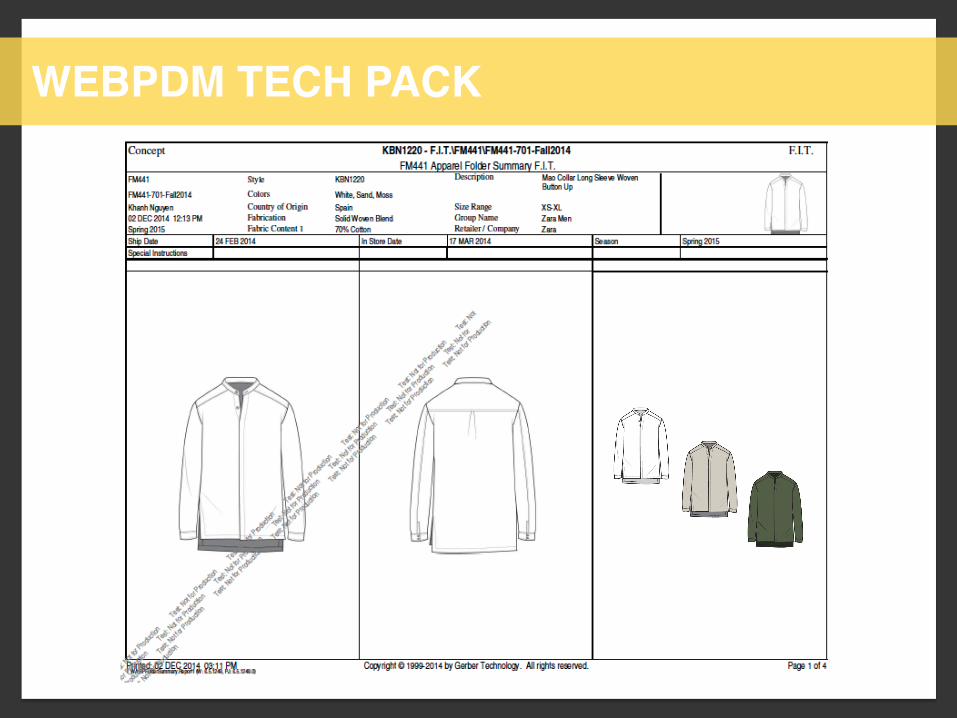
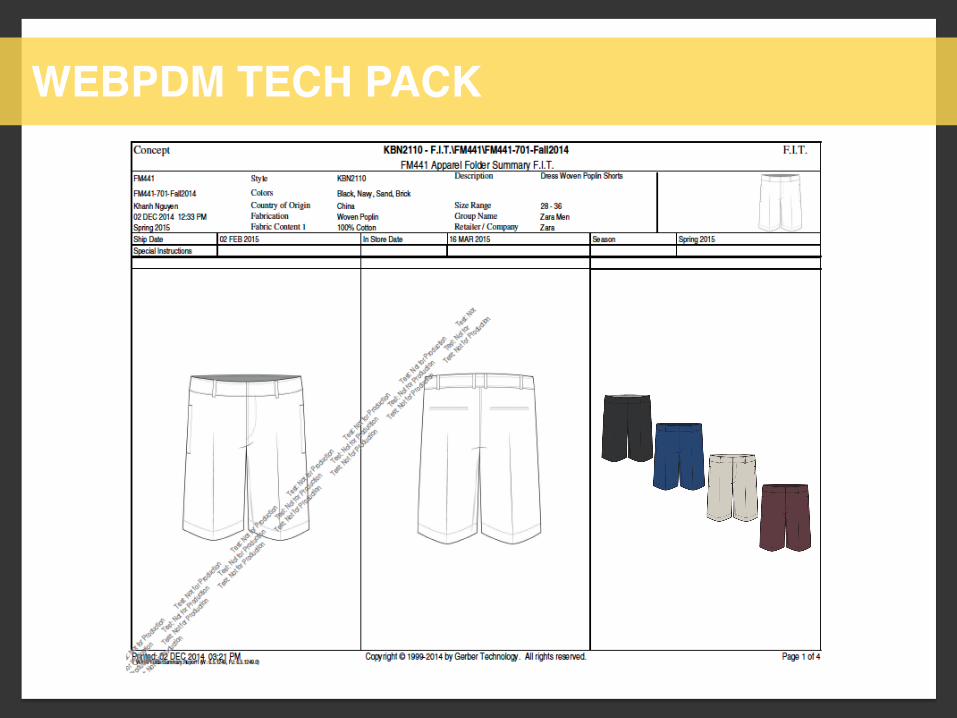
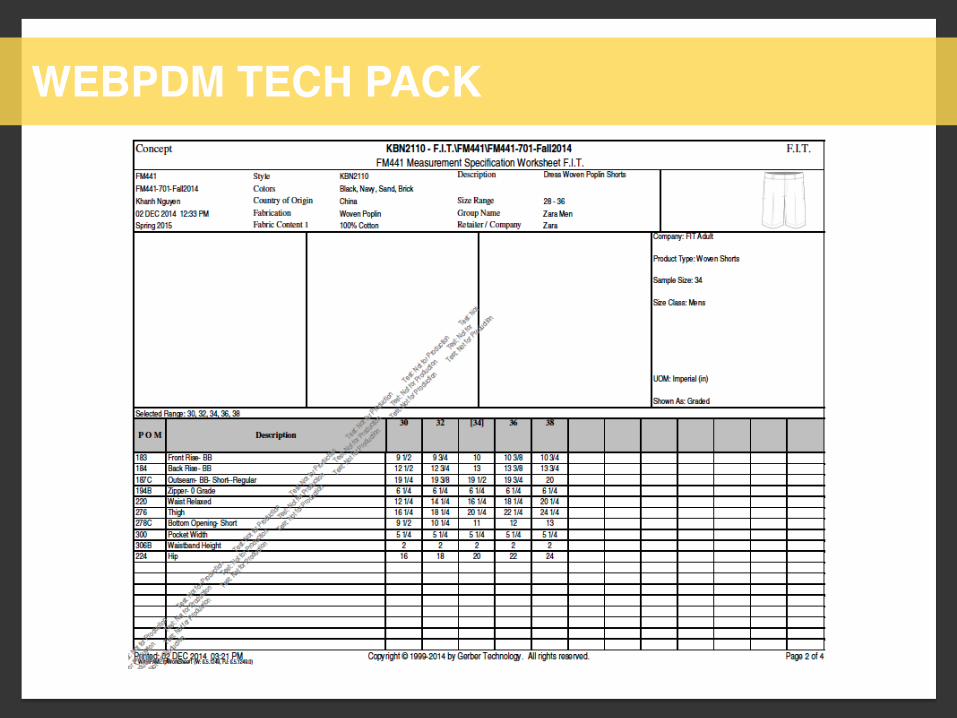
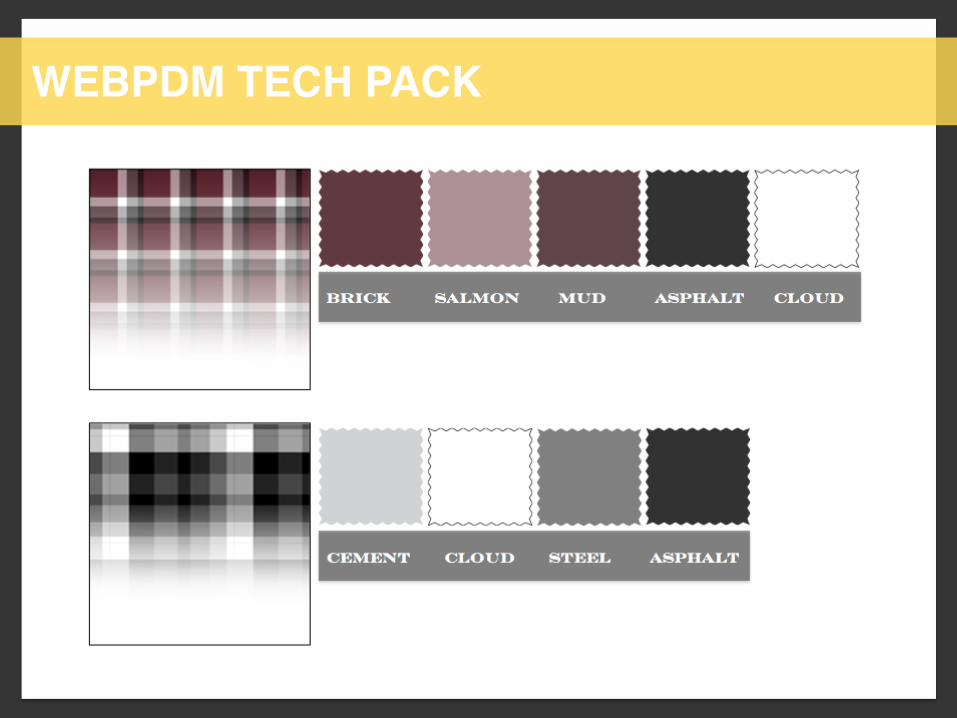
• Produced WebPDM tech packs for garments including:!• Measurement Specs!• Size Grading !• Construction Details!• Pattern Pitch Sheets!
WEBPDM TECH PACK!
-‐
WEBPDM TECH PACK!

-‐
WEBPDM TECH PACK!

-‐
WEBPDM TECH PACK!
-‐
WEBPDM TECH PACK!
-‐
WEBPDM TECH PACK!

-‐
WEBPDM TECH PACK!
-‐
WEBPDM TECH PACK!

BUYING AND PLANNING!
Your NameName of the Assignment
Date Stamp (auto update)
DEPT. NAME DEPT. # 104BUYER
SPRING 2015 FEBRUARY MARCH APRIL MAY JUNE JULY AUGUST SEASON TOTAL
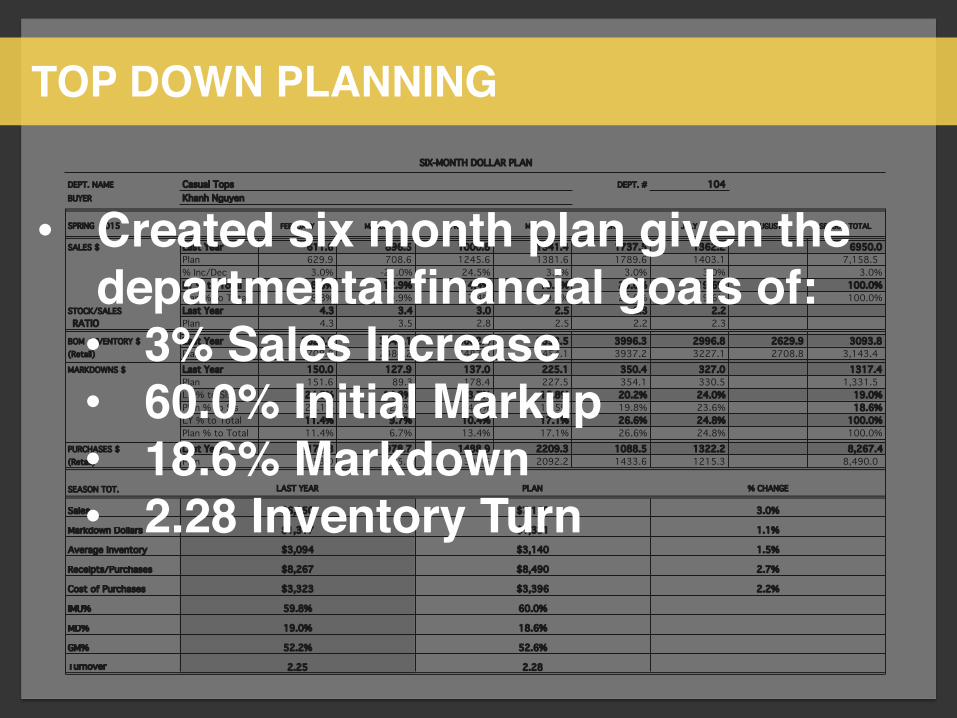
SALES $ Last Year 611.6 896.5 1000.8 1341.4 1737.5 1362.2 6950.0Plan 629.9 708.6 1245.6 1381.6 1789.6 1403.1 7,158.5 % Inc/Dec 3.0% -21.0% 24.5% 3.0% 3.0% 3.0% 3.0%LY % to Total 8.8% 12.9% 14.4% 19.3% 25.0% 19.6% 100.0%Plan % to Total 8.8% 9.9% 17.4% 19.3% 25.0% 19.6% 100.0%
STOCK/SALES Last Year 4.3 3.4 3.0 2.5 2.3 2.2RATIO Plan 4.3 3.5 2.8 2.5 2.2 2.3
BOM INVENTORY $ Last Year 2629.9 3048.1 3002.4 3353.5 3996.3 2996.8 2629.9 3093.8(Retail) Plan 2708.8 2480.2 3487.6 3454.1 3937.2 3227.1 2708.8 3,143.4MARKDOWNS $ Last Year 150.0 127.9 137.0 225.1 350.4 327.0 1317.4
Plan 151.6 89.3 178.4 227.5 354.1 330.5 1,331.5 LY % to Sls 24.5% 14.3% 13.7% 16.8% 20.2% 24.0% 19.0%Plan % to Sls 24.1% 12.6% 14.3% 16.5% 19.8% 23.6% 18.6%LY % to Total 11.4% 9.7% 10.4% 17.1% 26.6% 24.8% 100.0%Plan % to Total 11.4% 6.7% 13.4% 17.1% 26.6% 24.8% 100.0%
PURCHASES $ Last Year 1179.8 978.7 1488.9 2209.3 1088.5 1322.2 8,267.4(Retail) Plan 553.0 1805.3 1390.5 2092.2 1433.6 1215.3 8,490.0
SEASON TOT.
Sales
Markdown Dollars
Average Inventory
Receipts/Purchases
Cost of Purchases
IMU%
MD%
GM%
Turnover
52.2% 52.6%
2.25 2.28
$3,323 $3,396 2.2%
59.8% 60.0%
19.0% 18.6%
$3,094 $3,140 1.5%
$8,267 $8,490 2.7%
$6,950 $7,159 3.0%
$1,317 $1,331 1.1%
SIX-MONTH DOLLAR PLAN
Casual TopsKhanh Nguyen
LAST YEAR PLAN % CHANGE
• Created six month plan given the departmental financial goals of:!• 3% Sales Increase!• 60.0% Initial Markup !• 18.6% Markdown !• 2.28 Inventory Turn!
TOP DOWN PLANNING!!

Your NameName of the Assignment
Date Stamp (auto update)
DEPT. NAME DEPT. # 104BUYER
SPRING 2015 FEBRUARY MARCH APRIL MAY JUNE JULY AUGUST SEASON TOTAL
SALES $ Last Year 611.6 896.5 1000.8 1341.4 1737.5 1362.2 6950.0Plan 629.9 708.6 1245.6 1381.6 1789.6 1403.1 7,158.5 % Inc/Dec 3.0% -21.0% 24.5% 3.0% 3.0% 3.0% 3.0%LY % to Total 8.8% 12.9% 14.4% 19.3% 25.0% 19.6% 100.0%Plan % to Total 8.8% 9.9% 17.4% 19.3% 25.0% 19.6% 100.0%
STOCK/SALES Last Year 4.3 3.4 3.0 2.5 2.3 2.2RATIO Plan 4.3 3.5 2.8 2.5 2.2 2.3
BOM INVENTORY $ Last Year 2629.9 3048.1 3002.4 3353.5 3996.3 2996.8 2629.9 3093.8(Retail) Plan 2708.8 2480.2 3487.6 3454.1 3937.2 3227.1 2708.8 3,143.4MARKDOWNS $ Last Year 150.0 127.9 137.0 225.1 350.4 327.0 1317.4
Plan 151.6 89.3 178.4 227.5 354.1 330.5 1,331.5 LY % to Sls 24.5% 14.3% 13.7% 16.8% 20.2% 24.0% 19.0%Plan % to Sls 24.1% 12.6% 14.3% 16.5% 19.8% 23.6% 18.6%LY % to Total 11.4% 9.7% 10.4% 17.1% 26.6% 24.8% 100.0%Plan % to Total 11.4% 6.7% 13.4% 17.1% 26.6% 24.8% 100.0%
PURCHASES $ Last Year 1179.8 978.7 1488.9 2209.3 1088.5 1322.2 8,267.4(Retail) Plan 553.0 1805.3 1390.5 2092.2 1433.6 1215.3 8,490.0
SEASON TOT.
Sales
Markdown Dollars
Average Inventory
Receipts/Purchases
Cost of Purchases
IMU%
MD%
GM%
Turnover
52.2% 52.6%
2.25 2.28
$3,323 $3,396 2.2%
59.8% 60.0%
19.0% 18.6%
$3,094 $3,140 1.5%
$8,267 $8,490 2.7%
$6,950 $7,159 3.0%
$1,317 $1,331 1.1%
SIX-MONTH DOLLAR PLAN
Casual TopsKhanh Nguyen
LAST YEAR PLAN % CHANGE
TOP DOWN PLANNING!!
Khanh NguyenFM423-703
Fall2014
SPRING 2015 PLANSDEPT. NAME Casual Tops DEPT. # 104PLANNER
Store Number Name Sq Ftg
Plan (TY) Sales
Plan TY % to Total
Plan (TY) Index LY Sales
LY % to Total LY Index
Plan (TY) Avg STk
Plan (TY) % to Total
Plan (TY) Index
LY Avg Stk
LY % to Total LY Index
Plan (TY) Turn
Plan (TY) Grade LY Turn LY Grade
1 Columbus 40000 443 6.2% 1.55 430 6.2% 1.55 -196 5.1% 1.29 159 5.2% 1.29 2.75 A 2.70 A17 NYC 52500 433 6.0% 1.51 420 6.0% 1.51 -148 3.9% 0.97 120 3.9% 0.97 3.57 A 3.50 A
5 Ft Worth 51000 423 5.9% 1.48 410 5.9% 1.47 -181 4.7% 1.19 147 4.8% 1.19 2.85 A 2.79 A10 Atlanta 51000 392 5.5% 1.37 380 5.5% 1.37 -172 4.5% 1.13 140 4.5% 1.13 2.77 A 2.71 A
8 Daytona 8500 380 5.3% 1.33 281 4.0% 1.01 -128 3.4% 0.84 142 4.6% 1.15 1.99 A 1.98 C2 NYC 43000 366 5.1% 1.28 355 5.1% 1.28 -204 5.4% 1.34 166 5.4% 1.34 2.18 B 2.14 B
14 Orlando 43000 352 4.9% 1.23 341 4.9% 1.23 -148 3.9% 0.97 120 3.9% 0.97 2.90 B 2.84 B16 Houston 44000 345 4.8% 1.21 335 4.8% 1.21 -139 3.6% 0.91 113 3.7% 0.91 3.03 B 2.96 B
7 Malibu 38000 340 4.8% 1.19 330 4.7% 1.19 -180 4.7% 1.18 146 4.7% 1.18 2.31 B 2.26 B13 NYC 40000 340 4.8% 1.19 330 4.7% 1.19 -145 3.8% 0.95 118 3.8% 0.95 2.85 B 2.80 B11 Oakbrook 26000 278 3.9% 0.97 270 3.9% 0.97 -128 3.4% 0.84 104 3.4% 0.84 2.65 C 2.60 C23 Chicago 31000 276 3.9% 0.96 268 3.9% 0.96 -85 2.2% 0.56 69 2.2% 0.56 3.97 C 3.88 C
3 LA 25000 267 3.7% 0.93 259 3.7% 0.93 -202 5.3% 1.32 164 5.3% 1.33 1.61 C 1.58 C9 Boston 34000 264 3.7% 0.92 256 3.7% 0.92 -225 5.9% 1.48 183 5.9% 1.48 1.43 C 1.40 C
15 Providence 12000 261 3.6% 0.91 253 3.6% 0.91 -151 4.0% 0.99 123 4.0% 0.99 2.10 C 2.06 C25 Dallas 18000 259 3.6% 0.90 251 3.6% 0.90 -97 2.5% 0.64 79 2.6% 0.64 3.24 C 3.18 C12 Thousand Oaks 38000 258 3.6% 0.90 344 4.9% 1.24 -204 5.4% 1.34 121 3.9% 0.98 2.87 C 2.84 B22 Greenville 23500 255 3.6% 0.89 247 3.6% 0.89 -107 2.8% 0.70 87 2.8% 0.70 2.90 D 2.84 D24 Richmond 10000 217 3.0% 0.76 210 3.0% 0.76 -81 2.1% 0.53 66 2.1% 0.53 3.25 D 3.18 D20 Colorado Springs 9000 212 3.0% 0.74 206 3.0% 0.74 -119 3.1% 0.78 97 3.1% 0.78 2.17 D 2.12 D
4 Chicago 10000 209 2.9% 0.73 203 2.9% 0.73 -196 5.1% 1.29 159 5.2% 1.29 1.30 D 1.27 D19 Akron 10000 187 2.6% 0.65 181 2.6% 0.65 -122 3.2% 0.80 99 3.2% 0.80 1.87 D 1.83 D18 Atlanta 8900 145 2.0% 0.51 141 2.0% 0.51 -146 3.8% 0.96 119 3.8% 0.96 1.21 E 1.18 E21 Cleveland 9500 139 1.9% 0.49 135 1.9% 0.49 -125 3.3% 0.82 102 3.3% 0.82 1.35 E 1.32 E
6 Newark 26000 118 1.6% 0.41 114 1.6% 0.41 -185 4.8% 1.21 150 4.8% 1.21 0.78 E 0.76 ETotal 7159 100% 6950 100.0% -3815 100% 3094 100.0% 2.28 2.25Average 286 278 4.0% -153 124 4%
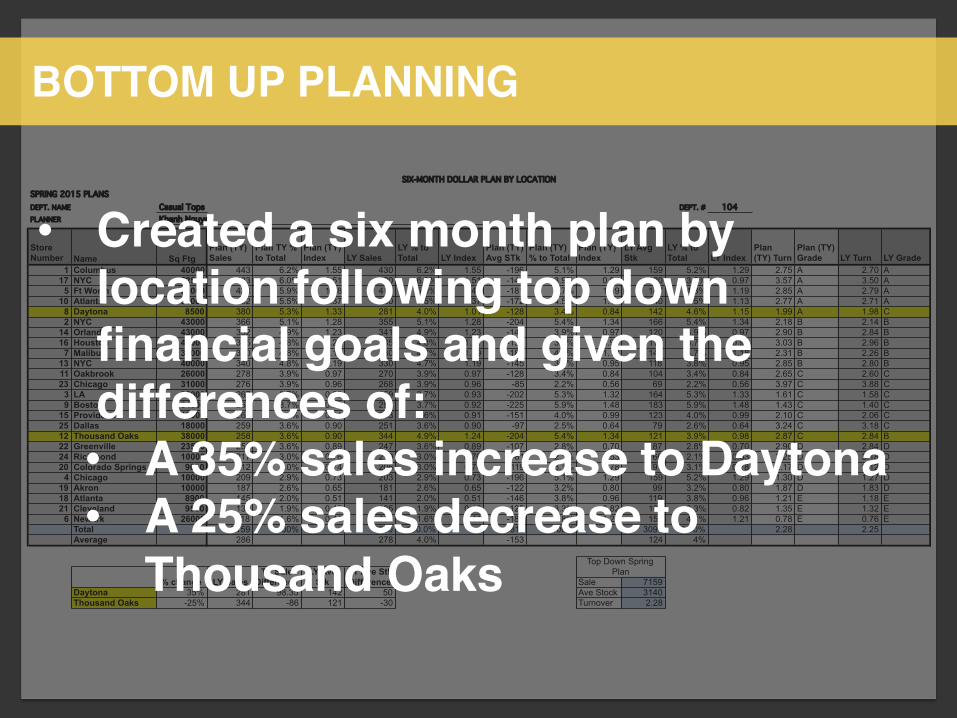
Sale 7159Daytona 35% 281 98.35 142 50 Ave Stock 3140Thousand Oaks -25% 344 -86 121 -30 Turnover 2.28
Top Down Spring Plan
Khanh Nguyen
SIX-MONTH DOLLAR PLAN BY LOCATION
TY Sale Difference% change LY Sales
LY Ave Stk
TY Ave Stk Difference
• Created a six month plan by location following top down financial goals and given the differences of:!• A 35% sales increase to Daytona !• A 25% sales decrease to
Thousand Oaks!
BOTTOM UP PLANNING!!

Khanh NguyenFM423-703
Fall2014
SPRING 2015 PLANSDEPT. NAME Casual Tops DEPT. # 104PLANNER
Store Number Name Sq Ftg
Plan (TY) Sales
Plan TY % to Total
Plan (TY) Index LY Sales
LY % to Total LY Index
Plan (TY) Avg STk
Plan (TY) % to Total
Plan (TY) Index
LY Avg Stk
LY % to Total LY Index
Plan (TY) Turn
Plan (TY) Grade LY Turn LY Grade
1 Columbus 40000 443 6.2% 1.55 430 6.2% 1.55 -196 5.1% 1.29 159 5.2% 1.29 2.75 A 2.70 A17 NYC 52500 433 6.0% 1.51 420 6.0% 1.51 -148 3.9% 0.97 120 3.9% 0.97 3.57 A 3.50 A
5 Ft Worth 51000 423 5.9% 1.48 410 5.9% 1.47 -181 4.7% 1.19 147 4.8% 1.19 2.85 A 2.79 A10 Atlanta 51000 392 5.5% 1.37 380 5.5% 1.37 -172 4.5% 1.13 140 4.5% 1.13 2.77 A 2.71 A
8 Daytona 8500 380 5.3% 1.33 281 4.0% 1.01 -128 3.4% 0.84 142 4.6% 1.15 1.99 A 1.98 C2 NYC 43000 366 5.1% 1.28 355 5.1% 1.28 -204 5.4% 1.34 166 5.4% 1.34 2.18 B 2.14 B
14 Orlando 43000 352 4.9% 1.23 341 4.9% 1.23 -148 3.9% 0.97 120 3.9% 0.97 2.90 B 2.84 B16 Houston 44000 345 4.8% 1.21 335 4.8% 1.21 -139 3.6% 0.91 113 3.7% 0.91 3.03 B 2.96 B
7 Malibu 38000 340 4.8% 1.19 330 4.7% 1.19 -180 4.7% 1.18 146 4.7% 1.18 2.31 B 2.26 B13 NYC 40000 340 4.8% 1.19 330 4.7% 1.19 -145 3.8% 0.95 118 3.8% 0.95 2.85 B 2.80 B11 Oakbrook 26000 278 3.9% 0.97 270 3.9% 0.97 -128 3.4% 0.84 104 3.4% 0.84 2.65 C 2.60 C23 Chicago 31000 276 3.9% 0.96 268 3.9% 0.96 -85 2.2% 0.56 69 2.2% 0.56 3.97 C 3.88 C
3 LA 25000 267 3.7% 0.93 259 3.7% 0.93 -202 5.3% 1.32 164 5.3% 1.33 1.61 C 1.58 C9 Boston 34000 264 3.7% 0.92 256 3.7% 0.92 -225 5.9% 1.48 183 5.9% 1.48 1.43 C 1.40 C
15 Providence 12000 261 3.6% 0.91 253 3.6% 0.91 -151 4.0% 0.99 123 4.0% 0.99 2.10 C 2.06 C25 Dallas 18000 259 3.6% 0.90 251 3.6% 0.90 -97 2.5% 0.64 79 2.6% 0.64 3.24 C 3.18 C12 Thousand Oaks 38000 258 3.6% 0.90 344 4.9% 1.24 -204 5.4% 1.34 121 3.9% 0.98 2.87 C 2.84 B22 Greenville 23500 255 3.6% 0.89 247 3.6% 0.89 -107 2.8% 0.70 87 2.8% 0.70 2.90 D 2.84 D24 Richmond 10000 217 3.0% 0.76 210 3.0% 0.76 -81 2.1% 0.53 66 2.1% 0.53 3.25 D 3.18 D20 Colorado Springs 9000 212 3.0% 0.74 206 3.0% 0.74 -119 3.1% 0.78 97 3.1% 0.78 2.17 D 2.12 D
4 Chicago 10000 209 2.9% 0.73 203 2.9% 0.73 -196 5.1% 1.29 159 5.2% 1.29 1.30 D 1.27 D19 Akron 10000 187 2.6% 0.65 181 2.6% 0.65 -122 3.2% 0.80 99 3.2% 0.80 1.87 D 1.83 D18 Atlanta 8900 145 2.0% 0.51 141 2.0% 0.51 -146 3.8% 0.96 119 3.8% 0.96 1.21 E 1.18 E21 Cleveland 9500 139 1.9% 0.49 135 1.9% 0.49 -125 3.3% 0.82 102 3.3% 0.82 1.35 E 1.32 E
6 Newark 26000 118 1.6% 0.41 114 1.6% 0.41 -185 4.8% 1.21 150 4.8% 1.21 0.78 E 0.76 ETotal 7159 100% 6950 100.0% -3815 100% 3094 100.0% 2.28 2.25Average 286 278 4.0% -153 124 4%
Sale 7159Daytona 35% 281 98.35 142 50 Ave Stock 3140Thousand Oaks -25% 344 -86 121 -30 Turnover 2.28
Top Down Spring Plan
Khanh Nguyen
SIX-MONTH DOLLAR PLAN BY LOCATION
TY Sale Difference% change LY Sales
LY Ave Stk
TY Ave Stk Difference
BOTTOM UP PLANNING!!