Embed Size (px)
Citation preview

Work on Preparatory studies for implementing measures of the Ecodesign Directive 2009/125/EC ENER Lot 28 – Pumps for private and public wastewater and for fluids with high solids content
ENER Lot 28– Pumps for private and public wastewater and for fluids with high solids content – Task 7: Improvement potential – Working document
Final report for the European Commission, DG ENER 02 April 2014
Developed by:
Task 7: Improvement Potential
2 |
Work on Preparatory studies for implementing measures of the Ecodesign Directive 2009/125/EC ENER Lot 28 – Pumps for private and public wastewater and for fluids with high solids content
Document information
CLIENT European Commission, DG ENER
CONTRACT NUMBER ENER/C3/403/2010
REPORT TITLE ENER Lot 28– Pumps for private and public wastewater and for fluids with high solids content – Task 7: Improvement potential – Working document
PROJECT NAME
Work on Preparatory studies for implementing measures of the Ecodesign Directive 2009/125/EC ENER Lot 28 – Pumps for private and public wastewater and for fluids with high solids content
PROJECT CODE ENER Lot 28
PROJECT TEAM Bio by Deloitte, Atkins
DATE 02 April 2014
AUTHORS Mr. Shailendra Mudgal, Bio by Deloitte Mr. Sandeep Pahal, Bio by Deloitte Mr. Benoît Tinetti, Bio by Deloitte Mr. Alvaro De Prado Trigo, Bio by Deloitte Dr. Hugh Falkner, Atkins Mr. Keeran Jugdoyal, Atkins
KEY CONTACTS Mr. Sandeep Pahal
Or
Mr. Shailendra Mudgal
DISCLAIMER This document has been prepared for the European Commission however it reflects the views only of the authors, and the Commission cannot be held responsible for any use which may be made of the information contained therein. The project team does not accept any liability for any direct or indirect damage resulting from the use of this report or its content.
Please cite this publication as:
Bio by Deloitte (2014), Work on Preparatory studies for implementing measures of the Ecodesign
Directive 2009/125/EC ENER Lot 28 – Pumps for private and public wastewater and for fluids with
high solids content, ENER Lot 28– Pumps for private and public wastewater and for fluids with
high solids content – Task 7: Improvement potential – Working document prepared for. European Commission, DG ENER.
Photo credit: cover @ Per Ola Wiberg
© Bio by Deloitte 2014
Task 7: Improvement potential
Work on Preparatory studies for implementing measures of the Ecodesign Directive 2009/125/EC ENER Lot 28 – Pumps for private and public wastewater and for fluids with high
solids content | 3
Table of Contents
7.1 Identification of design options 7
7.1.1 Base-case 1: Centrifugal submersible: radial sewage pump 1-160 kW 8
7.1.2 Base-case 2: Centrifugal submersible: mixed flow and axial pumps 9
7.1.3 Base-case 3: Centrifugal submersible pump – once a day operation 10
7.1.4 Base-case 4: Centrifugal submersible domestic drainage pump<40mm passage 11
7.1.5 Base-case 5: Submersible dewatering pumps 12
7.1.6 Base-case 6: Centrifugal dry well pump 13
7.1.7 Base-case 7A: Slurry pumps: Light duty 14
7.1.8 Base-case 7B: Slurry pumps: Heavy duty 14
7.2 Analysis BAT and LLCC 16
7.2.1 Base-case 1: Centrifugal submersible pump: Radial sewage pumps 1 to 160 kW 16
7.2.2 Base-case 2: Centrifugal submersible pump: Mixed flow & axial pumps 20
7.2.3 Base-case 3: Centrifugal submersible pump – once day operation 24
7.2.4 Base-case 4: Centrifugal submersible domestic drainage pump<40 mm passage 28
7.2.5 Base-case 5: Submersible dewatering pump 32
7.2.6 Base-case 6: Centrifugal well pump 36
7.2.7 Base-case 7A: Slurry pumps: Light duty 40
7.2.8 Base-case 7B: Slurry pumps: Heavy duty 44
7.3 BNAT and long-term systems analysis 49
7.4 Conclusions 50
Task 7: Improvement Potential
4 |
Work on Preparatory studies for implementing measures of the Ecodesign Directive 2009/125/EC ENER Lot 28 – Pumps for private and public wastewater and for fluids with high solids content
List of Tables
Table 7-1: Identified energy savings potentials for BC1: centrifugal submersible pump: radial
sewage pumps 1 to 160 kW 8
Table 7-2: Identified energy savings potentials for BC2: Centrifugal submersible pump: Mixed
flow and axial pumps 9
Table 7-3: Identified energy savings potentials for BC3: Centrifugal submersible pump – once a
day operation 10
Table 7-4: Identified energy savings potentials for BC4: Centrifugal submersible domestic
drainage pump<40mm passage 11
Table 7-5: Identified energy savings potentials for BC5: Submersible dewatering pumps 12
Table 7-6: Identified energy savings potentials for BC6: Centrifugal dry well pump 13
Table 7-7: Identified energy savings potentials for BC7A: Slurry pumps: Light duty 14
Table 7-8: Identified energy savings potentials for BC7B: Slurry pumps: Heavy duty 15
Table 7-9: Environmental impacts of the BC1 and its improvement options 17
Table 7-10: Environmental impacts of the BC2 and its improvement options 21
Table 7-11: Environmental impacts of the BC3 and its improvement options 25
Table 7-12: Environmental impacts of the BC4 and its improvement options 29
Table 7-13: Environmental impacts of the BC5 and its improvement options 33
Table 7-14: Environmental impacts of the BC6 and its improvement options 37
Table 7-15: Environmental impacts of the BC7A and its improvement options 41
Table 7-16: Environmental impacts of the BC7B and its improvement options 45
Task 7: Improvement potential
Work on Preparatory studies for implementing measures of the Ecodesign Directive 2009/125/EC ENER Lot 28 – Pumps for private and public wastewater and for fluids with high
solids content | 5
List of Figures
Figure 7-1: Life cycle costs of the improvement options for BC1 19
Figure 7-2: Identification of design improvement options with the least energy consumption and
LLCC for BC1 20
Figure 7-3: Life cycle costs of the improvement options for BC2 23
Figure 7-4: Identification of design improvement options with the least energy consumption and
LLCC for BC2 24
Figure 7-5: Life cycle costs of the improvement options for BC3 27
Figure 7-6: Identification of design improvement options with the least energy consumption and
LLCC for BC3 28
Figure 7-7: Life cycle costs of the improvement options for BC4 31
Figure 7-8: Identification of design improvement options with the least energy consumption and
LLCC for BC4 32
Figure 7-9: Life cycle costs of the improvement options for BC5 35
Figure 7-10: Identification of design improvement options with the least energy consumption and
LLCC for BC5 36
Figure 7-11: Life cycle costs of the improvement options for BC6 39
Figure 7-12: Identification of design improvement options with the least energy consumption and
LLCC for BC6 40
Figure 7-13: Life cycle costs of the improvement options for BC7A 43
Figure 7-14: Identification of design improvement options with the least energy consumption and
LLCC for BC7A 44
Figure 7-15: Life cycle costs of the improvement options for BC7B 47
Figure 7-16: Identification of design improvement options with the least energy consumption and
LLCC for BC7B 48

Task 7: Improvement Potential
6 |
Work on Preparatory studies for implementing measures of the Ecodesign Directive 2009/125/EC ENER Lot 28 – Pumps for private and public wastewater and for fluids with high solids content
This page is left intentionally blank
Task 7: Improvement potential
Work on Preparatory studies for implementing measures of the Ecodesign Directive 2009/125/EC ENER Lot 28 – Pumps for private and public wastewater and for fluids with high
solids content | 7
Chapter 7: Improvement Potential (Task 7)
Task 7 quantitatively analyses design improvement options, based on the Best Available
Technologies (BATs) described in Task 6 for each of the product base-cases. The payback time
indicates the duration of repayment required to offset the investments associated with the
different options, it takes into account changes in purchase price, installation cost, repair and
maintenance cost compared with unit-to-unit energy savings. The environmental impacts of
each of these options are calculated by using the MEErP EcoReport tool. The economic impacts
of each design option are assessed in terms of Life Cycle Cost (LCC). The assessment of LCC is
relevant as it indicates the level of impact design options may have on the cost to users over the
whole lifetime of the product. The assessment of both environmental and economic impacts
allows the identification of the design improvement options with the Least Life Cycle Costs
(LLCC) and the one that results in the most significant reductions in environmental impacts. The
Best Not yet Available Technologies (BNAT) are also discussed, assessing long-term
improvement potential of the wastewater pumps.
7.1 Identification of design options
This section presents the different improvement options applicable to each base-case. These
design options are carefully selected keeping in mind that they:
Do not result in significant variation in the functionality and the performance
parameter of the pumps compared to the base-cases
Have a significant potential for improvement in the environmental performance
Not entail excessive costs on the manufacturer
The cost-effectiveness of an improvement option is expressed in terms of payback time in years,
defined as a ratio between:
Where “investment” includes the purchase and installation costs and “annual running costs” include the cost of the energy consumed and the costs of repair and maintenance. In the case of a payback time longer than the lifetime of the product, the return of the investment would not be possible.
Task 7: Improvement Potential
8 |
Work on Preparatory studies for implementing measures of the Ecodesign Directive 2009/125/EC ENER Lot 28 – Pumps for private and public wastewater and for fluids with high solids content
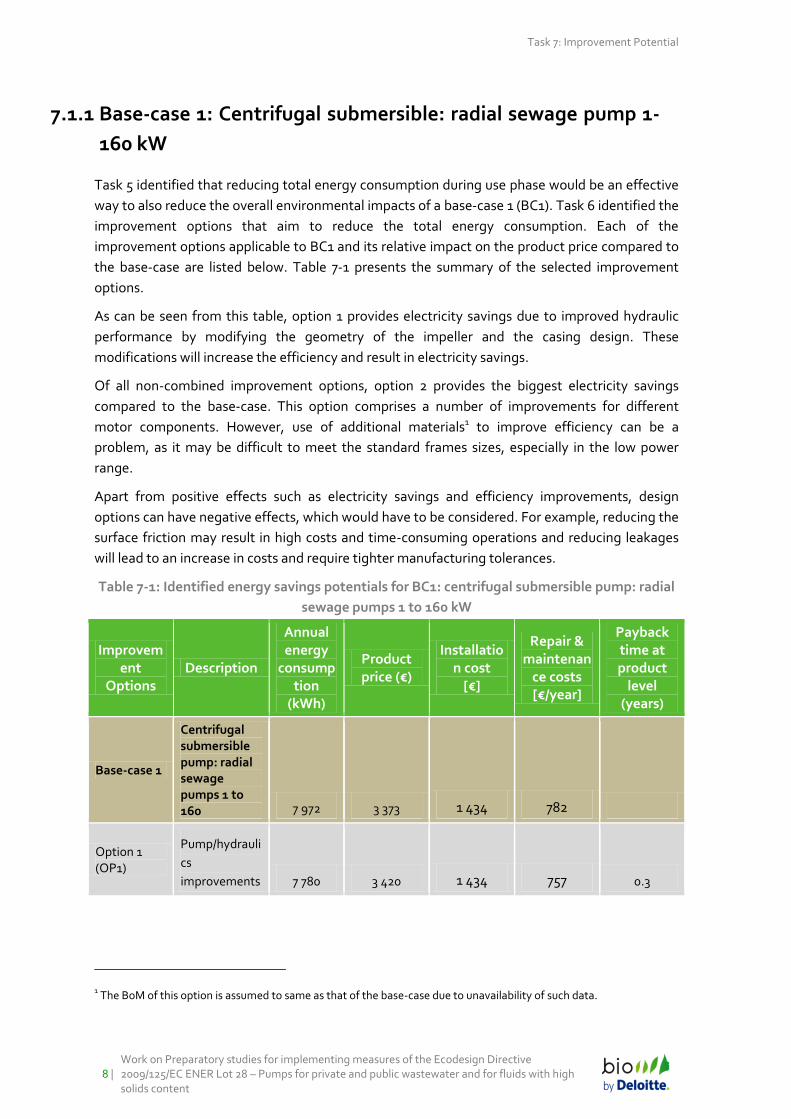
7.1.1 Base-case 1: Centrifugal submersible: radial sewage pump 1-
160 kW
Task 5 identified that reducing total energy consumption during use phase would be an effective
way to also reduce the overall environmental impacts of a base-case 1 (BC1). Task 6 identified the
improvement options that aim to reduce the total energy consumption. Each of the
improvement options applicable to BC1 and its relative impact on the product price compared to
the base-case are listed below. Table 7-1 presents the summary of the selected improvement
options.
As can be seen from this table, option 1 provides electricity savings due to improved hydraulic
performance by modifying the geometry of the impeller and the casing design. These
modifications will increase the efficiency and result in electricity savings.
Of all non-combined improvement options, option 2 provides the biggest electricity savings
compared to the base-case. This option comprises a number of improvements for different
motor components. However, use of additional materials1 to improve efficiency can be a
problem, as it may be difficult to meet the standard frames sizes, especially in the low power
range.
Apart from positive effects such as electricity savings and efficiency improvements, design
options can have negative effects, which would have to be considered. For example, reducing the
surface friction may result in high costs and time-consuming operations and reducing leakages
will lead to an increase in costs and require tighter manufacturing tolerances.
Table 7-1: Identified energy savings potentials for BC1: centrifugal submersible pump: radial
sewage pumps 1 to 160 kW
Improvement
Options Description
Annual energy
consumption
(kWh)
Product price (€)
Installation cost
[€]
Repair & maintenan
ce costs [€/year]
Payback time at product
level (years)
Base-case 1
Centrifugal submersible pump: radial sewage pumps 1 to 160 7 972 3 373 1 434 782
Option 1 (OP1)
Pump/hydrauli
cs
improvements 7 780 3 420 1 434 757 0.3
1 The BoM of this option is assumed to same as that of the base-case due to unavailability of such data.
Task 7: Improvement potential
Work on Preparatory studies for implementing measures of the Ecodesign Directive 2009/125/EC ENER Lot 28 – Pumps for private and public wastewater and for fluids with high
solids content | 9
Improvement
Options Description
Annual energy
consumption
(kWh)
Product price (€)
Installation cost
[€]
Repair & maintenan
ce costs [€/year]
Payback time at product
level (years)
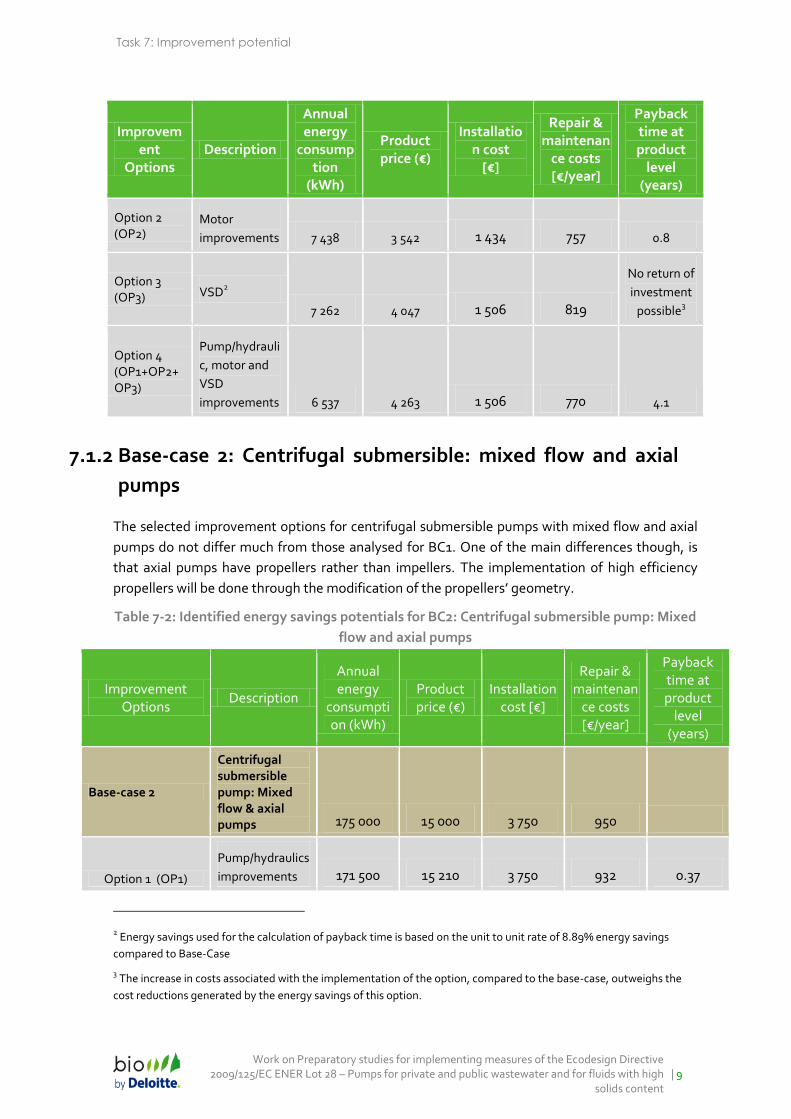
Option 2 (OP2)
Motor
improvements 7 438 3 542 1 434 757 0.8
Option 3 (OP3) VSD
2
7 262 4 047 1 506 819
No return of
investment
possible3
Option 4 (OP1+OP2+OP3)
Pump/hydrauli
c, motor and
VSD
improvements 6 537 4 263 1 506 770 4.1
7.1.2 Base-case 2: Centrifugal submersible: mixed flow and axial
pumps
The selected improvement options for centrifugal submersible pumps with mixed flow and axial
pumps do not differ much from those analysed for BC1. One of the main differences though, is
that axial pumps have propellers rather than impellers. The implementation of high efficiency
propellers will be done through the modification of the propellers’ geometry.
Table 7-2: Identified energy savings potentials for BC2: Centrifugal submersible pump: Mixed
flow and axial pumps
Improvement Options
Description
Annual energy
consumption (kWh)
Product price (€)
Installation cost [€]
Repair & maintenan
ce costs [€/year]
Payback time at product
level (years)
Base-case 2
Centrifugal submersible pump: Mixed flow & axial pumps 175 000 15 000 3 750 950
Option 1 (OP1)
Pump/hydraulics
improvements 171 500 15 210 3 750 932 0.37
2 Energy savings used for the calculation of payback time is based on the unit to unit rate of 8.89% energy savings
compared to Base-Case
3 The increase in costs associated with the implementation of the option, compared to the base-case, outweighs the
cost reductions generated by the energy savings of this option.
Task 7: Improvement Potential
10 |
Work on Preparatory studies for implementing measures of the Ecodesign Directive 2009/125/EC ENER Lot 28 – Pumps for private and public wastewater and for fluids with high solids content
Improvement Options
Description
Annual energy
consumption (kWh)
Product price (€)
Installation cost [€]
Repair & maintenan
ce costs [€/year]
Payback time at product
level (years)
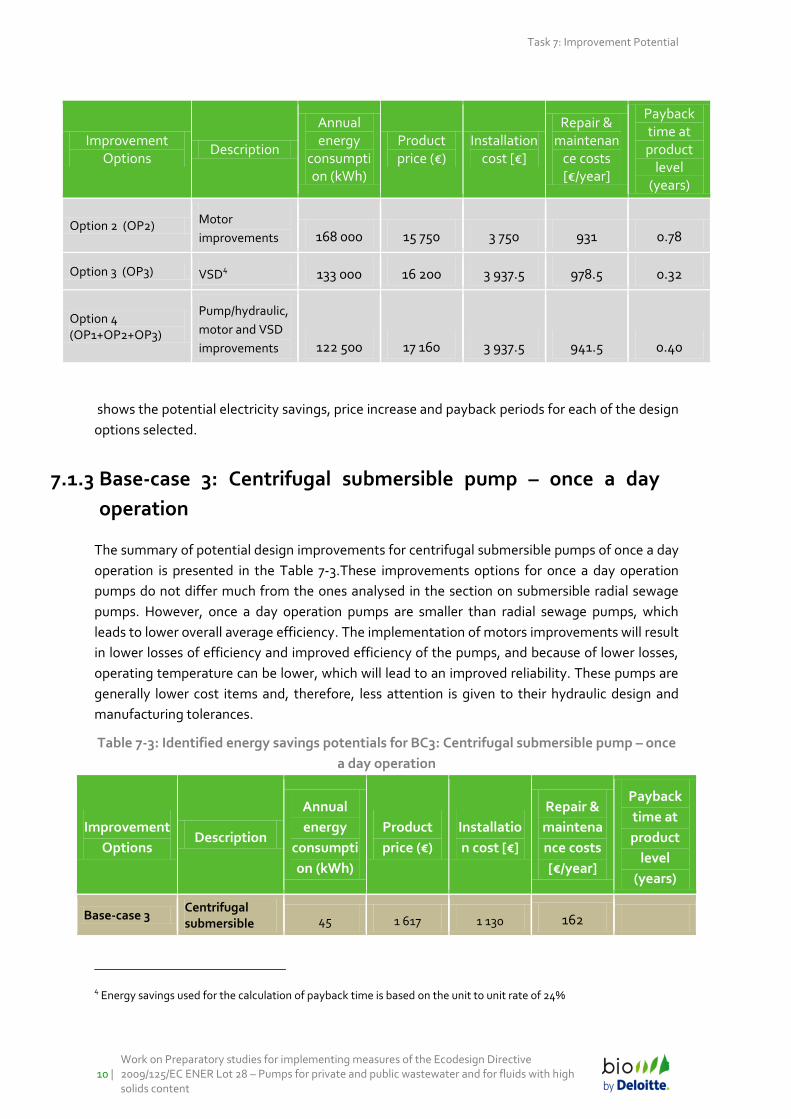
Option 2 (OP2) Motor
improvements 168 000 15 750 3 750 931 0.78
Option 3 (OP3) VSD4 133 000 16 200 3 937.5 978.5 0.32
Option 4 (OP1+OP2+OP3)
Pump/hydraulic,
motor and VSD
improvements 122 500 17 160 3 937.5 941.5 0.40
shows the potential electricity savings, price increase and payback periods for each of the design
options selected.
7.1.3 Base-case 3: Centrifugal submersible pump – once a day
operation
The summary of potential design improvements for centrifugal submersible pumps of once a day
operation is presented in the Table 7-3.These improvements options for once a day operation
pumps do not differ much from the ones analysed in the section on submersible radial sewage
pumps. However, once a day operation pumps are smaller than radial sewage pumps, which
leads to lower overall average efficiency. The implementation of motors improvements will result
in lower losses of efficiency and improved efficiency of the pumps, and because of lower losses,
operating temperature can be lower, which will lead to an improved reliability. These pumps are
generally lower cost items and, therefore, less attention is given to their hydraulic design and
manufacturing tolerances.
Table 7-3: Identified energy savings potentials for BC3: Centrifugal submersible pump – once
a day operation
Improvement
Options Description
Annual
energy
consumpti
on (kWh)
Product
price (€)
Installatio
n cost [€]
Repair &
maintena
nce costs
[€/year]
Payback
time at
product
level
(years)
Base-case 3 Centrifugal submersible 45 1 617 1 130 162
4 Energy savings used for the calculation of payback time is based on the unit to unit rate of 24%
Task 7: Improvement potential
Work on Preparatory studies for implementing measures of the Ecodesign Directive 2009/125/EC ENER Lot 28 – Pumps for private and public wastewater and for fluids with high
solids content | 11
Improvement
Options Description
Annual
energy
consumpti
on (kWh)
Product
price (€)
Installatio
n cost [€]
Repair &
maintena
nce costs
[€/year]
Payback
time at
product
level
(years)
pump – Once a day operation
Option 1 (OP1) Pump/hydraulics
improvements 43 1 640 1 130 159 0.9
Option 2 (OP2) Motor
improvements 42 1 779 1 130 158.7 6.1
Option 3 (OP1+OP2)
Pump/hydraulic
and motor
improvements 40 1 801 1 130 155.7 3.6
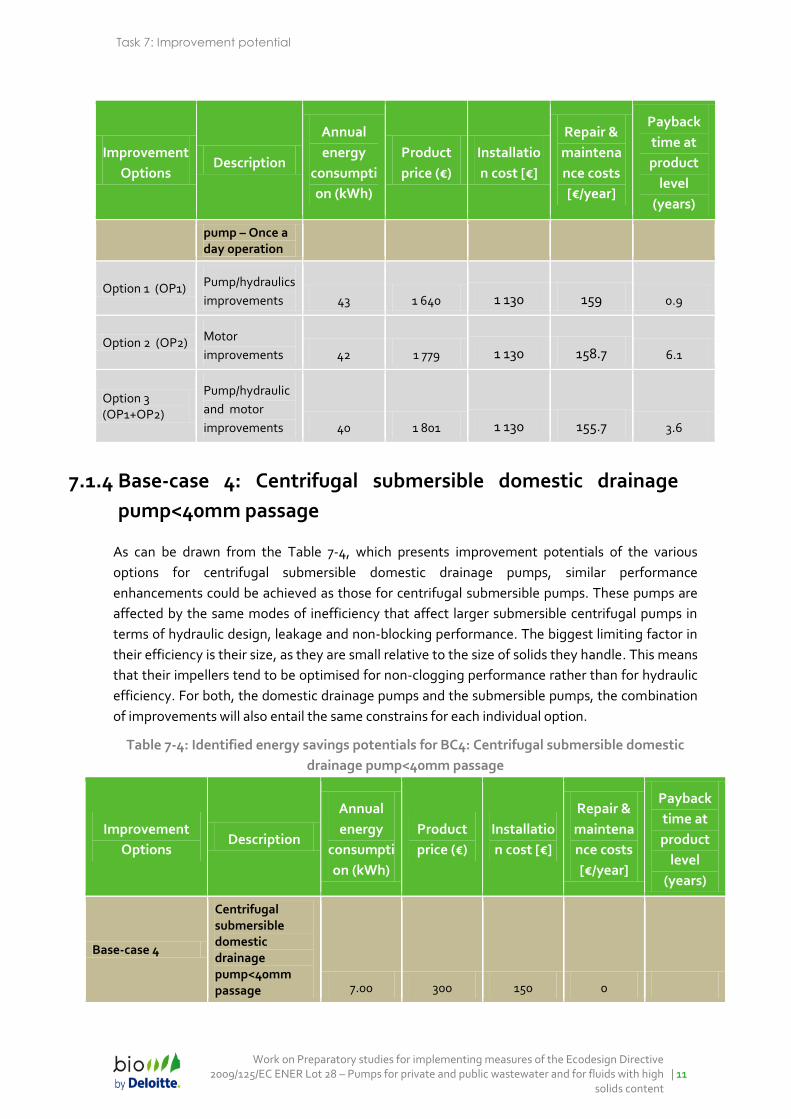
7.1.4 Base-case 4: Centrifugal submersible domestic drainage
pump<40mm passage
As can be drawn from the Table 7-4, which presents improvement potentials of the various
options for centrifugal submersible domestic drainage pumps, similar performance
enhancements could be achieved as those for centrifugal submersible pumps. These pumps are
affected by the same modes of inefficiency that affect larger submersible centrifugal pumps in
terms of hydraulic design, leakage and non-blocking performance. The biggest limiting factor in
their efficiency is their size, as they are small relative to the size of solids they handle. This means
that their impellers tend to be optimised for non-clogging performance rather than for hydraulic
efficiency. For both, the domestic drainage pumps and the submersible pumps, the combination
of improvements will also entail the same constrains for each individual option.
Table 7-4: Identified energy savings potentials for BC4: Centrifugal submersible domestic
drainage pump<40mm passage
Improvement
Options Description
Annual
energy
consumpti
on (kWh)
Product
price (€)
Installatio
n cost [€]
Repair &
maintena
nce costs
[€/year]
Payback
time at
product
level
(years)
Base-case 4
Centrifugal submersible domestic drainage pump<40mm passage 7.00 300 150 0
Task 7: Improvement Potential
12 |
Work on Preparatory studies for implementing measures of the Ecodesign Directive 2009/125/EC ENER Lot 28 – Pumps for private and public wastewater and for fluids with high solids content
Improvement
Options Description
Annual
energy
consumpti
on (kWh)
Product
price (€)
Installatio
n cost [€]
Repair &
maintena
nce costs
[€/year]
Payback
time at
product
level
(years)
Option 1 (OP1) Pump/hydraulics
improvements
6.30 304 150 0
No return
of
investment
possible3
Option 2 (OP2) Motor
improvements
6.65 345 150 0
No return
of
investment
possible3
Option 3 (OP1+OP2)
Pump/hydraulic
and motor
improvements 5.95 349 150 0
No return
of
investment
possible3
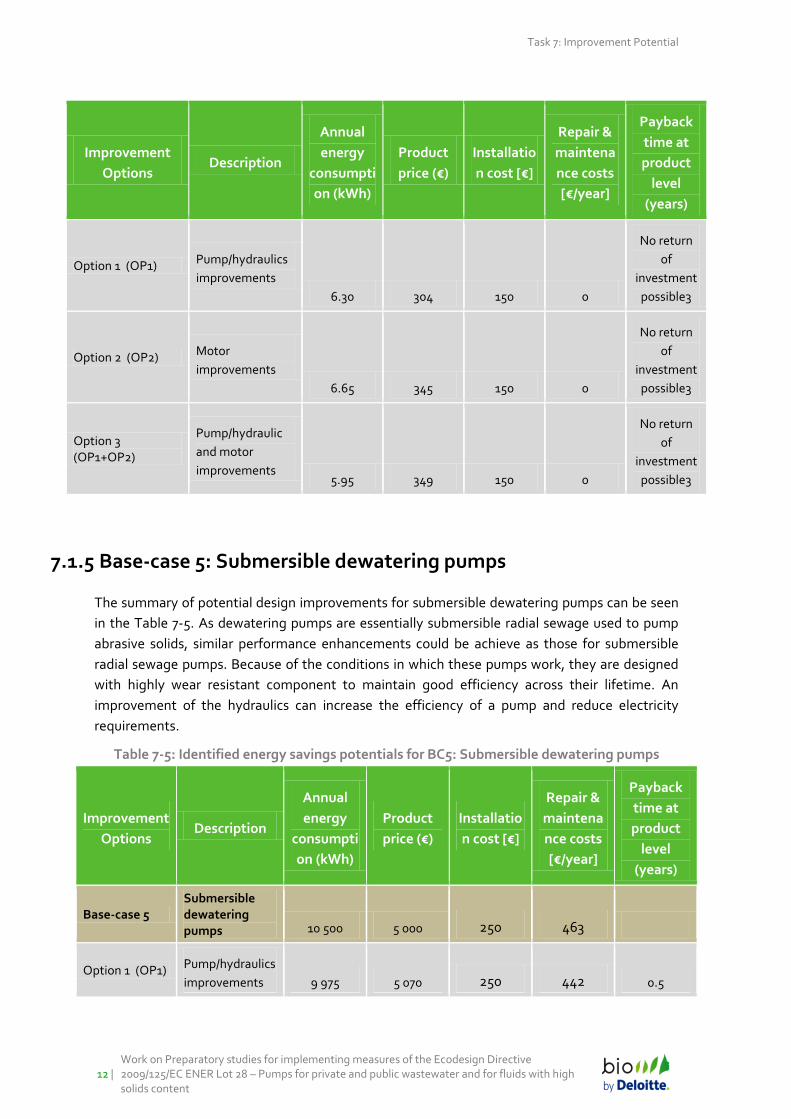
7.1.5 Base-case 5: Submersible dewatering pumps
The summary of potential design improvements for submersible dewatering pumps can be seen
in the Table 7-5. As dewatering pumps are essentially submersible radial sewage used to pump
abrasive solids, similar performance enhancements could be achieve as those for submersible
radial sewage pumps. Because of the conditions in which these pumps work, they are designed
with highly wear resistant component to maintain good efficiency across their lifetime. An
improvement of the hydraulics can increase the efficiency of a pump and reduce electricity
requirements.
Table 7-5: Identified energy savings potentials for BC5: Submersible dewatering pumps
Improvement
Options Description
Annual
energy
consumpti
on (kWh)
Product
price (€)
Installatio
n cost [€]
Repair &
maintena
nce costs
[€/year]
Payback
time at
product
level
(years)
Base-case 5 Submersible dewatering pumps 10 500 5 000 250 463
Option 1 (OP1) Pump/hydraulics
improvements 9 975 5 070 250 442 0.5
Task 7: Improvement potential
Work on Preparatory studies for implementing measures of the Ecodesign Directive 2009/125/EC ENER Lot 28 – Pumps for private and public wastewater and for fluids with high
solids content | 13
Improvement
Options Description
Annual
energy
consumpti
on (kWh)
Product
price (€)
Installatio
n cost [€]
Repair &
maintena
nce costs
[€/year]
Payback
time at
product
level
(years)
Option 2 (OP2) Motor
improvements5 9 975 5 250 250 441 1.7
Option 3 (OP1+OP2)
Pump/hydraulic
and motor
improvements 9 450 5320 250 420 1.1
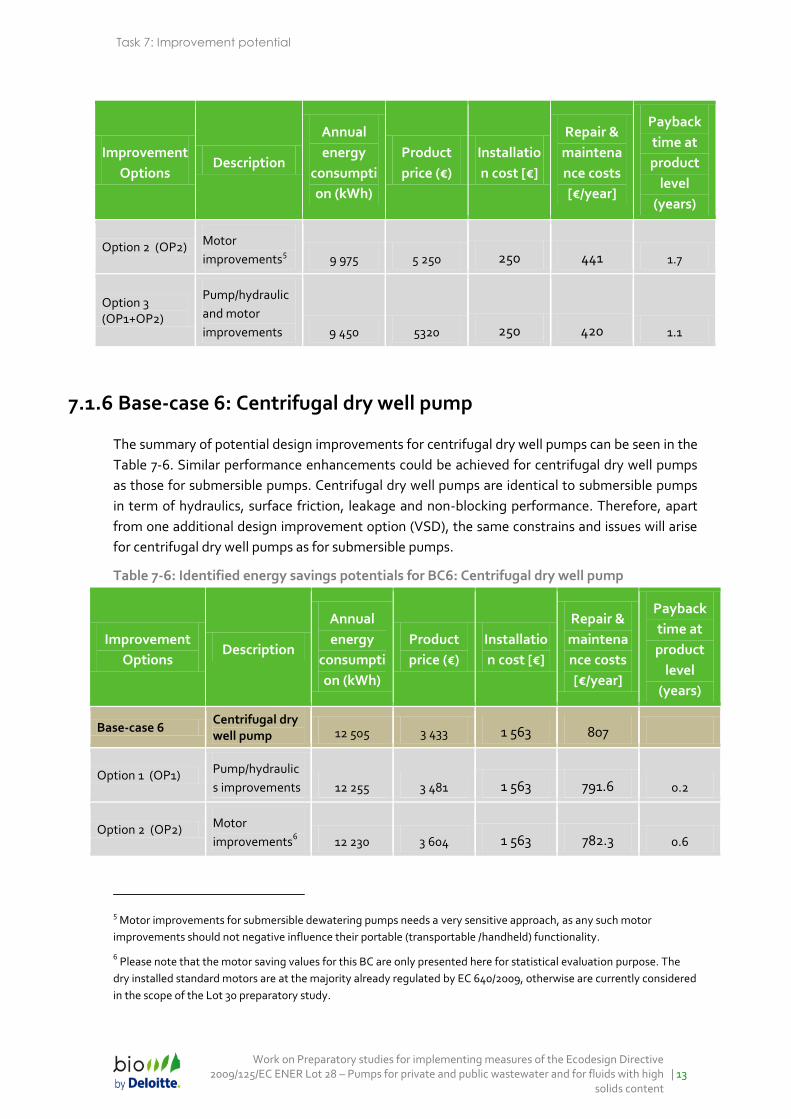
7.1.6 Base-case 6: Centrifugal dry well pump
The summary of potential design improvements for centrifugal dry well pumps can be seen in the
Table 7-6. Similar performance enhancements could be achieved for centrifugal dry well pumps
as those for submersible pumps. Centrifugal dry well pumps are identical to submersible pumps
in term of hydraulics, surface friction, leakage and non-blocking performance. Therefore, apart
from one additional design improvement option (VSD), the same constrains and issues will arise
for centrifugal dry well pumps as for submersible pumps.
Table 7-6: Identified energy savings potentials for BC6: Centrifugal dry well pump
Improvement
Options Description
Annual
energy
consumpti
on (kWh)
Product
price (€)
Installatio
n cost [€]
Repair &
maintena
nce costs
[€/year]
Payback
time at
product
level
(years)
Base-case 6 Centrifugal dry well pump 12 505 3 433 1 563 807
Option 1 (OP1) Pump/hydraulic
s improvements 12 255 3 481 1 563 791.6 0.2
Option 2 (OP2) Motor
improvements6 12 230 3 604 1 563 782.3 0.6
5 Motor improvements for submersible dewatering pumps needs a very sensitive approach, as any such motor
improvements should not negative influence their portable (transportable /handheld) functionality.
6 Please note that the motor saving values for this BC are only presented here for statistical evaluation purpose. The
dry installed standard motors are at the majority already regulated by EC 640/2009, otherwise are currently considered
in the scope of the Lot 30 preparatory study.
Task 7: Improvement Potential
14 |
Work on Preparatory studies for implementing measures of the Ecodesign Directive 2009/125/EC ENER Lot 28 – Pumps for private and public wastewater and for fluids with high solids content
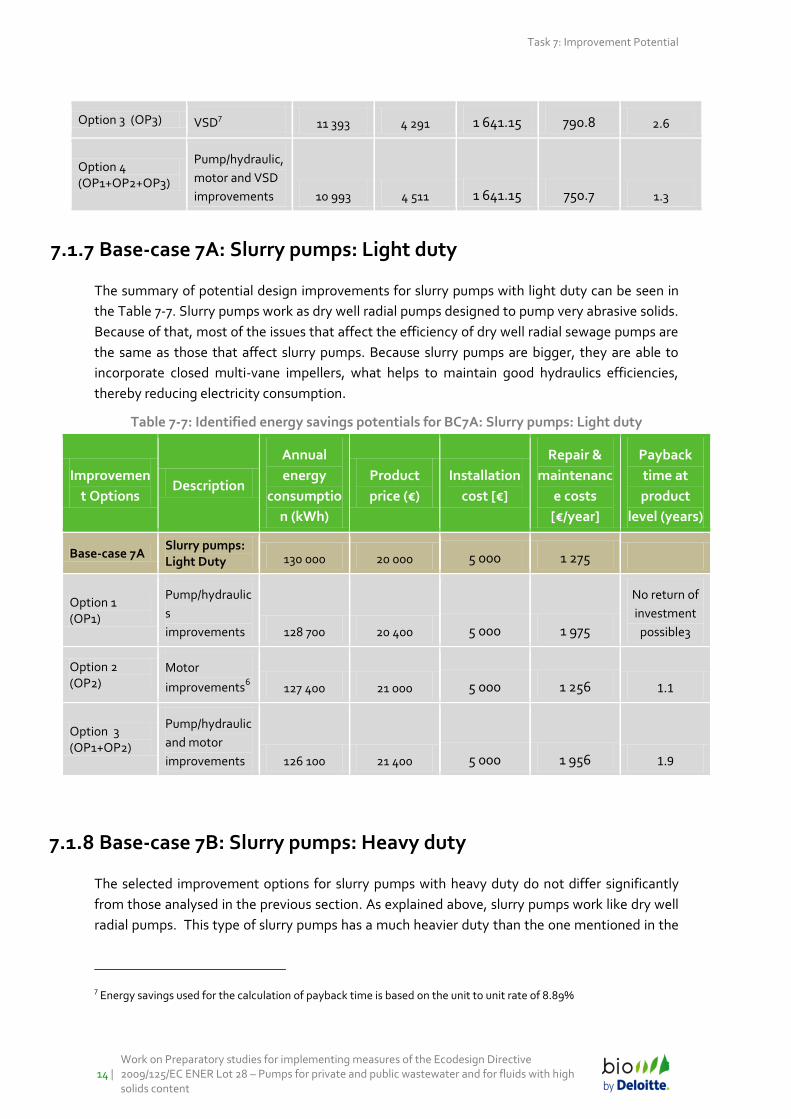
Option 3 (OP3) VSD7 11 393 4 291 1 641.15 790.8 2.6
Option 4 (OP1+OP2+OP3)
Pump/hydraulic,
motor and VSD
improvements 10 993 4 511 1 641.15 750.7 1.3
7.1.7 Base-case 7A: Slurry pumps: Light duty
The summary of potential design improvements for slurry pumps with light duty can be seen in
the Table 7-7. Slurry pumps work as dry well radial pumps designed to pump very abrasive solids.
Because of that, most of the issues that affect the efficiency of dry well radial sewage pumps are
the same as those that affect slurry pumps. Because slurry pumps are bigger, they are able to
incorporate closed multi-vane impellers, what helps to maintain good hydraulics efficiencies,
thereby reducing electricity consumption.
Table 7-7: Identified energy savings potentials for BC7A: Slurry pumps: Light duty
Improvemen
t Options Description
Annual
energy
consumptio
n (kWh)
Product
price (€)
Installation
cost [€]
Repair &
maintenanc
e costs
[€/year]
Payback
time at
product
level (years)
Base-case 7A Slurry pumps: Light Duty 130 000 20 000 5 000 1 275
Option 1 (OP1)
Pump/hydraulic
s
improvements 128 700 20 400 5 000 1 975
No return of
investment
possible3
Option 2 (OP2)
Motor
improvements6 127 400 21 000 5 000 1 256 1.1
Option 3 (OP1+OP2)
Pump/hydraulic
and motor
improvements 126 100 21 400 5 000 1 956 1.9
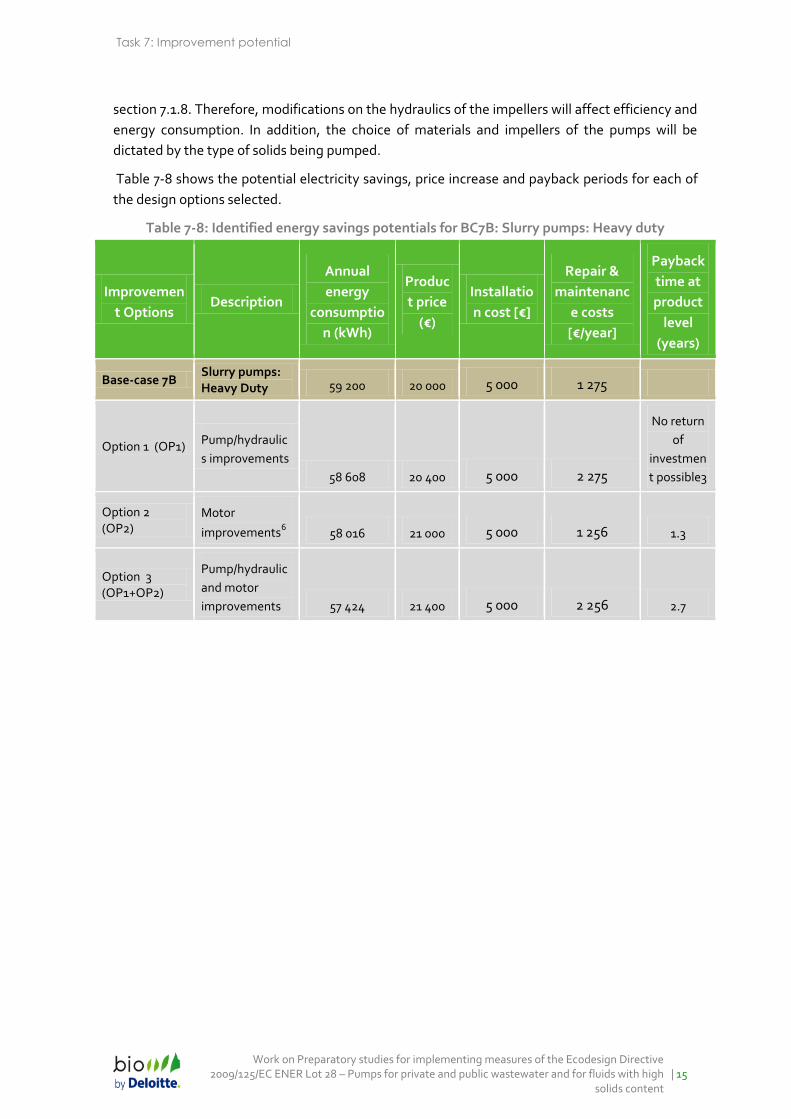
7.1.8 Base-case 7B: Slurry pumps: Heavy duty
The selected improvement options for slurry pumps with heavy duty do not differ significantly
from those analysed in the previous section. As explained above, slurry pumps work like dry well
radial pumps. This type of slurry pumps has a much heavier duty than the one mentioned in the
7 Energy savings used for the calculation of payback time is based on the unit to unit rate of 8.89%
Task 7: Improvement potential
Work on Preparatory studies for implementing measures of the Ecodesign Directive 2009/125/EC ENER Lot 28 – Pumps for private and public wastewater and for fluids with high
solids content | 15
section 7.1.8. Therefore, modifications on the hydraulics of the impellers will affect efficiency and
energy consumption. In addition, the choice of materials and impellers of the pumps will be
dictated by the type of solids being pumped.
Table 7-8 shows the potential electricity savings, price increase and payback periods for each of
the design options selected.
Table 7-8: Identified energy savings potentials for BC7B: Slurry pumps: Heavy duty
Improvemen
t Options Description
Annual
energy
consumptio
n (kWh)
Produc
t price
(€)
Installatio
n cost [€]
Repair &
maintenanc
e costs
[€/year]
Payback
time at
product
level
(years)
Base-case 7B Slurry pumps: Heavy Duty 59 200 20 000 5 000 1 275
Option 1 (OP1) Pump/hydraulic
s improvements
58 608 20 400 5 000 2 275
No return
of
investmen
t possible3
Option 2 (OP2)
Motor
improvements6 58 016 21 000 5 000 1 256 1.3
Option 3 (OP1+OP2)
Pump/hydraulic
and motor
improvements 57 424 21 400 5 000 2 256 2.7
Task 7: Improvement Potential
16 |
Work on Preparatory studies for implementing measures of the Ecodesign Directive 2009/125/EC ENER Lot 28 – Pumps for private and public wastewater and for fluids with high solids content
7.2 Analysis BAT and LLCC
The design options identified in the technical, environmental and economic analyses are ranked
to identify the design improvement option with the least cycle environmental impacts and the
Least Life Cycle Costs (LLCC). Building an energy-LCC curve (Y-axis= energy consumed and LCC,
X-axis=options) allows the LLCC and BATs to be identified8.
The performance of each improvement option will be compared using the base-case. The
comparison is made in terms of primary energy consumption and LCC.
LCC is the sum of the product price, costs of energy and the costs of installation and maintenance
as described in Task 4.
7.2.1 Base-case 1: Centrifugal submersible pump: Radial sewage
pumps 1 to 160 kW
An environmental and economic assessment was carried out for each improvement option
relevant for centrifugal submersible pump: Radial sewage pumps 1 to 160 kW using the
EcoReport tool. Outcomes for the whole life cycle are provided in absolute values (in units) and
in variations compared to the base-case.
8 This is usually the last data point of the curve showing the product design with the lowest environmental impact,
irrespective of the price.
Task 7: Improvement potential
Work on Preparatory studies for implementing measures of the Ecodesign Directive 2009/125/EC ENER Lot 28 – Pumps for private and public wastewater and for fluids with high
solids content | 17
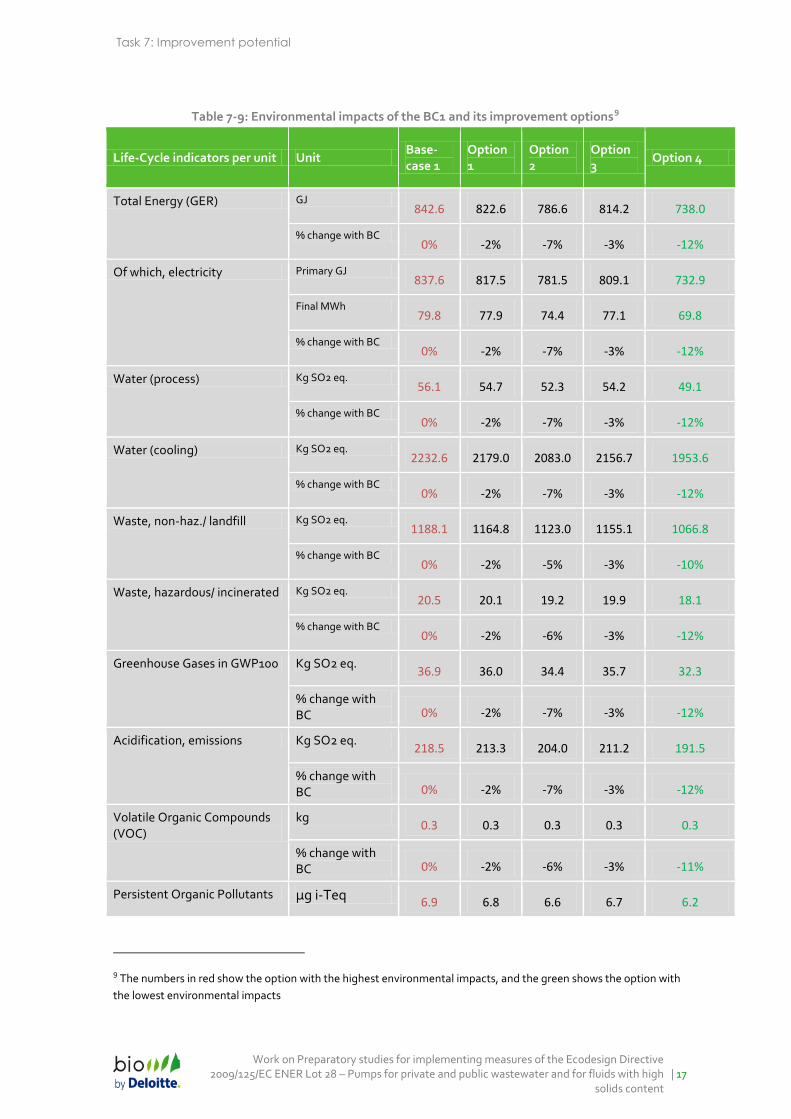
Table 7-9: Environmental impacts of the BC1 and its improvement options9
Life-Cycle indicators per unit Unit Base-case 1
Option 1
Option 2
Option 3
Option 4
Total Energy (GER) GJ 842.6 822.6 786.6 814.2 738.0
% change with BC 0% -2% -7% -3% -12%
Of which, electricity Primary GJ 837.6 817.5 781.5 809.1 732.9
Final MWh 79.8 77.9 74.4 77.1 69.8
% change with BC 0% -2% -7% -3% -12%
Water (process) Kg SO2 eq. 56.1 54.7 52.3 54.2 49.1
% change with BC 0% -2% -7% -3% -12%
Water (cooling) Kg SO2 eq. 2232.6 2179.0 2083.0 2156.7 1953.6
% change with BC 0% -2% -7% -3% -12%
Waste, non-haz./ landfill Kg SO2 eq. 1188.1 1164.8 1123.0 1155.1 1066.8
% change with BC 0% -2% -5% -3% -10%
Waste, hazardous/ incinerated Kg SO2 eq. 20.5 20.1 19.2 19.9 18.1
% change with BC 0% -2% -6% -3% -12%
Greenhouse Gases in GWP100 Kg SO2 eq. 36.9 36.0 34.4 35.7 32.3
% change with BC 0% -2% -7% -3% -12%
Acidification, emissions Kg SO2 eq. 218.5 213.3 204.0 211.2 191.5
% change with BC 0% -2% -7% -3% -12%
Volatile Organic Compounds (VOC)
kg 0.3 0.3 0.3 0.3 0.3
% change with BC 0% -2% -6% -3% -11%
Persistent Organic Pollutants μg i-Teq 6.9 6.8 6.6 6.7 6.2
9 The numbers in red show the option with the highest environmental impacts, and the green shows the option with
the lowest environmental impacts
Task 7: Improvement Potential
18 |
Work on Preparatory studies for implementing measures of the Ecodesign Directive 2009/125/EC ENER Lot 28 – Pumps for private and public wastewater and for fluids with high solids content
Life-Cycle indicators per unit Unit Base-case 1
Option 1
Option 2
Option 3
Option 4
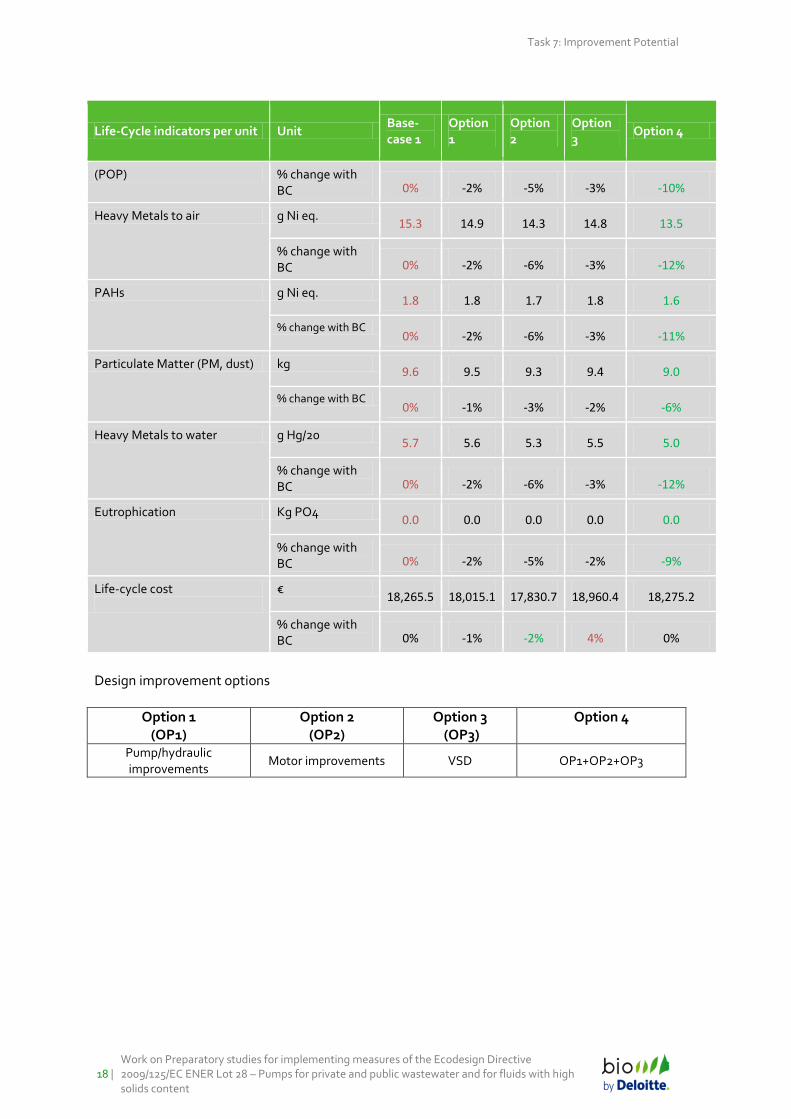
(POP) % change with BC 0% -2% -5% -3% -10%
Heavy Metals to air g Ni eq. 15.3 14.9 14.3 14.8 13.5
% change with BC 0% -2% -6% -3% -12%
PAHs g Ni eq. 1.8 1.8 1.7 1.8 1.6
% change with BC 0% -2% -6% -3% -11%
Particulate Matter (PM, dust) kg 9.6 9.5 9.3 9.4 9.0
% change with BC 0% -1% -3% -2% -6%
Heavy Metals to water g Hg/20 5.7 5.6 5.3 5.5 5.0
% change with BC 0% -2% -6% -3% -12%
Eutrophication Kg PO4 0.0 0.0 0.0 0.0 0.0
% change with BC 0% -2% -5% -2% -9%
Life-cycle cost
€ 18,265.5 18,015.1 17,830.7 18,960.4 18,275.2
% change with BC 0% -1% -2% 4% 0%
Design improvement options
Option 1 (OP1)
Option 2 (OP2)
Option 3 (OP3)
Option 4
Pump/hydraulic improvements
Motor improvements VSD OP1+OP2+OP3
Task 7: Improvement potential
Work on Preparatory studies for implementing measures of the Ecodesign Directive 2009/125/EC ENER Lot 28 – Pumps for private and public wastewater and for fluids with high
solids content | 19
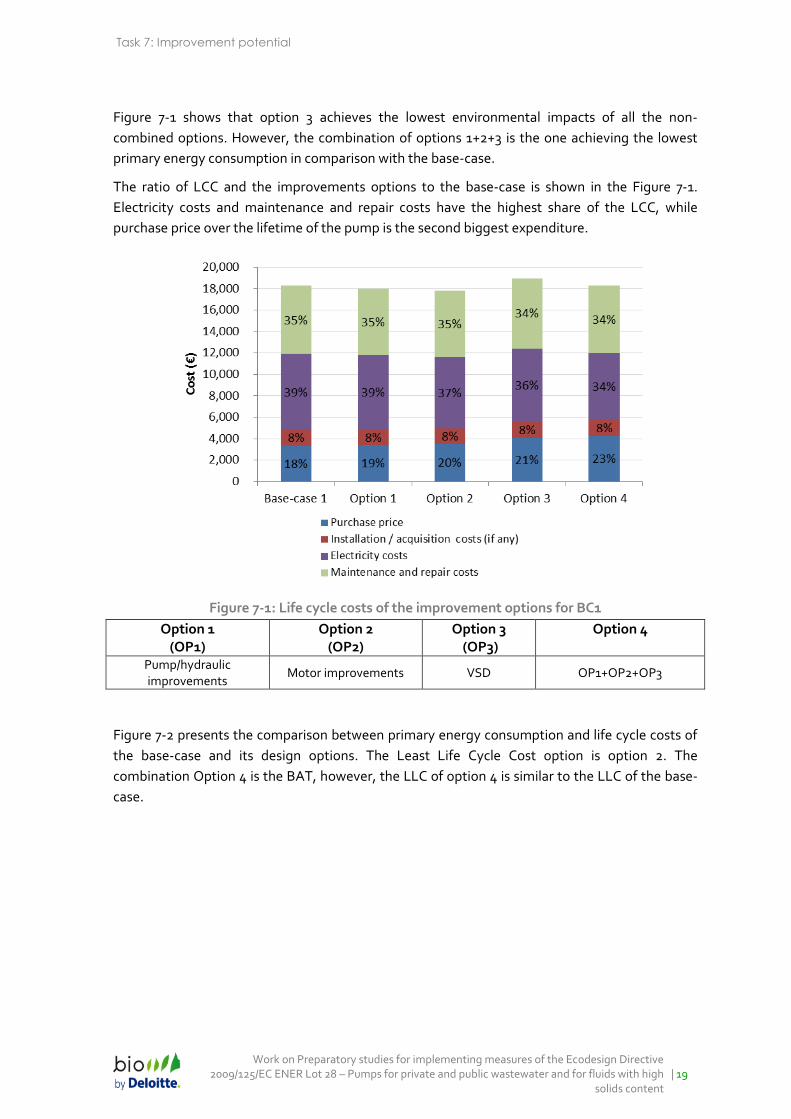
Figure 7-1 shows that option 3 achieves the lowest environmental impacts of all the non-
combined options. However, the combination of options 1+2+3 is the one achieving the lowest
primary energy consumption in comparison with the base-case.
The ratio of LCC and the improvements options to the base-case is shown in the Figure 7-1.
Electricity costs and maintenance and repair costs have the highest share of the LCC, while
purchase price over the lifetime of the pump is the second biggest expenditure.
Figure 7-1: Life cycle costs of the improvement options for BC1
Option 1 (OP1)
Option 2 (OP2)
Option 3 (OP3)
Option 4
Pump/hydraulic improvements
Motor improvements VSD OP1+OP2+OP3
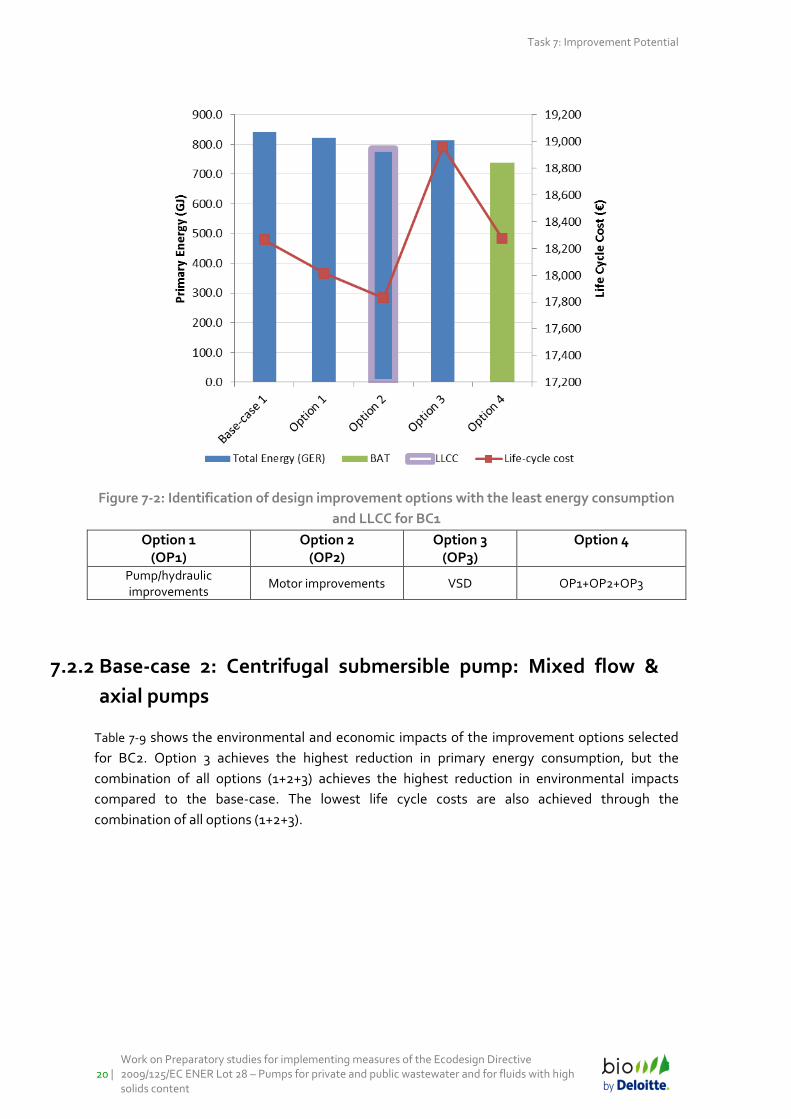
Figure 7-2 presents the comparison between primary energy consumption and life cycle costs of
the base-case and its design options. The Least Life Cycle Cost option is option 2. The
combination Option 4 is the BAT, however, the LLC of option 4 is similar to the LLC of the base-
case.
Task 7: Improvement Potential
20 |
Work on Preparatory studies for implementing measures of the Ecodesign Directive 2009/125/EC ENER Lot 28 – Pumps for private and public wastewater and for fluids with high solids content
Figure 7-2: Identification of design improvement options with the least energy consumption
and LLCC for BC1
Option 1 (OP1)
Option 2 (OP2)
Option 3 (OP3)
Option 4
Pump/hydraulic improvements
Motor improvements VSD OP1+OP2+OP3
7.2.2 Base-case 2: Centrifugal submersible pump: Mixed flow &
axial pumps
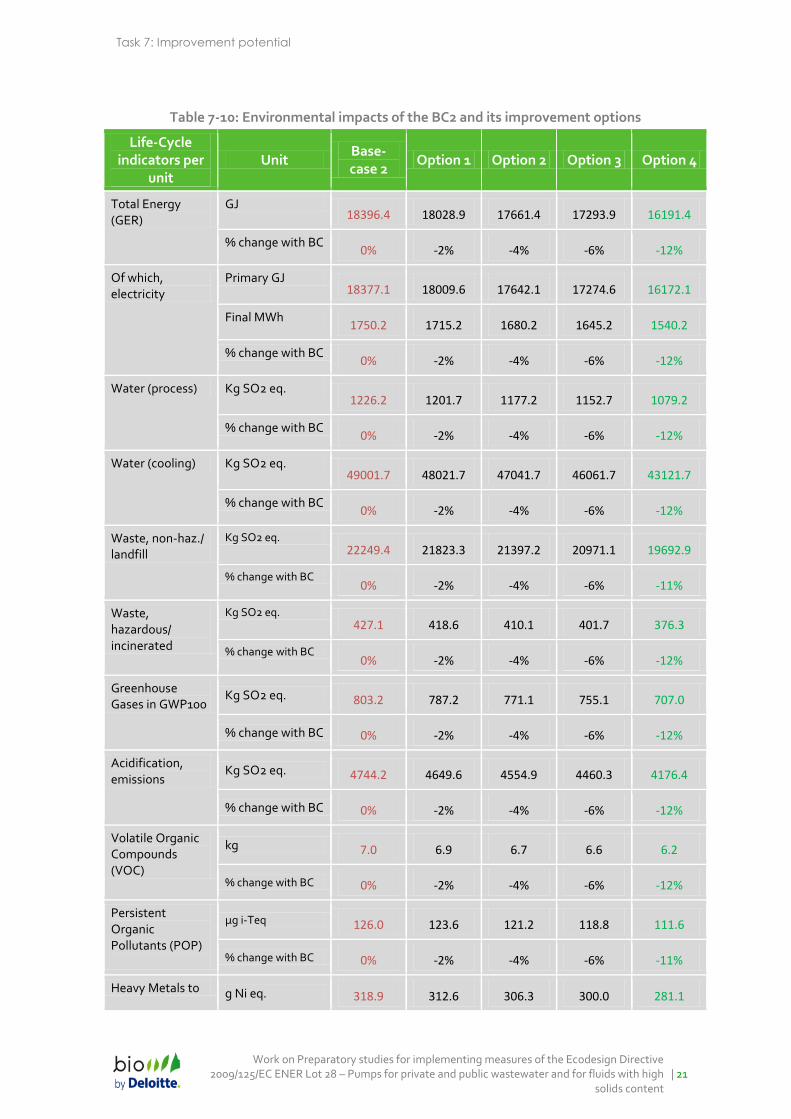
Table 7-9 shows the environmental and economic impacts of the improvement options selected
for BC2. Option 3 achieves the highest reduction in primary energy consumption, but the
combination of all options (1+2+3) achieves the highest reduction in environmental impacts
compared to the base-case. The lowest life cycle costs are also achieved through the
combination of all options (1+2+3).
Task 7: Improvement potential
Work on Preparatory studies for implementing measures of the Ecodesign Directive 2009/125/EC ENER Lot 28 – Pumps for private and public wastewater and for fluids with high
solids content | 21
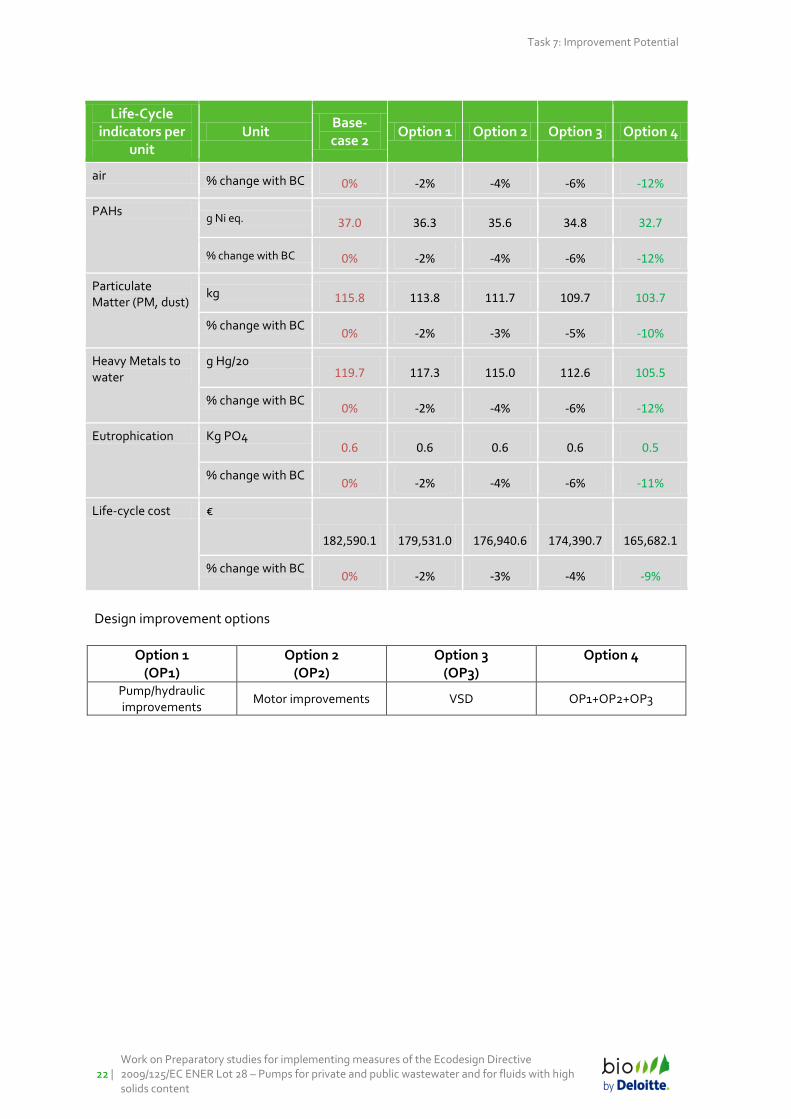
Table 7-10: Environmental impacts of the BC2 and its improvement options
Life-Cycle indicators per
unit Unit
Base-case 2
Option 1 Option 2 Option 3 Option 4
Total Energy (GER)
GJ 18396.4 18028.9 17661.4 17293.9 16191.4
% change with BC 0% -2% -4% -6% -12%
Of which, electricity
Primary GJ 18377.1 18009.6 17642.1 17274.6 16172.1
Final MWh 1750.2 1715.2 1680.2 1645.2 1540.2
% change with BC 0% -2% -4% -6% -12%
Water (process) Kg SO2 eq. 1226.2 1201.7 1177.2 1152.7 1079.2
% change with BC 0% -2% -4% -6% -12%
Water (cooling) Kg SO2 eq. 49001.7 48021.7 47041.7 46061.7 43121.7
% change with BC 0% -2% -4% -6% -12%
Waste, non-haz./ landfill
Kg SO2 eq. 22249.4 21823.3 21397.2 20971.1 19692.9
% change with BC 0% -2% -4% -6% -11%
Waste, hazardous/ incinerated
Kg SO2 eq. 427.1 418.6 410.1 401.7 376.3
% change with BC 0% -2% -4% -6% -12%
Greenhouse Gases in GWP100
Kg SO2 eq. 803.2 787.2 771.1 755.1 707.0
% change with BC 0% -2% -4% -6% -12%
Acidification, emissions
Kg SO2 eq. 4744.2 4649.6 4554.9 4460.3 4176.4
% change with BC 0% -2% -4% -6% -12%
Volatile Organic Compounds (VOC)
kg 7.0 6.9 6.7 6.6 6.2
% change with BC 0% -2% -4% -6% -12%
Persistent Organic Pollutants (POP)
μg i-Teq 126.0 123.6 121.2 118.8 111.6
% change with BC 0% -2% -4% -6% -11%
Heavy Metals to g Ni eq. 318.9 312.6 306.3 300.0 281.1
Task 7: Improvement Potential
22 |
Work on Preparatory studies for implementing measures of the Ecodesign Directive 2009/125/EC ENER Lot 28 – Pumps for private and public wastewater and for fluids with high solids content
Life-Cycle indicators per
unit Unit
Base-case 2
Option 1 Option 2 Option 3 Option 4
air % change with BC 0% -2% -4% -6% -12%
PAHs g Ni eq. 37.0 36.3 35.6 34.8 32.7
% change with BC 0% -2% -4% -6% -12%
Particulate Matter (PM, dust)
kg 115.8 113.8 111.7 109.7 103.7
% change with BC 0% -2% -3% -5% -10%
Heavy Metals to water
g Hg/20 119.7 117.3 115.0 112.6 105.5
% change with BC 0% -2% -4% -6% -12%
Eutrophication Kg PO4 0.6 0.6 0.6 0.6 0.5
% change with BC 0% -2% -4% -6% -11%
Life-cycle cost €
182,590.1 179,531.0 176,940.6 174,390.7 165,682.1
% change with BC 0% -2% -3% -4% -9%
Design improvement options
Option 1 (OP1)
Option 2 (OP2)
Option 3 (OP3)
Option 4
Pump/hydraulic improvements
Motor improvements VSD OP1+OP2+OP3
Task 7: Improvement potential
Work on Preparatory studies for implementing measures of the Ecodesign Directive 2009/125/EC ENER Lot 28 – Pumps for private and public wastewater and for fluids with high
solids content | 23
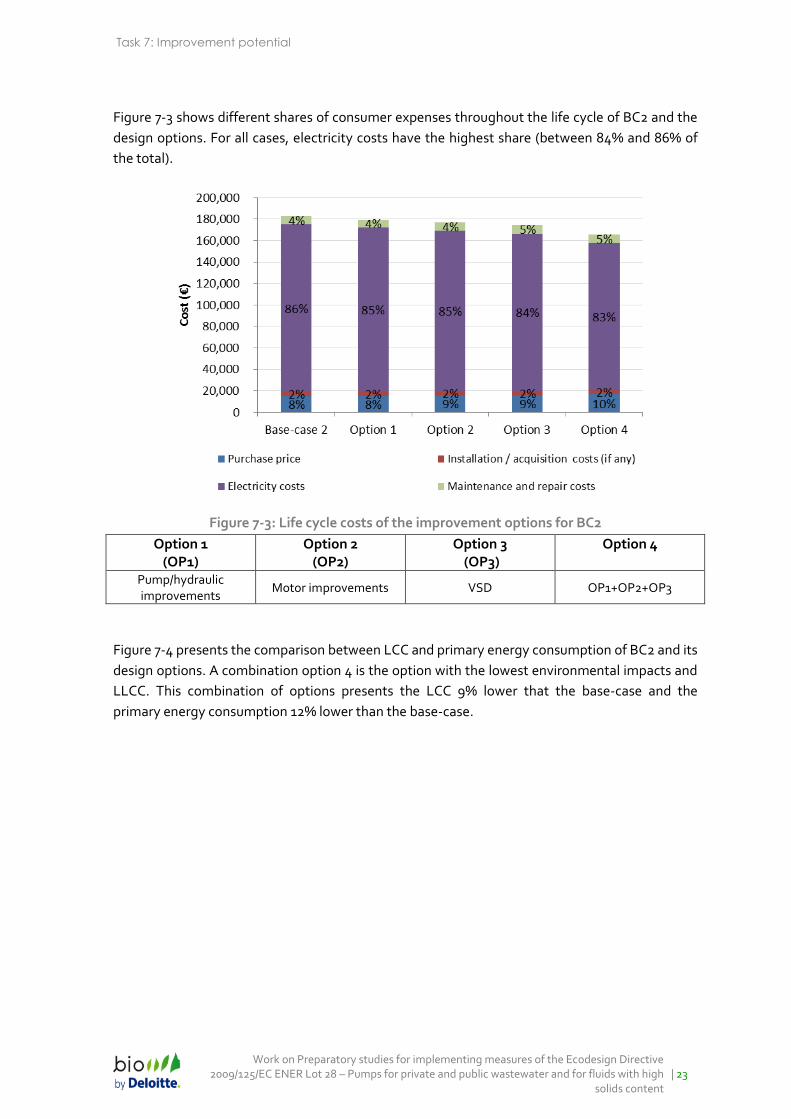
Figure 7-3 shows different shares of consumer expenses throughout the life cycle of BC2 and the
design options. For all cases, electricity costs have the highest share (between 84% and 86% of
the total).
Figure 7-3: Life cycle costs of the improvement options for BC2
Option 1 (OP1)
Option 2 (OP2)
Option 3 (OP3)
Option 4
Pump/hydraulic improvements
Motor improvements VSD OP1+OP2+OP3
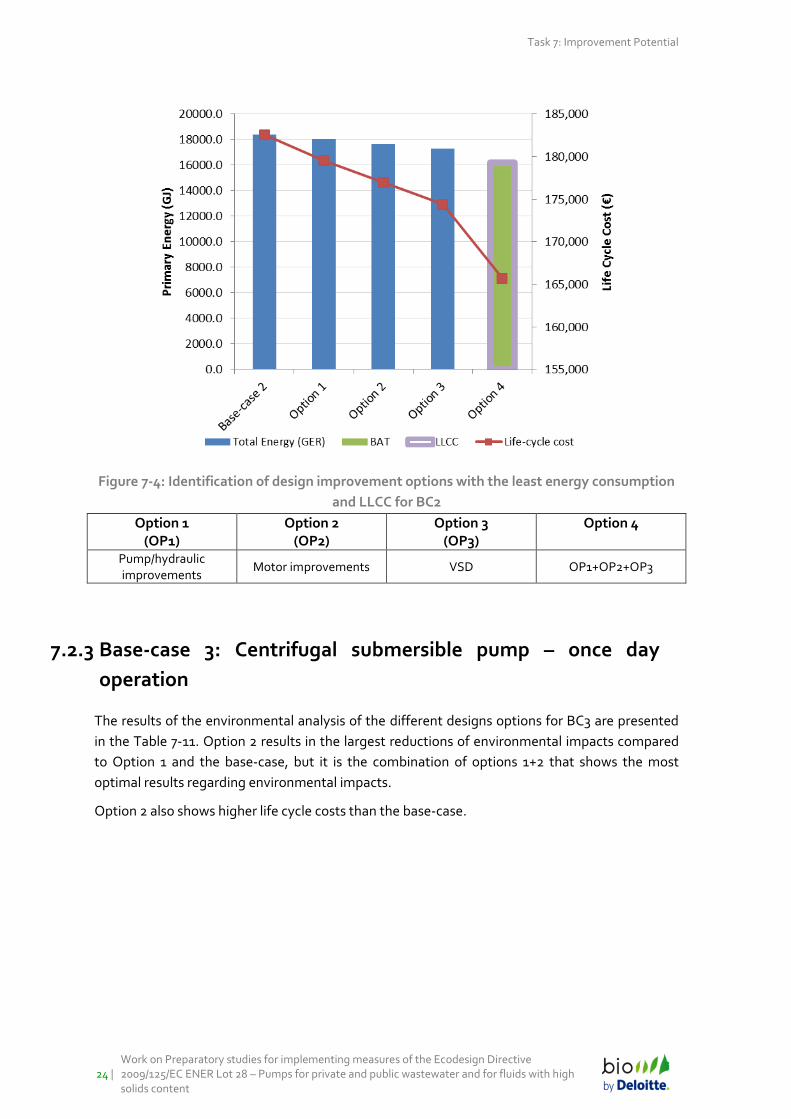
Figure 7-4 presents the comparison between LCC and primary energy consumption of BC2 and its
design options. A combination option 4 is the option with the lowest environmental impacts and
LLCC. This combination of options presents the LCC 9% lower that the base-case and the
primary energy consumption 12% lower than the base-case.
Task 7: Improvement Potential
24 |
Work on Preparatory studies for implementing measures of the Ecodesign Directive 2009/125/EC ENER Lot 28 – Pumps for private and public wastewater and for fluids with high solids content
Figure 7-4: Identification of design improvement options with the least energy consumption
and LLCC for BC2
Option 1 (OP1)
Option 2 (OP2)
Option 3 (OP3)
Option 4
Pump/hydraulic improvements
Motor improvements VSD OP1+OP2+OP3
7.2.3 Base-case 3: Centrifugal submersible pump – once day
operation
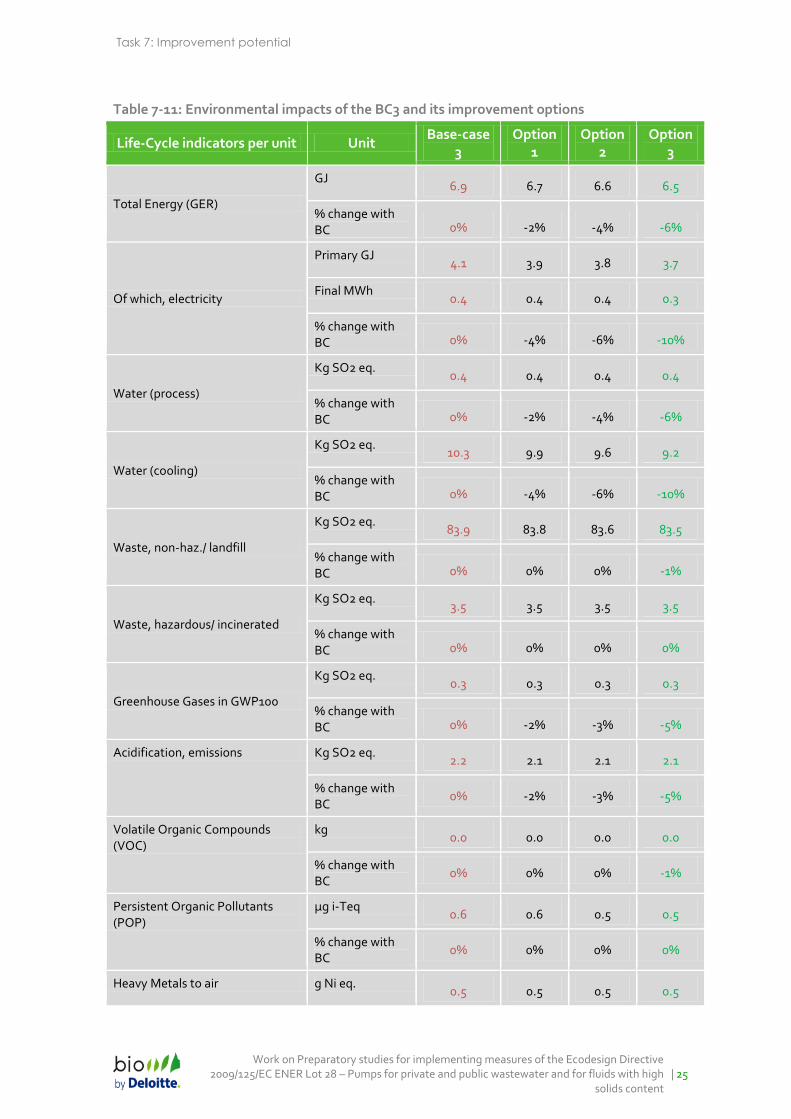
The results of the environmental analysis of the different designs options for BC3 are presented
in the Table 7-11. Option 2 results in the largest reductions of environmental impacts compared
to Option 1 and the base-case, but it is the combination of options 1+2 that shows the most
optimal results regarding environmental impacts.
Option 2 also shows higher life cycle costs than the base-case.
Task 7: Improvement potential
Work on Preparatory studies for implementing measures of the Ecodesign Directive 2009/125/EC ENER Lot 28 – Pumps for private and public wastewater and for fluids with high
solids content | 25
Table 7-11: Environmental impacts of the BC3 and its improvement options
Life-Cycle indicators per unit Unit Base-case
3 Option
1 Option
2 Option
3
Total Energy (GER)
GJ 6.9 6.7 6.6 6.5
% change with BC 0% -2% -4% -6%
Of which, electricity
Primary GJ 4.1 3.9 3.8 3.7
Final MWh 0.4 0.4 0.4 0.3
% change with BC 0% -4% -6% -10%
Water (process)
Kg SO2 eq. 0.4 0.4 0.4 0.4
% change with BC 0% -2% -4% -6%
Water (cooling)
Kg SO2 eq. 10.3 9.9 9.6 9.2
% change with BC 0% -4% -6% -10%
Waste, non-haz./ landfill
Kg SO2 eq. 83.9 83.8 83.6 83.5
% change with BC 0% 0% 0% -1%
Waste, hazardous/ incinerated
Kg SO2 eq. 3.5 3.5 3.5 3.5
% change with BC 0% 0% 0% 0%
Greenhouse Gases in GWP100
Kg SO2 eq. 0.3 0.3 0.3 0.3
% change with BC 0% -2% -3% -5%
Acidification, emissions Kg SO2 eq. 2.2 2.1 2.1 2.1
% change with BC
0% -2% -3% -5%
Volatile Organic Compounds (VOC)
kg 0.0 0.0 0.0 0.0
% change with BC
0% 0% 0% -1%
Persistent Organic Pollutants (POP)
μg i-Teq 0.6 0.6 0.5 0.5
% change with BC
0% 0% 0% 0%
Heavy Metals to air g Ni eq. 0.5 0.5 0.5 0.5
Task 7: Improvement Potential
26 |
Work on Preparatory studies for implementing measures of the Ecodesign Directive 2009/125/EC ENER Lot 28 – Pumps for private and public wastewater and for fluids with high solids content
Life-Cycle indicators per unit Unit Base-case
3 Option
1 Option
2 Option
3
% change with BC
0% -1% -1% -1%
PAHs g Ni eq. 0.1 0.1 0.1 0.1
% change with BC
0% 0% -1% -1%
Particulate Matter (PM, dust) kg 3.6 3.6 3.6 3.6
% change with BC
0% 0% 0% 0%
Heavy Metals to water g Hg/20 0.2 0.2 0.2 0.2
% change with BC
0% -1% -1% -2%
Eutrophication Kg PO4 0.0 0.0 0.0 0.0
% change with BC
0% 0% 0% 0%
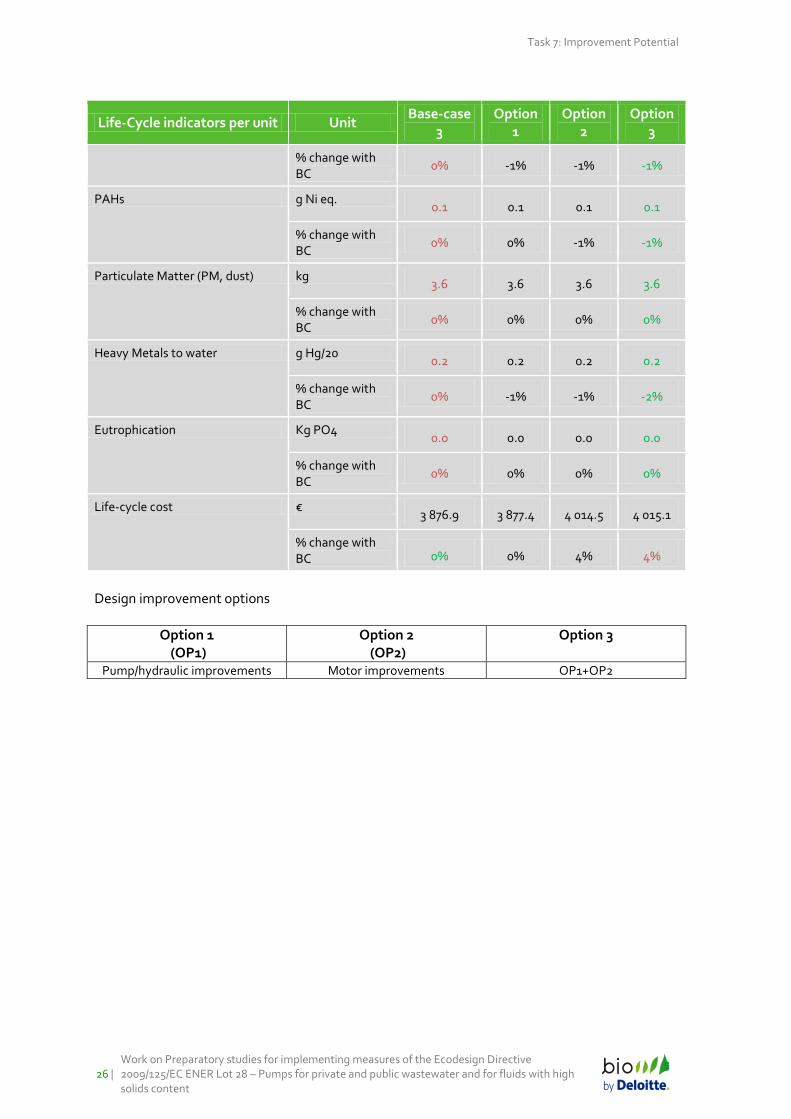
Life-cycle cost € 3 876.9 3 877.4 4 014.5 4 015.1
% change with BC 0% 0% 4% 4%
Design improvement options
Option 1 (OP1)
Option 2 (OP2)
Option 3
Pump/hydraulic improvements Motor improvements OP1+OP2

Task 7: Improvement potential
Work on Preparatory studies for implementing measures of the Ecodesign Directive 2009/125/EC ENER Lot 28 – Pumps for private and public wastewater and for fluids with high
solids content | 27
Figure 7-5 shows the share of different life cycle costs throughout the life cycle of BC3 and the
design options. For all cases, the purchase price has the highest share (42%-45% of the total).
The installation and acquisition costs represent the second largest share of the LCC. The
electricity costs are very low (1%of total) compared to the purchasing and installation costs.
Figure 7-5: Life cycle costs of the improvement options for BC3
Option 1 (OP1)
Option 2 (OP2)
Option 3
Pump/hydraulic improvements Motor improvements OP1+OP2
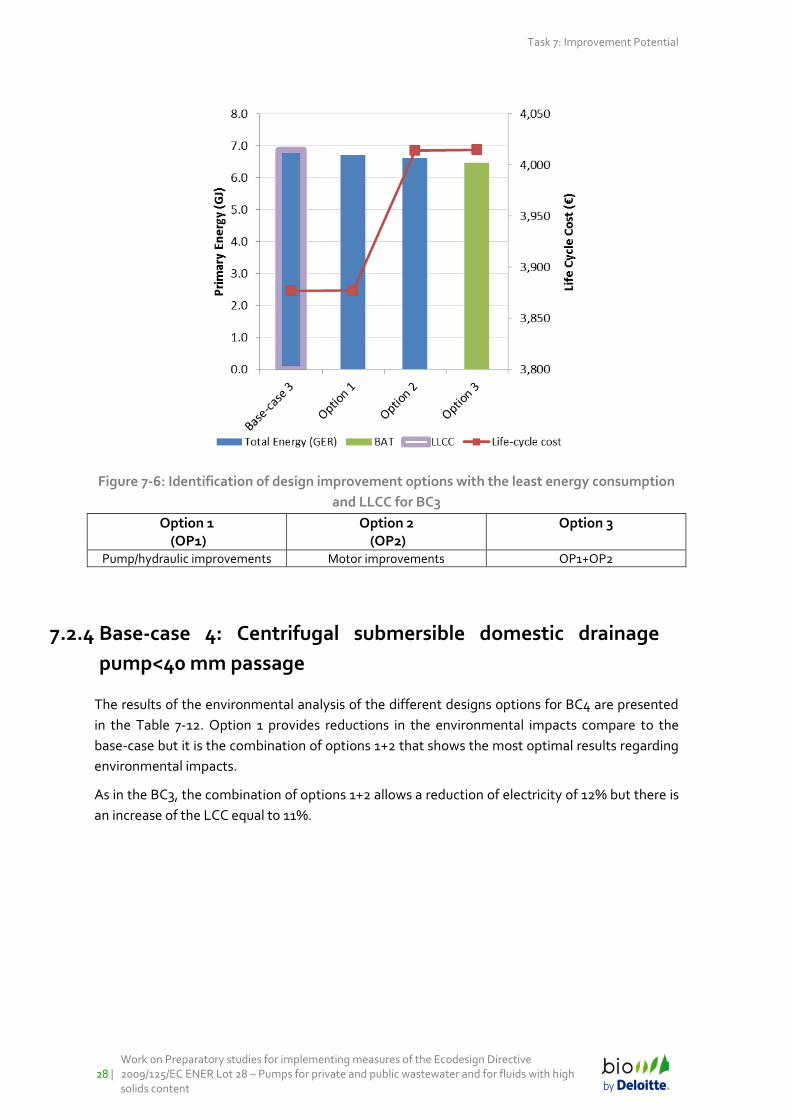
Figure 7-6 presents the comparison between LCC and the primary energy consumption for BC3
and the design options. For this base-case, the combination of options 1+2 is the BAT, achieving
10.6% energy savings compared to the base-case. However, it has an increase of 4% in life cycle
cost making the base-case the option with the LLCC.
Task 7: Improvement Potential
28 |
Work on Preparatory studies for implementing measures of the Ecodesign Directive 2009/125/EC ENER Lot 28 – Pumps for private and public wastewater and for fluids with high solids content
Figure 7-6: Identification of design improvement options with the least energy consumption
and LLCC for BC3
Option 1 (OP1)
Option 2 (OP2)
Option 3
Pump/hydraulic improvements Motor improvements OP1+OP2
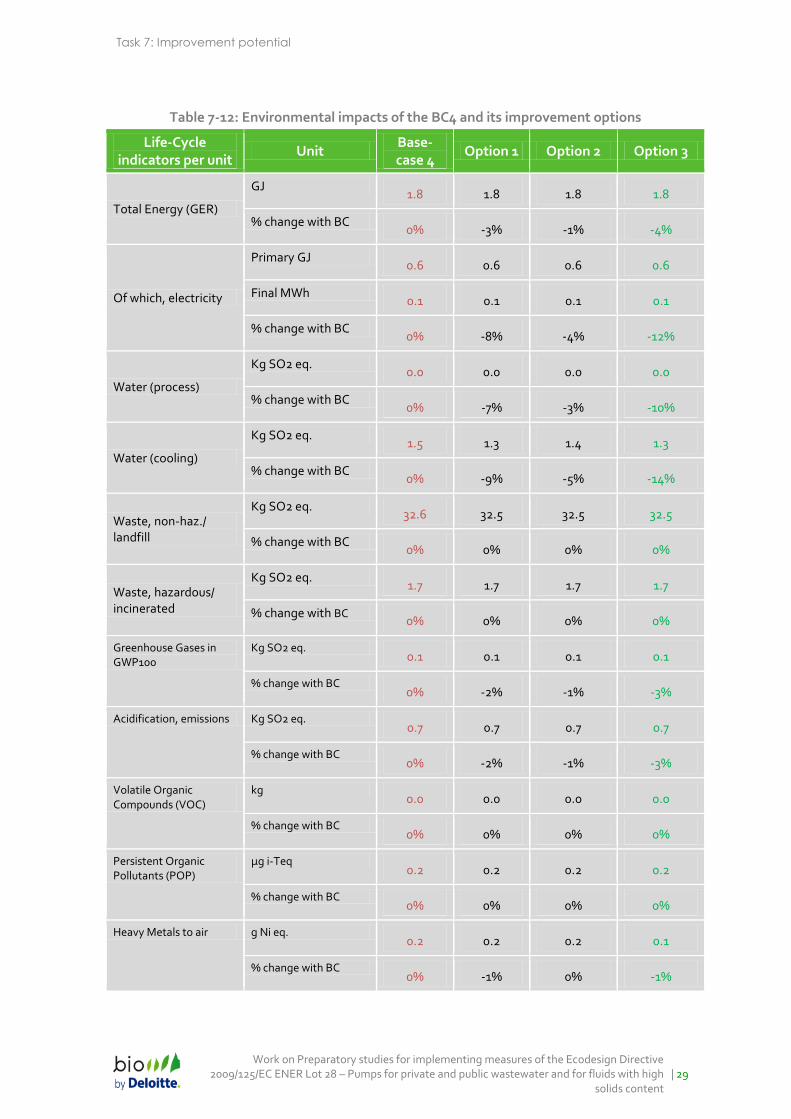
7.2.4 Base-case 4: Centrifugal submersible domestic drainage
pump<40 mm passage
The results of the environmental analysis of the different designs options for BC4 are presented
in the Table 7-12. Option 1 provides reductions in the environmental impacts compare to the
base-case but it is the combination of options 1+2 that shows the most optimal results regarding
environmental impacts.
As in the BC3, the combination of options 1+2 allows a reduction of electricity of 12% but there is
an increase of the LCC equal to 11%.
Task 7: Improvement potential
Work on Preparatory studies for implementing measures of the Ecodesign Directive 2009/125/EC ENER Lot 28 – Pumps for private and public wastewater and for fluids with high
solids content | 29
Table 7-12: Environmental impacts of the BC4 and its improvement options
Life-Cycle indicators per unit
Unit Base-case 4
Option 1 Option 2 Option 3
Total Energy (GER)
GJ 1.8 1.8 1.8 1.8
% change with BC 0% -3% -1% -4%
Of which, electricity
Primary GJ 0.6 0.6 0.6 0.6
Final MWh 0.1 0.1 0.1 0.1
% change with BC 0% -8% -4% -12%
Water (process)
Kg SO2 eq. 0.0 0.0 0.0 0.0
% change with BC 0% -7% -3% -10%
Water (cooling)
Kg SO2 eq. 1.5 1.3 1.4 1.3
% change with BC 0% -9% -5% -14%
Waste, non-haz./ landfill
Kg SO2 eq. 32.6 32.5 32.5 32.5
% change with BC 0% 0% 0% 0%
Waste, hazardous/ incinerated
Kg SO2 eq. 1.7 1.7 1.7 1.7
% change with BC 0% 0% 0% 0%
Greenhouse Gases in GWP100
Kg SO2 eq. 0.1 0.1 0.1 0.1
% change with BC 0% -2% -1% -3%
Acidification, emissions Kg SO2 eq. 0.7 0.7 0.7 0.7
% change with BC 0% -2% -1% -3%
Volatile Organic Compounds (VOC)
kg 0.0 0.0 0.0 0.0
% change with BC 0% 0% 0% 0%
Persistent Organic Pollutants (POP)
μg i-Teq 0.2 0.2 0.2 0.2
% change with BC 0% 0% 0% 0%
Heavy Metals to air g Ni eq. 0.2 0.2 0.2 0.1
% change with BC 0% -1% 0% -1%

Task 7: Improvement Potential
30 |
Work on Preparatory studies for implementing measures of the Ecodesign Directive 2009/125/EC ENER Lot 28 – Pumps for private and public wastewater and for fluids with high solids content
Life-Cycle indicators per unit
Unit Base-case 4
Option 1 Option 2 Option 3
PAHs
g Ni eq. 0.1 0.1 0.1 0.1
% change with BC 0% 0% 0% 0%
Particulate Matter (PM, dust)
kg 1.9 1.9 1.9 1.9
% change with BC 0% 0% 0% 0%
Heavy Metals to water
g Hg/20 0.0 0.0 0.0 0.0
% change with BC 0% -1% 0% -1%
Eutrophication Kg PO4 0.0 0.0 0.0 0.0
% change with BC 0% 0% 0% 0%
Life-cycle cost € 454.6 458.4 499.4 503.1
% change with BC 0% 1% 10% 11%
Design improvement options
Option 1 (OP1)
Option 2 (OP2)
Option 3
Pump/hydraulic improvements Motor improvements OP1+OP2
Task 7: Improvement potential
Work on Preparatory studies for implementing measures of the Ecodesign Directive 2009/125/EC ENER Lot 28 – Pumps for private and public wastewater and for fluids with high
solids content | 31
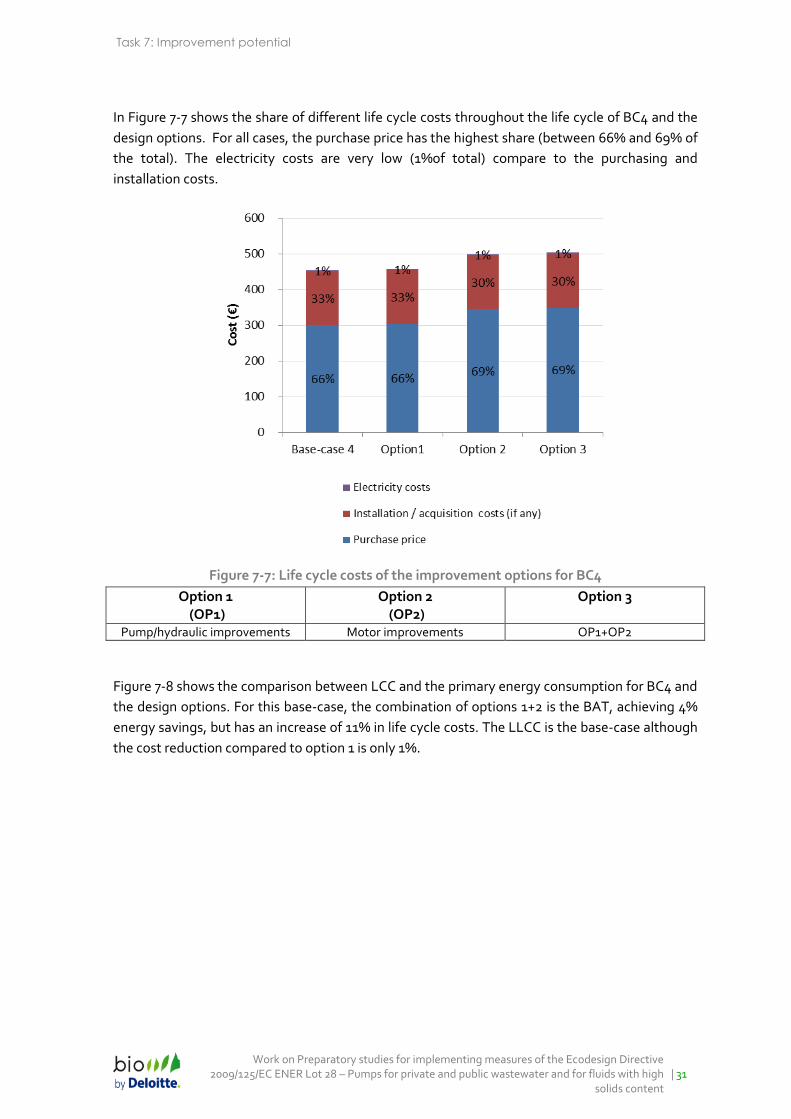
In Figure 7-7 shows the share of different life cycle costs throughout the life cycle of BC4 and the
design options. For all cases, the purchase price has the highest share (between 66% and 69% of
the total). The electricity costs are very low (1%of total) compare to the purchasing and
installation costs.
Figure 7-7: Life cycle costs of the improvement options for BC4
Option 1 (OP1)
Option 2 (OP2)
Option 3
Pump/hydraulic improvements Motor improvements OP1+OP2
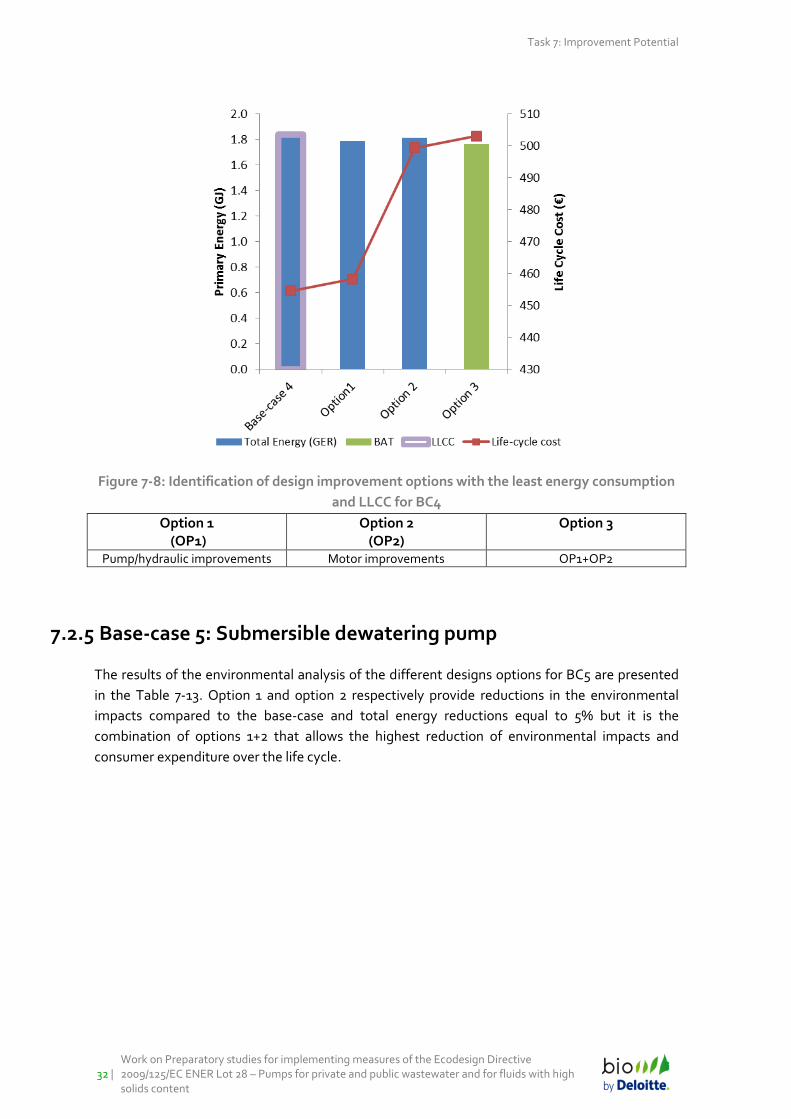
Figure 7-8 shows the comparison between LCC and the primary energy consumption for BC4 and
the design options. For this base-case, the combination of options 1+2 is the BAT, achieving 4%
energy savings, but has an increase of 11% in life cycle costs. The LLCC is the base-case although
the cost reduction compared to option 1 is only 1%.
Task 7: Improvement Potential
32 |
Work on Preparatory studies for implementing measures of the Ecodesign Directive 2009/125/EC ENER Lot 28 – Pumps for private and public wastewater and for fluids with high solids content
Figure 7-8: Identification of design improvement options with the least energy consumption
and LLCC for BC4
Option 1 (OP1)
Option 2 (OP2)
Option 3
Pump/hydraulic improvements Motor improvements OP1+OP2
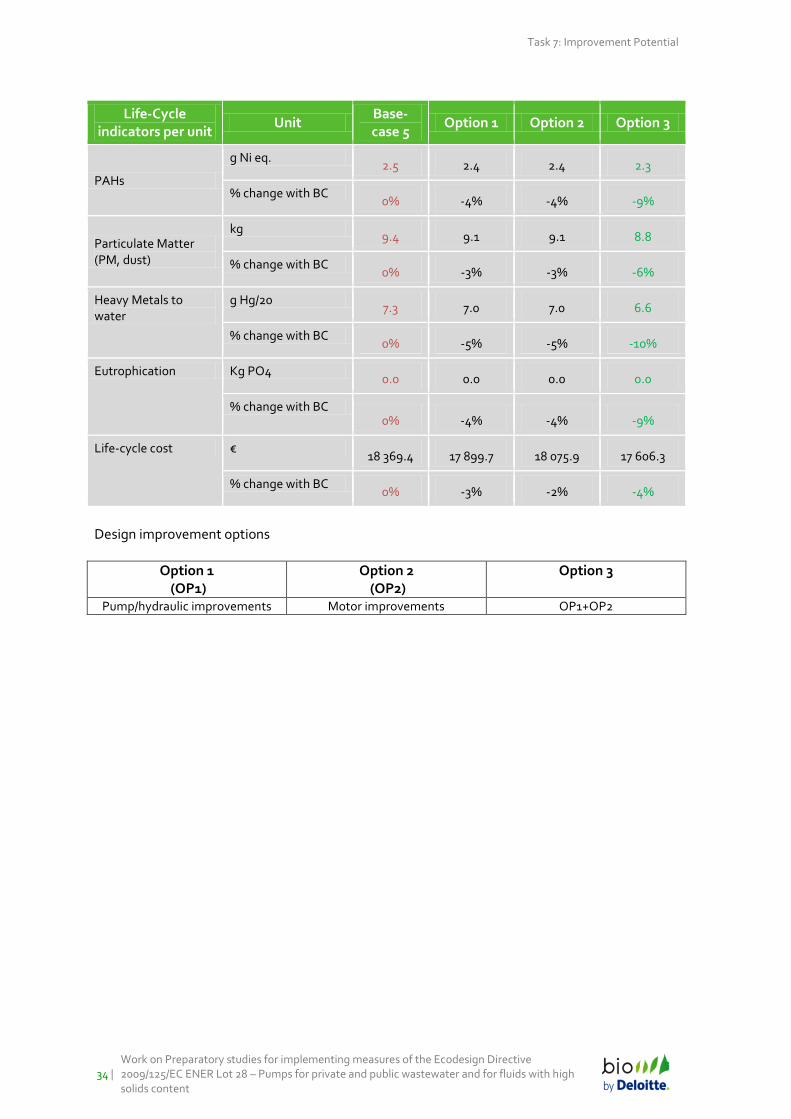
7.2.5 Base-case 5: Submersible dewatering pump
The results of the environmental analysis of the different designs options for BC5 are presented
in the Table 7-13. Option 1 and option 2 respectively provide reductions in the environmental
impacts compared to the base-case and total energy reductions equal to 5% but it is the
combination of options 1+2 that allows the highest reduction of environmental impacts and
consumer expenditure over the life cycle.

Task 7: Improvement potential
Work on Preparatory studies for implementing measures of the Ecodesign Directive 2009/125/EC ENER Lot 28 – Pumps for private and public wastewater and for fluids with high
solids content | 33
Table 7-13: Environmental impacts of the BC5 and its improvement options
Life-Cycle indicators per unit
Unit Base-case 5
Option 1 Option 2 Option 3
Total Energy (GER)
GJ 1 107.1 1 051.9 1 051.9 996.8
% change with BC 0% -5% -5% -10%
Of which, electricity
Primary GJ 1 102.8 1 047.7 1 047.7 992.6
Final MWh 105.0 99.8 99.8 94.5
% change with BC 0% -5% -5% -10%
Water (process)
Kg SO2 eq. 73.5 69.9 69.9 66.2
% change with BC 0% -5% -5% -10%
Water (cooling)
Kg SO2 eq. 2 940.1 2 793.1 2 793.1 2 646.1
% change with BC 0% -5% -5% -10%
Waste, non-haz./ landfill
Kg SO2 eq. 1 547.8 1 483.9 1 483.9 1 420.0
% change with BC 0% -4% -4% -8%
Waste, hazardous/ incinerated
Kg SO2 eq. 25.9 24.6 24.6 23.3
% change with BC 0% -5% -5% -10%
Greenhouse Gases in GWP100
Kg SO2 eq. 48.4 46.0 46.0 43.6
% change with BC 0% -5% -5% -10%
Acidification, emissions
Kg SO2 eq. 287.9 273.7 273.7 259.5
% change with BC 0% -5% -5% -10%
Volatile Organic Compounds (VOC)
kg 0.4 0.4 0.4 0.4
% change with BC 0% -5% -5% -9%
Persistent Organic Pollutants (POP)
μg i-Teq 8.2 7.8 7.8 7.5
% change with BC 0% -4% -4% -9%
Heavy Metals to air g Ni eq. 19.8 18.8 18.8 17.9
% change with BC 0% -5% -5% -10%
Task 7: Improvement Potential
34 |
Work on Preparatory studies for implementing measures of the Ecodesign Directive 2009/125/EC ENER Lot 28 – Pumps for private and public wastewater and for fluids with high solids content
Life-Cycle indicators per unit
Unit Base-case 5
Option 1 Option 2 Option 3
PAHs
g Ni eq. 2.5 2.4 2.4 2.3
% change with BC 0% -4% -4% -9%
Particulate Matter (PM, dust)
kg 9.4 9.1 9.1 8.8
% change with BC 0% -3% -3% -6%
Heavy Metals to water
g Hg/20 7.3 7.0 7.0 6.6
% change with BC 0% -5% -5% -10%
Eutrophication Kg PO4 0.0 0.0 0.0 0.0
% change with BC 0% -4% -4% -9%
Life-cycle cost € 18 369.4 17 899.7 18 075.9 17 606.3
% change with BC 0% -3% -2% -4%
Design improvement options
Option 1 (OP1)
Option 2 (OP2)
Option 3
Pump/hydraulic improvements Motor improvements OP1+OP2
Task 7: Improvement potential
Work on Preparatory studies for implementing measures of the Ecodesign Directive 2009/125/EC ENER Lot 28 – Pumps for private and public wastewater and for fluids with high
solids content | 35
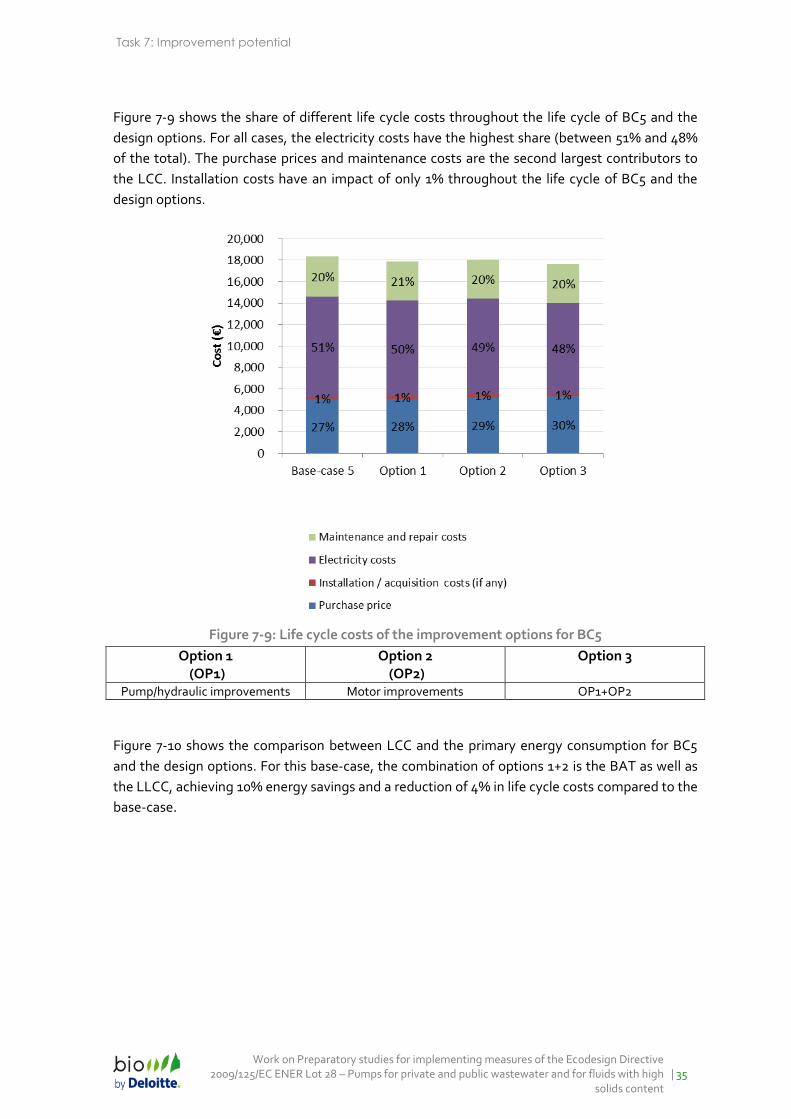
Figure 7-9 shows the share of different life cycle costs throughout the life cycle of BC5 and the
design options. For all cases, the electricity costs have the highest share (between 51% and 48%
of the total). The purchase prices and maintenance costs are the second largest contributors to
the LCC. Installation costs have an impact of only 1% throughout the life cycle of BC5 and the
design options.
Figure 7-9: Life cycle costs of the improvement options for BC5
Option 1 (OP1)
Option 2 (OP2)
Option 3
Pump/hydraulic improvements Motor improvements OP1+OP2
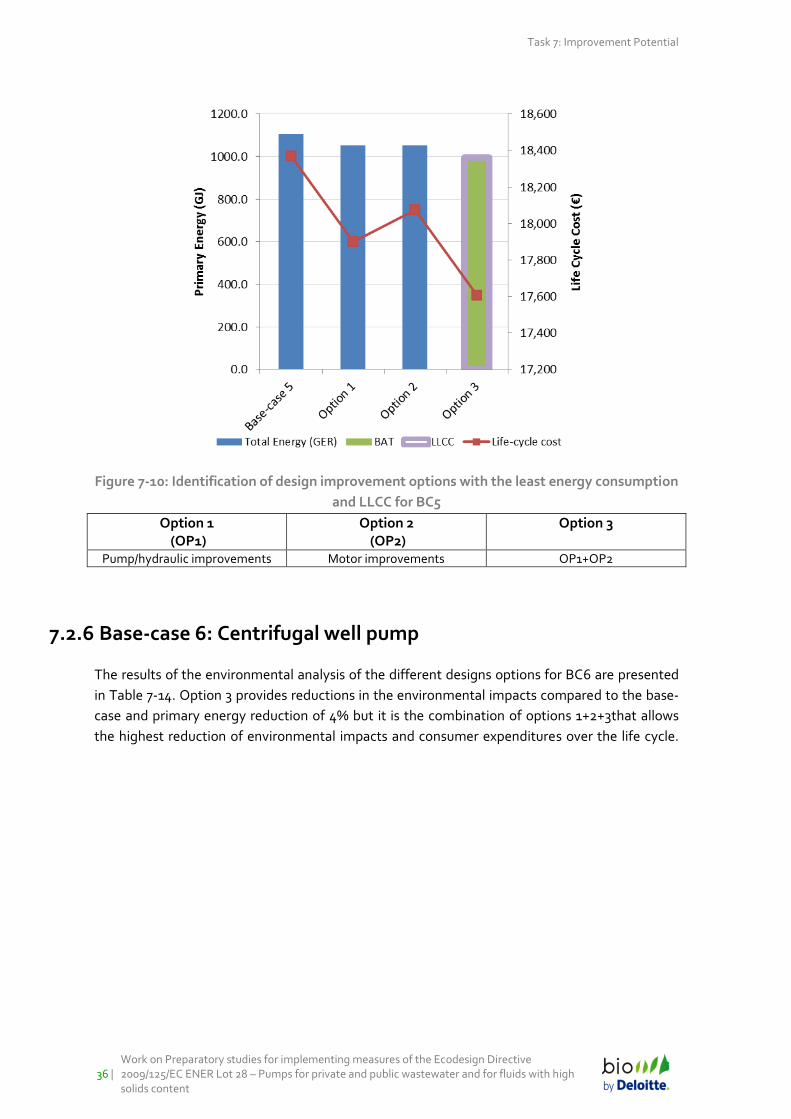
Figure 7-10 shows the comparison between LCC and the primary energy consumption for BC5
and the design options. For this base-case, the combination of options 1+2 is the BAT as well as
the LLCC, achieving 10% energy savings and a reduction of 4% in life cycle costs compared to the
base-case.
Task 7: Improvement Potential
36 |
Work on Preparatory studies for implementing measures of the Ecodesign Directive 2009/125/EC ENER Lot 28 – Pumps for private and public wastewater and for fluids with high solids content
Figure 7-10: Identification of design improvement options with the least energy consumption
and LLCC for BC5
Option 1 (OP1)
Option 2 (OP2)
Option 3
Pump/hydraulic improvements Motor improvements OP1+OP2
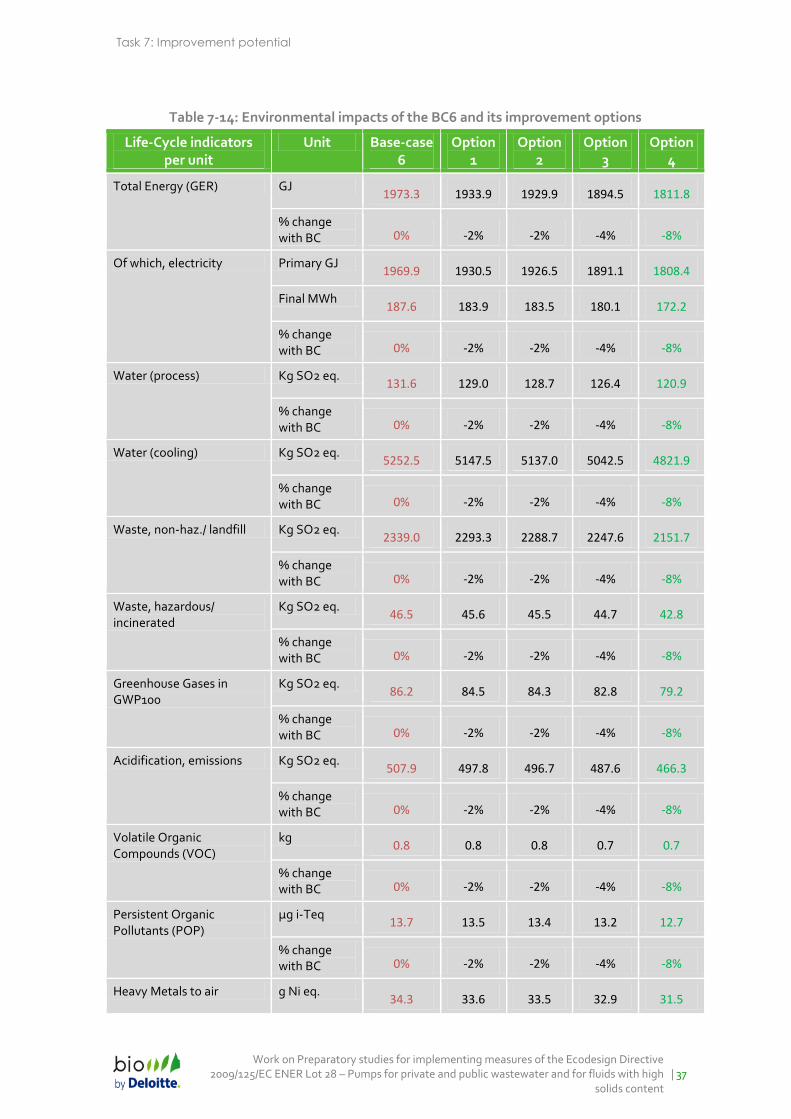
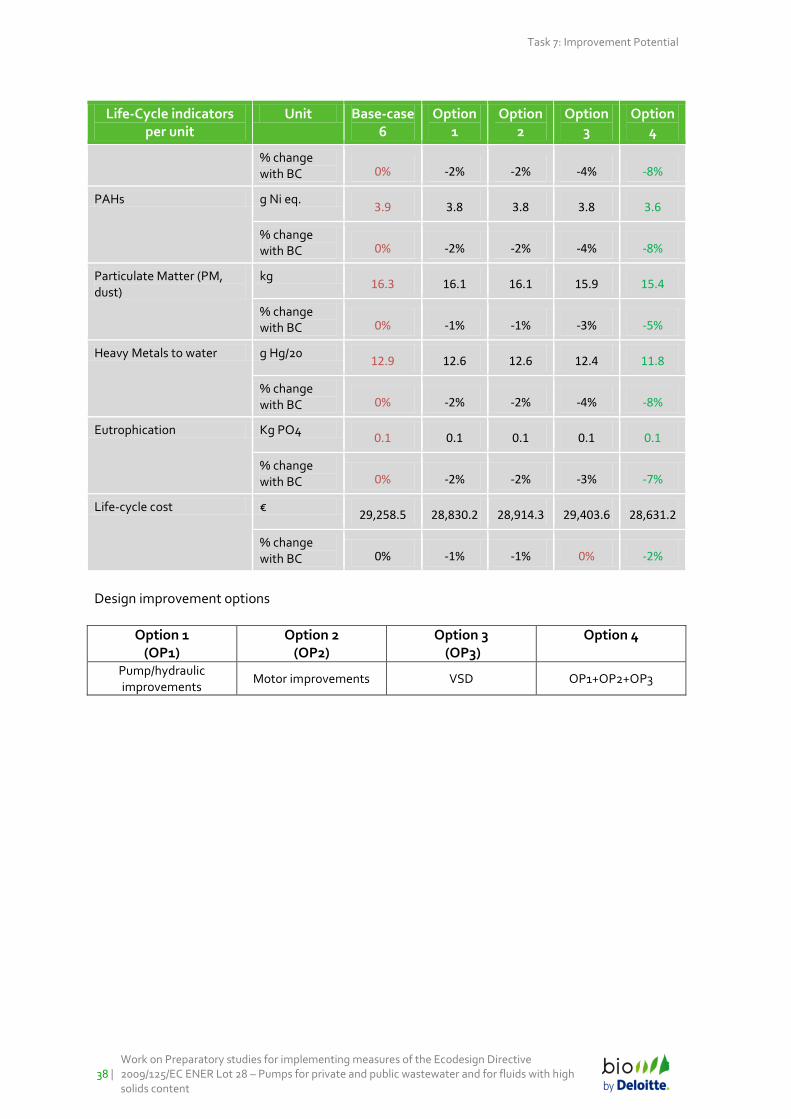
7.2.6 Base-case 6: Centrifugal well pump
The results of the environmental analysis of the different designs options for BC6 are presented
in Table 7-14. Option 3 provides reductions in the environmental impacts compared to the base-
case and primary energy reduction of 4% but it is the combination of options 1+2+3that allows
the highest reduction of environmental impacts and consumer expenditures over the life cycle.
Task 7: Improvement potential
Work on Preparatory studies for implementing measures of the Ecodesign Directive 2009/125/EC ENER Lot 28 – Pumps for private and public wastewater and for fluids with high
solids content | 37
Table 7-14: Environmental impacts of the BC6 and its improvement options
Life-Cycle indicators per unit
Unit Base-case 6
Option 1
Option 2
Option 3
Option 4
Total Energy (GER) GJ 1973.3 1933.9 1929.9 1894.5 1811.8
% change with BC 0% -2% -2% -4% -8%
Of which, electricity Primary GJ 1969.9 1930.5 1926.5 1891.1 1808.4
Final MWh 187.6 183.9 183.5 180.1 172.2
% change with BC 0% -2% -2% -4% -8%
Water (process) Kg SO2 eq. 131.6 129.0 128.7 126.4 120.9
% change with BC 0% -2% -2% -4% -8%
Water (cooling) Kg SO2 eq. 5252.5 5147.5 5137.0 5042.5 4821.9
% change with BC 0% -2% -2% -4% -8%
Waste, non-haz./ landfill Kg SO2 eq. 2339.0 2293.3 2288.7 2247.6 2151.7
% change with BC 0% -2% -2% -4% -8%
Waste, hazardous/ incinerated
Kg SO2 eq. 46.5 45.6 45.5 44.7 42.8
% change with BC 0% -2% -2% -4% -8%
Greenhouse Gases in GWP100
Kg SO2 eq. 86.2 84.5 84.3 82.8 79.2
% change with BC 0% -2% -2% -4% -8%
Acidification, emissions Kg SO2 eq. 507.9 497.8 496.7 487.6 466.3
% change with BC 0% -2% -2% -4% -8%
Volatile Organic Compounds (VOC)
kg 0.8 0.8 0.8 0.7 0.7
% change with BC 0% -2% -2% -4% -8%
Persistent Organic Pollutants (POP)
μg i-Teq 13.7 13.5 13.4 13.2 12.7
% change with BC 0% -2% -2% -4% -8%
Heavy Metals to air g Ni eq. 34.3 33.6 33.5 32.9 31.5
Task 7: Improvement Potential
38 |
Work on Preparatory studies for implementing measures of the Ecodesign Directive 2009/125/EC ENER Lot 28 – Pumps for private and public wastewater and for fluids with high solids content
Life-Cycle indicators per unit
Unit Base-case 6
Option 1
Option 2
Option 3
Option 4
% change with BC 0% -2% -2% -4% -8%
PAHs g Ni eq. 3.9 3.8 3.8 3.8 3.6
% change with BC 0% -2% -2% -4% -8%
Particulate Matter (PM, dust)
kg 16.3 16.1 16.1 15.9 15.4
% change with BC 0% -1% -1% -3% -5%
Heavy Metals to water g Hg/20 12.9 12.6 12.6 12.4 11.8
% change with BC 0% -2% -2% -4% -8%
Eutrophication Kg PO4 0.1 0.1 0.1 0.1 0.1
% change with BC 0% -2% -2% -3% -7%
Life-cycle cost € 29,258.5 28,830.2 28,914.3 29,403.6 28,631.2
% change with BC 0% -1% -1% 0% -2%
Design improvement options
Option 1 (OP1)
Option 2 (OP2)
Option 3 (OP3)
Option 4
Pump/hydraulic improvements
Motor improvements VSD OP1+OP2+OP3
Task 7: Improvement potential
Work on Preparatory studies for implementing measures of the Ecodesign Directive 2009/125/EC ENER Lot 28 – Pumps for private and public wastewater and for fluids with high
solids content | 39
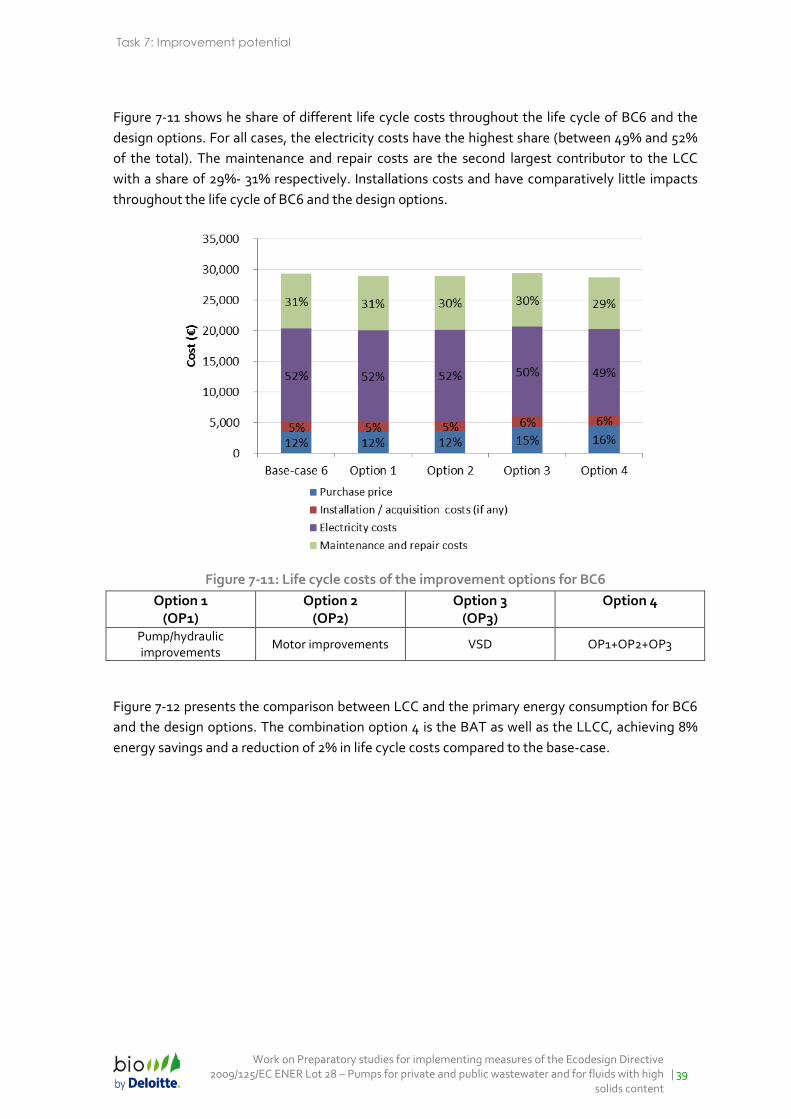
Figure 7-11 shows he share of different life cycle costs throughout the life cycle of BC6 and the
design options. For all cases, the electricity costs have the highest share (between 49% and 52%
of the total). The maintenance and repair costs are the second largest contributor to the LCC
with a share of 29%- 31% respectively. Installations costs and have comparatively little impacts
throughout the life cycle of BC6 and the design options.
Figure 7-11: Life cycle costs of the improvement options for BC6
Option 1 (OP1)
Option 2 (OP2)
Option 3 (OP3)
Option 4
Pump/hydraulic improvements
Motor improvements VSD OP1+OP2+OP3
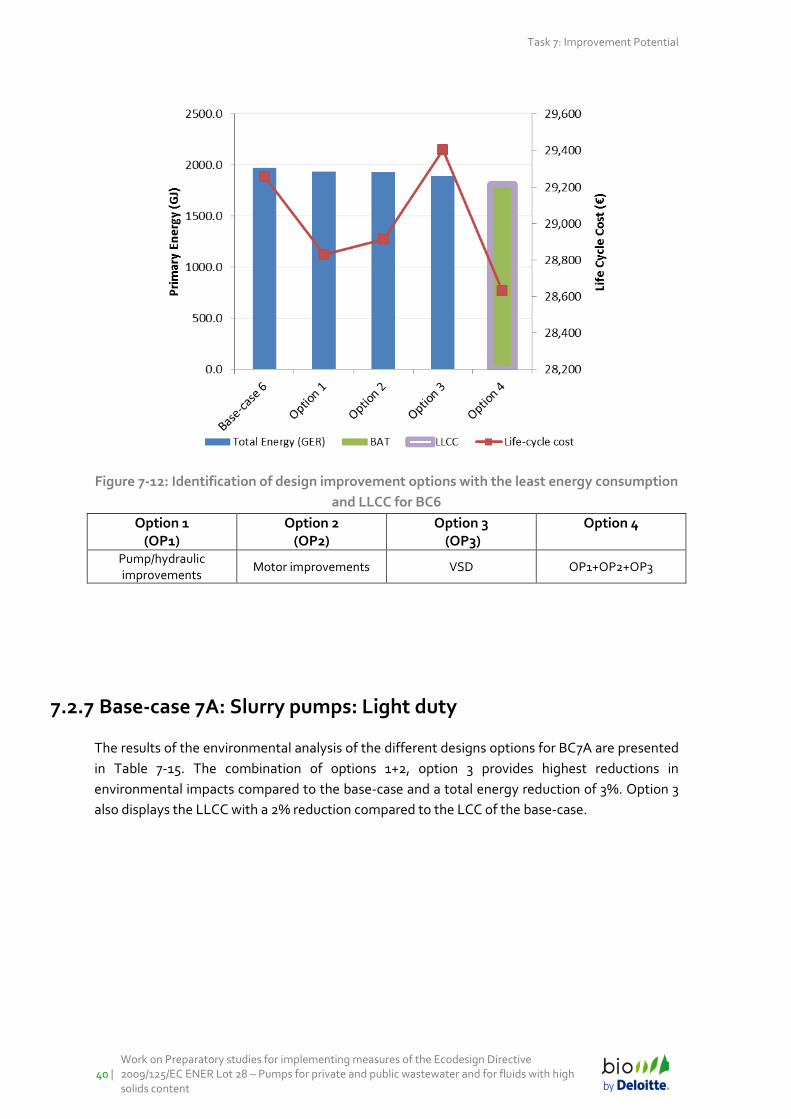
Figure 7-12 presents the comparison between LCC and the primary energy consumption for BC6
and the design options. The combination option 4 is the BAT as well as the LLCC, achieving 8%
energy savings and a reduction of 2% in life cycle costs compared to the base-case.
Task 7: Improvement Potential
40 |
Work on Preparatory studies for implementing measures of the Ecodesign Directive 2009/125/EC ENER Lot 28 – Pumps for private and public wastewater and for fluids with high solids content
Figure 7-12: Identification of design improvement options with the least energy consumption
and LLCC for BC6
Option 1 (OP1)
Option 2 (OP2)
Option 3 (OP3)
Option 4
Pump/hydraulic improvements
Motor improvements VSD OP1+OP2+OP3
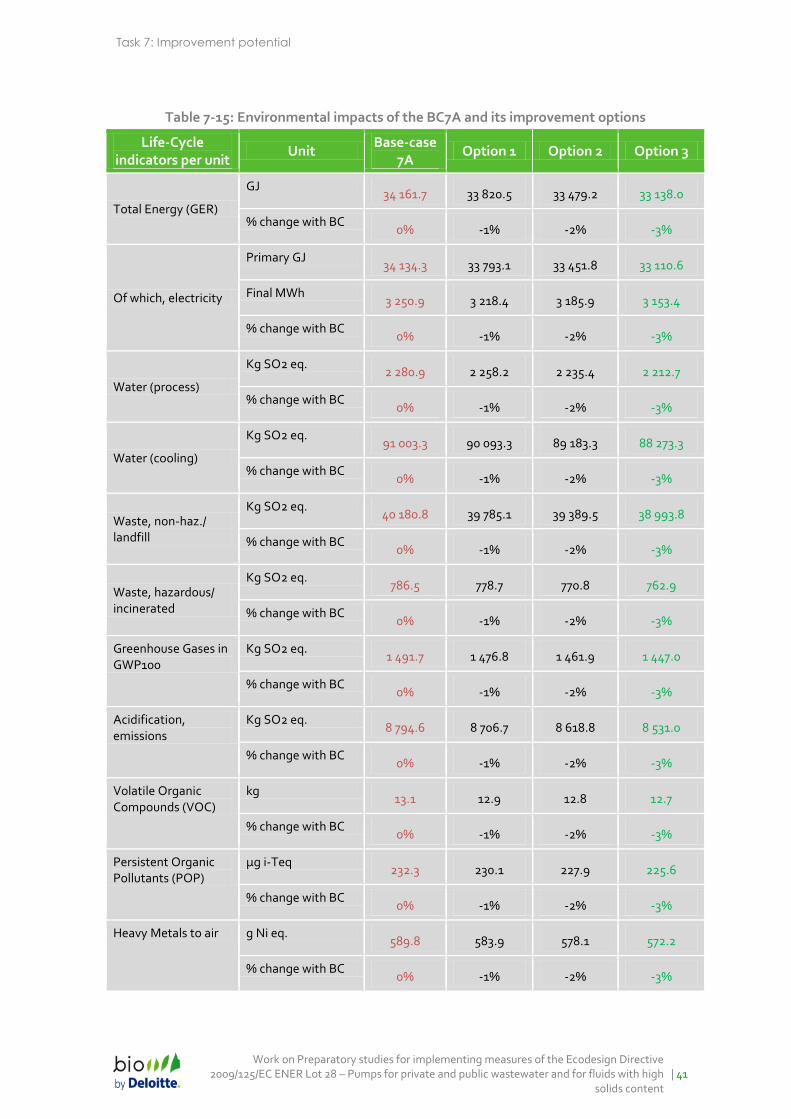
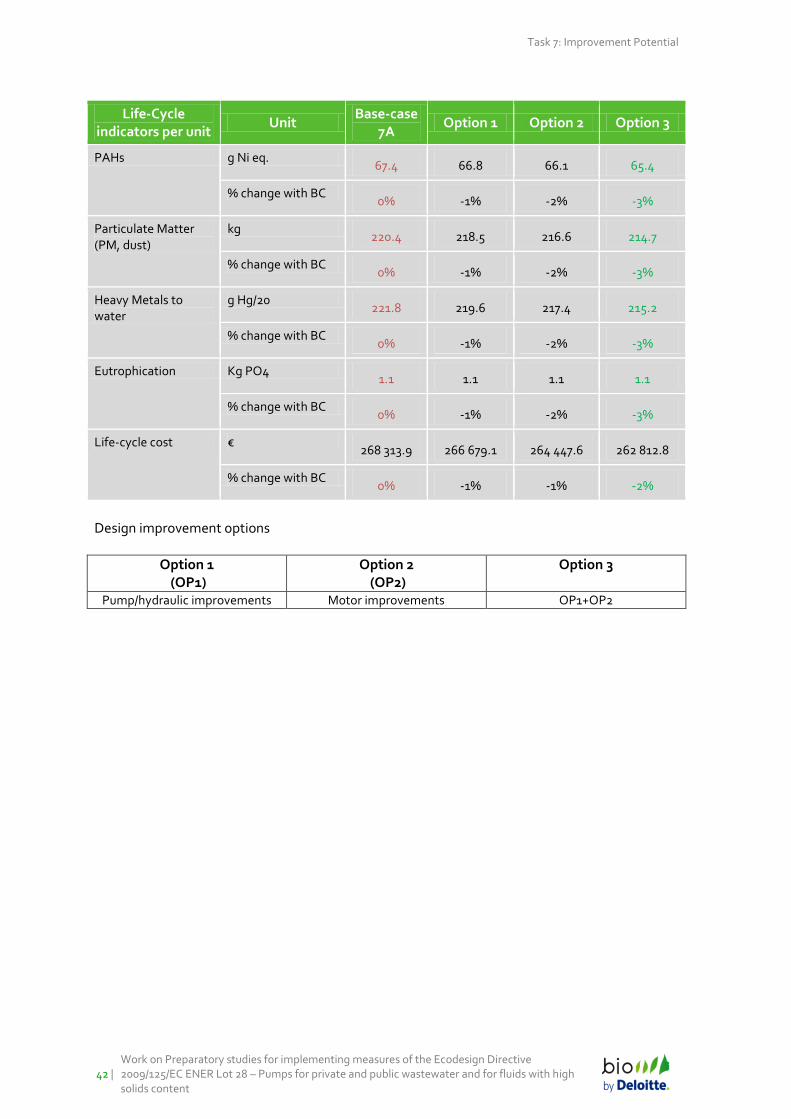
7.2.7 Base-case 7A: Slurry pumps: Light duty
The results of the environmental analysis of the different designs options for BC7A are presented
in Table 7-15. The combination of options 1+2, option 3 provides highest reductions in
environmental impacts compared to the base-case and a total energy reduction of 3%. Option 3
also displays the LLCC with a 2% reduction compared to the LCC of the base-case.
Task 7: Improvement potential
Work on Preparatory studies for implementing measures of the Ecodesign Directive 2009/125/EC ENER Lot 28 – Pumps for private and public wastewater and for fluids with high
solids content | 41
Table 7-15: Environmental impacts of the BC7A and its improvement options
Life-Cycle indicators per unit
Unit Base-case
7A Option 1 Option 2 Option 3
Total Energy (GER)
GJ 34 161.7 33 820.5 33 479.2 33 138.0
% change with BC 0% -1% -2% -3%
Of which, electricity
Primary GJ 34 134.3 33 793.1 33 451.8 33 110.6
Final MWh 3 250.9 3 218.4 3 185.9 3 153.4
% change with BC 0% -1% -2% -3%
Water (process)
Kg SO2 eq. 2 280.9 2 258.2 2 235.4 2 212.7
% change with BC 0% -1% -2% -3%
Water (cooling)
Kg SO2 eq. 91 003.3 90 093.3 89 183.3 88 273.3
% change with BC 0% -1% -2% -3%
Waste, non-haz./ landfill
Kg SO2 eq. 40 180.8 39 785.1 39 389.5 38 993.8
% change with BC 0% -1% -2% -3%
Waste, hazardous/ incinerated
Kg SO2 eq. 786.5 778.7 770.8 762.9
% change with BC 0% -1% -2% -3%
Greenhouse Gases in GWP100
Kg SO2 eq. 1 491.7 1 476.8 1 461.9 1 447.0
% change with BC 0% -1% -2% -3%
Acidification, emissions
Kg SO2 eq. 8 794.6 8 706.7 8 618.8 8 531.0
% change with BC 0% -1% -2% -3%
Volatile Organic Compounds (VOC)
kg 13.1 12.9 12.8 12.7
% change with BC 0% -1% -2% -3%
Persistent Organic Pollutants (POP)
μg i-Teq 232.3 230.1 227.9 225.6
% change with BC 0% -1% -2% -3%
Heavy Metals to air g Ni eq. 589.8 583.9 578.1 572.2
% change with BC 0% -1% -2% -3%
Task 7: Improvement Potential
42 |
Work on Preparatory studies for implementing measures of the Ecodesign Directive 2009/125/EC ENER Lot 28 – Pumps for private and public wastewater and for fluids with high solids content
Life-Cycle indicators per unit
Unit Base-case
7A Option 1 Option 2 Option 3
PAHs g Ni eq. 67.4 66.8 66.1 65.4
% change with BC 0% -1% -2% -3%
Particulate Matter (PM, dust)
kg 220.4 218.5 216.6 214.7
% change with BC 0% -1% -2% -3%
Heavy Metals to water
g Hg/20 221.8 219.6 217.4 215.2
% change with BC 0% -1% -2% -3%
Eutrophication Kg PO4 1.1 1.1 1.1 1.1
% change with BC 0% -1% -2% -3%
Life-cycle cost € 268 313.9 266 679.1 264 447.6 262 812.8
% change with BC 0% -1% -1% -2%
Design improvement options
Option 1 (OP1)
Option 2 (OP2)
Option 3
Pump/hydraulic improvements Motor improvements OP1+OP2
Task 7: Improvement potential
Work on Preparatory studies for implementing measures of the Ecodesign Directive 2009/125/EC ENER Lot 28 – Pumps for private and public wastewater and for fluids with high
solids content | 43
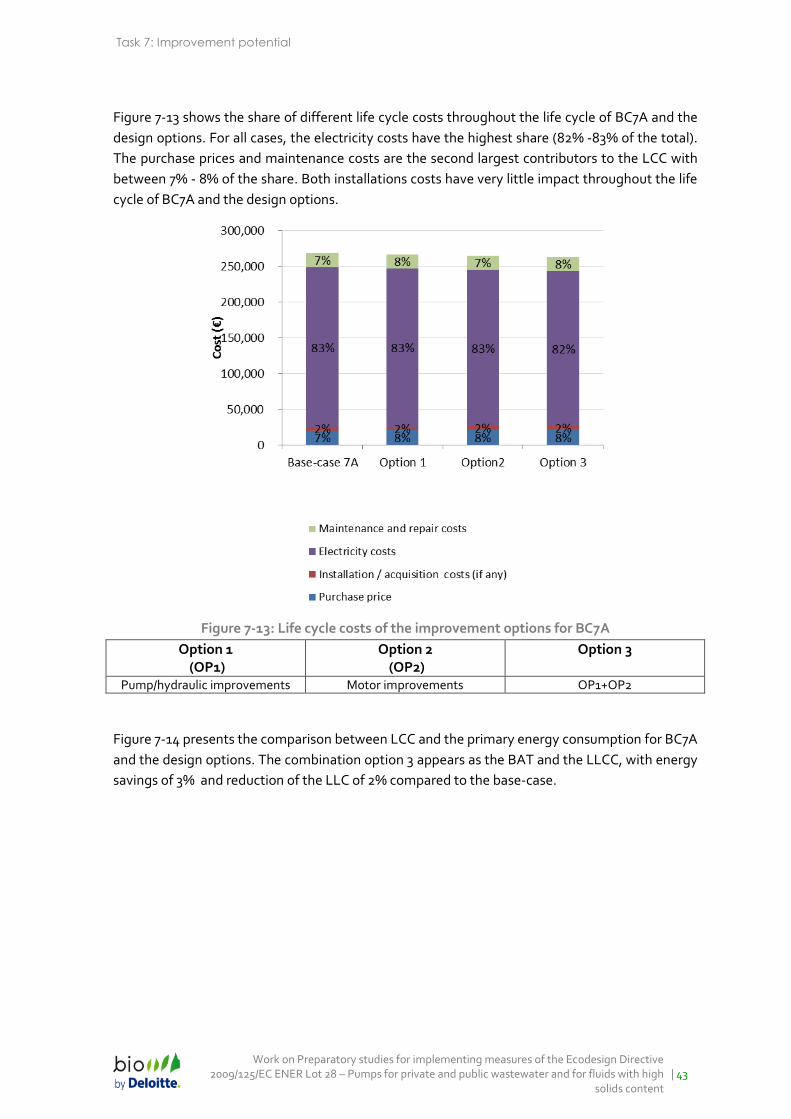
Figure 7-13 shows the share of different life cycle costs throughout the life cycle of BC7A and the
design options. For all cases, the electricity costs have the highest share (82% -83% of the total).
The purchase prices and maintenance costs are the second largest contributors to the LCC with
between 7% - 8% of the share. Both installations costs have very little impact throughout the life
cycle of BC7A and the design options.
Figure 7-13: Life cycle costs of the improvement options for BC7A
Option 1 (OP1)
Option 2 (OP2)
Option 3
Pump/hydraulic improvements Motor improvements OP1+OP2
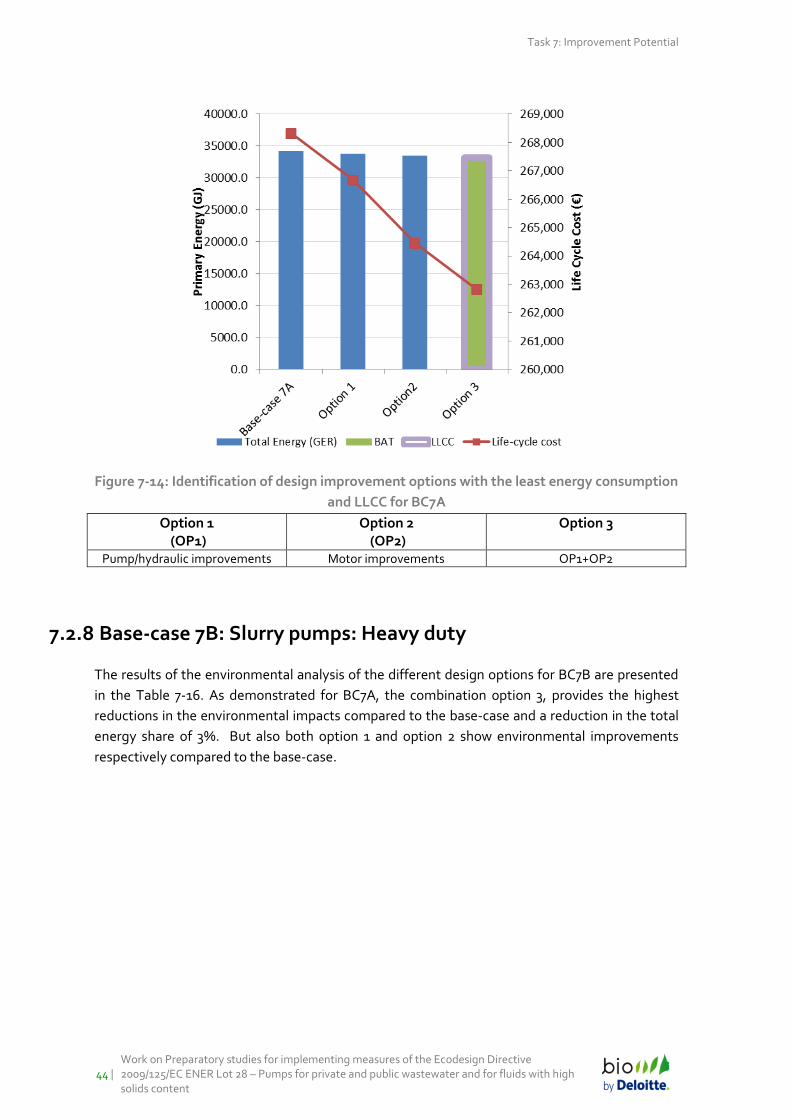
Figure 7-14 presents the comparison between LCC and the primary energy consumption for BC7A
and the design options. The combination option 3 appears as the BAT and the LLCC, with energy
savings of 3% and reduction of the LLC of 2% compared to the base-case.
Task 7: Improvement Potential
44 |
Work on Preparatory studies for implementing measures of the Ecodesign Directive 2009/125/EC ENER Lot 28 – Pumps for private and public wastewater and for fluids with high solids content
Figure 7-14: Identification of design improvement options with the least energy consumption
and LLCC for BC7A
Option 1 (OP1)
Option 2 (OP2)
Option 3
Pump/hydraulic improvements Motor improvements OP1+OP2
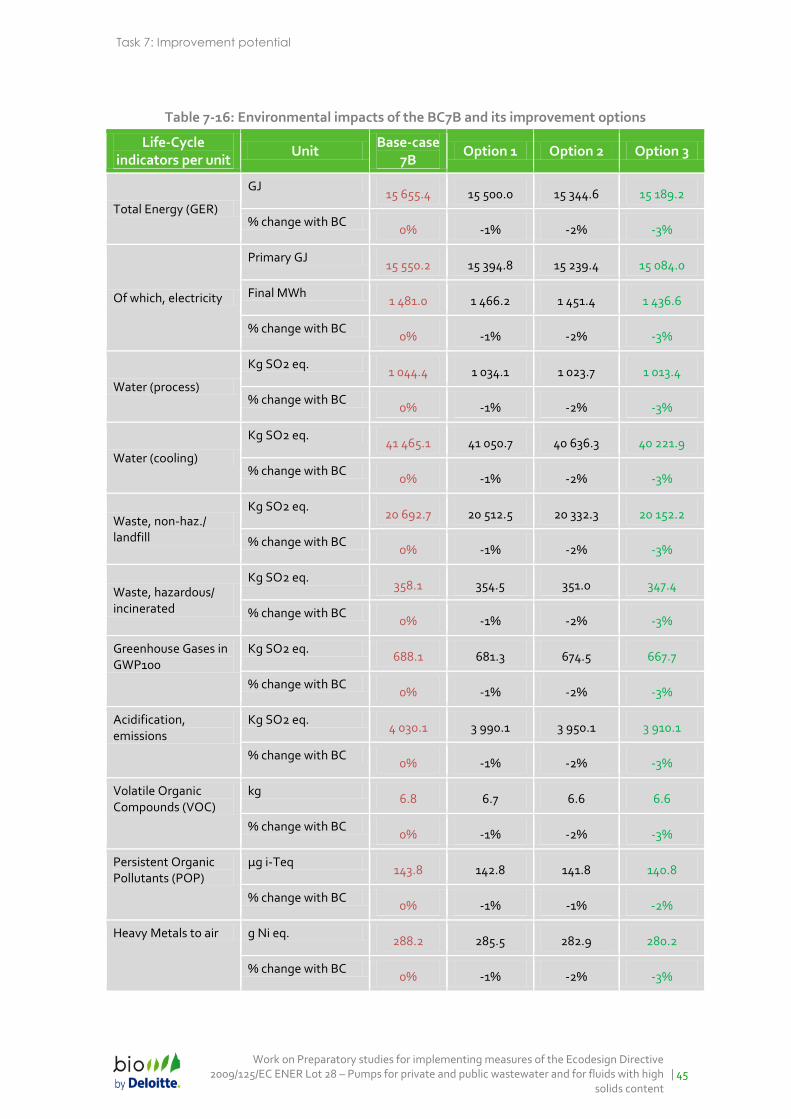
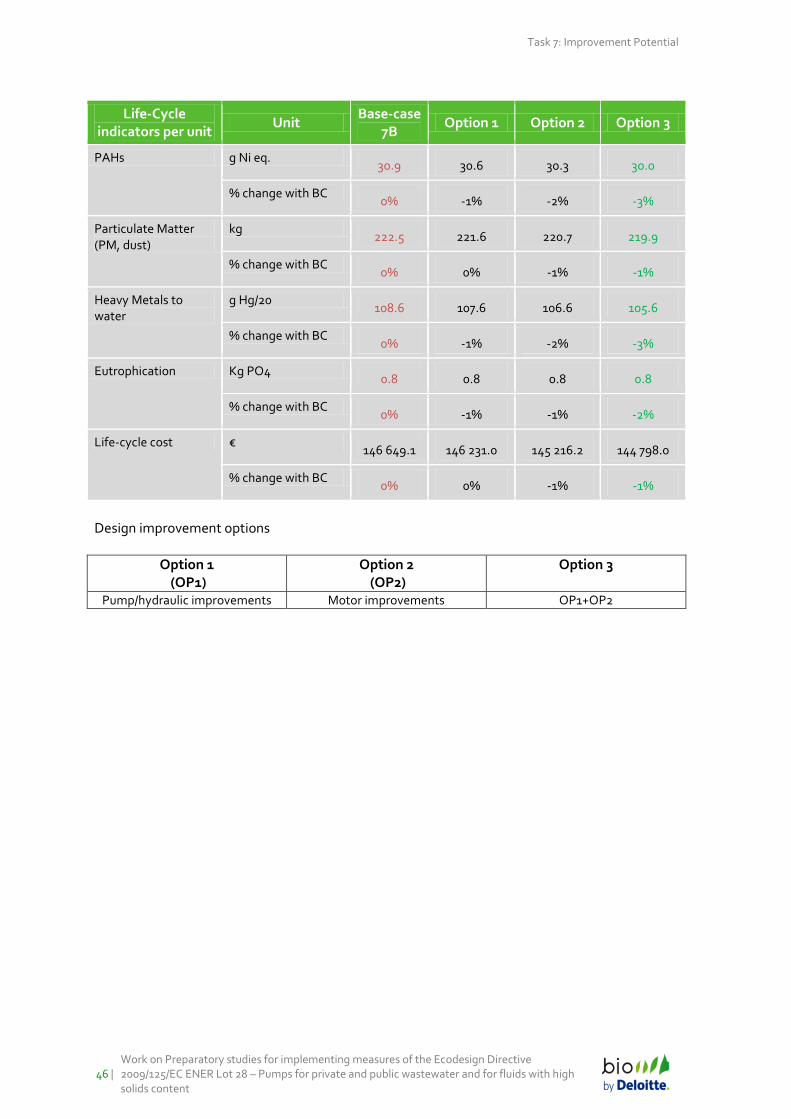
7.2.8 Base-case 7B: Slurry pumps: Heavy duty
The results of the environmental analysis of the different design options for BC7B are presented
in the Table 7-16. As demonstrated for BC7A, the combination option 3, provides the highest
reductions in the environmental impacts compared to the base-case and a reduction in the total
energy share of 3%. But also both option 1 and option 2 show environmental improvements
respectively compared to the base-case.
Task 7: Improvement potential
Work on Preparatory studies for implementing measures of the Ecodesign Directive 2009/125/EC ENER Lot 28 – Pumps for private and public wastewater and for fluids with high
solids content | 45
Table 7-16: Environmental impacts of the BC7B and its improvement options
Life-Cycle indicators per unit
Unit Base-case
7B Option 1 Option 2 Option 3
Total Energy (GER)
GJ 15 655.4 15 500.0 15 344.6 15 189.2
% change with BC 0% -1% -2% -3%
Of which, electricity
Primary GJ 15 550.2 15 394.8 15 239.4 15 084.0
Final MWh 1 481.0 1 466.2 1 451.4 1 436.6
% change with BC 0% -1% -2% -3%
Water (process)
Kg SO2 eq. 1 044.4 1 034.1 1 023.7 1 013.4
% change with BC 0% -1% -2% -3%
Water (cooling)
Kg SO2 eq. 41 465.1 41 050.7 40 636.3 40 221.9
% change with BC 0% -1% -2% -3%
Waste, non-haz./ landfill
Kg SO2 eq. 20 692.7 20 512.5 20 332.3 20 152.2
% change with BC 0% -1% -2% -3%
Waste, hazardous/ incinerated
Kg SO2 eq. 358.1 354.5 351.0 347.4
% change with BC 0% -1% -2% -3%
Greenhouse Gases in GWP100
Kg SO2 eq. 688.1 681.3 674.5 667.7
% change with BC 0% -1% -2% -3%
Acidification, emissions
Kg SO2 eq. 4 030.1 3 990.1 3 950.1 3 910.1
% change with BC 0% -1% -2% -3%
Volatile Organic Compounds (VOC)
kg 6.8 6.7 6.6 6.6
% change with BC 0% -1% -2% -3%
Persistent Organic Pollutants (POP)
μg i-Teq 143.8 142.8 141.8 140.8
% change with BC 0% -1% -1% -2%
Heavy Metals to air g Ni eq. 288.2 285.5 282.9 280.2
% change with BC 0% -1% -2% -3%
Task 7: Improvement Potential
46 |
Work on Preparatory studies for implementing measures of the Ecodesign Directive 2009/125/EC ENER Lot 28 – Pumps for private and public wastewater and for fluids with high solids content
Life-Cycle indicators per unit
Unit Base-case
7B Option 1 Option 2 Option 3
PAHs g Ni eq. 30.9 30.6 30.3 30.0
% change with BC 0% -1% -2% -3%
Particulate Matter (PM, dust)
kg 222.5 221.6 220.7 219.9
% change with BC 0% 0% -1% -1%
Heavy Metals to water
g Hg/20 108.6 107.6 106.6 105.6
% change with BC 0% -1% -2% -3%
Eutrophication Kg PO4 0.8 0.8 0.8 0.8
% change with BC 0% -1% -1% -2%
Life-cycle cost € 146 649.1 146 231.0 145 216.2 144 798.0
% change with BC 0% 0% -1% -1%
Design improvement options
Option 1 (OP1)
Option 2 (OP2)
Option 3
Pump/hydraulic improvements Motor improvements OP1+OP2
Task 7: Improvement potential
Work on Preparatory studies for implementing measures of the Ecodesign Directive 2009/125/EC ENER Lot 28 – Pumps for private and public wastewater and for fluids with high
solids content | 47
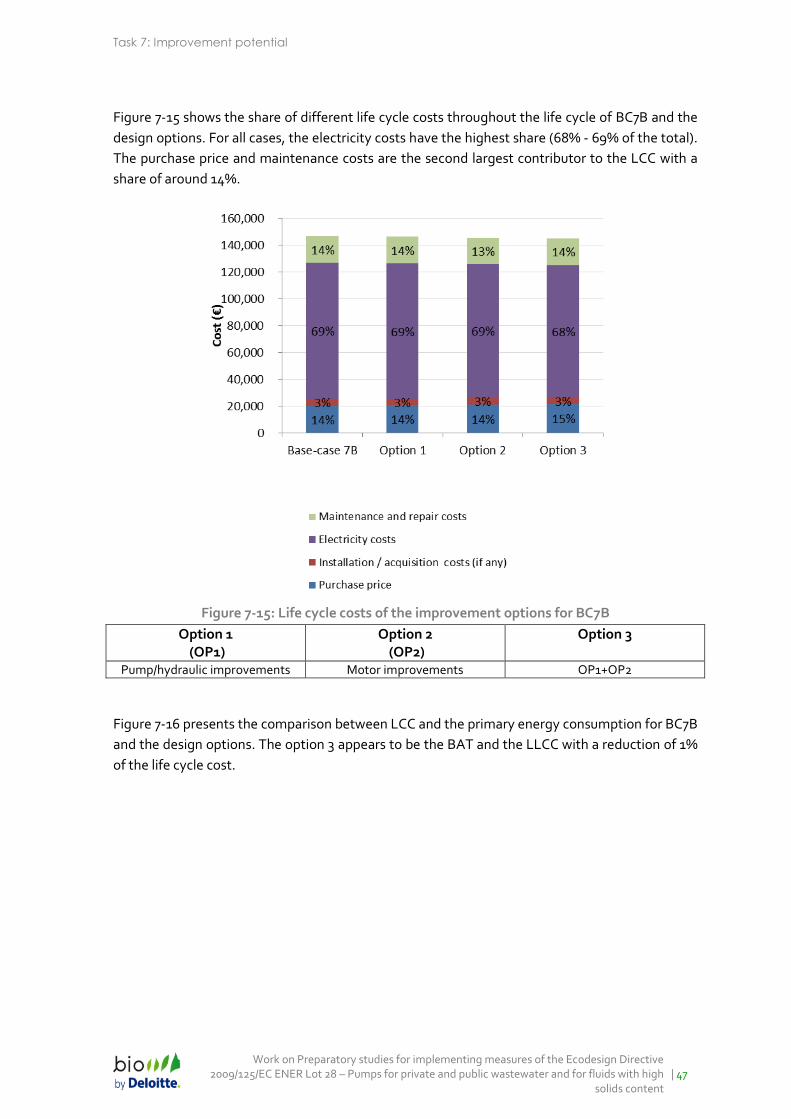
Figure 7-15 shows the share of different life cycle costs throughout the life cycle of BC7B and the
design options. For all cases, the electricity costs have the highest share (68% - 69% of the total).
The purchase price and maintenance costs are the second largest contributor to the LCC with a
share of around 14%.
Figure 7-15: Life cycle costs of the improvement options for BC7B
Option 1 (OP1)
Option 2 (OP2)
Option 3
Pump/hydraulic improvements Motor improvements OP1+OP2
Figure 7-16 presents the comparison between LCC and the primary energy consumption for BC7B
and the design options. The option 3 appears to be the BAT and the LLCC with a reduction of 1%
of the life cycle cost.

Task 7: Improvement Potential
48 |
Work on Preparatory studies for implementing measures of the Ecodesign Directive 2009/125/EC ENER Lot 28 – Pumps for private and public wastewater and for fluids with high solids content
Figure 7-16: Identification of design improvement options with the least energy consumption
and LLCC for BC7B
Option 1 (OP1)
Option 2 (OP2)
Option 3
Pump/hydraulic improvements Motor improvements OP1+OP2
Task 7: Improvement potential
Work on Preparatory studies for implementing measures of the Ecodesign Directive 2009/125/EC ENER Lot 28 – Pumps for private and public wastewater and for fluids with high
solids content | 49
7.3 BNAT and long-term systems analysis
Pumps, including wastewater pumps, are a very well established product that has been refined
for several hundred years, and, therefore, there are just minor things that can be considered for
the Best Not yet Available Technology (BNAT). There will inevitably be small improvements in
efficiency as computational fluid dynamics allows more experimentation and refinement to take
place in the design process, and also because closer manufacturing tolerances become feasible.
Any significant improvements in the energy associated with wastewater pumping are likely to be
achieved through the use of integrated controls for several pumps in a wastewater collection
system at a network level. Controlling several pumps together could potentially reduce the peaks
in flow rate that are currently observed by holding some flow back to off-peak periods, thereby
reducing the dynamic friction losses in the rising mains. As these types of control improvements
are achieved at a network level, and not at a product level, they are beyond the scope of this
study.

Task 7: Improvement Potential
50 | Work on Preparatory studies for implementing measures of the Ecodesign Directive 2009/125/EC ENER Lot 28 – Pumps for private and public wastewater and for fluids with high solids content
7.4 Conclusions
Several improvement options are available for each base-case, with different payback periods
and a small number of constraints. Combinations of these improvement options (which forms
the basis of extended product approach) provide potential for significant energy savings, leading
to the minimisation of negative environmental impacts.
In terms of potential energy savings, all three improvement options offer different prospects
depending on the respective base-cases. Whereas motor improvements and some
pump/hydraulic improvements, which include: improved case geometry, surface friction
reduction, leakage reduction and improved impeller efficiency, are applicable to all base-cases,
VSD10 is only feasible for BC1, BC2 and BC6.
Motor improvements alone, seem to offer the biggest potential energy consumption savings that
range from 4% to 6.7%. The savings achieved by VSD range from 3.4% to 6% for the pumps
which these improvements can be implemented on10. However, a combination of pump/hydraulic
improvements yields 10% energy savings for BC4 and savings range between 1-5% for all other
base-cases.
In terms of investments payback period, the following base-cases offer the shortest payback
periods (around 2 years) for all of their design improvement options
Base-case 2: Centrifugal submersible pump - mixed flow & axial pumps
Base-case 5: Submersible dewatering pumps
Base-case 6: Centrifugal dry well pump
Unlike all other improvement options, hydraulic improvement requires no significant additional
investments and is applicable to all base-cases. However, the payback time of hydraulic
improvements varies widely between the different base-cases, from less than 1 year (BC 1, BC2,
BC3, BC5 and BC6) to not ever generating returns on investments (BC4, BC7A and BC7B).
Although motor improvement is the options that offer biggest energy savings for all base – cases
except for BC4, payback time is longer. For VSD, which is applicable for three base-cases (BC1,
BC2 and BC6), the payback time is low for BC2 and BC6 (0.32 and 2,6 years, respectively) but too
high to justify investments for BC1. .
The results show that throughout all the base-cases, the BAT is always a combination of several
improvement options. A combination of all options considered is the BAT for all the base-cases.
The following results were obtained for LLCC. In three base-cases (BC1, BC3 and BC4), the option
with LLCC is not the combination of all improvement options. For BC1 motor improvements is
the LLCC option. For both BC3 and BC4 on the other hand, the LLCC is associated with no
improvement option at all, but with the base case itself.
10 Please note that the VSD technology only provides a benefit in applications where variable speed is needed. Some
pump applications would not benefit from this option if they only operate at full speed.

Task 7: Improvement potential
Work on Preparatory studies for implementing measures of the Ecodesign Directive 2009/125/EC ENER Lot 28 – Pumps for private and public wastewater and for fluids with high
solids content | 51
For the remaining five base-cases, the LLCC is a combination of all the independent
improvement options. For these five base-cases the LLCC is therefore the same as the BAT.
Currently, not available improvement options have a potential to become more affordable over
the coming years. This is the case for the use of integrated controls for several pumps in
wastewater collection system at a network level.
Hence, steadily increasing levels of energy efficiency can be achieved without significant
additional economic impacts. These results will be discussed in context of potential policy
measures in Task 8.

02 April 2014
185 avenue Charles de Gaulle 92200 Neuilly-sur-Seine
France + 33 (0) 5561 6755
www.bio.deloitte.fr