Embed Size (px)
Citation preview


This report is preliminary and has not been reviewed for conformity with U.S. Geological Survey editorial standards or with the North American Stratigraphic Code. Any use of trade, firm, or product names is for descriptive purposes only and does not imply endorsement by the U.S. Government
ARC/INFO coverages and a PDF file for this report are available at http://geology.cr.usgs.gov/greenwood-pubs.html

ContentsPage
Introduction . . . . . . . . . . . . . . . . . . . . . . . . . . . . . . . . . . . . . . . . . . . . . . . . . . . . . . . . . . . . . . . . . . . . . . . . . . . . . .1 Purpose and Approach . . . . . . . . . . . . . . . . . . . . . . . . . . . . . . . . . . . . . . . . . . . . . . . . . . . . . . . . . . . . . . . . .1 Methods . . . . . . . . . . . . . . . . . . . . . . . . . . . . . . . . . . . . . . . . . . . . . . . . . . . . . . . . . . . . . . . . . . . . . . . . . . . . . .2 Limitations . . . . . . . . . . . . . . . . . . . . . . . . . . . . . . . . . . . . . . . . . . . . . . . . . . . . . . . . . . . . . . . . . . . . . . . . . . . .3
Hurricane Mitch Rainfall . . . . . . . . . . . . . . . . . . . . . . . . . . . . . . . . . . . . . . . . . . . . . . . . . . . . . . . . . . . . . . . . . . . .4 Jinotega/San Rafael del Norte . . . . . . . . . . . . . . . . . . . . . . . . . . . . . . . . . . . . . . . . . . . . . . . . . . . . . . . . . . . . . . .5 El Sauce/San Nicolas . . . . . . . . . . . . . . . . . . . . . . . . . . . . . . . . . . . . . . . . . . . . . . . . . . . . . . . . . . . . . . . . . . . . . .7 Sébaco/San Nicolas . . . . . . . . . . . . . . . . . . . . . . . . . . . . . . . . . . . . . . . . . . . . . . . . . . . . . . . . . . . . . . . . . . . . . . .8 La Fundadora . . . . . . . . . . . . . . . . . . . . . . . . . . . . . . . . . . . . . . . . . . . . . . . . . . . . . . . . . . . . . . . . . . . . . . . . . . . .10 Matagalpa . . . . . . . . . . . . . . . . . . . . . . . . . . . . . . . . . . . . . . . . . . . . . . . . . . . . . . . . . . . . . . . . . . . . . . . . . . . . . . .11 Dipilto . . . . . . . . . . . . . . . . . . . . . . . . . . . . . . . . . . . . . . . . . . . . . . . . . . . . . . . . . . . . . . . . . . . . . . . . . . . . . . . . . .13 Cinco Piños . . . . . . . . . . . . . . . . . . . . . . . . . . . . . . . . . . . . . . . . . . . . . . . . . . . . . . . . . . . . . . . . . . . . . . . . . . . . . .15 Summary, Conclusions, and Recommendations . . . . . . . . . . . . . . . . . . . . . . . . . . . . . . . . . . . . . . . . . . . . . . . .15 Acknowledgments . . . . . . . . . . . . . . . . . . . . . . . . . . . . . . . . . . . . . . . . . . . . . . . . . . . . . . . . . . . . . . . . . . . . . . . .16 References . . . . . . . . . . . . . . . . . . . . . . . . . . . . . . . . . . . . . . . . . . . . . . . . . . . . . . . . . . . . . . . . . . . . . . . . . . . . . .17
Illustrations
Figure
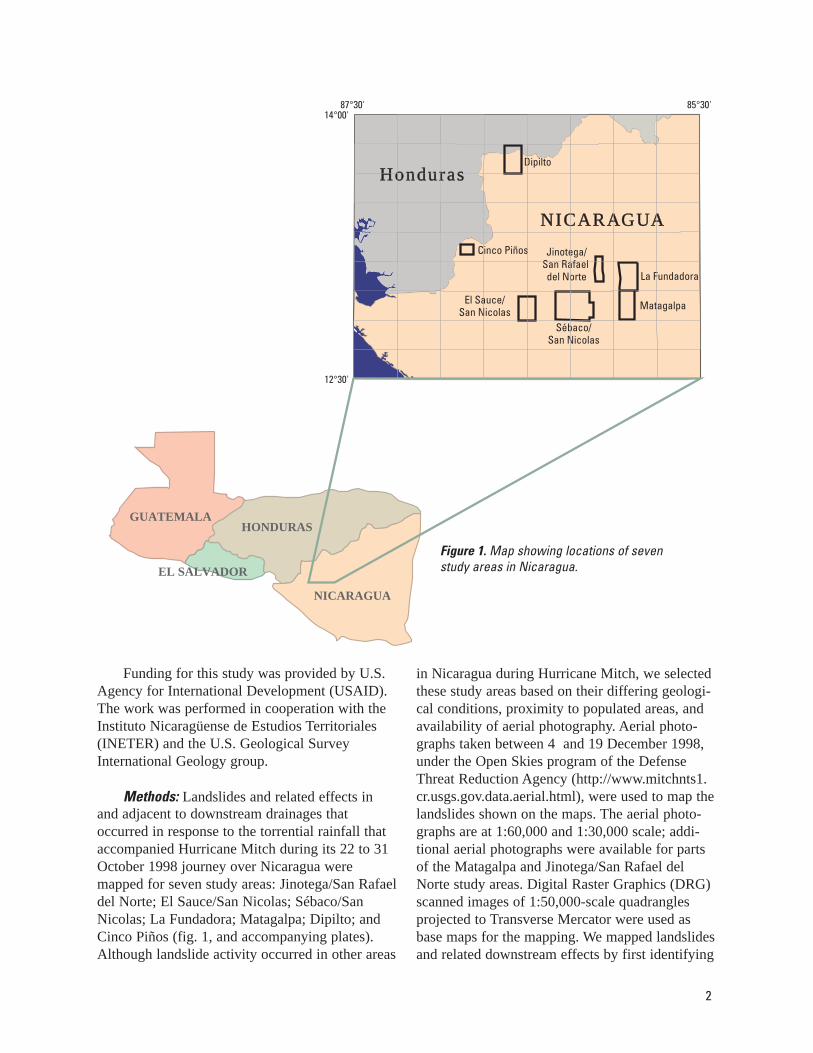
1 Map showing locations of seven study areas in Nicaragua . . . . . . . . . . . . . . . . . . . . . . . . . . . . . . . 2
2 Map of rainfall isohyets from Hurricane Mitch and the principal meteorological stations in Nicaragua . . . . . . . . . . . . . . . . . . . . . . . . . . . . . . . . . . . . . . . . . . . . . . . . . . . . . . . . . . . . . . . . . . . . . . .4
3 Boulder deposit at Quebrada Grande in the El Sauce/San Nicolas study area . . . . . . . . . . . . . . . .7
4 Source area and deposits of debris flow near La Caña . . . . . . . . . . . . . . . . . . . . . . . . . . . . . . . . . . . .9
5 Structures destroyed by debris flows behind hospital at La Trinidad . . . . . . . . . . . . . . . . . . . . . . . . .9
6 Landslides along the road to Jinotega in the La Fundadora study area showing broad scale of response . . . . . . . . . . . . . . . . . . . . . . . . . . . . . . . . . . . . . . . . . . . . . . . . . . . . . . . . . . . . . . . . . . . . . . . . .11
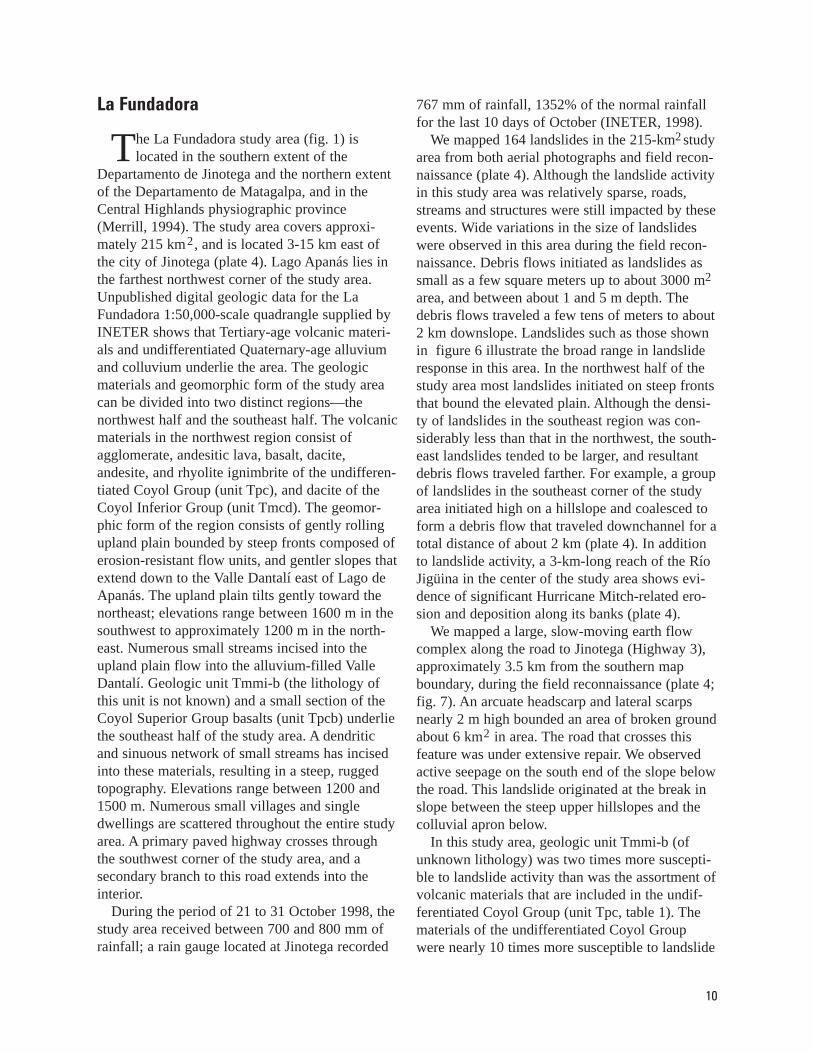
7 Deep-seated, slow-moving earth flow on road to Jinotega . . . . . . . . . . . . . . . . . . . . . . . . . . . . . . .12
8 Headscarp of landslide that produced a debris flow that traveled through the village of San Francisco . . . . . . . . . . . . . . . . . . . . . . . . . . . . . . . . . . . . . . . . . . . . . . . . . . . . . . . . . . . . . . . . . . . .13
9 Headscarp of landslide in deeply weathered materials in northern Matagalpa study area . . . . .13
10 Toe of the earth flow at San Simón de Palcila . . . . . . . . . . . . . . . . . . . . . . . . . . . . . . . . . . . . . . . . . .14
11 View up slope of earth flow at San Simón de Palcila . . . . . . . . . . . . . . . . . . . . . . . . . . . . . . . . . . . . .14
i

Plate
1 Map of landslides and related downchannel effects triggered by Hurricane Mitch in parts of Jinotega and San Rafael del Norte quadrangles, Nicaragua
2 Map of landslides and related downchannel effects triggered by Hurricane Mitch in parts of El Sauce and San Nicolas quadrangles, Nicaragua
3 Map of landslides and related downchannel effects triggered by Hurricane Mitch in parts of Sébaco and San Nicolas and quadrangles, Nicaragua
4 Map of landslides and related downchannel effects triggered by Hurricane Mitch in part of La Fundadora quadrangle, Nicaragua
5 Map of landslides and related downchannel effects triggered by Hurricane Mitch in part of Matagalpa quadrangle, Nicaragua
6 Map of landslides and related downchannel effects triggered by Hurricane Mitch in part of Dipilto quadrangle, Nicaragua
7 Map of landslides and related downchannel effects triggered by Hurricane Mitch in part of Cinco Piños quadrangle, Nicaragua
Table
1 For each study area, the lithology and areal extent of each geologic unit, the number of landslide initiation locations within each geologic unit, and the geologic susceptibility index . . . . . . . . . . . .6
Cover Photos: Hurricane Mitch approaching Central America on 26 October 1998, 13:15 UTC (07:15 local time). The hurricane is over the northern half of Nicaragua at this time. The image is derived from satellite data that has been color-enhanced and processed to yield a perspective rendering of the hurricane. Modified from image produced by Hal Pierce, Laboratory for Atmospheres, NASA Goddard Space Flight Center.
Landslide triggered by Hurricane Mitch on hillslopes near Matagalpa, Nicaragua. Photograph by Eugene Schweig, 25 September 1999.
ii

Landslide Response to Hurricane Mitch Rainfall in Seven Study Areas in Nicaragua
By Susan H. Cannon, Kathleen M. Haller, Ingrid Ekstrom, Eugene S. Schweig III, Graziella Devoli, David W. Moore, Sharon A. Rafferty, and Arthur C. Tarr
Abstract: We present maps of seven study areas in Nicaragua that show the impact from landslides and related downslope effects triggered by the passage of Hurricane Mitch, 21 to 31 October 1998. 95%) of the landslides mapped were debris flows. maps show debris-flow source areas as small as a few square meters and only a few meters deep that produced debris flows that traveled only tens of meters downslope, to landslides that covered approximately 80,000 m 2 , and produced debris flows that traveled at least 3 km down channels. slow-moving earth flows that started moving during Hurricane Mitch and continued to move for at least 1 year.
The study areas of El Sauce/San Nicolas, Dipilto, and Cinco Piños, and parts of Sébaco/San Nicolas and Matagalpa showed particularly extensive landslide activity; landslides covered up to 80% of the terrain in places. Study areas La Fundadora and Jinotega/San Rafael del Norte, and parts of Sébaco/San Nicolas and Matagalpa, on the other hand, showed significantly lower concentrations of landslides.
Susceptibility indices identify those geologic units that produced the most landslides in each study area in response to the rainfall conditions specific to Hurricane Mitch. In the Jinotega/San Rafael del Norte study area, Quaternary-age hillslope-mantling colluvium was the most
susceptible to landslide activity. The Coyol Inferior Group dacite was most susceptible to landslide activity in the El Sauce/San Nicolas study area. The Coyol Superior Group ignimbrite was most susceptible in the Sébaco/San Nicolas study area, unit Tmmi-b (lithology unknown) was most susceptible in the La Fundadora study area, the Coyol Superior Group basalt and andesite and Quaternary colluvium were most susceptible in the Matagalpa study area, decomposed granite and granodiorite were most susceptible in the Dipilto area, and both decomposed granite and granodiorite and volcanic materials in the undifferentiated Matagalpa and Inferior Coyol Groups showed high susceptibilities in the Cinco Piños area. Landslides most commonly developed in areas of weathered and/or hydrothermally altered materials. In addition, depth of scars appeared to be controlled by depth of weathered mantle.
We have provided a record of landslide activity in response to the storm of record over areas of diverse geology, geomorphology, microclimates, and vegetation. When combined with information on the physical properties of hillslope-mantling materials (including the depth of weathering), hillslope form and gradient, rainfall characteristics, and travel distance, these inventories could provide a foundation for the development of accurate and meaningful susceptibility maps.
Most (perhaps The
The remaining 5% of mapped landslides were
Introduction
Purpose and Approach: The passage of Hurricane Mitch through Central America in October and November of 1998 caused wide-spread and devastating flooding and landsliding. In this work we document the landslide response to the rainfall that accompanied Hurricane Mitch in Nicaragua. We generated 1:50,000-scale maps for seven study areas located throughout Nicaragua that show the areas impacted by land-slides and related downchannel effects (fig. 1).
In what follows we first briefly summarize what we have learned about the rainfall produced by Hurricane Mitch in Nicaragua. We then
describe the physiographic, geologic, and cultural settings of each study area, and provide information on rainfall totals measured from 22 to 31 October 1998, in or nearby each study area. For the study areas for which it is available we present the deviation of Hurricane Mitch rainfall totals from the normal rainfall for the last 10 days of October. Finally, we present the results of our landslide mapping, including the magnitude and form of the landslide response, and briefly explore the relation between geologic units and landslide susceptibility for each study area.
1
87°30' 85°30'
GUATEMALA
EL SALVADOR
HONDURAS
NICARAGUA
HondurasH o n d u r a s
NICARAGUAN I C A R AG UA
Cinco Piños
Matagalpa
Sébaco/ San Nicolas
Jinotega/ San Rafael del Norte
14°00'
12°30'
El Sauce/ San Nicolas
La Fundadora
Dipilto
Figure 1. study areas in Nicaragua.
Map showing locations of seven
Funding for this study was provided by U.S. Agency for International Development (USAID). The work was performed in cooperation with the Instituto Nicaragüense de Estudios Territoriales (INETER) and the U.S. Geological Survey International Geology group.
Methods: Landslides and related effects in and adjacent to downstream drainages that occurred in response to the torrential rainfall that accompanied Hurricane Mitch during its 22 to 31 October 1998 journey over Nicaragua were mapped for seven study areas: Jinotega/San Rafael del Norte; El Sauce/San Nicolas; Sébaco/San Nicolas; La Fundadora; Matagalpa; Dipilto; and Cinco Piños (fig. 1, and accompanying plates). Although landslide activity occurred in other areas
in Nicaragua during Hurricane Mitch, we selected these study areas based on their differing geological conditions, proximity to populated areas, and availability of aerial photography. Aerial photo-graphs taken between 4 and 19 December 1998, under the Open Skies program of the Defense Threat Reduction Agency (http://www.mitchnts1. cr.usgs.gov.data.aerial.html), were used to map the landslides shown on the maps. The aerial photo-graphs are at 1:60,000 and 1:30,000 scale; additional aerial photographs were available for parts of the Matagalpa and Jinotega/San Rafael del Norte study areas. Digital Raster Graphics (DRG) scanned images of 1:50,000-scale quadrangles projected to Transverse Mercator were used as base maps for the mapping. We mapped landslides and related downstream effects by first identifying
2

We use the term "landslide" to describe all types of slope failures, including slow-moving earth
flows, rotational and translational slides (Cruden and Varnes, 1996; Varnes, 1978), and fast-moving debris flows. Most (perhaps 95%) of the landslides that we mapped are debris flows. A debris flow is a rapid downslope movement of viscous slurry consisting of up to boulder-sized material in an abundant muddy matrix (Varnes, 1978; Pierson and Costa, 1987). Debris flows may initiate either as rotational or translational land-slides that mobilize into muddy slurries. They may also develop from concentrated erosion of surficial material by runoff. Debris flows generally occur in response to periods of intense rainfall. With travel across hillslopes and down channels, debris flows can substantially increase in volume by incorporating additional colluvium, channel-fill material, and water. Addition of sufficient volumes of water relative to sediment content may also result in dilution of the debris flow to streamflow consistency. Debris flows may occur with little warning, are capable of transporting large material long distances over relatively gentle slopes, and develop momentum and impact forces that can cause consider-
able destruction. As a result of these characteristics, mitigation of debris-flow hazards can be more difficult than mitigation of flood hazards. Most of the landslide-related damage and deaths that occurred during Hurricane Mitch were a result of debris flows.
Slow-moving earth flows are the other type of land-slide described in this report. Earth flows are mass movements that form on moderate slopes with adequate moisture in fine-grained, plastic soils as well as rocky soils supported by a plastic silt-clay matrix. These landslides can be a primary agent of erosion in many areas, contributing large amounts of sediment to streams and rivers. Earth flows move in brief periods of episodic movement or in periods of sustained, relatively steady movement, generally in response to above-aver-age rainfall, but also in response to other disturbances such as earthquakes, grading, or irrigation (Keefer and Johnson, 1983; Skempton and others, 1989). Most slow earth flows move primarily by sliding on a distinct basal shear surface, accompanied by internal deformation of the earth-flow material. These deep-seated landslides can cause damage to infrastructure and homes, but do not normally fail catastrophically.
them on the aerial photographs using a mirror stereoscope and then manually plotting each land-slide and its affected area by inspection onto the base maps. In some cases, the base maps were enlarged to 1:25,000 scale to facilitate mapping. Locations of landslides mapped using this procedure are accurate to within about 200 m.
Field reconnaissance from 25 April through 6 May 2000 resulted in limited verification of the landslide and related effects mapping. Because of the large areal extent of the study areas and difficulties of access, we visited only a few, small areas. We observed as few as 5% of the landslides in some study areas and as many as 40% of the landslides in others. During this reconnaissance, we mapped the location and extent of some land-slides outside the coverage of the aerial photography. This mapping represents only features that we observed, and is not representative of all the land-slide activity in the area.
Following field verification, the mapped areal extent of landslides and affected areas were digitized, and then digitally registered to the DRG base maps. A point representing the initiation location of each landslide was also digitized. Final maps are presented at 1:50,000 scale.
INETER provided unpublished geologic map data at 1:50,000 scale as either digital files or paper copies, which we digitized. The digital data was compiled as part of an unpublished broad-scale hydrological investigation of Nicaragua. For each study area, we calculated an index of the relative susceptibility of each geologic unit by dividing the number of landslide initiation locations within each geologic unit by the aerial extent of the unit in the study area. To describe the hillslope gradients upon which most landslides originated, we measured gradients from 1:50,000-scale topographic maps.
Limitations: The small scale of the aerial photographs precludes identification of locations of transitions between debris-flow source areas and debris-flow paths, and transitions between debris-flow and streamflow processes. For this reason, we mapped debris flows as extending from the source areas to the farthest point downchannel that appeared to have been affected by flow processes, whether streamflow or debris flow. Also due to the scale of the aerial photographs used for this map-ping, it is possible to distinguish between debris flows and slow-moving earth flows, but not
3

between different types of all of the landslides that mobilized into debris flows. In addition, the maps show areas where cloud cover obscured the ground in the aerial photographs. Although land-slide features may be present in these areas, it was not possible to map them. If a landslide feature was partially obscured by trees, shadows, or cloud cover we mapped only what was visible. Finally, the area affected by each landslide was mapped by filling in a colored polygon that best represents its shape and size. Because each feature is represented by a line at least the width of one pencil lead, the size of very small features may be somewhat exaggerated.
Hurricane Mitch Rainfall
Hurricane Mitch is the storm of record for most of Nicaragua; rainfall accumula
tions measured at 14 of 16 gauges located throughout Nicaragua were significantly greater during Hurricane Mitch than those measured during the 10 other hurricanes and tropical storms that have occurred since 1971 (INETER, 1998). Rainfall accumulations measured during the 10-day period that Hurricane Mitch impacted Nicaragua varied between about 50 mm in the southeast portion of the country adjacent to the Caribbean coast, to more than 1600 mm at the northwest corner of the country adjacent to Honduras (fig. 2). These totals ranged between minus 72% of the normal rainfall for the last 10 days of October at the Bluefields gauge located in the southeast of the country (the normal rate being greater than that received during Hurricane Mitch) to 2793% of the normal rainfall for the last 10 days of October at the San Isidro gauge (INETER, 1998).
Figure 2. Map of rainfall isohyets (in mm) from Hurricane Mitch (21 to 31 October 1998). The principal meteorological stations in Nicaragua are shown by yellow dots. Map adapted from INETER (1998).
COSTA RICA
HONDURAS
1600
1500
1000
1000
1000
900
900
800
700600
500550
450
400350
300
900
100
150
250
200
250 200
150
100
50
50
Esteli
Pacific Ocean
Ca
rib
be
an
Se
a
Bluefields
San Carlos
Puerto Cabezas
Rivas
300
350
400450500
550600
800
700 900
1000
1500 1600
Corinto
Ocotal
Timal
Muy Muy
NICARAGUA
Lago deNicaragua
Lago deManagua
Nandaime
Masatepe
Managua
Condega
1100
León
San Isidro
Juigalpa
Chinandega
Somotillo Matagalpa
Jinotega
4

Jinotega/San Rafael del Norte
The Jinotega/San Rafael del Norte study area (fig. 1) is located in the
Departamento de Jinotega, and in the Central Highlands physiographic province (Merrill, 1994). The study area covers approximately 80 km2, and is located between 6 and 11 km west of the city of Jinotega, and 3 to 8 km west of the Lago de Apanás (plate 1). Unpublished geologic maps of the Jinotega and San Rafael del Norte 1:50,000-scale quadrangles by J.L. Garayar and R.L. Williams show that Tertiary-age volcanic materials and undifferentiated Quaternary-age alluvium and colluvium underlie the area. The volcanic materials consist of dacite, andesite ignimbrite, andesite, and agglomerate of the Coyol Inferior Group (units Tmcd and Tmca) overlain by a series of basaltic lavas of the Coyol Superior Group (unit Tmcb). These volcanic materials form an elevated plain that has been dissected by the present-day fluvial network. The plain tilts gently toward the south; elevations range between 600 m in the south rising to 1100 m in the north. The geomorphic form of the area consists of gently rolling uplands bounded by steep fronts composed of erosion-resistant flow units, and gentler slopes that extend down to Río Viejo and the Río San Gabriel and their tributaries. Río Viejo flows approximately from east to west across the southern half of the study area, and occupies a wide alluvial channel for most of the reach. Río San Gabriel flows from approximately the northwest corner of the study area to the east into the Lago de Apanás. Numerous small villages and single dwellings are scattered throughout the area. A primary paved high-way crosses through the northern part of the study area, and a secondary branch of this road extends into the interior.
During the period of 21 to 31 October 1998, the study area received between 700 and 800 mm of rainfall; a rain gauge located at Jinotega recorded 767 mm of rainfall, 1352% of the normal rainfall for the last 10 days of October (INETER, 1998).
We mapped 90 landslides in this area from the aerial photographs (plate 1). The majority of the debris flows mapped initiated as small landslides of up to a few tens of square meters in area, a few
meters in depth, and traveled a few hundred meters downslope, commonly stopping on the gently-sloping colluvial apron downslope from the resistant flow unit (plate 1). Although relatively small in scale, the landslides blocked and dam-aged roads and impacted structures and farmland. One landslide that differs from this scale was mapped immediately west of Cerro Zaraguasca (plate 1). This debris flow initiated from a land-slide that covers an area of approximately 40,000 m2, and traveled nearly 1 km over a densely vegetated hillslope. Erosional features observed on the aerial photographs suggest that the debris flow gained significantly in volume as it traveled over the hillslope. The impact of this landslide is unknown, as its path was obscured by vegetation once it traveled into a first-order drainage.
Most of the debris flows mapped in this area originated from the steep (20° to 27°) fronts of erosion-resistant flow units within the dacite and andesite ignimbrite of the Coyol Inferior Group (unit Tmcd, plate 1). When the number of initiation locations in each geologic unit is normalized by the areal extent of that unit in the study area, we find that the undifferentiated alluvium and colluvium mapped along the Río Viejo was the most susceptible to landslide activity in response to Hurricane Mitch rainfall (table 1). Because all of the landslides mapped in this unit are located on the hillslopes adjacent to the Río Viejo flood plain, it is reasonable to assume that they occurred with-in hillslope-mantling colluvium. The Coyol Inferior Group dacite and andesite ignimbrite (unit Tmcd) and andesite ignimbrite, andesite, and agglomerate (unit Tmca) were slightly less susceptible to landslide activity, and the Coyol Superior Group basalt (Tpcb) had a very low susceptibility (table 1).
Río Viejo shows evidence of significant Hurricane Mitch-related erosion and deposition along its course (plate 1). Because the upper reaches of Río Viejo are located beyond the cover-age of the aerial photographs, it is not known if these effects are the result of Hurricane Mitchrelated landsliding or flooding.
5

--
--
--
--
--
--
--
--
--
Table 1. For each study area, the lithology and areal extent of each geologic unit, the number of landslide initia�tion locations within each geologic unit, and the geologic susceptibility index. The susceptibility index is calculated as the number of initiation locations in each geologic unit divided by the areal extent of that unit within the study area. Only landslide initiation locations identified from aerial photographs and areal extent of geologic units not covered by clouds are used in the calculation.
Study Area and Geologic Unit
Lithology Area (km2)
Number of Initiation Locations
Geologic Susceptibility
Index
Jinotega/San Rafael del Norte
Q Undifferentiated alluvium and colluvium 2.6 8 3
Tpcb Basalt 29.32 10 0.3
Tmcd Dacite and andesite ignimbrite 23.88 56 2
Tmca Andesite ignimbrite, andesite and agglomerate 15.50 16 1
El Sauce/San Nicolas
Q Undifferentiated alluvium and colluvium 32.23 14 0.4
Tmcd Dacite 122.29 3664 30
Tmca Andesite and/or agglomerate 14.43 120 8
Sébaco/San Nicolas
Q Undifferentiated alluvium and colluvium 153.3 0
Tpcl Andesite, dacite and agglomerate 1.8 8 4
Tpci Ignimbrite 48.6 286 6
Tpcb Basalt 137.5 196 1
Tpca Agglomerate 14.5 28 2
Tmcd-Ag Agglomerate and breccia 4.0 0
Tmcd Dacite, dacite ignimbrite tuff 75.4 137 2
Tmca Andesite and/or agglomerate 0.53 0
La Fundadora
Q Undifferentiated alluvium and colluvium 8.63 0
Tpcb Basalt 0.98 0
Tmcd Dacite 50.27 2 0.04
Tmca Andesite ignimbrite, andesite or agglomerate 1.21 0
Tmmi-b Lithology unknown 124.83 143 1
Tpc Agglomerate, andesitic lava, basalt, dacite,
andesite, and rhyolite ignimbrite
27.62 14 0.5
Matagalpa
Q Undifferentiated alluvium and colluvium 8.84 15 2
Tpci Ignimbrite and tuff 3.1 3 1
Tpcb Basalt and andesite 45.2 99 2
Tmcd (Ag) Breccia and agglomerate 9.3 2 0.2
Tmcd Dacite ignimbrite and tuff 43.4 42 1
Tmcd (A) Andesite ignimbrite 22.75 25 1
Tmca Agglomerate and/or andesite 90.9 88 1
Dipilto
Q Undifferentiated alluvium and colluvium 5.62 0
Tot Totogalpa formation – lithology unknown 2.38 0
Ka Granite and granodiorite 117.97 449 4
Ptm Phyllite schist and other metamorphic rocks 28.63 8 0.3
Cinco Piños
Tmca Andesite ignimbrite and agglomerate 0.13 0
Tmci Pyroclastic flows, lahars, ignimbrite, andesite
and agglomerate
45.04 1067 24
Ka Granite and granodiorite 10.86 360 33
6

El Sauce/San Nicolas Petaquía showed evidence of some erosion and deposition, but it was not as extensive as that
he El Sauce/San Nicolas study area (fig. 1) mapped in the west side of the study area. The is located in the northern extent of the northern half of the study area was particularly
Departamento de León, and in the Central hard hit by landslide activity; landslides occupiedHighlands physiographic province (Merrill, 1994). more than 80% of the terrain in places and roadsThe study area covers approximately 170 km2, in the area were severely damaged in numerouswith the towns of El Sauce nearly in its center and locations. A wide range in the magnitude ofRío Grande just beyond the northwest corner debris-flow activity was mapped in this area—(plate 2). Unpublished geologic maps of the El source areas as small as a few square meters andSauce and San Nicolas 1:50,000-scale quadrangles only a few meters deep produced debris flows thatby G.H. Valrey and R.L. Williams show that traveled only tens of meters downslope up to aTertiary age-volcanic materials and undifferentiat- landslide that covers approximately 80,000 m2,ed Quaternary-age alluvium and colluvium under- and debris flows that traveled more that 2 kmlie the area. The volcanic materials consist of two down channels. During the field reconnaissanceunits, both included in the Coyol Inferior Group— we observed that landslide scars most commonlydacite (unit Tmcd), and andesite and/or agglomer- occurred in areas of weathered and/or hydrotherate (unit Tmca). These materials form a steep, mally altered materials. In addition, the depth ofrugged upland that rises to the east and north of El the scars appeared to be controlled by the depth ofSauce. Elevations range from approximately the weathered mantle; very shallow landslides200 m at El Sauce up to 1100 m the highest peak. occurred where the weathered mantle was thin,A network of west-draining stream channels has but scars up to several meters deep developed inincised into the highland, and the town of El areas where the weathered mantle was also severalSauce occupies a Quaternary-age alluvial plain. meters thick. Río Petaquía flows across the upper northeast cor- The great majority (3664) of mapped landslidesner of the study area; this river also occupies a occurred within materials that mantle hillslopeswide alluvial plain. In addition to the town of El underlain by the dacite of the Coyol InferiorSauce, numerous small villages and single Group (unit Tmcd, plate 2). We found that thedwellings are scattered throughout the area. A pri- dacite of unit Tmcd was nearly four times moremary paved highway and railroadcrosses through the center of thearea, trending essentially north tosouth. A secondary road winds northof El Sauce through the highlands.
T
The map of Hurricane Mitch rain-fall totals shows that during the period of 21 to 31 October 1998, thearea received between 800 and 900mm of rainfall (INETER, 1998).
This area was severely impactedby debris flows and downstreameffects by Hurricane Mitch rainfall;we mapped 3798 landslides withinthe 170-km2 study area, and all ofthe stream channels that drain towardthe west out of the uplands showedevidence of significant erosion anddeposition (plate 2; fig. 3). On the Figure 3. Boulder deposit at Quebrada Grande in the northeast side of the area, Río El Sauce/San Nicolas study area.
7

susceptible to landslide activity than were the andesite and/or agglomerate (unit Tmca, table 1). Note that on plate 2 some landslides are mapped as having initiated within the undifferentiated Quaternary-age alluvium and colluvium. Because most of these landslides are mapped on the hill-slopes adjacent to the valley alluvial fill, we assume that they originated within hillslopemantling colluvium.
Sébaco/San Nicolas
The Sébaco/San Nicolas study area (fig. 1) is located in the southern extent of the
Departamento de Estelí and the northwest extent of the Departamento de Matagalpa, and in the Central Highlands physiographic province (Merrill, 1994). The study area covers approximately 450 km2 and includes the towns of Sébaco in the southeast, San Isidro in the center, and La Trinidad in the northwest (plate 3). Unpublished geologic mapping of the 1:50,000-scale San Nicolas and Sébaco quadrangles by R.L. Williams, G.H. Valrey and Carlos Birbuet show that Tertiary-age volcanic materials and undifferentiated Quaternary-age alluvium and colluvium under-lie the area. The volcanic materials consist of dacite, dacite ignimbrite, andesite, agglomerate, breccia, and tuff of the Coyol Inferior Group (units Tmca, Tmcd and Tmcd-Ag) overlain by the Coyol Superior Group that consists of agglomerate and a series of basaltic lavas that grade upward into ignimbrite (units Tpca, Tpcb and Tpci). Localized outcrops of andesite, dacite and agglomerate (unit Tpcl) are mapped overlying the ignimbrites in the northwest corner of the study area. The volcanic rocks form an elevated plain that has been dissected by the present-day fluvial network. Elevations range between 500 m near the towns of Sébaco and San Isidro to 1200 m at the highest peak in the study area. The geomorphic form of the area consists of gently rolling uplands bounded by steep fronts composed of erosion-resistant flow units, and gentler slopes that extend down to the wide alluvial plain occupied by the Río Viejo and its tributaries. Slump features, in the form of arcuate headscarps above areas of hummocky topography, are common in the steep fronts. Río Viejo flows from the north to the south
nearly though the center of the study area, and Río La Trinidad drains from the west to the east, through the town of La Trinidad. Both of these rivers occupy extensive alluvial plains. In addition to the previously mentioned towns, numerous small villages and single dwellings are scattered throughout the area. The Pan-American Highway extends from Sébaco in the southeast corner of the study area through La Trinidad in the northwest. An additional paved highway extends north from Sébaco.
During the period of 21 to 31 October 1998, the study area received between 700 and 800 mm of rainfall; a rain gauge located at San Isidro recorded 784 mm of rainfall, 2793% of the normal rain-fall for the last 10 days of October (INETER, 1998). This was this largest deviation from the norm for all of the 16 principal meteorological stations located in Nicaragua (INETER, 1998).
We mapped 655 landslides in this study area from aerial photographs (plate 3). Most of the debris flows initiated as landslides up to a few tens of square meters in area, a few meters in depth, and traveled less than 1 km downslope, commonly stopping on the gently sloping colluvial apron downslope from the resistant flow unit. However, the landslide density was particularly high and the sizes of the landslides were particularly large, relative to the rest of the study area, on the steep hillslopes that bound the mesas above the towns of San Francisco and La Trinidad in the northwest part of the study area (plate 3). Material from landslides with areas up to about 20,000 m2
traveled at least 3 km over the colluvial apron and onto the flood plains of Quebradas Seca and La Rancho. Between the towns of San Isidro and La Trinidad, a landslide that initiated in the Coyol Superior ignimbrite mobilized into a debris flow that traveled approximately 1 km down a steep channel, eroding significant volumes of material (fig. 4). Material from other debris flows crossed the highway between La Caña and La Trinidad in numerous locations. Immediately south of La Trinidad, several structures behind the hospital were damaged or destroyed by a series of coalescing debris flows generated from the steep hill-slopes behind the town (fig. 5).
The majority of the debris flows mapped in this area originated from steep fronts (gradients
8

During field reconnaissance we observed that the landslide scars most commonly occurred in areas of weathered and/or hydrothermally altered materials. In addition, the depth of scars appeared to be controlled by the depth of weathered mantle; very shallow landslides occurred where the weathered mantle was thin, and scars up to several meters deep developed in areas where the weathered mantle was several meters thick.
Río Viejo, Río La Trinidad, and Quebrada Seca show evidence of significant Hurricane Mitchrelated erosion and deposition
Figure 4. Source area and deposits of debris flow near La Caña. along their courses (plate 3). Because the upper reaches of Río
Viejo and Río La Trinidad are located beyond the coverage of the aerial photo-graphs, it is not known if these effects are the result of landsliding or flooding. Quebrada Seca drains the area that experienced extensive debris-flow activity behind the village of San Francisco, but due to their scale, it was not possible to determine from the aerial photographs the extent of the debris-flow paths.
Figure 5. Structures destroyed by debris flows behind hospital at La Trinidad.
between 20° and 27°) of erosion-resistant flow units within the ignimbrite of the Coyol Superior Group (unit Tpci, plate 3; table 1). This unit also showed the highest susceptibility index (table 1). Landslides also initiated on gentler slopes within the basalt, agglomerate, and andesite, dacite and agglomerate of the Coyol Superior Group (units Tpcb, Tpca, Tpcl), and the dacite, dacite ignimbrite and tuff of the Coyol Inferior Group (unit Tmcd, table 1).
9
La Fundadora�
The La Fundadora study area (fig. 1) is located in the southern extent of the
Departamento de Jinotega and the northern extent of the Departamento de Matagalpa, and in the Central Highlands physiographic province (Merrill, 1994). The study area covers approximately 215 km2, and is located 3-15 km east of the city of Jinotega (plate 4). Lago Apanás lies in the farthest northwest corner of the study area. Unpublished digital geologic data for the La Fundadora 1:50,000-scale quadrangle supplied by INETER shows that Tertiary-age volcanic materials and undifferentiated Quaternary-age alluvium and colluvium underlie the area. The geologic materials and geomorphic form of the study area can be divided into two distinct regions—the northwest half and the southeast half. The volcanic materials in the northwest region consist of agglomerate, andesitic lava, basalt, dacite, andesite, and rhyolite ignimbrite of the undifferentiated Coyol Group (unit Tpc), and dacite of the Coyol Inferior Group (unit Tmcd). The geomorphic form of the region consists of gently rolling upland plain bounded by steep fronts composed of erosion-resistant flow units, and gentler slopes that extend down to the Valle Dantalí east of Lago de Apanás. The upland plain tilts gently toward the northeast; elevations range between 1600 m in the southwest to approximately 1200 m in the north-east. Numerous small streams incised into the upland plain flow into the alluvium-filled Valle Dantalí. Geologic unit Tmmi-b (the lithology of this unit is not known) and a small section of the Coyol Superior Group basalts (unit Tpcb) underlie the southeast half of the study area. A dendritic and sinuous network of small streams has incised into these materials, resulting in a steep, rugged topography. Elevations range between 1200 and 1500 m. Numerous small villages and single dwellings are scattered throughout the entire study area. A primary paved highway crosses through the southwest corner of the study area, and a secondary branch to this road extends into the interior.
During the period of 21 to 31 October 1998, the study area received between 700 and 800 mm of rainfall; a rain gauge located at Jinotega recorded
767 mm of rainfall, 1352% of the normal rainfall for the last 10 days of October (INETER, 1998).
We mapped 164 landslides in the 215-km2 study area from both aerial photographs and field reconnaissance (plate 4). Although the landslide activity in this study area was relatively sparse, roads, streams and structures were still impacted by these events. Wide variations in the size of landslides were observed in this area during the field reconnaissance. Debris flows initiated as landslides as small as a few square meters up to about 3000 m2
area, and between about 1 and 5 m depth. The debris flows traveled a few tens of meters to about 2 km downslope. Landslides such as those shown in figure 6 illustrate the broad range in landslide response in this area. In the northwest half of the study area most landslides initiated on steep fronts that bound the elevated plain. Although the density of landslides in the southeast region was considerably less than that in the northwest, the south-east landslides tended to be larger, and resultant debris flows traveled farther. For example, a group of landslides in the southeast corner of the study area initiated high on a hillslope and coalesced to form a debris flow that traveled downchannel for a total distance of about 2 km (plate 4). In addition to landslide activity, a 3-km-long reach of the Río Jigüina in the center of the study area shows evidence of significant Hurricane Mitch-related erosion and deposition along its banks (plate 4).
We mapped a large, slow-moving earth flow complex along the road to Jinotega (Highway 3), approximately 3.5 km from the southern map boundary, during the field reconnaissance (plate 4; fig. 7). An arcuate headscarp and lateral scarps nearly 2 m high bounded an area of broken ground about 6 km2 in area. The road that crosses this feature was under extensive repair. We observed active seepage on the south end of the slope below the road. This landslide originated at the break in slope between the steep upper hillslopes and the colluvial apron below.
In this study area, geologic unit Tmmi-b (of unknown lithology) was two times more susceptible to landslide activity than was the assortment of volcanic materials that are included in the undifferentiated Coyol Group (unit Tpc, table 1). The materials of the undifferentiated Coyol Group were nearly 10 times more susceptible to landslide
10

activity than the dacite of unit Tmcd (table 1). Other geologic units in this study area did not produce landslides. During field reconnaissance we observed that landslide scars most commonly occurred in areas of weathered and/or hydrothermally altered materials. In addition, depth of scars appeared to be controlled by depth of weathered mantle; very shallow landslides occurred where the weathered mantle was thin, and scars up to
and off of plate 5, 8 km west of Matagalpa. Unpublished geologic mapping of the 1:50,000-scale quadrangle by R.L. Williams shows that Tertiary-age volcanic materials and undifferentiated Quaternary-age alluvium and colluvium under-lie the area. The volcanic materials include agglomerate and/or andesite, andesite ignimbrite, dacite ignimbrite, tuff, agglomerate, and breccia of the Coyol Inferior Group [units Tmca, Tmcd(A),
several meters deep developed in areas where the weathered mantle was several meters thick.
Tmcd and Tmcd(Ag)] overlain by basalt, andesite, ignimbrite and tuff of the Coyol Superior Group (units Tpcb and Tpci). The Coyol Superior basalt and andesite ignimbrite and agglomerate of the Coyol Inferior Group underlie the steepest hill-slopes in the area. The present-day fluvial network drains into Río De Matagalpa from both the north and south. Numerous small villages and single dwellings are scattered throughout the area. A primary paved highway crosses through the center of the study area from east to west to the city of Matagalpa, where it turns to the
Figure 6. Landslides along the road to Jinotega in the La Fundadora study area showing broad scale of response. (A) A failure less than 1 m deep and about 40 m 2 in area. Material from the failure traveled approximately 20 m over an open hillslope. (B) An approximately 5-m-deep failure into weathered material. This landslide was approximately 3000 m 2 in area and traveled at least 100 m down a channel.
(A)
(B)
Matagalpa�north. A secondary improved branch to this road
The Matagalpa study area (fig. 1) is located extends from Matagalpa through San Ramón. in the Departamento de Matagalpa, and in The map of Hurricane Mitch rainfall totals
the Central Highlands physiographic province shows that during the period of 21 to 31 October (Merrill, 1994). The study area covers approxi- 1998, the area received between 500 and 700 mm mately 220 km2, and the city of Matagalpa lies of rainfall (INETER, 1998). nearly in its center (plate 5). The town of San We mapped 283 landslides throughout the Ramón is located just to the west of the study area Matagalpa study area from both aerial photo-
11
scars appeared to be controlled by depth of weathered mantle; very shallow landslides occurred where the weathered mantle was thin, and scars up to several meters deep developed in areas where weathered mantle was several meters thick.
A 4- to 5- km-wide corridor along the highway leading north out of Matagalpa was particularly impacted by landslide activity; numerous landslides occurred both in highway cut slopes and on natural slopes in the corridor. In addition, Río Molino Norte, which parallels the highway in
Figure 7. Deep-seated, slow-moving earth flow on road the northern part of the study
to Jinotega. The road crossing this feature was disrupt- area, showed significant erosion and deposition
ed in many places and was under extensive repair. along its length. We also mapped numerous landslides along
graphs and field reconnaissance (plate 5). Most roads east of Matagalpa during our field reconlandslides occurred on steeper (20° to 27°) hill- naissance. The westernmost debris flow mapped slopes underlain by basalt and andesite of the on the northern road initiated approximately 20 m Coyol Superior Group (unit Tpcb); this unit also from the ridgecrest and traveled across the high-showed the highest susceptibility (table 1). way and down a drainage, where it was reported Undifferentiated Quaternary-age alluvium and col- to have killed at a person in the village of San luvium also showed a similar susceptibility index. Francisco (fig. 8). The easternmost landslide Because all of the landslides mapped in the undif- mapped on the road east of La Rema formed a ferentiated Quaternary unit occurred on hillslopes headscarp approximately 5 m high, and failed we assume that they initiated within hillslope- material stepped downslope in a series of scarps. mantling colluvium. The ignimbrite and tuff of the The landowner reported that this feature devel-Coyol Superior Group (unit Tpci), and the dacite oped during Hurricane Mitch and has continued to ignimbrite and tuff (unit Tmcd), the andesite ign- move since. imbrite [unit Tmcd(A)], and agglomerate and/or An earth flow that developed within a pasture at andesite (unit Tmca) of the Coyol Inferior Group San Simón de Palcila (northwest part of study also showed some susceptibly to landsliding (table area) was visited during the field reconnaissance 1). The breccia and agglomerate [unit Tmcd(Ag)] (figs. 10 and 11). Movement on the earth flow has of the Coyol Inferior Groups showed the lowest destroyed one house and a church. The earth flow susceptibility (table 1). is about 40 m across, 200 m long, with the hum-
Most of the debris flows initiated as landslides mocky topography and the distinct lateral ridges of up to a few tens of meters in area, 1 to 5 m in diagnostic of earth flows. The farmers whose depth, and traveled tens of meters downslope. house was destroyed reported that the first move-Debris flows that moved into well-developed ment on the earth flow occurred during Hurricane channels traveled the farthest, up to 2 km in one Mitch, but the most significant movement has case. During the field reconnaissance we observed occurred over a long time period since the hurrithat landslide scars most commonly occurred in cane. This earth flow occurred within an apron of areas of weathered and/or hydrothermally altered deposits that line the ridge. The deposits show evimaterials (figs. 8 and 9). In addition, depth of dence of movement by landsliding in the past.
12

the study area. Undifferentiated Quaternary-age alluvium and colluvium are mapped in the primary drainages. Río Las Manos drains the northeast corner of the study area and flows toward the southeast into the town of Dipilto. Ríochuelo Sipilde drains the remainder of the study area and flows from the northeast to the southwest. The topography is steep and rugged, and elevations range between about 800 m in the river valleys to 1400 m in the highlands along the border with Honduras. Numerous small villages and single dwellings are scattered throughout the area. Paved highways parallel Río Las
Figure 8. Headscarp of landslide that produced a debris flow that trav- Manos and the Ríochuelo Sipilde, and
eled through the village of San Francisco, killing one person. Note an additional road extends north-south
deep weathering profile in approximately 5-m-high head scarp. along the western study area boundary.
Although Río Molino Norte shows evidence of During the period of 21 to 31 October 1998, the significant Hurricane Mitch-related flooding and area received between 550 and 600 mm of rainfall. transport of material in the reach north of A rain gauge located at Ocotal, about 10 km south Matagalpa, we could not discern these effects in of the town of Dipilto, received 560 mm of rain-the channel through Matagalpa from aerial photo- fall, 1394% of the normal rainfall for the last graphs. 10 days of October (INETER, 1998).
We mapped 457 landslide initiation locations
Dipilto� in the 150-km2 area (plate 6). The landslides vary considerably in size; scars range in area from as
The Dipilto study area (fig. 1) is located in the Departamento de
Nueva Segovia, and in the Central Highlands physiographic province (Merrill, 1994). The study area covers approximately 150 km2, and is located between 2 and 13 km west of the town of Dipilto in northern Nicaragua along the border with Honduras (plate 6). Unpublished digital geologic data of the 1:50,000-scale Dipilito quadrangle supplied by INETER shows that Cretaceous-age granite and granodiorite (unit Ka) and phyllite schist and other metamorphic rocks (unit Ptm) underlie most of the area. A small area of Tertiary conglomerate in the Totogalpa Formation (unit Tot, lithology unknown) Figure 9. Headscarp (approximately 8 m high) of landslide in deeply is mapped in the far southwest corner of weathered materials in northern Matagalpa study area.
13

Figure 10. Toe of the earth flow at San Simón de Palcila. House on the left was destroyed by movement on the earth flow. An active lobe of the earth flow is impinging on the house at the right.
Figure 11. View up slope of earth flow at San Simón de Palcila. Note the hummocky topography, large scarps and cracks in the foreground, and headscarp behind the cows.
higher-order streams it was not possible to determine a maxi-mum travel distance. In this study area decomposed granite and granodiorite (unit Ka) was about 13 times more susceptible to landslide activity than the metamorphic rocks (unit Ptm, table 1). No landslides were mapped in the Totogalpa Formation (unit Tot). During field reconnaissance we also observed that landslide scars most commonly occurred in areas of weathered and/or hydrothermally altered materials. In addition, depth of scars appeared to be controlled by depth of weathered mantle; very shallow landslides occurred where the weathered mantle was thin, and scars up to several meters deep developed in areas where the weathered mantle was several meters thick.
In addition to the numerous landslides, Hurricane Mitch rainfall also produced extreme runoff and associated erosion from hillslopes and channels (plate 6). We observed during field reconnaissance that granites and metamorphic rocks underlying the area are deeply decomposed, and most road cuts and hillslopes showed extreme rilling and erosion. Even channels of small tributaries showed evidence of significant erosion and transport of large
small as a few square meters up to about volumes of primarily sand- and gravel-sized mate-25,000 m2. During the field reconnaissance we rial. Higher order drainages showed broad, flat observed that smaller scars could be less than streambeds up to about 40 m wide, and we 0.5 m in depth, and we mapped debris flows that observed flood-water transported boulders up to traveled as little as a few tens of meters down- 5 m in diameter. Highways and roads in the area slope. Because most debris flows traveled into were severely damaged in this event.
14

Cinco Piños
The Cinco Piños study area (fig. 1) is located in the Departamento de Chinandega, and in
the Central Highlands physiographic province (Merrill, 1994). The study area covers approximately 60 km2, and is located in northwestern Nicaragua along the border with Honduras (plate 7). The town of Cinco Piños lies nearly in the middle of the study area. Paved roads cross east-west through the study area, through Cinco Piños and north from Cinco Piños to Honduras. Unpublished digital geologic data of the 1:50,000-scale Cinco Piños supplied by INETER shows that the area is underlain by Cretaceous-age granite and granodiorite (unit Ka), Tertiary-age Matagalpa Group and/or undifferentiated Coyol Inferior Group (unit Tmci). These units consist of pyroclastic flows, lahars, ignimbrite, andesite and basaltic lava, and agglomerate. A small area of andesite ignimbrite and agglomerate of the Coyol Inferior Group (unit Tmca) is mapped in the far northeast corner of the study area. The topography is steep and rugged; elevations range between 300 m along the river valleys to 700 m in the north of the study area. Quebrada las Lajitas flows toward the southeast from the town of Dipilto, Río el Gallo Quebrada los Canoas drains the eastern side of the study area, Quebrada la Carreta crosses the southwest corner of the study area, and Quebrada el Chaparral crosses the northeast corner of the study area. Numerous small villages and single dwellings are scattered throughout the area.
The map of Hurricane Mitch rainfall totals shows that during the period of 21 to 31 October 1998, the area received between 800 and 900 mm of rainfall (INETER, 1998).
This area was severely impacted by Hurricane Mitch rainfall; we mapped 1427 landslides within the 60-km2 area (plate 7). Although most debris flows did not appear to threaten people’s lives or structures, agricultural areas on steep slopes sustained significant damage. The landslides that we mapped ranged in area from less than 100 m2 up to about 80,000 m2. Although most of the debris flows traveled only a few hundreds of meters down slopes or channels, some traveled up to a kilometer before entering a higher order drainage. In addition to landslide activity, Río el Gallo
Quebrada los Canoas, Quebrada la Carreta, and Quebrada el Chaparral all showed evidence of significant Hurricane Mitch-related erosion and deposition (plate 7).
Both decomposed granite and granodiorite of unit Ka and the volcanic materials included in the undifferentiated Matagalpa and Inferior Coyol Groups in unit Tmci showed very high landslide susceptibility indices (33 and 24, respectively, table 1). Unit Tmca did not produce landslides in this study area.
During field reconnaissance we observed numerous landslide scars from previous events, indicating that the Hurricane Mitch-triggered land-slides were not a unique phenomenon in this area.
Summary, Conclusions, and Recommendations
We have presented maps of seven study areas in Nicaragua that show landslides
and related downstream effects triggered by the passage of the storm of record, Hurricane Mitch, 21 to 31 October 1998. The inventories, made by transferring information from 1:60,000-scale aerial photographs manually to 1:50,000- and 1:25,000-scale base maps and limited field checking, document the broad range in both processes and magnitudes of the landslide response. Most (perhaps 95%) of the landslides mapped were debris flows. We mapped debris-flow source areas as small as a few square meters and only a few meters deep that produced debris flows that traveled only tens of meters downslope, and we mapped landslides that covered up to approximately 80,000 m2 that produced debris flows that traveled a minimum of 3 km down channels. These fast-moving, highly destructive landslides killed people and livestock, destroyed bridges, roads, homes and other structures, and inundated agricultural lands. We also mapped slow-moving earth flows that started moving during Hurricane Mitch and continued to move for at least one year after, commonly destroying structures and impacting agricultural lands.
The study areas of El Sauce/San Nicolas and Cinco Piños, and parts of Sébaco/San Nicolas, Dipilto, and Matagalpa showed particularly exten-
15

sive landslide activity; landslides covered up to 80% of the terrain in places, and the impact to human lives, roads, bridges, and structures was considerable. Study areas La Fundadora and Jinotega/San Rafael del Norte, and parts of Sébaco/San Nicolas, Diplito, and Matagalpa, on the other hand, showed significantly lower concentrations of landslides. In addition, the El Sauce/San Nicolas and Cinco Piños study areas showed debris flows that initiated by numerous, small, closely-spaced landslides over an extensive area, while the other study areas showed fewer, and generally larger, landslides.
To examine relations between geologic units and landslide susceptibility, we calculated an index of landslide susceptibility for each geologic unit in each study area by dividing the number of landslide initiation locations within a particular unit by the areal extent of that unit in the study area. The indices identified those units most susceptible to landslide activity in each study area, given rainfall conditions similar to those of Hurricane Mitch. In the Jinotega/San Rafael del Norte study area, Quaternary-age hillslopemantling colluvium was the most susceptible to landslide activity. The dacite of the Coyol Inferior Group was the most susceptible to landslide activity in the El Sauce/San Nicolas study area, an ignimbrite of the Coyol Superior Group showed the highest susceptibility in the Sébaco/San Nicolas study area, unit Tmmi-b (lithology unknown) was the most susceptible in the La Fundadora study area, the basalt and andesite of the Coyol Superior Group and Quaternary colluvium were most sus-
Acknowledgments
ceptible in the Matagalpa study area, the decomposed granites and granodiorites of unit Ka were highly susceptible in the Dipilto area, and both the decomposed granites and granodiorites and the undifferentiated Matagalpa and Inferior Coyol Groups showed high susceptibilities in the Cinco Piños area. Because geologic units with the same unit names often include different lithologies in the different study areas, and because rainfall conditions varied between study areas, it is not possible to compare the landslide susceptibility indices between study areas.
During the field reconnaissance, we observed that landslides most often developed in areas of weathered and/or hydrothermally altered materials. In addition, depth of scars appeared to be con-trolled by depth of weathered mantle; very shallow landslides occurred where the weathered mantle was thin, and scars up to several meters deep developed in areas where the weathered mantle was several meters thick.
The work presented here provides a record of landslide activity in response to the storm of record over areas of diverse geology, geomorphology, microclimates, and vegetation in Nicaragua. To determine the sources of the variations in land-slide responses documented here, and to develop accurate and meaningful susceptibility maps, it is necessary to combine this record with information on the physical properties of hillslope-mantling materials (including the depth of weathering), hill-slope form and gradient, rainfall intensity and duration characteristics, and travel-distance behavior.
We greatly appreciate the graphics and layout expertise provided by Margo Johnson and Eleanor M. Omdahl, and the reviews of William Savage and Rex Baum. Richard Dart lent his skills to
the compilation of the digital data for final release.
16

References
Cruden, D.M. and Varnes, D.J., 1996, Landslide types and processes, in Turner, A.K., and Schuster, R.L., eds., Landslides — Investigations and mitigation: Transportation Research Board Special Report 247, p. 36-75.
Instituto Nicaragüense de Estudios Territoriales, INETER, 1998, Las Lluvias del Siglo en Nicaragua – El Huracán Mitch, las lluvias y otros eventos ciclónicos y su recurrencia en Nicaragua 1892-1998: Managua, Diciembre de 1998, 159 p.
Keefer, D.K., and Johnson, A.M., 1983, Earth flows — Morphology, mobilization and movement: U.S. Geological Survey Professional Paper 1264, 56 p., 3 plates.
Merrill, T.L., 1994, Nicaragua — A country study: Federal Research Division, Library of Congress, Area Handbook Series, 3rd edition, 300 p.
Pierson, T.C., and Costa, J.E., 1987, A rheologic classification of subaerial sediment-water flows, in Costa, J.E., and Wieczorek, G.F., eds., Debris flows/avalanches — Process, recognition, and mitigation: Geological Survey of America, Reviews in Engineering Geology, v. 7, p. 1-12.
Skempton, A.W., Leadbeater, A.D., and Chandler, R.J., 1989, The Mam Tor landslide, north Derbyshire: Philosophical Transactions of the Royal Society of London, A329, p. 503-547.
Varnes, D.J. 1978, Slope movement types and processes, in Schuster, R.L., and Krizek, R.J. eds., Landslides — Analysis and control: National Academy of Sciences, Transportation Research Board Special Report 176, p. 12-33.
17