Embed Size (px)
Citation preview
Page 1/8
p53 Promotes Ferroptosis in Macrophages Treatedwith Fe3O4 Nanoparticlescong WU ( [email protected] )
Yangzhou University Medical Academy https://orcid.org/0000-0003-0814-2049boyou zhang
Yangzhou University Medical Academy: Yangzhou University Medical collegezhiming shen
Yangzhou University School of Medicine: Yangzhou University Medical collegefei sun
Yangzhou University Medical Academy: Yangzhou University Medical collegeyi lu
Yangzhou University Medical Academy: Yangzhou University Medical collegelei yuan
Yangzhou University Medical Academy: Yangzhou University Medical collegeguozhong zhang
Yangzhou University Medical Academy: Yangzhou University Medical collegezhihao wang
Yangzhou University Medical Academy: Yangzhou University Medical collegehongcan shi
Yangzhou University Medical Academy: Yangzhou University Medical college
Research Article
Keywords: Fe3O4 nanoparticle, macrophage, polarization, ferroptosis, p53
Posted Date: March 30th, 2021
DOI: https://doi.org/10.21203/rs.3.rs-364453/v1
License: This work is licensed under a Creative Commons Attribution 4.0 International License. Read Full License
Page 2/8
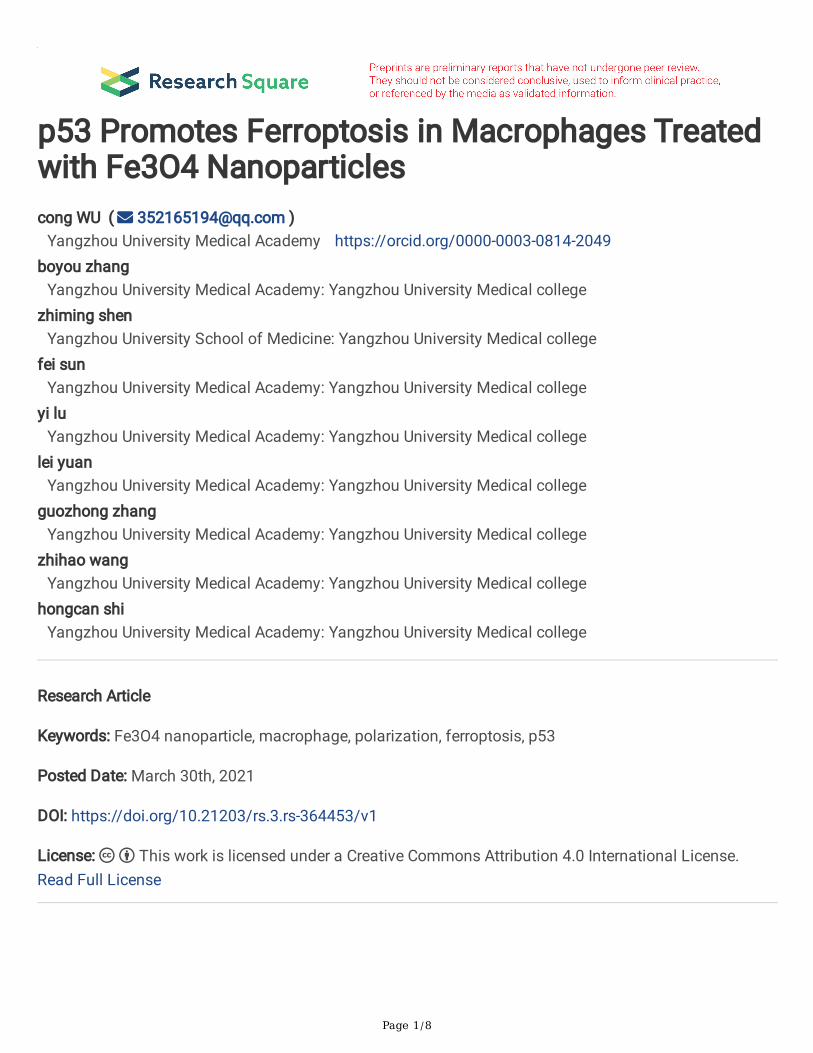
AbstractBackground: Fe3O4 nanoparticles (NPs, also known as iron oxide NPs; IONPs) have high biocompatibilityand low biotoxicity. They are widely used in the �eld of biotechnology for targeted delivery, imageformation, and photothermal therapy. NP biodistribution is determined by macrophage capture in vivo,and recently, the induction of macrophage polarization into the M1 phenotype by IONPs has become ahot topic in research. Previous research has shown that IONPs can induce ferroptosis of ovarian cancercells and ischemic cardiomyocytes. In this study, we exposed macrophages to synthesized Fe3O4 NPs(100 nm in diameter) and determined the effects of NPs in inducing cell death by RNA sequencing.
Results: We observed that after 48 h exposure to NPs, there was a change in the macrophage phenotypeand a reduction in cell viability. Then, we demonstrated that NPs could induce macrophage cell damageby increasing intracellular reactive oxygen species and by repressing the mitochondrial membranepotential. Furthermore, we investigated the underlying mechanisms of ferroptosis of macrophages usingRNA sequencing and change in ultrastructural morphology, and found that ferroptosis was caused by theupregulation of p53 expression and inhibition of SLC7A11 expression, as their protein levels after 48 hexposure to Fe3O4 NPs were consistent with erastin-induced ferroptosis.
Conclusions: These results provide an insight into the molecular mechanisms underlying ferroptosisinduced by Fe3O4 NPs in macrophages and provide a basis for the biotoxicity study of Fe3O4 NPs in vivo.
Full TextDue to technical limitations, full-text HTML conversion of this manuscript could not be completed.However, the manuscript can be downloaded and accessed as a PDF.
Figures
Page 3/8
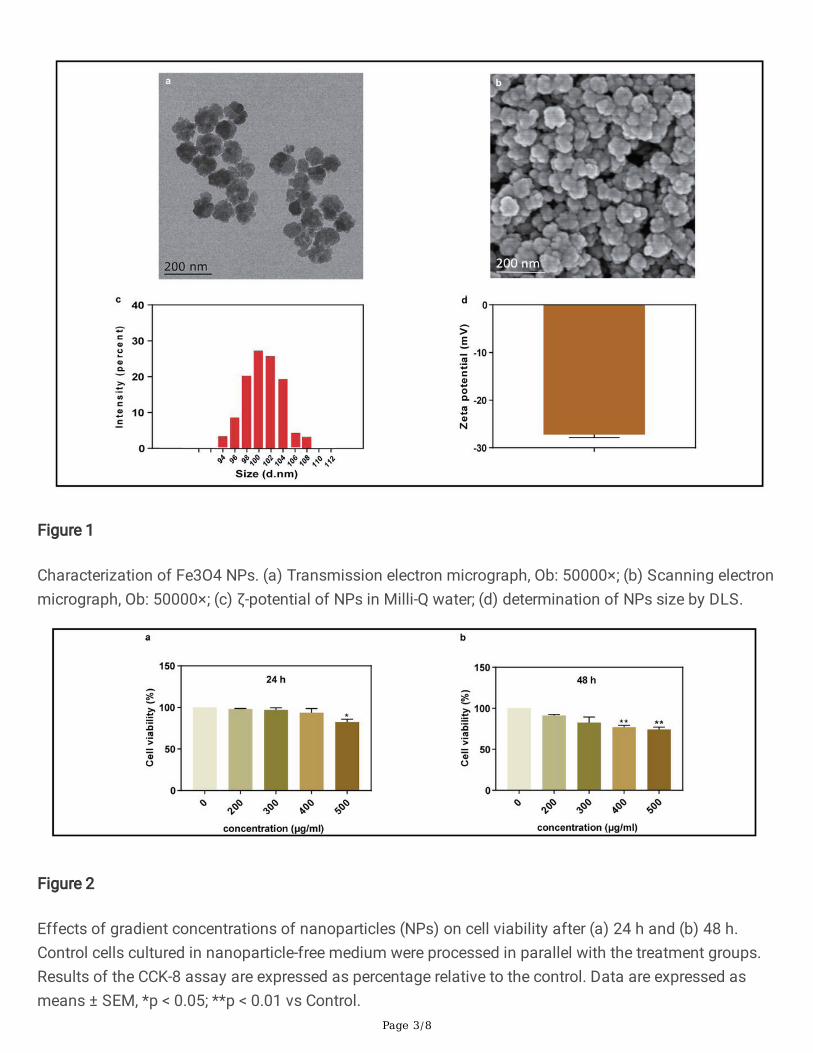
Figure 1
Characterization of Fe3O4 NPs. (a) Transmission electron micrograph, Ob: 50000×; (b) Scanning electronmicrograph, Ob: 50000×; (c) ζ-potential of NPs in Milli-Q water; (d) determination of NPs size by DLS.
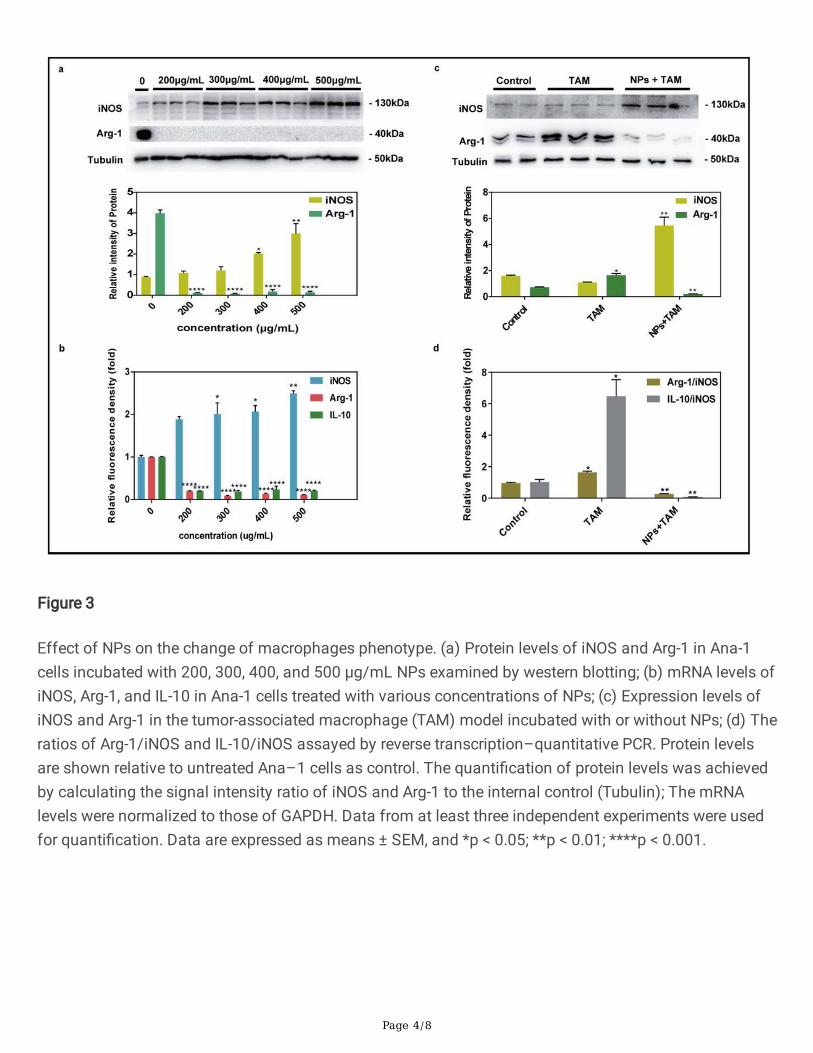
Figure 2
Effects of gradient concentrations of nanoparticles (NPs) on cell viability after (a) 24 h and (b) 48 h.Control cells cultured in nanoparticle-free medium were processed in parallel with the treatment groups.Results of the CCK-8 assay are expressed as percentage relative to the control. Data are expressed asmeans ± SEM, *p < 0.05; **p < 0.01 vs Control.
Page 4/8
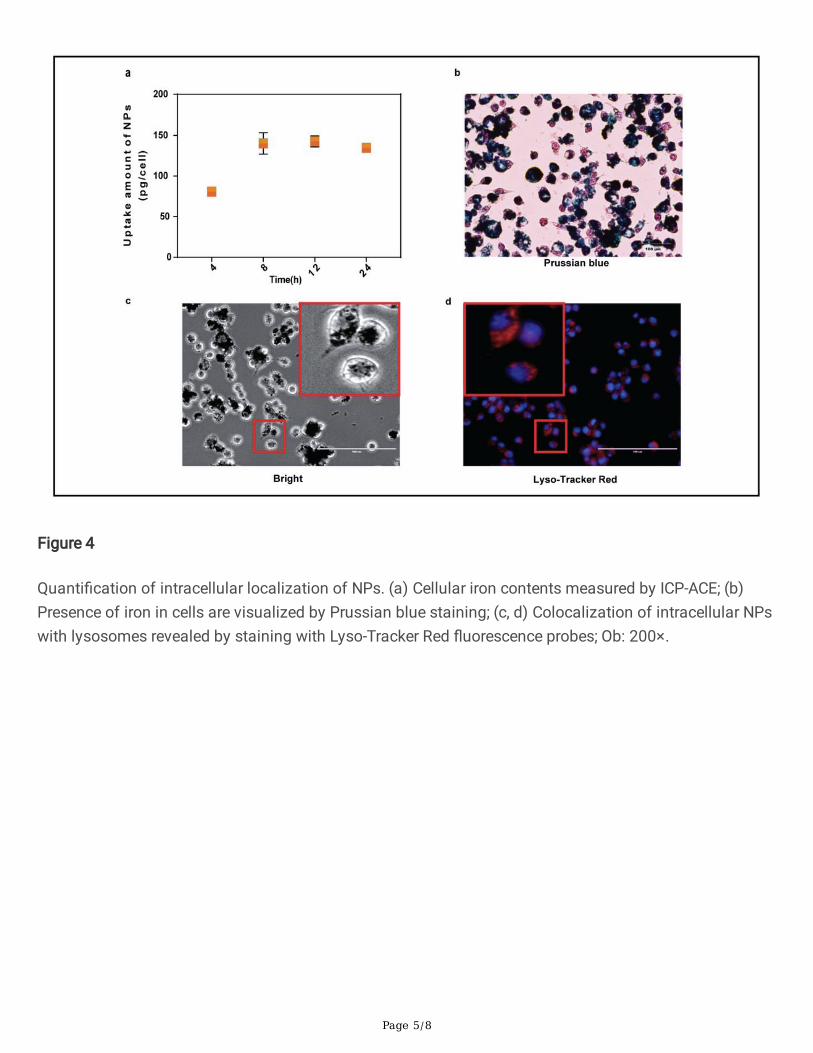
Figure 3
Effect of NPs on the change of macrophages phenotype. (a) Protein levels of iNOS and Arg-1 in Ana-1cells incubated with 200, 300, 400, and 500 μg/mL NPs examined by western blotting; (b) mRNA levels ofiNOS, Arg-1, and IL-10 in Ana-1 cells treated with various concentrations of NPs; (c) Expression levels ofiNOS and Arg-1 in the tumor-associated macrophage (TAM) model incubated with or without NPs; (d) Theratios of Arg-1/iNOS and IL-10/iNOS assayed by reverse transcription–quantitative PCR. Protein levelsare shown relative to untreated Ana–1 cells as control. The quanti�cation of protein levels was achievedby calculating the signal intensity ratio of iNOS and Arg-1 to the internal control (Tubulin); The mRNAlevels were normalized to those of GAPDH. Data from at least three independent experiments were usedfor quanti�cation. Data are expressed as means ± SEM, and *p < 0.05; **p < 0.01; ****p < 0.001.
Page 5/8
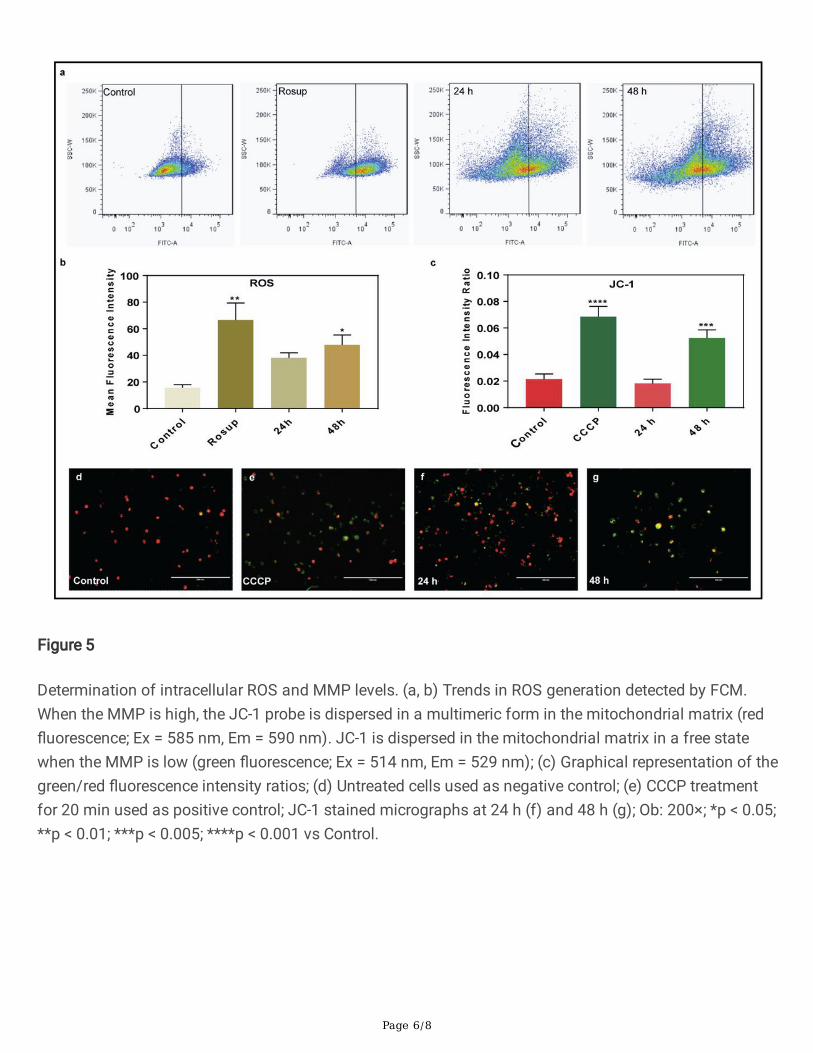
Figure 4
Quanti�cation of intracellular localization of NPs. (a) Cellular iron contents measured by ICP-ACE; (b)Presence of iron in cells are visualized by Prussian blue staining; (c, d) Colocalization of intracellular NPswith lysosomes revealed by staining with Lyso-Tracker Red �uorescence probes; Ob: 200×.
Page 6/8
Figure 5
Determination of intracellular ROS and MMP levels. (a, b) Trends in ROS generation detected by FCM.When the MMP is high, the JC-1 probe is dispersed in a multimeric form in the mitochondrial matrix (red�uorescence; Ex = 585 nm, Em = 590 nm). JC-1 is dispersed in the mitochondrial matrix in a free statewhen the MMP is low (green �uorescence; Ex = 514 nm, Em = 529 nm); (c) Graphical representation of thegreen/red �uorescence intensity ratios; (d) Untreated cells used as negative control; (e) CCCP treatmentfor 20 min used as positive control; JC-1 stained micrographs at 24 h (f) and 48 h (g); Ob: 200×; *p < 0.05;**p < 0.01; ***p < 0.005; ****p < 0.001 vs Control.
Page 7/8
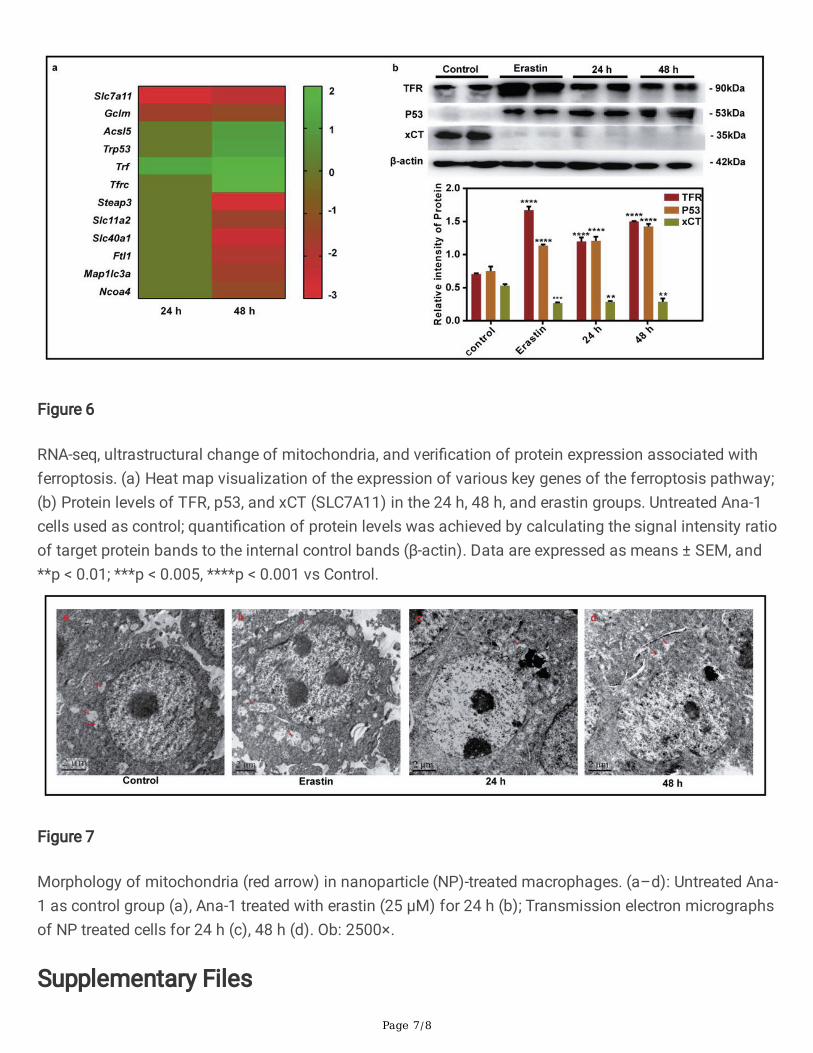
Figure 6
RNA-seq, ultrastructural change of mitochondria, and veri�cation of protein expression associated withferroptosis. (a) Heat map visualization of the expression of various key genes of the ferroptosis pathway;(b) Protein levels of TFR, p53, and xCT (SLC7A11) in the 24 h, 48 h, and erastin groups. Untreated Ana-1cells used as control; quanti�cation of protein levels was achieved by calculating the signal intensity ratioof target protein bands to the internal control bands (β-actin). Data are expressed as means ± SEM, and**p < 0.01; ***p < 0.005, ****p < 0.001 vs Control.
Figure 7
Morphology of mitochondria (red arrow) in nanoparticle (NP)-treated macrophages. (a–d): Untreated Ana-1 as control group (a), Ana-1 treated with erastin (25 μM) for 24 h (b); Transmission electron micrographsof NP treated cells for 24 h (c), 48 h (d). Ob: 2500×.
Supplementary Files

Page 8/8
This is a list of supplementary �les associated with this preprint. Click to download.
GraphicalAbstract.pdf
SupplementaryMaterial.pdf