Embed Size (px)
Citation preview

A G R I C U L T U R A L A N D F O O D S C I E N C E
Vol. 18 (2009): 76–90.
76
A G R I C U L T U R A L A N D F O O D S C I E N C E
Vol. 18 (2009): 76–90.
77
© Agricultural and Food Science Manuscript received December 2006
Winter triticale yield formation and quality affected by N rate, timing and splitting
Maarika Alaru1, Ülle Laur1 , Viacheslav Eremeev1, Endla Reintam2, Are Selge1, Merrit Noormets1
1 Department of Field Crops and Grasslands, Institute of Agricultural and Environmental Sciences, Estonian University of Life Sciences, Kreutzwaldi 1A, 51014 Tartu, Estonia
2Department of Soil Science and Agrochemistry, Institute of Agricultural and Environmental Sciences, Estonian University of Life Sciences, Kreutzwaldi 1A, 51014 Tartu, Estonia
The field experiment was conducted to study the effects different nitrogen (N) quantities (N0–120 kg ha-1) and application regimes (N applied at stages of tillering BBCH28–30 and flag leaf sheath opening BBCH47) on (i) the formation of winter triticale above ground biomass (AGB), (ii) the grain yield (iii) the yield quality, and also (iiii) to find more suitable N fertilizing regimes for winter triticale depending on their utilization. Winter rye and winter wheat were used as reference crops.
The efficiency of applying all N at the tillering stage (N100%+N0) was the highest for the grain yield of triticale. N application at development stage of plants BBCH47 increased the grain protein concentra-tion significantly and the increase by 1 kg N was the highest in triticale cultivars. More stabile grain yield was produced by triticales in application regime N+N. N splitting did not influence significantly either the duration of the grain-filling period or the dry matter accumulation rate of triticale. N splitting affected Hagberg falling number (HFN) indirectly through the effect on the grain yield formation and grain protein concentration. HFN was positively correlated with the grain yield and negatively with the grain protein concentration. The suitable N regimes are: 1) triticale as the energy plant – N60+N0 – N applied at the tillering stage of plants and suitable N norm is not more than 60 kg N ha-1; 2) triticale as a feed or food – N60+N60 – High grain yield, protein and lysine concentration level are assured then.
Key-words: nitrogen rate, timing and splitting, triticale, cultivar, energy plant

A G R I C U L T U R A L A N D F O O D S C I E N C E
Vol. 18 (2009): 76–90.
76
A G R I C U L T U R A L A N D F O O D S C I E N C E
Vol. 18 (2009): 76–90.
77
Introduction
The fertilizing regime affects the formation of dif-ferent crops above ground biomass (ABG), the grain yield level and the grain yield quality. The influence of splitting application of nitrogen (N) on several cereals yield quality has investigated quite well. For example Garrido-Lestache and coworkers (2005) found that the timing and splitting of N fertilizer had no clear effect on either durum wheat (Triticum turgidum L.) grain yield or quality indices. Leaf ap-plication of N at ear emergence increased only grain protein concentration, vitreous kernel count and grain ash content. The response of grain yield and grain protein concentration to fertilizer N differed from that reported for temperate climates.
In intensive farming systems, farmers split up and apply the N fertilization to winter cere-als (barley and wheat) and oilseed rape at several dates to meet the need of the crop more precisely (Sieling and Beims 2007). All three crops utilized the splitting rates differently depending on the time of application. Uptake of N derived from the first N rate applied at the beginning of spring growth was poorer than that from the second splitting rate applied at stem elongation or third splitting rate applied at ear emergence or bud formation. In con-trast, N applied later in the growing season was taken up more quickly, resulting in higher fertilizer N-use efficiency.
The effects of nitrogen (N) applications on Hungarian, French and Serbian winter wheat cul-tivars were studied from 1996 to 2003 in a central Hungarian region. Different N fertilizer rates were applied at the tillering phase and after anthesis. The increasing N top dressing rate and its divi-sion resulted in an outstanding quality despite the unfavourable ecological circumstances. Nitrogen top dressing stabilized the falling number values (Szentpétery et al. 2005).
Nitrogen could act through delaying the matu-ration of the grain (Gooding et al. 1986), by in-creasing the grain drying rate (Kettlewell 1999), or by reducing grain size and affecting morphol-ogy (Clarke et al. 2004). Delayed maturation of grains in humid local conditions increases the risk
to pre-harvest sprouting and low Hagberg falling number (HFN) values (Santiveri et al. 2002, Clarke et al. 2004). One of the most limiting factors for the seasonal development of triticale in cool and humid climatic conditions is the plant’s sensitiv-ity to sprouting. Yield losses due to lodging and pre-harvest sprouting caused by the application of large amounts of nitrogen fertilizer as an early single dressing are quite usual. Possible ways to avoid lodging are either by moderate fertilizing or by dividing the N fertilizer application into parts and applying them at different plant development stages (Sticksel et al. 1999). A number of experi-ments in winter cereals have shown that adjusting fertilizer rate and splitting of N fertilizer application are strategies to improve nitrogen use efficiency (NUE; Alcoz et al. 1993, Sieling et al. 1998, Lopes-Bellido et al. 2006, Subedi et al. 2007, Arregui and Cuemada 2008). The timing of application has a significant effect on the N uptake by the crop (Dilz 1988). Low efficiency attributed to N fertilizer ap-plication in autumn has been observed in a large number of studies, and justifies N applications in spring (Sowers et al. 1994, Ottman et al. 2000). Supplying N in two or three applications in spring is a common fertilizer recommendation to increase NUE in temperate Europe (Limaux et al. 1999).
There are many possibilities of using for differ-ent triticale cultivars, for example, as food (triticale flour blended with wheat flour), as feed for pigs and poultry, as energy plants (above ground biomass for fuel or grain yield for ethanol). Annual crops cultivated as an alternative energy source, such as wheat, rye or triticale, are easy to rotate in the crop cycle, and do not require the farmer to make any substantial investment. Whatever the proposed end usage of the crop cultivation, fertilization and har-vesting techniques are essential to ensure optimal use of resources (Lund 1999). The production of a grain crop as a biofuel proved to be competitive compared to cultivation of other crops, so long as the ABG attained 10 t ha-1 (Bewa 1998). However, the identification of cereal species and varieties with high biomass yield, high combustibility, low ash content and low potential for boiler corrosion, remains an on-going priority.
A G R I C U L T U R A L A N D F O O D S C I E N C E
Alaru M. et al. Splitting of nitrogen for winter triticale
78
A G R I C U L T U R A L A N D F O O D S C I E N C E
Vol. 18 (2009): 76–90.
79
Winter triticale (X. Triticosecale Wittmack) is quite new crop in Baltic States and little informa-tion is available about triticale yield stability in very changeable weather conditions found here, about possibilities to decrease the fluctuations of grain yield quantity and quality, and above ground bio-mass formation affected by splitting the application of N fertilizer. Field experiments were conducted to investigate the effects of different N quantities and application regimes on (i) the formation of winter triticale AGB, (ii) grain yield and (iii) yield quality (protein and lysine concentration, test weight, grain moisture content during grain filling period, crop maturation and HFN), and also (iiii) to discover more suitable N fertilizing regimes for different triticale cultivars depending on their utilization.
Material and methods
Field trial, experimental detailsThe experimental field trial was carried out in 2001/02, 2002/03 and 2003/04 at the Institute of Ag-ricultural and Environmental Sciences of Estonian University of Life Sciences near Tartu (58°23´N, 26°44´E) on Stagnic Luvisol (WRB 1998 classifi-cation) soil (sandy loam surface texture, organic matter 2.1%, pHKCl 6.0).
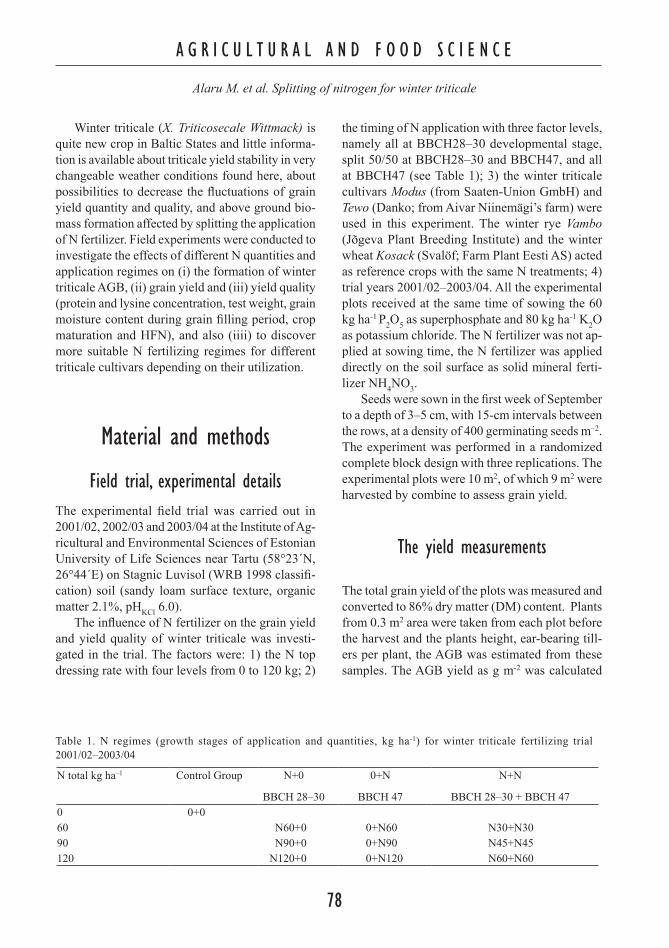
The influence of N fertilizer on the grain yield and yield quality of winter triticale was investi-gated in the trial. The factors were: 1) the N top dressing rate with four levels from 0 to 120 kg; 2)
the timing of N application with three factor levels, namely all at BBCH28–30 developmental stage, split 50/50 at BBCH28–30 and BBCH47, and all at BBCH47 (see Table 1); 3) the winter triticale cultivars Modus (from Saaten-Union GmbH) and Tewo (Danko; from Aivar Niinemägi’s farm) were used in this experiment. The winter rye Vambo (Jõgeva Plant Breeding Institute) and the winter wheat Kosack (Svalöf; Farm Plant Eesti AS) acted as reference crops with the same N treatments; 4) trial years 2001/02–2003/04. All the experimental plots received at the same time of sowing the 60 kg ha-1 P2O5 as superphosphate and 80 kg ha-1 K2O as potassium chloride. The N fertilizer was not ap-plied at sowing time, the N fertilizer was applied directly on the soil surface as solid mineral ferti-lizer NH4NO3.
Seeds were sown in the first week of September to a depth of 3–5 cm, with 15-cm intervals between the rows, at a density of 400 germinating seeds m–2. The experiment was performed in a randomized complete block design with three replications. The experimental plots were 10 m2, of which 9 m2 were harvested by combine to assess grain yield.
The yield measurements
The total grain yield of the plots was measured and converted to 86% dry matter (DM) content. Plants from 0.3 m2 area were taken from each plot before the harvest and the plants height, ear-bearing till-ers per plant, the AGB was estimated from these samples. The AGB yield as g m-2 was calculated
N total kg ha–1 Control Group N+0
BBCH 28–30
0+N
BBCH 47
N+N
BBCH 28–30 + BBCH 470 0+060 N60+0 0+N60 N30+N3090 N90+0 0+N90 N45+N45120 N120+0 0+N120 N60+N60
Table 1. N regimes (growth stages of application and quantities, kg ha-1) for winter triticale fertilizing trial 2001/02–2003/04

A G R I C U L T U R A L A N D F O O D S C I E N C E
Alaru M. et al. Splitting of nitrogen for winter triticale
78
A G R I C U L T U R A L A N D F O O D S C I E N C E
Vol. 18 (2009): 76–90.
79
at 14% moisture content. Lodging was estimated only in 2004. For lodging estimation was used the 9 points scale, where 9 point means, that cultivar stands very well and 1 point, that plants were lodged entirely. Samples of 10 spikes from each cultivar were collected every 3–4 days during the seed-filling period, to establish the seed DM content. Five kernels were sampled from external flowers of the middle spikelets of each spike, i.e. a total of 50 kernels from each cultivar. The grains were oven-dried at 70 °C for 48 hours to calculate their dry weight. Since physiological maturity (PM) is defined as maximum kernel dry weight, the PM stage for each crop could be determined; but the moisture content level at PM of 30–45% is too high for combine harvesting, the best level being 20–25%.
Chemical analyses
Hagberg Falling Number (HFN; CC Standard nr. 107) and grain protein concentration from each treatment were measured (Tecator Kjeltec apparatus, N × 6.25), and the lysine concentration (98/68/EC HPLC UV) of grains of winter triticale Tewo har-vested in 2002 and 2003 from treatments N0+N0, N0+N120, N60+N60, N120+N0 was calculated. The winter wheat Kosack harvested in 2003 was used as a reference crop.
Weather conditions
The meteorological station in Eerika, near the trial field, supplied the weather data. The temperature and precipitation data from May up to August are presented, because in local conditions the winter cereals post-hibernation vegetation period continues during this period. The temperature and precipitation data varied remarkably year to year during the trial (see Table 2). The 2002 temperature data for the post-hibernation growth period was much higher and the precipitation amount was much lower than the long-term average. The temperatures in 2003 from the beginning of May to the second week of July (plant development stages BBCH30–70) were lower than the long-term average and therefore plants matured very slowly. The temperatures in 2004 were similar to the long-term average. There was above average precipitation in both 2003 and 2004. The total amount of precipitation from May to the end of August for both 2003, 420 mm, and 2004, 475 mm, was higher than the long-term aver-age, which was 311 mm.
Data recording and statistical analyses
The trial data were processed using correlation and variance analyses and descriptive statistics (STATIS-TICA 8). The means are presented with their standard
Month The temperature (ºC) The precipitation (mm)
Year 2002
Year 2003
Year 2004
Long-term average
Year 2002
Year 2003
Year 2004
Long-term average
May 13.9 11.7 12.6 11.3 15 142 34 57
June 16.5 12.9 13.4 15.4 81 71 212 79
July 20.1 19.4 17.0 17.3 45 104 113 81
August 19.2 15.3 17.0 16.0 22 133 116 94
Source: Eerika Meteorological Station
Table 2. The temperature (ºC) and the precipitation data (mm) in 2002–2004 (for the post-hibernation growth period)

A G R I C U L T U R A L A N D F O O D S C I E N C E
Alaru M. et al. Splitting of nitrogen for winter triticale
80
A G R I C U L T U R A L A N D F O O D S C I E N C E
Vol. 18 (2009): 76–90.
81
errors (±S.E.). The level of the significance p<0.05, 0.01 and 0.001 was calculated in all cases. If the data are given as an average of trial years, then TYAv is used. The coefficient of determination (R2) is used to measure the significance, relative importance and ordinal effect of the factors (cultivars, the trial year, N rate and application time; Draper and Smith 1998, Everitt 2002). R2 compares the explained variance (variance of the model’s predictions) with the total variance of the data.
Nitrogen use efficiency (NUE) or increase of above ground yield and grain yield (kg kg-1 N) was calculated: NUEAGB and NUEYIELD, respectively. Different NUE were calculated according to the formulas:
(1)
where AGBNX is AGB (kg ha-1) from fertilized treatments and NX is N input quantity (kg N ha-1; N60, N90 or N120), AGBN0 is the biomass from control group N0+N0;
(2)
where YIELDNX is grain yield (kg ha-1) from N fertilized treatments and YIELDN0 is grain yield from control group.
Nitrogen uptake efficiency NUPE or increase of grain protein concentration (mg in 100 g DM-1 kg N) was calculated according to the formula:
(3)
where PROTNX is grain protein concentration (mg in 100 g DM) in N fertilized treatments and PROTN0 is grain protein concentration in control group.
Results
The trial year had the greatest effect on different agronomic traits from all trial factors studied, but the effect of N quantities was not significant. If the quantities of N fertilizer would have been higher then probably the effect of quantities would have become evident. But, the other hand, it revealed from our earlier studies that N fertilizer quantities greater than 60 kg ha–1 applied in plant tillering stage did not increase the grain yield of winter triticale cultivars significantly, in turn, the risk to lodging increased remarkably. Hereinafter the R2 values are presented to illustrate the relative importance of different factors.
Influence of different N quantities and application regimes on lodging
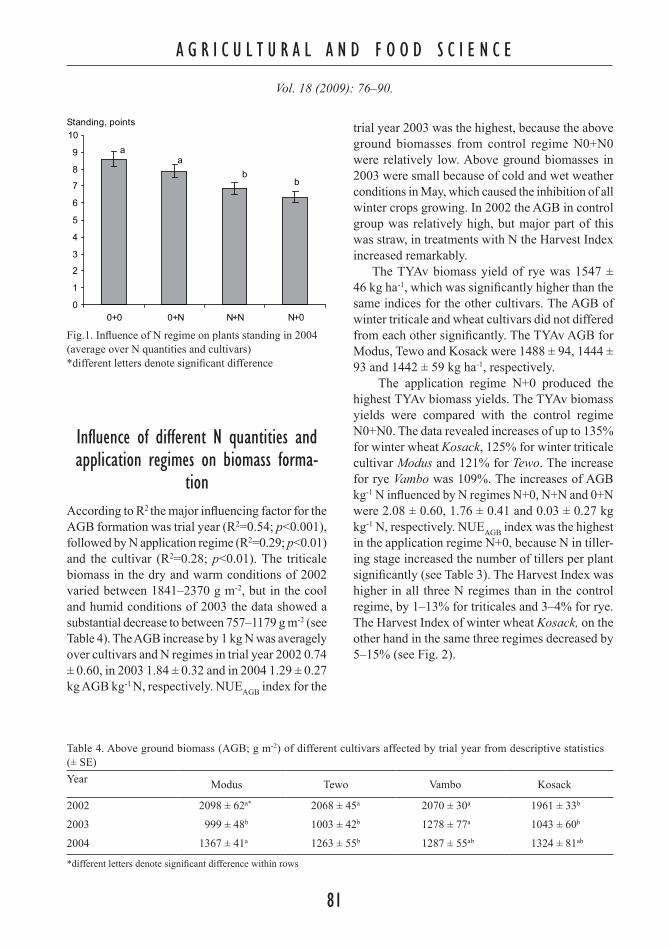
One of the aims of the divided N fertilizer application was to prevent lodging. N application at BBCH47 increased the tolerance to lodging (R2=0.22; p<0.05), because of the shorter stems of the triticale plants (R2=0.29; p<0.01). Supplements of N in early spring will support tillering and ear density and therefore will make the crop more susceptible to lodging (see Table 3). In this trial the lodging happened only in wet 2004, when plants in treatments fertilized with N lodged more or less (see Fig. 1).
AGBNX – AGBN0 NUEAGB (kg kg-1 N) = NX
,
YIELDNX – YIELDN0 NUE YIELD (kg kg-1 N) = NX
,
PROTNX –PROTN0 NUPE (mg in100 g DM-1 kg N) = , NX N regime Plant height
(cm)Number of ear-bearing
tillers per plantN+0* 107 ± 2.8a** 2.6 ± 0.09a
N+N 105 ± 3.0a 2.3 ± 0.10b
0+N 99 ± 3.2b 2.0 ± 0.11c
*N+0 – all N applied at BBCH28–30 N+N – half of total N amount applied at BBCH28–30 and the other half at BBCH470+N – all N applied at BBCH47 ** different letters denote significant difference
Table 3. Plant height and number of ear-bearing tillers per plant affected by N regime from descriptive statis-tics (± S.E.)
A G R I C U L T U R A L A N D F O O D S C I E N C E
Alaru M. et al. Splitting of nitrogen for winter triticale
80
A G R I C U L T U R A L A N D F O O D S C I E N C E
Vol. 18 (2009): 76–90.
81
Influence of different N quantities and application regimes on biomass forma-
tionAccording to R2 the major influencing factor for the AGB formation was trial year (R2=0.54; p<0.001), followed by N application regime (R2=0.29; p<0.01) and the cultivar (R2=0.28; p<0.01). The triticale biomass in the dry and warm conditions of 2002 varied between 1841 –2370 g m-2, but in the cool and humid conditions of 2003 the data showed a substantial decrease to between 757–1179 g m-2 (see Table 4). The AGB increase by 1 kg N was averagely over cultivars and N regimes in trial year 2002 0.74 ± 0.60, in 2003 1.84 ± 0.32 and in 2004 1.29 ± 0.27 kg AGB kg-1 N, respectively. NUEAGB index for the
trial year 2003 was the highest, because the above ground biomasses from control regime N0+N0 were relatively low. Above ground biomasses in 2003 were small because of cold and wet weather conditions in May, which caused the inhibition of all winter crops growing. In 2002 the AGB in control group was relatively high, but major part of this was straw, in treatments with N the Harvest Index increased remarkably.
The TYAv biomass yield of rye was 1547 ± 46 kg ha-1, which was significantly higher than the same indices for the other cultivars. The AGB of winter triticale and wheat cultivars did not differed from each other significantly. The TYAv AGB for Modus, Tewo and Kosack were 1488 ± 94, 1444 ± 93 and 1442 ± 59 kg ha-1, respectively.
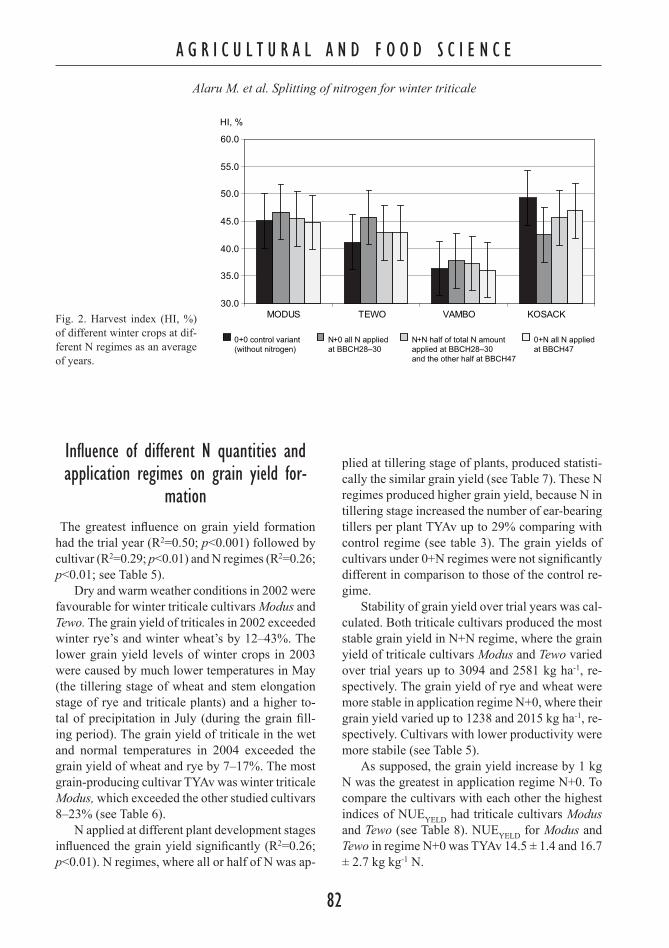
The application regime N+0 produced the highest TYAv biomass yields. The TYAv biomass yields were compared with the control regime N0+N0. The data revealed increases of up to 135% for winter wheat Kosack, 125% for winter triticale cultivar Modus and 121% for Tewo. The increase for rye Vambo was 109%. The increases of AGB kg-1 N influenced by N regimes N+0, N+N and 0+N were 2.08 ± 0.60, 1.76 ± 0.41 and 0.03 ± 0.27 kg kg-1 N, respectively. NUEAGB index was the highest in the application regime N+0, because N in tiller-ing stage increased the number of tillers per plant significantly (see Table 3). The Harvest Index was higher in all three N regimes than in the control regime, by 1–13% for triticales and 3–4% for rye. The Harvest Index of winter wheat Kosack, on the other hand in the same three regimes decreased by 5–15% (see Fig. 2).
0
1
2
3
4
5
6
7
8
9
10
0+0 0+N N+N N+0
Standing, points
a
b
ab
Fig.1. Influence of N regime on plants standing in 2004 (average over N quantities and cultivars)*different letters denote significant difference
Year Modus Tewo Vambo Kosack
2002 2098 ± 62a* 2068 ± 45a 2070 ± 30a 1961 ± 33b
2003 999 ± 48b 1003 ± 42b 1278 ± 77a 1043 ± 60b
2004 1367 ± 41a 1263 ± 55b 1287 ± 55ab 1324 ± 81ab
*different letters denote significant difference within rows
Table 4. Above ground biomass (AGB; g m-2) of different cultivars affected by trial year from descriptive statistics (± SE)
A G R I C U L T U R A L A N D F O O D S C I E N C E
Alaru M. et al. Splitting of nitrogen for winter triticale
82
A G R I C U L T U R A L A N D F O O D S C I E N C E
Vol. 18 (2009): 76–90.
83
Influence of different N quantities and application regimes on grain yield for-
mation The greatest influence on grain yield formation had the trial year (R2=0.50; p<0.001) followed by cultivar (R2=0.29; p<0.01) and N regimes (R2=0.26; p<0.01; see Table 5).
Dry and warm weather conditions in 2002 were favourable for winter triticale cultivars Modus and Tewo. The grain yield of triticales in 2002 exceeded winter rye’s and winter wheat’s by 12 –43%. The lower grain yield levels of winter crops in 2003 were caused by much lower temperatures in May (the tillering stage of wheat and stem elongation stage of rye and triticale plants) and a higher to-tal of precipitation in July (during the grain fill-ing period). The grain yield of triticale in the wet and normal temperatures in 2004 exceeded the grain yield of wheat and rye by 7–17%. The most grain-producing cultivar TYAv was winter triticale Modus, which exceeded the other studied cultivars 8–23% (see Table 6).
N applied at different plant development stages influenced the grain yield significantly (R2=0.26; p<0.01). N regimes, where all or half of N was ap-
plied at tillering stage of plants, produced statisti-cally the similar grain yield (see Table 7). These N regimes produced higher grain yield, because N in tillering stage increased the number of ear-bearing tillers per plant TYAv up to 29% comparing with control regime (see table 3). The grain yields of cultivars under 0+N regimes were not significantly different in comparison to those of the control re-gime.
Stability of grain yield over trial years was cal-culated. Both triticale cultivars produced the most stable grain yield in N+N regime, where the grain yield of triticale cultivars Modus and Tewo varied over trial years up to 3094 and 2581 kg ha-1, re-spectively. The grain yield of rye and wheat were more stable in application regime N+0, where their grain yield varied up to 1238 and 2015 kg ha-1, re-spectively. Cultivars with lower productivity were more stabile (see Table 5).
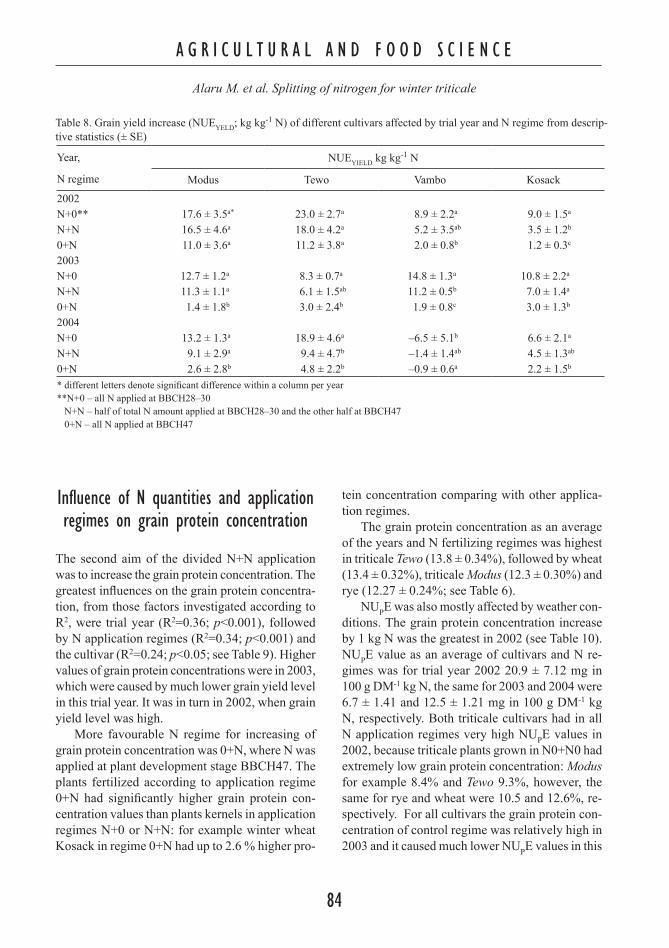
As supposed, the grain yield increase by 1 kg N was the greatest in application regime N+0. To compare the cultivars with each other the highest indices of NUEYELD had triticale cultivars Modus and Tewo (see Table 8). NUEYELD for Modus and Tewo in regime N+0 was TYAv 14.5 ± 1.4 and 16.7 ± 2.7 kg kg-1 N.
30.0
35.0
40.0
45.0
50.0
55.0
60.0
MODUS TEWO VAMBO KOSACK
HI, %
0+0 control variant (without nitrogen)
N+0 all N applied at BBCH28–30
N+N half of total N amount applied at BBCH28–30 and the other half at BBCH47
0+N all N applied at BBCH47
Fig. 2. Harvest index (HI, %) of different winter crops at dif-ferent N regimes as an average of years.
A G R I C U L T U R A L A N D F O O D S C I E N C E
Alaru M. et al. Splitting of nitrogen for winter triticale
82
A G R I C U L T U R A L A N D F O O D S C I E N C E
Vol. 18 (2009): 76–90.
83
Year,
N regime
Grain yield (kg ha-1)
Modus Tewo Vambo Kosack2002N+0**N+N0+N
7289 ± 33a*
7144 ± 155a
6744 ± 285a
6922 ± 322a
6728 ± 189ab
6232 ± 354b
5534 ± 102a
5197 ± 45b
5033 ± 98c
4638 ± 181a
4309 ± 130b
4176 ± 151b
2003N+0N+N0+N
4542 ± 118a
4444 ± 182a
3573 ± 156b
4375 ± 122a
4147 ± 62b
3400 ± 228c
4296 ± 150a
4029 ± 236a
3200 ± 80b
4729 ± 41a
4501 ± 217a
3530 ± 135b
2004N+0N+N0+N
7881 ± 123a
7538 ± 288ab
6406 ± 288b
7463 ± 224a
6570 ± 221b
5408 ± 214c
5188 ± 566a
5827 ± 122ab
5840 ± 40b
6653 ± 85a
6487 ± 46b
5958 ± 93c
*different letters denote significant difference within a column per year**0+0 – control variant (without nitrogen)N+0 – all N applied at BBCH28–30N+N – half of total N amount applied at BBCH28–30 and the other half at BBCH470+N – all N applied at BBCH47
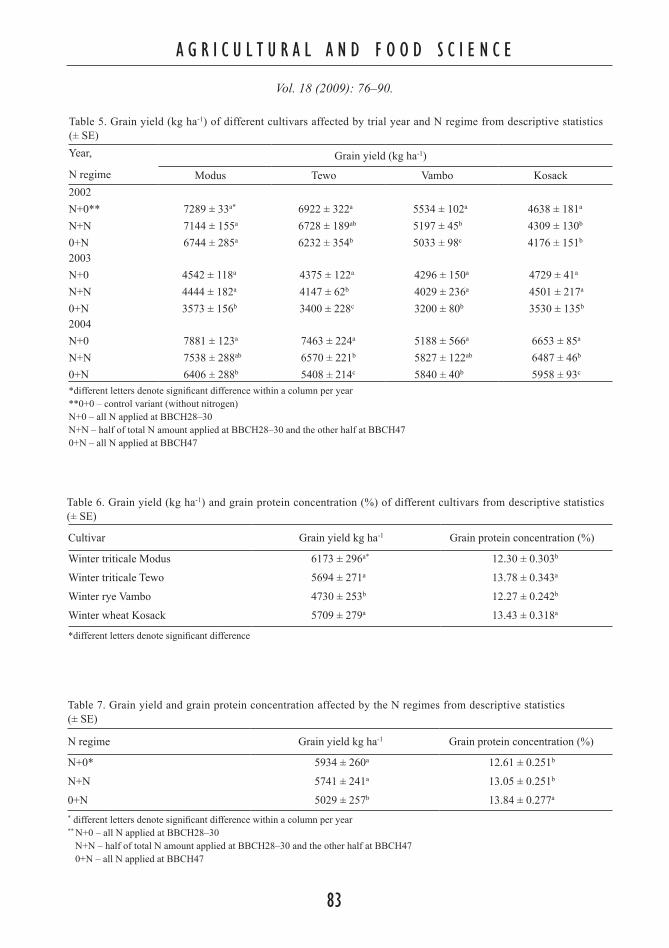
Table 5. Grain yield (kg ha-1) of different cultivars affected by trial year and N regime from descriptive statistics (± SE)
Cultivar Grain yield kg ha-1 Grain protein concentration (%)
Winter triticale Modus 6173 ± 296a* 12.30 ± 0.303b
Winter triticale Tewo 5694 ± 271a 13.78 ± 0.343a
Winter rye Vambo 4730 ± 253b 12.27 ± 0.242b
Winter wheat Kosack 5709 ± 279a 13.43 ± 0.318a
*different letters denote significant difference
Table 6. Grain yield (kg ha-1) and grain protein concentration (%) of different cultivars from descriptive statistics (± SE)
N regime Grain yield kg ha-1 Grain protein concentration (%)
N+0* 5934 ± 260a 12.61 ± 0.251b
N+N 5741 ± 241a 13.05 ± 0.251b
0+N 5029 ± 257b 13.84 ± 0.277a
* different letters denote significant difference within a column per year** N+0 – all N applied at BBCH28–30 N+N – half of total N amount applied at BBCH28–30 and the other half at BBCH47 0+N – all N applied at BBCH47
Table 7. Grain yield and grain protein concentration affected by the N regimes from descriptive statistics (± SE)
A G R I C U L T U R A L A N D F O O D S C I E N C E
Alaru M. et al. Splitting of nitrogen for winter triticale
84
A G R I C U L T U R A L A N D F O O D S C I E N C E
Vol. 18 (2009): 76–90.
85
Influence of N quantities and application regimes on grain protein concentration
The second aim of the divided N+N application was to increase the grain protein concentration. The greatest influences on the grain protein concentra-tion, from those factors investigated according to R2, were trial year (R2=0.36; p<0.001), followed by N application regimes (R2=0.34; p<0.001) and the cultivar (R2=0.24; p<0.05; see Table 9). Higher values of grain protein concentrations were in 2003, which were caused by much lower grain yield level in this trial year. It was in turn in 2002, when grain yield level was high.
More favourable N regime for increasing of grain protein concentration was 0+N, where N was applied at plant development stage BBCH47. The plants fertilized according to application regime 0+N had significantly higher grain protein con-centration values than plants kernels in application regimes N+0 or N+N: for example winter wheat Kosack in regime 0+N had up to 2.6 % higher pro-
tein concentration comparing with other applica-tion regimes.
The grain protein concentration as an average of the years and N fertilizing regimes was highest in triticale Tewo (13.8 ± 0.34%), followed by wheat (13.4 ± 0.32%), triticale Modus (12.3 ± 0.30%) and rye (12.27 ± 0.24%; see Table 6).
NUPE was also mostly affected by weather con-ditions. The grain protein concentration increase by 1 kg N was the greatest in 2002 (see Table 10). NUPE value as an average of cultivars and N re-gimes was for trial year 2002 20.9 ± 7.12 mg in 100 g DM-1 kg N, the same for 2003 and 2004 were 6.7 ± 1.41 and 12.5 ± 1.21 mg in 100 g DM-1 kg N, respectively. Both triticale cultivars had in all N application regimes very high NUPE values in 2002, because triticale plants grown in N0+N0 had extremely low grain protein concentration: Modus for example 8.4% and Tewo 9.3%, however, the same for rye and wheat were 10.5 and 12.6%, re-spectively. For all cultivars the grain protein con-centration of control regime was relatively high in 2003 and it caused much lower NUPE values in this
Year,
N regime
NUEYIELD kg kg-1 N
Modus Tewo Vambo Kosack
2002N+0**N+N0+N
17.6 ± 3.5a*
16.5 ± 4.6a
11.0 ± 3.6a
23.0 ± 2.7a
18.0 ± 4.2a
11.2 ± 3.8a
8.9 ± 2.2a
5.2 ± 3.5ab
2.0 ± 0.8b
9.0 ± 1.5a
3.5 ± 1.2b
1.2 ± 0.3c
2003N+0N+N0+N
12.7 ± 1.2a
11.3 ± 1.1a
1.4 ± 1.8b
8.3 ± 0.7a
6.1 ± 1.5ab
3.0 ± 2.4b
14.8 ± 1.3a
11.2 ± 0.5b
1.9 ± 0.8c
10.8 ± 2.2a
7.0 ± 1.4a
3.0 ± 1.3b
2004N+0N+N0+N
13.2 ± 1.3a
9.1 ± 2.9a
2.6 ± 2.8b
18.9 ± 4.6a
9.4 ± 4.7b
4.8 ± 2.2b
–6.5 ± 5.1b
–1.4 ± 1.4ab
–0.9 ± 0.6a
6.6 ± 2.1a
4.5 ± 1.3ab
2.2 ± 1.5b
* different letters denote significant difference within a column per year**N+0 – all N applied at BBCH28–30 N+N – half of total N amount applied at BBCH28–30 and the other half at BBCH47 0+N – all N applied at BBCH47
Table 8. Grain yield increase (NUEYELD; kg kg-1 N) of different cultivars affected by trial year and N regime from descrip-tive statistics (± SE)

A G R I C U L T U R A L A N D F O O D S C I E N C E
Alaru M. et al. Splitting of nitrogen for winter triticale
84
A G R I C U L T U R A L A N D F O O D S C I E N C E
Vol. 18 (2009): 76–90.
85
trial year. For example: for Modus 13.2, for Tewo 14.9, for Vambo 12.9 and for Kosack 13.0%.
Plants of both winter triticale cultivars grown in N regimes, where all or half of N was applied at
BBCH47, had significantly higher NUPE indices comparing with application regime N+0. However, the increase of rye Vambo grain protein concentra-
Year,
N regimeProtein concentration (%)
Modus Tewo Vambo Kosack
2002N+0**N+N0+N
9.9 ± 0.32b*
10.5 ± 0.49ab
10.9 ± 0.49a
11.0 ± 0.26b
11.7 ± 0.58ab
12.6 ± 0.44a
9.9 ± 0.21b
10.5 ± 0.31a
11.0 ± 0.25a
12.2 ± 0.37b
12.5 ± 0.12b
13.0 ± 0.25a
2003N+0N+N0+N
12.7 ± 0.12c
13.4 ± 0.06b
14.5 ± 0,16a
14.8 ± 0.16c
15.4 ± 0.23b
16.6 ± 0.23a
13.1 ± 0.07c
13.5 ± 0.07b
14.1 ± 0.20a
14.0 ± 0.04b
14.1 ± 0.22b
14.6 ± 0.22a
2004N+0N+N0+N
12.2 ± 0.29c
12.8 ± 0.29b
13.9 ± 0.34a
13.4 ± 0.17c
13.8 ± 0.02b
14.7 ± 0.32a
12.8 ± 0.12b
12.6 ± 0.32b
13.6 ± 0.29a
12.4 ± 0.07c
12.7 ± 0.04b
12.8 ± 0.03a
* different letters denote significant difference within a column per year**N+0 – all N applied at BBCH28–30 N+N – half of total N amount applied at BBCH28–30 and the other half at BBCH47 0+N – all N applied at BBCH47
Table 9. Grain protein concentration (%) of different cultivars affected by trial year and N regime from descriptive sta-tistics (± SE)
Year,
N regimeNUEPROT mg in 100 g DM-1 kg N
Modus Tewo Vambo Kosack
2002N+0**N+N0+N
20.4 ± 2.28b*
22.6 ± 1.06b
29.3 ± 4.76a
19.1 ± 1.23c
26.2 ± 1.40b
37.9 ± 6.72a
6.6 ± 0.92c
17.6 ± 1.24b
24.3 ± 3.21a
4.2 ± 0.53b
8.2 ± 1.21a
10.3 ± 1.90a
2003N+0N+N0+N
-7.3 ± 2.98c
1.0 ± 0.53b
14.4 ± 1.60a
-5.8 ± 0.70c
1.0 ± 0.53b
14.2 ± 1.56a
2.2 ± 0.96c
7.5 ± 0.86b
14.1 ± 1.68a
9.3 ± 2.83b
12.0 ± 0.26b
18.3 ± 1.67a
2004N+0N+N0+N
7.3 ± 1.72c
14.9 ± 1.85b
27.6 ± 1.94a
6.6 ± 0.72c
12.2 ± 2.24b
22.5 ± 0.80a
9.9 ± 0.80b
7.6 ± 1.99b
19.1 ± 0.89a
4.5 ± 0.90b
7.9 ± 1.46a
9.9 ± 2.05a
* different letters denote significant difference within a column per year**N+0 – all N applied at BBCH28–30 N+N – half of total N amount applied at BBCH28–30 and the other half at BBCH470+N – all N applied at BBCH47 DM = dry matter
Table 10. Increase of grain protein concentration (NUPE; mg in 100 g DM-1 kg N) of different cultivars affected by trial year and N regime from descriptive statistics (± SE)

A G R I C U L T U R A L A N D F O O D S C I E N C E
Alaru M. et al. Splitting of nitrogen for winter triticale
86
A G R I C U L T U R A L A N D F O O D S C I E N C E
Vol. 18 (2009): 76–90.
87
tion by 1 kg N in application regimes N+0 statisti-cally did not differed from N+N (see Table 11).
The N+N regime also increased the grain lysine concentration; N60+N60 produced the highest lysine concentration values where the lysine con-centration increased by 0.25 g kg–1 (in 2002) and by 0.08 g kg–1 (in 2003) in comparison with the control regime (see Table 12). The average lysine concentration of grain samples in 2003 of triticale cultivar Tewo was 29% higher than the lysine con-centration of the winter wheat Kosack.
Influence of N quantities and application regime on grain maturation rate, desic-
cation rate and HFN
The trials’ results revealed that in Estonia, dif-ferent winter crops reach PM at almost the same time. The duration of the grain filling period and the development rate of winter crops’ grains correlated strongly with the accumulation rate of the sum of temperatures (R2=0.42; p<0.001), and correlated negatively with the sum of precipitation (R2=-0.35;
N regime Modus Tewo Vambo Kosack
N+0** 5,65 ± 1,70a* 6,63 ± 0,43a 6.06 ± 0.83a 6.89 ± 1.25a
N+N 12.82 ± 0.72a 13.05 ± 0.56a 7.51 ± 0.63c 9.93 ± 0.62b
0+N 23.66 ± 2.21a 24.86 ± 2.99a 16.60 ± 0.84b 14.04 ± 1.74b
* different letters denote significant difference within rows**N+0 – all N applied at BBCH28–30 N+N – half of total N amount applied at EC28–30 and the other half at BBCH47 0+N – all N applied at BBCH47
Table 11. NUPE of different cultivars affected by N regime from descriptive statistics (± SE)
N regime Lysine g kg-1 Protein % Lysine/protein %
2002T 0+0T 0+120T 60+60T120+02003T 0+0T 0+120T 60+60T120+0
3.21ab
3.13ab
3.46a
2.71b
4.53a
4.48a
4.61a
4.41a
13.24a
13.43a
12.63a
11.36a
14.86a
16.90b
15.88ab
15.07a
2.42a
2.30a
2.74a
2.39a
3.05a
2.65a
2.90ab
2.93a
K 0+0K 0+120K 60+60K120+0
3.17b
3.61ab
3.04b
2.94b
14.21a
14.84a
14.48a
14.64a
2.23bc
2.43abc
2.10c
2.01c
* - different letters in column per year denote a statistically significant differenceT – winter triticale cultivar TewoK – winter wheat cultivar Kosack
Table 12. Lysine concentration in winter triticale cultivar Tewo and winter wheat Kosack affected by N regimes

A G R I C U L T U R A L A N D F O O D S C I E N C E
Alaru M. et al. Splitting of nitrogen for winter triticale
86
A G R I C U L T U R A L A N D F O O D S C I E N C E
Vol. 18 (2009): 76–90.
87
p<0.001), but N fertilizer quantities and application times did not significantly influence these data as TYAv. The time to harvest maturity varies consider-ably, depending on the desiccation rate of the grain. The differences between the desiccation rates for winter crops, after PM, were significant (R2=0.67; p<0.001). The desiccation rate after PM was nega-tively correlated with the amount of precipitation in July and August (R2= 0.50; p< 0.001). The HFN values, according to the correlation analysis were not directly influenced by N fertilizer quantities and application times. The effect of N on the HFN was indirect through the effect on the grain yield forma-tion and grain protein content. HFN values were positively correlated with the grain yield of differ-ent winter crops (R2=0.22; p<0.05) and negatively with the grain protein content (R2=-0.25; p<0.05). The effect of the cultivars on the test weight, 1000 Kernel Weight (KW) and HFN was significant (R2=0.35; p<0.001, R2=0.68; p<0.001 and R2=0.71; p<0.001, respectively). HFN values were affected most of all by the sum of precipitation in July and August (R2=-0.90; p<0.001) and by the tempera-ture (R2=0.91, p<0.001; see Table 13).
Discussion
Triticale is known as a crop for having a high grain yield level at low N input (Varughese et al. 1996a). It accumulates more N during heading and physi-ological maturity than wheat does. The difference
in N accumulation is maximal under lower levels of N application, indicating that triticales are better crops for soils with low N fertility (Varughese et al. 1996a). However, fertilization is required to avoid the decline of soil nutritional value. The choice of an appropriate fertilising regime is important if triticale is to be included at some stage in the crop rotation. Our trials also revealed that the grain yield increase resulting from 1 kg of additionally applied N was the highest in triticale cultivars, followed by wheat. The positive effect of N on the Harvest Index of triticale, which is thought to be due to the comparatively higher rates, than wheat’s of leaf area, increases per unit N uptake (Yoshihira et al. 2002a). The efficiency of applying all the N fertilizer at the tillering stage, N100%+N0, was negative for the grain yield of rye, because of vigorous increase of tillers m-2 and lodging. N fertilizer quantities higher than 60 kg N ha–1 did not increase grain yield significantly and they are not efficient in Estonian local conditions, because of the high risk to lodging and pre-harvest sprouting (Alaru et al. 2004).
The TYAv biomass yields, important for assess-ing bio-energy potentials were the highest for rye Vambo, AGB of winter triticale and wheat cultivars did not differed from each other significantly. The most suitable fertilising regime to maximise the biomass yields for triticale, as energy plants, is to apply all N at the tillering stage, N100%+N0. Af-fected by N100%+N0 regime the highest increase of biomass yield was in winter wheat Kosack, but then the Harvest Index value decreased.
The stabile biomass and grain yield over years is determinative in changeable climate like Baltic
Crop Falling number (s)
2002 2003 2004
Triticale 120 ± 14.2c 62 ± 0.4b 91 ± 9.6c
Rye 208 ± 5.8b 64 ± 0.3b 219 ± 2.3b
Wheat 306 ± 7.5a 208 ± 5.8a 325 ± 2.3a
* different letters denote a significant difference
Table 13. Hagber Falling Number (HFN) values of winter crops in 2002-2004 (±S.E.)

A G R I C U L T U R A L A N D F O O D S C I E N C E
Alaru M. et al. Splitting of nitrogen for winter triticale
88
A G R I C U L T U R A L A N D F O O D S C I E N C E
Vol. 18 (2009): 76–90.
89
Sea area. The weather conditions in trial years dif-fered extremely from each other and as an average of three trial years more stabile grain yield was produced by triticales in application regime N+N. The critical period in point of view of winter crops AGB and grain yield formation was the beginning of post-hibernation vegetation period. The general grain yield level was dramatically influenced by cold and wet weather conditions in May 2003, which caused the strong deceleration of all winter crops growing. It is impossible to improve this lag in growing by any agronomic treatments later in summer time.
Triticale has considerable potential as a re-source of energy and protein (Fernandes-Figares et al. 2000). Hybrid vigour (heterosis) can contrib-ute to yield improvement (Kindred et al. 2005). Heterosis for yield, may be heavily influenced by agronomic conditions, but tends to be higher with-out N application (Le Gouis et al. 2002). However, much less is known about the interaction between N and heterosis on grain quality. There is according to Simmonds (1995), a strong negative correlation between grain yield and protein content in that a higher grain yield is accompanied by a decrease in grain protein content; this was the case in our trial (R2=-0.63; p< 0.001). N application at development stage of plants BBCH47 (0+N regime) increased the grain protein content significantly and the in-crease resulting from 1 kg of additionally applied N was the highest in triticale cultivars, followed by rye and wheat. Yoshihira (2002b) concluded that unlike the roots of wheat, those of triticale and rye continue to grow after the flowering stage and the degeneration of the roots of triticale and rye is delayed compared to that of the roots of wheat. This is thought to be the reason for the higher N absorption values of the triticale at the flag leaf stage (Yoshihira et al. 2002a). The differences of N use efficiency between triticale and rye is caused by differences of N partitioning between grain and other plant components of these crops (Yoshihira et al. 2002b) The fertilizing regime N60+N60 guar-anteed the 12% protein concentration needed for high-quality pig feed (Lember 2003). It revealed from our earlier studies, that the N+0 regime at the 120kg level (N120+N0) did produce the high-
est protein yield (841 kg ha–1), but this fertilizing regime is not desirable because of the high risk of lodging. The 120 kg level of the divided N+N regime (N60+N60) produced 818 kg ha–1, which was 4–12% higher than the other regimes and 27% higher than the control regime (Alaru et al. 2004).
The application of N fertilizer at different plant stages influenced the grain protein concentration and therefore the lysine concentration significantly. Usually, when protein concentration increases there is a decrease in the lysine concentration (Bruckner et al. 1998, Fernandez-Figares et al. 2000). N fer-tilizer applied at the plant development stage EC47 increased lysine concentration. The highest lysine concentration was in variants N60+N60, where the increase was up to 0.08 g kg–1 in comparison with control regime.
The major deficiencies of triticale, compared to wheat, grown in humid and cool environments, are an earlier anthesis, a later maturity, and a longer grain-fill duration compared to wheat (Varughese et al. 1996b). N fertilizer application in later de-velopment stages of plant may prolong the green leaf area duration and prolong the time of the grain maturation, which carries a relatively high risk for the quality of the grain yield in humid environ-ments. Our experiments revealed that different N quantities and application times did not significant-ly influence either the duration of the grain-filling period or the dry matter accumulation rate. These data were mostly influenced by local weather con-ditions (R2= 0.54; p<0.001) and cultivar (R2=0.25; p<0.05).
Local weather conditions in July and August every year had direct effect on HFN values. In the absence of lodging, however, N application often increases HFN, but this effect varies with year, cultivar and site (Clarke et al. 2004). In our trial the N quantities and application regimes affected HFN indirectly through the effect on the grain yield formation and grain protein concentration. HFN was positively correlated with the grain yield and negatively with the grain protein concentration. The greatest influencers on the increase of winter triticale cultivars’ grain yield were the increase of test weight and 1000 KW. The grain yield increases

A G R I C U L T U R A L A N D F O O D S C I E N C E
Alaru M. et al. Splitting of nitrogen for winter triticale
88
A G R I C U L T U R A L A N D F O O D S C I E N C E
Vol. 18 (2009): 76–90.
89
of wheat and rye were caused by the increase of test weight, 1000 KW and the number of ear-bearing tillers per plant. N fertilizer application at the til-lering stage of plants, as per the literature review above, initially increases the grain yield, because of the number of spikelets and grains per ear and so the number of ear-bearing tillers per plant increases. N application at later stages of plant development increases the grains mass and the nitrogen concen-tration in the kernels (Peltonen 1992, Ramesh et al. 2002). Our experiments confirmed this.
Conclusions
The efficiency of applying all N at the tillering 1. stage (N100%+N0) was the highest for the grain yield of triticale; N application at development stage of plants 2. BBCH47 increased the grain protein concen-tration significantly and the increase resulting from 1 kg of additionally applied N was the highest in triticale cultivars, followed by rye and wheat.Different N quantities and application times did 3. not significantly influence either the duration of the grain-filling period or the dry matter accumulation rate of triticale;N quantities and application regime affected 4. HFN indirectly through the effect on the grain yield formation and grain protein concentration. HFN was positively correlated with the grain yield and negatively with the grain protein concentration;Depending on later utilization of triticale the 5. suitable N regimes are:a) triticale as the energy plant – N60+N0 – the suitable N fertilizing time is at the tillering stage of plants and suitable N norm is not more than 60 kg N ha-1; b) triticale as a feed or food – N60+N60 – High grain yield, protein and lysine concentra-tion level are assured in this N application regime;
More stabile grain yield was produced by 6. triticales in application regime N+N.
Acknowledgements.We would like to thank Mr Marcus Denton, http://www.derettens.ee/, for the linguistic cor-rection of this article. We also acknowledge colleagues from the department of Nutrition and Animal Products Quality and colleagues from department of Soil Science and Agrochemistry for their collaboration on the labora-tory analysis, especially Mrs, PhD Helgi Kaldmäe and Mr Tõnu Tõnutare. This study was supported financially by the Estonian Science Foundation (Project 4726).
ReferencesAlaru, M., Móller, B. & Hansen, Å. 2004. Triticale yield for-
mation and quality influenced by different N fertilisation regimes. Agronomy Reseach 2: 3–12.
Alcoz, M.M, Hons, F.M & Haby V.A. 1993. Nitrogen ferti-lization timing effect on wheat production, nitrogen up-take efficiency, and residual soil nitrogen. Agronomy Journal 85: 1198–1203.
Arregui, L.M. & Quemada, M. 2008. Strategies to improve nitrogen use efficiency in winter cereals crops under rainfed conditions. Agronomy Journal 100: 277–284.
Bewa, H. 1998. Advantages of entire grain plant use for en-ergy production on lands set aside for non-food crops. BioBase. Cited 25 May 2007. Updated 29 May 1998. Available on the internet: http://www.eeci.net/arhive/biobase/B10274.html
Bruckner, P.L., Cash, S.D. & Lee, R.D. 1998. Nitrogen ef-fects on triticale grain yield, amino acid composition, and feed nutritional quality for swine. Journal of production agriculture 11: 180–184.
Clarke, M.P., Gooding, M.J. & Jones, S.A. 2004. The ef-fects of irrigation, nitrogen fertilizer and grain size on Hagberg falling number, specific weight and blackpoint of winter wheat. Journal of the Science of Food and Ag-riculture 84: 227–236.
Dilz, K. 1988. Efficiency of uptake and utilization of ferti-lizer nitrogen by plants. In: D.S. Jekinson & K.A. Smith (eds) Nitrogen efficiency in agricultural soils. Elsevier Applied Science, London.
Draper, N.R. & Smith, H. 1998. Applied Regression Anal-ysis. Wiley-Interscience.
Everitt, B.S. 2002. Cambridge Dictionary of Statistics (2nd Edition). CUP.
Fernandez-Figares, I., Marinetto, J., Royo, C., Ramos, M. & Garcia del Moral, L.F. 2000. Amino-acid composi-tion and protein and carbohydrate accumulation in the grain of triticale grown under terminal water stress sim-ulated by a senescing agent. Journal of Cereal Science 32: 249–258.
Garrido-Lestache, E., Lopez-Bellido, RJ, & Lopez-Bel-lido, L. 2005. Durum wheat quality under Mediterrane-

A G R I C U L T U R A L A N D F O O D S C I E N C E
Alaru M. et al. Splitting of nitrogen for winter triticale
90
an conditions as affected by N rate, timing and splitting, N form an S fertilization. European Journal of Agrono-my 23: 265–278.
Gooding, M.J., Kettlwell, P.S., Davies, W.P. & Hocking, T.J. 1986. Effects of spring nitrogen-fertilizer on the Hag-berg Falling Number of grain from breadmaking vari-eties of winter-wheat. Journal of Agricultural Science, Cambridge 107: 475–477.
Kettlewell, P.S. 1999. The response of alpha-amylase ac-tivity during wheat grain development to nitrogen ferti-lizer. Annals of Applied Biology 134: 241–249.
Kindred, D.R., Gooding, M.J. & Ellis, H.R. 2005. Nitro-gen fertilizer and seed rate effects on Hagberg falling number of hybrid wheats and their parents are associ-ated with α-amylase activity, grain cavity size and dor-mancy. Journal of the Science of Food and Agriculture 85: 727–742.
Le Gouis J., Beghin, D., Heumez, E. & Pluchard, P. 2002. Diallel analysis of winter wheat at two nitrogen levels. Crop Science 42: 1129–1134.
Lember, A., Luts, V., Roosmaa, Ü. & Oja, A. 2003. Cere-als for feed (in Estonian).
Cited 20 March 2005. Updated 25 March 2003. Availa-ble on the internet:
http://www.pikk.ee/221/z0zARTICLEy610.htmlLimaux, F., Recous, S., Meynard, J.M. & Guckert, A. 1999.
Relationship between rate of crop growth at date of fer-tiliser N application an fate of fertiliser N applied to win-ter wheat. Plant and Soil 214: 49–59.
Lopez-Bellido, L., Lopez-Bellido, R.J. & Lopez-Bellido F.J. 2006. Fertilizer nitrogen efficiency in durum wheat un-der rainfed Mediterranean conditions: Effect of split ap-plication. Agronomy Journal 98: 55–62.
Lund, G. 1999. Cereals: an alternative energy source. 00021 2/99 Newsletter 14/7. Cited 3 May 2007. Updat-ed July 1999. Available on the internet:
http://adl.brs.gov.au/mapserv/biomass/factsheets/CADDET299art9.pdf.
Ottman, M.J., Doerge, T.A. & Martin C.E. 2000. Durum grain quality as affected by nitrogen fertilization near anthesis and irrigation during grain fill. Agronomy Jour-nal 92: 1035–1041.
Peltonen, J. 1992. Ear developmental stage used for tim-ing supplemental nitrogen application to spring wheat. Crop Science 32: 1029–1033.
Ramesh, P., Ghosh, P.K. & Ajay-Ramana, S. 2002. Effects of nitrogen on dry matter accumulation and productivity of three cropping systems and residual effects on wheat
in deep vertisols of Central India. Journal of Agronomy and Crop Science 188: 81–85.
Santiveri, F., Royo, C. & Romagosa, I. 2002. Patterns of grain filling of spring and witner hexaploid triticales. Eu-ropean Journal of Agronomy 16: 219–230.
Sieling, K. & Beims, S. 2007. Effects of 15N Split-applica-tion on Soil and Fertiliser N Uptake of Barley, Oilseed Rape and Wheat in Different Cropping Systems. Journal of Agronomy and Crop Science 193: 10–20.
Sieling, K., Schröder, H., Finck, M. & Hanus, H. 1998. Yield, N uptake, and apparent N use efficiency of win-ter wheat and winter barley grown in different croping systems. Journal of Agricultural Science, Cambridge 131: 375–387.
Simmonds, N.W. 1995. The relation between yield and pro-tein in cereal grain. Journal of the Science of Food and Agriculture 67: 309–315.
Sowers, K.E., Miller, B.C. & Pan W.L. 1994. Optimiz-ing yield and grain protein in soft white winter wheat with split nitrogen applications. Agronomy Journal 86: 1020–1025.
Szentpétery, Z., Jolánkai, M., Kleinheincs, C. & Szöllosi, G 2005. Effect of nitrogen top-dressing on winter wheat. Cereal Research Communications 33: 619–626.
Sticksel, E., Maidl, F.-X., Retze,r F. & Fischbeck, G. 1999. Nitrogen uptake and utilization in wheat under different fertilization regimes, with particular reference to main stems and tillers. Journal of Agronomy and Crop Sci-ence 183: 47–52.
Subedi, K.D., Ma, B.L. & Xue, A.G. 2007. Planting date and nitrogen effect on grain yield and protein content of spring wheat. Crop Science 47: 36–44.
Varughese, G., Pfeiffer, W.H. & Peña, R.J. 1996a. Triti-cale: a successful alternative crop (Part 1). Cereal Foods World 41: 474–482.
Varughese, G., Pfeiffer, W.H. & Peña, R.J. 1996b. Triti-cale: a successful alternative crop (Part 2). Cereal Foods World 41: 635–645.
Yoshihira, T., Karasawa, T. & Nakatsuka, K. 2002a. Traits associated with high-yield in winter triticale in Hokkaido, Japan – comparison with wheat and rye. C.Photosynthetic rate. In: Proceedings of 5th Internation-al Triticale Symposium. Poland. Vol. 2: 161–167.
Yoshihira, T., Karasawa, T. & Nakatsuka, K. 2002b. Traits associated with high-yield in winter triticale in Hokkaido, Japan – comparison with wheat and rye. B. Nitrogen fer-tilizer efficiency. In: Proceedings of 5th International Trit-icale Symposium. Poland. Vol. 2: 149–160.