Embed Size (px)
Citation preview
6F6Z3001 THIRD YEAR PROJECT
Winter Sports tourist’s perceptions on Climate Change impacts and responses
H.L.Norman
A Project submitted in partial fulfillment of the requirements for the degree of Bachelor of Science (Honours) in Environmental Management & Sustainability, The Manchester Metropolitan
University.
Environmental and Geographical Sciences Undergraduate Network
The Manchester Metropolitan University
April 2015
Declaration of originality
This is to certify that the work is entirely of my own and not of any other person, unless explicitly acknowledged (including citation of published and unpublished sources). The work has not previously been submitted in any form to the Manchester Metropolitan University or to any other institution for assessment or any other purpose.
Signed
--------------------------------------
Date
--------------------------------------
Word Count
--------------------------------------
ii
TABLE OF CONTENTS
List of tables4.1 Survey Respondents
4.1.1 – Country of residence for survey respondents 21List of figures
4.2 Importance and perceptions of sustainability 224.2.1.1 General importance of sustainability 224.2.2.1 Proposed meanings of sustainable tourism 244.2.3.1 Importance of sustainability on holiday 264.2.4.1 Comparison of sustainability at home and on holiday 284.2.4.2 Direct comparison of sustainability on holiday and at
home 294.3 Voluntary fee for Sustainable Tourism policies 30
4.3.1.1 Willingness to pay 314.3.1.2 Willingness to pay & sustainability on holiday 304.3.2.1 Voluntary amount offered 35
4.4 Environmental issues 364.4.1 – Environmental issues importance among participants 36
4.5 Climate Change Perceptions 374.5.1.1 Participants perception on climate change 374.5.1.2 Level of agreement 384.5.1.3 Convinced by greenhouse effect 38
4.6 Winter sports questions 404.6.1.1 Winter sports qualifying question 404.6.2.1 Winter sports disciplines 414.6.3.1 Frequency of winter sports holidays 424.6.4.1 Participants who had been to more than one location 424.6.5.1 Most frequented country 434.6.6.1 Factors of importance when choosing holiday destination 444.6.7.1 Perceptions of current impacts of climate change on the
length of the natural ski season 454.6.8.1 Perceptions on whether the impact of climate change
will have an effect on ski season length in the future 464.6.9.1 Comparison of climate change impacts now and the
future responses 474.6.10.1 Comparison of artificial and natural snow 484.6.11.1 How should artificial snow be used? 494.6.12.1 Negative effects associated with using artificial snow 504.6.13.1 Willingness to visit resort if large proportion of snow
was artificial 514.6 General Information 52
4.6.1.1 Gender 52
iii
4.6.2.1 Age range of participants 534.6.3.1 Level of education 53
1. INTRODUCTION 71.1 Sustainable Tourism 9
1.1.1 Climate Change Impacts on Tourism 121.1.2 Tourism impacts on Climate Change 131.1.3 Attitude behaviour gap and the psychology of tourists 14
1.2 The Winter Sports Industry 16
2. AIMS AND OBJECTIVES 182.1 Aims 182.2 Objectives 18
3. METHODOLOGY 193.1 Questionnaire Design 193.2 Questionnaire Administration 203.3 Data Analysis 20
4. RESULTS & DISCUSSION 214.1 Survey respondents 214.2 Importance and perceptions of Sustainability 22
4.2.1 General importance of sustainability 224.2.2 Proposed meanings of Sustainable Tourism 234.2.3 Importance of sustainability on holiday 264.2.4 Comparison of sustainability at home and sustainability on holiday 27
4.3 Voluntary fee for sustainable tourism policies 304.3.1 Willingness to pay 304.3.2 Voluntary amount offered 34
4.4 Environmental issues 354.5 Climate change perceptions 36
4.5.1 Participants perceptions on climate change 364.5 Winter sports questions results 40
4.5.1 Winter sports qualifying question 404.5.2 Winter Sports disciplines 414.5.3 Frequency of winter sports holidays 414.5.4 Participants who have been on one or more winter sports holiday to more than one location 424.5.6 Most frequented country 434.5.7 Factors of importance when choosing a holiday destination 434.5.8 Perceptions on the current impact of climate change on the length of the natural ski season 45
iv
4.5.9 Perceptions on whether the impact of climate change will have an effect on ski season length in the future 464.5.10 Comparison of climate change impacts now, and in the future responses 474.5.11 Comparison of artificial and natural snow 484.5.12 How should artificial snow be used? 494.5.13 Negative effects associated with using artificial snow 504.5.14 Willingness to visit resort of large proportion of snow was artificial 50
4.6 General Information 524.6.1 Sex of participants 524.6.2 Age range of participants 534.6.3 Level of education 53
5. CONCLUSIONS 54
6. REFERENCES 55
7. ACKNOWLEDGMENTS 60
8. APPENDICES 61
v
AbstractThis study primarily sets out to investigate ‘Sustainability’ as a term using the Winter Sports Industry as a key factor of an industry that may or may not be affected by climate change. By addressing climate change perceptions, the attitude behavior gap that lies within sustainable tourism and willingness to pay for voluntary offset schemes, the study aims to build an understanding of issues arising around sustainability and climate change.
Participants were invited to take part in a survey that addressed these issues over a 3-month period, comprising of open and closed questions. The study concluded to agree that although people care about the environment, they do not hold themselves accountable for being sustainable or paying extra for offset schemes as well as having broad conceptions about what Climate change is, agreeing with other literature within the same area.
vi
1. INTRODUCTION
The motivation behind this project is to examine the relationships between tourism,
sustainability and climate change. In particular, it aims to investigate stakeholder
perceptions of and responses to climate change, building understanding of the
attitude-behaviour gap. This project will explore how the tourism industry is impacted
by and responding to climate change. Specifically, it will focus on the ski industry,
which due to its nature requires a specific environment that can (and is) being altered
by climate change.
Sustainable tourism and climate change has become a growing field of research as
people become increasingly conscious of how their actions can affect the environment
around them (Liu, 2003). Recently however, due to the increasingly broad amount of
destinations that tourists can fly to, relatively low cost, sustainable travel seems to be
becoming an increasingly difficult goal to achieve (Burns & Bibbings, 2009). Aviation
has the fastest growth rate of all modes of transport (Whitelegg & Williams, 2000). The
aviation industry has rapidly expanded along with the world economy, with a 9%
growth of passenger air traffic since 1960 (Upham et al., 2003). Forecasts for
unconstrained aviation growth in Europe and the UK, predict that the number of
passengers using air travel is set to double over the next 20 years (Upham et al., 2003).
Climate change has also become a household concern over the last two decades due
to consistent coverage by the media. For the last 650,000 years CO2 level (ppm) has
fluctuated greatly, however CO2 levels are now significantly higher than they were in
1950, with some of the main observed climate change impacts on natural systems
listed below (IPCC, 2014):
- The Cryosphere (Glaciers, ice sheets, floating ice and snow)
- Coastal systems and low lying areas
7
- Availability of freshwater
- Species distribution and biodiversity
Addressing climate change, the Kyoto Protocol is an international agreement
associated with the United Nations Framework Convention on Climate Change. The
agreement devotes its members (37 industrialized countries and the European
Community) to reducing their emissions and meeting regulation targets and is one of
the most significant conventions in human history addressing climate change as a
threat (UNFCC, 2015). The first commitment period was between 2008 and 2012, with
a second commitment period known as the Doha amendment proposed in 2012
(UNFCC, 2015).
By using one of the largest sub sectors of the tourism industry as an example, the ski,
or winter sports industry (hereafter referred to as the ‘ski’ industry) this study will
examine voluntary pay schemes and responses to snow mitigation methods. The ski
industry makes a particularly good case study due to its seasonal specific weather
requirements, which has the potential to be permanently altered or influenced by
climate change resulting from increased tourism.
There is currently an acceptance within the tourism industry that when choosing a
holiday tourists are unlikely to change their behavior to protect the environment, as
was shown in a recent study by Juvan & Dolnicar (2014) that surveyed 216 participants
on acceptability, awareness and perception of carbon calculators. Juvan & Dolnicar
(2014) found that participants who were environmentally aware in their survey knew
of the environmental impacts they were causing even if it was unintentional. However,
instead of the tourists changing their behaviours they simply justified their reasons for
not doing so, this attitude behaviour gap made them feel uncomfortable (Juvan &
Dolnicar, 2014).
8
1.1 Sustainable Tourism
What is the meaning of sustainable tourism? Without a defined answer, the widely
contested concept, or paradigm of sustainable development has many potential
interpretations (Bramwell & Lane, 2000), and, with the notion that tourism could be
‘sustainable’, there is an array of conceptual theory about what sustainable tourism is,
and how it can be defined.
However, according to the World Tourism Organization (UNWTO) sustainable tourism
is defined as: ‘Tourism that takes full account of its current and future economic, social
and environmental impacts, addressing the needs of visitors, the industry the
environment and host communities’, (UNWTO, 2005). Among the conceptual theories
of what constitutes sustainable tourism however, core principles have been identified
(Bramwell & Lane, 2000):
- Maintenance of natural, built and human cultural resources is critical for our
prolonged wellbeing
- Sustainable development – to conserve resources for future generations, to
give them similar opportunities and choices as those of the current generation
- Understanding and acting on the interconnections that exist between the
environment, economy and society
- Priority should be given to improving the conditions of the world poorest
countries
In October of 1987, the World Commission on Environment and Development (WCED)
released ‘Our Common Future’ also known as the Brundtland Report, a document that
sought to unite countries to pursue sustainable development together as well as
define the term ‘sustainable development’, (Drexhage & Murphy, 2010). In 1992,
industry leaders set out principles of what sustainable development is at the United
9
Nations Conference on Environment and Development in Rio de Janeiro, Brazil
(Drexhage & Murphy, 2010). Since then businesses have adhered to these and made
significant progress addressing the three main pillars of sustainability, the
environment, economy and society (Drexhage & Murphy, 2010). However, due to the
ongoing debate and elusive nature of the term, the concept has been difficult to
implement, and as a result, climate change has been the main relation to sustainable
development (Drexhage & Murphy, 2010).
Other literature supports such concepts, Sautter & Leisen’s (1999) paper on managing
stakeholders concluded to agree that for success in sustainable development efforts,
key players within the tourism industry must collaborate in order to make an influence
within the sector. Additionally, other researchers are starting to consistently argue the
need for increased collaboration in the planning process. According to Jamal & Getz,
(1995), ‘the most basic argument presented in much of the literature is the need to
more actively involve all persons affected by proposed development’.
Crucially, these reports and papers set to recognise that in order for sustainable
tourism (or development), to be effectively implemented into a community, support
from stakeholders is important. Stakeholders can be identified as ‘any group or
individual who can affect or is affected by’ (and in this case) tourism development in an
area (Freeman & McVea, 1984), in the case of sustainable tourism these stakeholders
are (Byrd, 2007):
- Entrepreneurs - Those affected by tourism
- Community leaders - Industry’s reliant on tourism
- Tourists - NGO’s
- Shareholders - Employees (Primary, secondary, tertiary levels)
- Government
10
Stakeholder participation is becoming increasingly important in a more knowledgeable
society; with decisions usually made from the top down, communities argue that
decisions are not made reflective as to the community’s interests and opinions (Byrd,
2007; Brown & Fraser 2006).
According to Sharpley (2014), it is well known that it is the responsibility of those
planning tourism to ensure the wellness of local residents whilst minimizing the
impacts that tourism development can have on an area (see also Nilsen & Ellingsen,
2015). Perhaps a contested issue due to the Brundtland Report’s theory that in order
to achieve sustainable development stakeholders must collaborate, inclusive of the
consumer. Although tourism can provide substantial economic growth to an area this
does not come without sometimes significant, environmental, economic and social
cost, particularly the impact on the destination and the local people (Sharpley, 2014).
Tourism has only recently in the last decade or so attracted attention whereby its
contribution to climate change has been considered an important factor through its
greenhouse gas emissions (Gossling, 2002), as well as being an industry that is also
considered high risk due to the specific nature of the environments required. In 2003,
the first conference on climate change and tourism took place in Djerba, Tunisia held
by the UNWTO. The conference bought together 140 delegates from 45 countries and
allowed scientists, organizations, businesses, and tourism authorities to exchange
views on the consequences, opportunities and risks of tourism and how it directly
affects climate change, climate change is now an important issue for policymakers
around the world with tourism being an important element (WTO, 2003). Although
environmental impacts might be of direct importance, the most significant and current
area of research interest is how the climate is changing in popular tourist destinations
(Konig, 1998; Trawoger, 2014).
11
1.1.1 Climate Change impacts on Tourism
The most recent assessment report from the Intergovernmental Panel on Climate
Change (IPCC) highlights the impacts of climate change on the tourism industry.
Climate change is set to significantly impact the tourism industry, with impacts
manifesting themselves in a number of different ways (IPCC, 2014). Food prices,
national security and availability of freshwater are factors that can influence tourist
decisions, resulting in once popular destinations becoming less visited (IPCC, 2014).
Rising sea levels and acidification threaten coastal-based tourism, and the loss of
biodiversity and potential damage to coral reefs is likely to damage eco-tourism areas
of the world (IPCC, 2014). Among these however, the IPCC also states that warmer
winters are decreasing the amount of possible days that people can ski on resort
slopes and threatening the general viability of some low lying resorts (IPCC, 2014).
The estimated value of the ski industry worldwide currently stands at $70billion
(English, 2014). As it stands, with greenhouse gases continuing to rise and inconsistent
snowfall, annual snow cover in the northern hemisphere has deceased by about 10%
since 1966 (Moen & Fredman, 2007). Indeed, this is reported in tourist facing media,
where according to the popular website powder.com (Dunfee, 2012) by 2039, the ski
season on the east coast of America will be some 2 weeks shorter than it is today, with
mountains becoming increasingly dependent on snowmaking technologies for reliable
conditions and for the resort to run a viable amount of time.
However, climate change may also have positive impacts in certain parts of the world;
with guaranteed sunshine and heat in regions that are traditionally are not holiday
destinations (Viner & Agnew, 1999). A warmer climate in countries such as the UK may
encourage tourists to holiday at home, creating an expansion in the domestic market
as the UK becomes a more desirable holiday destination (Viner & Agnew, 1999).
12
1.1.2 Tourism impacts on Climate Change
Tourisms exponential growth over the last decade has significantly contributed to
climate change, especially through the use of air travel. According to Chapman, (2007),
26% of global carbon dioxide emissions arise from the transportation industry, which is
still growing. Furthermore, Peeters (2007) reports that 89% of GHG emissions within
the tourism industry result from transport, with 8% associated with accommodation
and 3% activities and local transport.
It is now one of the most lucrative industries in the world with international visits
globally increasing from 675 million in 2000 to 940 million in 2010, the tourism
industry now contributes to an estimated 9% of the GDP (Hsieh & Kung, 2013). It is
well known that global tourism benefits the destination of choice economically and
therefore most researchers in Tourism will agree that it is important for general
economic growth and local economic development. Long distance destinations such as
Thailand and Africa have become increasingly popular; however, the environmental
impacts are often overlooked with their being a shortage of studies looking at the
relationship between tourism and environmental impacts (Hsieh & Kung, 2013).
With this, the demand for air transport has grown and one of the growing concerns
around this for local and regional governments is the increase in CO2, with emissions
estimated to be 7-8 times the level in 2050 as opposed to 1990 (Adler et al., 2013).
With flights getting more affordable and the push to promote all inclusive package
holidays, the demand for medium and long haul flights has been the main driver for
the increasing C02 emissions within the industry (Peeters & Eijgelaar, 2014).
However, GHG emissions from international air travel are not included within the
Kyoto Protocol’s agreement for compulsory reduction of emissions (Becken, 2007).
Because of this, there is no need for any country, whether or not they have signed the
agreement to reduce their international air travel emissions (Becken, 2007). However,
13
by 2050, it is expected that through future technologies and improved aircraft design
such as weight reduction and improved air transport management, a potential
emission reduction of some 20% by today’s standards will be achievable (Penner et al.,
1999).
Although aviation is not included in the Kyoto Protocol, within the EU, from 2012 the
EU-ETS has included all aircraft emissions from all flights to and from as well as within
the European Economic Area. The legislation, which was created in 2008, applies to
both EU operated and non-EU operated airlines (Albers, 2009).
Despite all this, little is known whether tourists are aware of how their travel
arrangements impact climate change as well as how climate change may also have an
impact on tourist destinations. As well as this, there has been a limited number of
research completed as to whether tourists would be willing to reduce their impacts to
mitigate such effects (Becken, 2004).
However, Bows et al (2009) reported that within the general public, climate change is
considered to be of low priority, with other issues such as the economy, health and
education and terrorism being of greater concern. This study also showed that in
recent years the interest levels of climate change have actually fallen with an
increasing number of people showing uncertainty about whether or not humans have
actually influenced climate change or not (Leiserowitz et al., 2010; Whitmarsh et al.,
2011).
1.1.3 The attitude-behaviour gap in sustainable tourism
Tourists generally have a positive attitude when it comes to the environment and
when asked do not wish to behave in ways that would damage it (Juvan & Dolnicar,
2014). However, when it comes to environmentally sustainable behavior, although
tourists generally have a positive attitude towards the environment this does not mean
14
they are inclined to make environmentally sustainable holiday choices, therefore a
distinct attitude behavior gap exists on the subject of environmentally sustainable
tourism (Juvan & Dolnicar, 2014).
This behavior, also known as cognitive dissonance is the feeling of mental stress or
discomfort an individual feels when involved in situation’s that can provoke conflicting
attitudes, beliefs and behaviors (Festinger, 1962). For example as shown in Juvan and
Dolnicars (2014) study, tourists know that tourism causes environmental damage,
however they are not willing to sacrifice their own satisfaction to ‘do good’.
A considerable number of studies investigating the attitude behaviour gap in tourism
have identified some of the following most common excuses declared by tourists:
- No alternatives to current behaviour, more important issues to worry about
(Becken, 2007)
- Maintaining the belief that just like everyone else, they deserve to escape real
world stress and indulge in relaxation (Wearing et al., 2002)
- Blaming corporations or businesses for not being informative enough during
the selection process about environmental or socio-economic impacts (Juvan &
Dolnicar, 2013)
- Purchasing carbon off-sets, or behaving in an environmentally friendly way at
home (Becken, 2007)
- Believing that technological advance has reduced their impact enough for them
to travel to where they please and how they like (Gossling et al., 2009)
- Arguing that a single person or trip will make a noticeable difference (Gossling
et al., 2009).
Another study concluded to discover that 66% of UK tourists found causing minimal
environmental damage whilst overseas important (Goodwin & Frances, 2003).
15
Additionally, according to Boulstridge & Carrigan (2000), price, quality and
convenience are still the most important factors for tourists when choosing a holiday.
1.2 The Winter Sports Industry
The impact of climate change is potentially harsh on the winter sports industry,
according to Patrick O’Donnell, Chief Executive of Aspen Skiing Company ‘’Climate
change is the most pressing issue facing the ski industry’’, (WTO & UNEP, 2008).
Around the world, the winter sports industry heavily relies on reliable snow conditions
in order to attract tourists to their destinations. As a large tourism sub-sector, the ski
industry is particularly vulnerable to changing climate conditions (Dawson & Scott,
2013; Scott & McBoyle, 2006). These include increasing average temperature, extreme
weather events and seasons that are becoming ever more unpredictable (Dawson &
Scott, 2013). For example Breiling et al. (1997), found that climate change related
impacts in low elevation resorts in Austria could result in an annual winter tourism
revenue loss of around 10%, this equates to around 1.5% of Austria’s GDP.
However the industry is attempting to come up with solutions to combat this, these
include, artificial snow making, business diversification and weather derivatives, a
financial solution that can be used to hedge against the likelihood of weather related
losses (Hopkins, 2013).
Although snow-making was not originally meant to mitigate the effects of climate
change, and was bought into for the primary reason of increasing the number of
skiable days thus raising the resorts viability compared to competing resorts, it is now
being used to guarantee snow as the weather gets warmer (Hopkins, 2013).
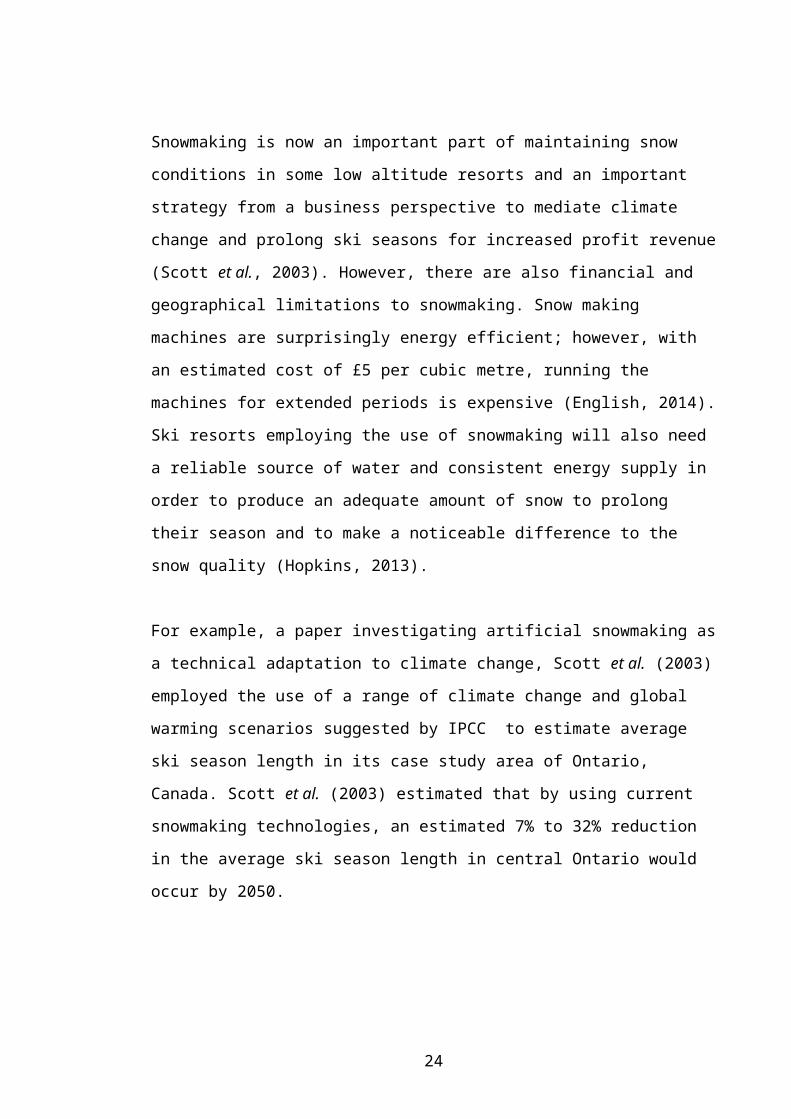
Snowmaking is now an important part of maintaining snow conditions in some low
altitude resorts and an important strategy from a business perspective to mediate
16
climate change and prolong ski seasons for increased profit revenue (Scott et al.,
2003). However, there are also financial and geographical limitations to snowmaking.
Snow making machines are surprisingly energy efficient; however, with an estimated
cost of £5 per cubic metre, running the machines for extended periods is expensive
(English, 2014). Ski resorts employing the use of snowmaking will also need a reliable
source of water and consistent energy supply in order to produce an adequate amount
of snow to prolong their season and to make a noticeable difference to the snow
quality (Hopkins, 2013).
For example, a paper investigating artificial snowmaking as a technical adaptation to
climate change, Scott et al. (2003) employed the use of a range of climate change and
global warming scenarios suggested by IPCC to estimate average ski season length in
its case study area of Ontario, Canada. Scott et al. (2003) estimated that by using
current snowmaking technologies, an estimated 7% to 32% reduction in the average
ski season length in central Ontario would occur by 2050.
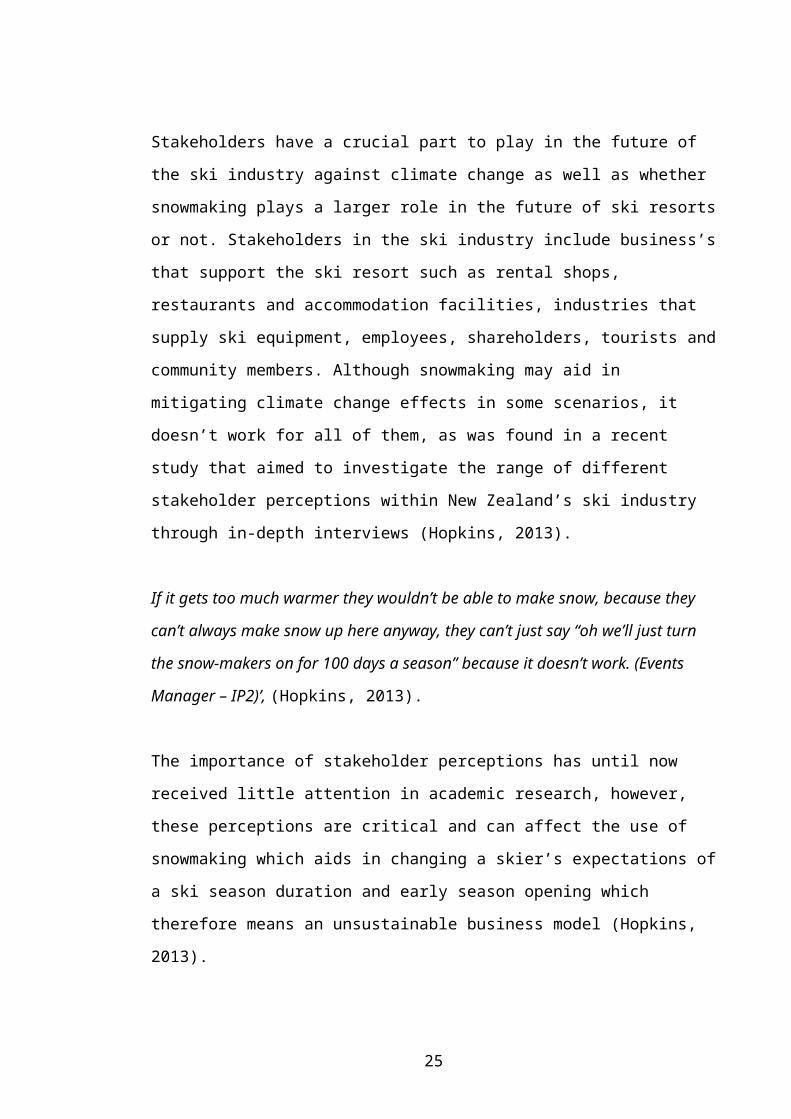
Stakeholders have a crucial part to play in the future of the ski industry against climate
change as well as whether snowmaking plays a larger role in the future of ski resorts or
not. Stakeholders in the ski industry include business’s that support the ski resort such
as rental shops, restaurants and accommodation facilities, industries that supply ski
equipment, employees, shareholders, tourists and community members. Although
snowmaking may aid in mitigating climate change effects in some scenarios, it doesn’t
work for all of them, as was found in a recent study that aimed to investigate the range
of different stakeholder perceptions within New Zealand’s ski industry through in-
depth interviews (Hopkins, 2013).
If it gets too much warmer they wouldn’t be able to make snow, because they can’t
always make snow up here anyway, they can’t just say “oh we’ll just turn the snow-
17
makers on for 100 days a season” because it doesn’t work. (Events Manager – IP2)’,
(Hopkins, 2013).
The importance of stakeholder perceptions has until now received little attention in
academic research, however, these perceptions are critical and can affect the use of
snowmaking which aids in changing a skier’s expectations of a ski season duration and
early season opening which therefore means an unsustainable business model
(Hopkins, 2013).
2. AIMS AND OBJECTIVES
2.1 Aim:
The aim of this investigation is to determine how tourism, with a focus on the ski
industry can affect climate change, and whether tourists perceptions on climate
change and their effects on the environment influence their decision making process
when it comes to booking ski holidays.
2.2 Objectives:
a. Build an understanding of sustainable tourism and how important it is to them
b. Identify and discuss the attitude behavior gap between sustainable tourism and
unsustainable tourism
c. Explore tourists views on snowmaking as a response to climate change
d. Investigate and discuss willingness to pay voluntary offset schemes in the
tourism industry
18
3. METHODOLOGY
3.1 Questionnaire Design
To meet the aim of the investigation a questionnaire was designed with both open and
closed questions, producing a varied data set of both quantitative and qualitative data.
Comment sections were also strategically included after specific questions for the
respondents to express any further ideas or opinions they had in the preceding
question.
The first completed questionnaire was used to conduct a pilot study with. Pilot studies
are an important step to an accurate final investigation as it allows any potential
problems or complications to be identified (Davies, 2007). However, they are also used
to pretest the main questionnaire that may or may not reveal any weaknesses in the
questions or areas where they may fail due to wording or not being specific enough
(Teijlingen et al., 2001).
Due to the nature of the investigation, there was no specific target audience. By using
both general tourism and sustainability based questions and winter sports industry
specific questions, a broad range of people were able to answer the questionnaire,
including those who do not participate in winter sports, as well as obviously those who
do.
Standardized Likert-type scales were used to compile the respondent’s level of
agreement with certain statements or questions (Wade, 2006).
19
3.2 Questionnaire Administration
Surveymonkey was used to input the questionnaire and collect the data. Social media
was the main administrative vessel, primarily Facebook, due to its accessibility and the
scope of varying demographic of people that use it and will likely see the survey
advertised. Friends, family, university societies and independent organisations such as
BASI (British Association of Ski Instructors) were the dominant respondents.
3.3 Data Analysis
Between 03/11/2014 and 06/01/2015, 114 participants answered the survey. After
importing raw, numerical and combined data sets from Surveymonkey, additional
spreadsheets in excel were created to separate qualitative and quantitative data
allowing a cleaner, and more elementary data analysis process to take place.
Qualitative data was analyzed using a deductive approach as it was a small part of the
questionnaire and only compromised of one question at the beginning. This involves
using the research questions to group the data and look for differences or similarities.
In order to define qualitative data sets more accurately topics were created using key
words or phrases from the respondent’s answers, ‘carbon, green, economy, and
climate change’, for example were then drafted into cells in Excel and then the
responses were collaborated with the most suitable heading. This process started out
with a multitude of different headings, allowing each of the respondent’s answers to
be as accurately as possible categorized. After this, similar categories such as ‘carbon
neutral’ and ‘low carbon’ were grouped together to clarify the qualitative data more
collectively. Due to varying knowledge amongst the participants, a single respondent
had the potential to fill many, if not in some rare cases, all of the criteria. Importantly
all of the respondent’s answers must be categorized objectively and not subjectively,
20
as well as coding each of the responses to the most accurate category, if need be
creating many, and from that point combining similar answers.
IBM SPSS Statistics was used to create both a cross tabulation tables as well as using
descriptive stats to find correlation for specific questions. Crosstab tables were also
applied with conditional formatting, such as heat mapping, to highlight data trends.
The software was also used to determine correlation using Spearman’s rank test.
Participants who didn’t complete the survey and had filled out questions at the start
but not Gender, Age and Education’s responses had to be removed.
4. RESULTS & DISCUSSION
The following section consists of the study’s findings as well as drawing upon existing
relevant literature to compare and open discussion.
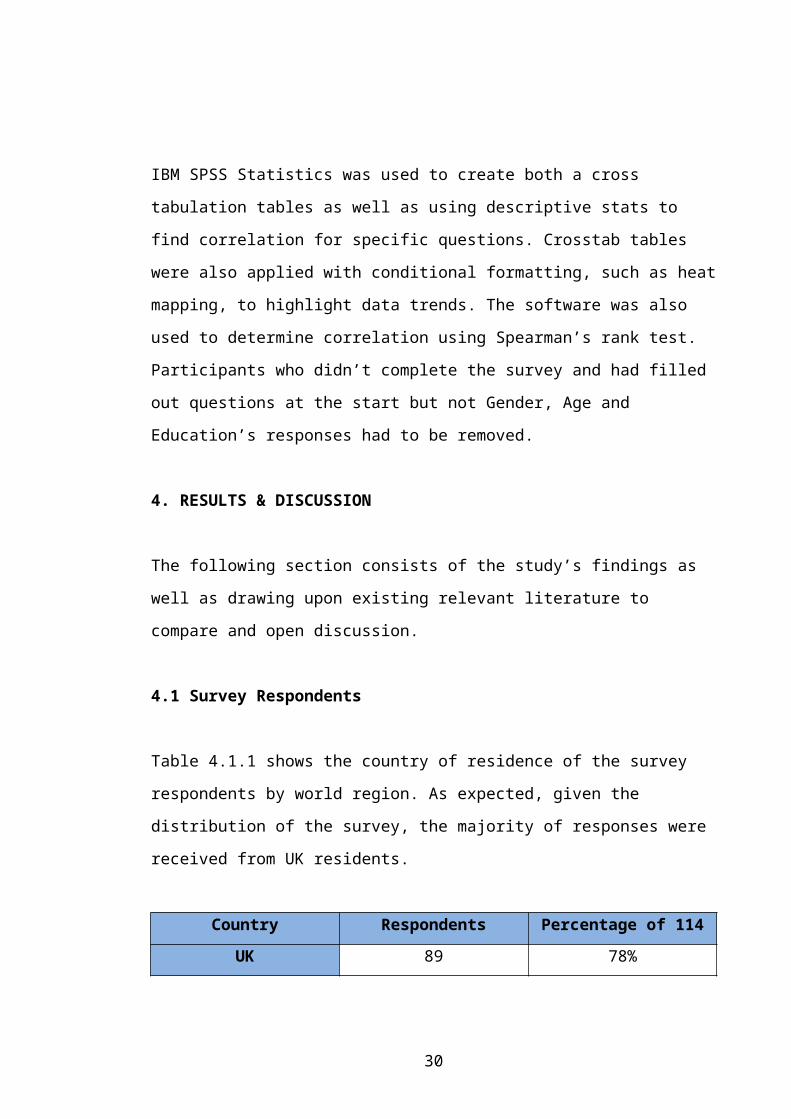
4.1 Survey Respondents
Table 4.1.1 shows the country of residence of the survey respondents by world region.
As expected, given the distribution of the survey, the majority of responses were
received from UK residents.
Country Respondents Percentage of 114
UK 89 78%
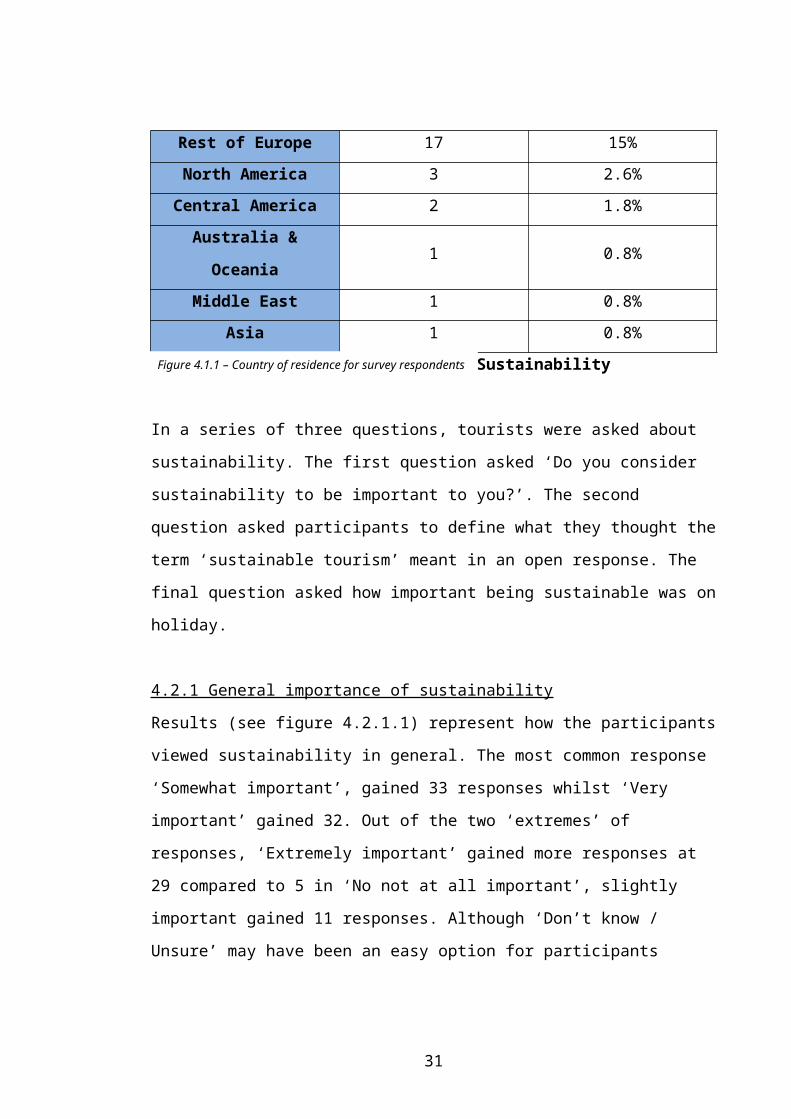
Rest of Europe 17 15%
North America 3 2.6%
Central America 2 1.8%
Australia & Oceania 1 0.8%
Middle East 1 0.8%
Asia 1 0.8%
Figure 4.1.1 – Country of residence for survey respondents
21
4.2 Importance and perceptions of Sustainability
In a series of three questions, tourists were asked about sustainability. The first
question asked ‘Do you consider sustainability to be important to you?’. The second
question asked participants to define what they thought the term ‘sustainable tourism’
meant in an open response. The final question asked how important being sustainable
was on holiday.
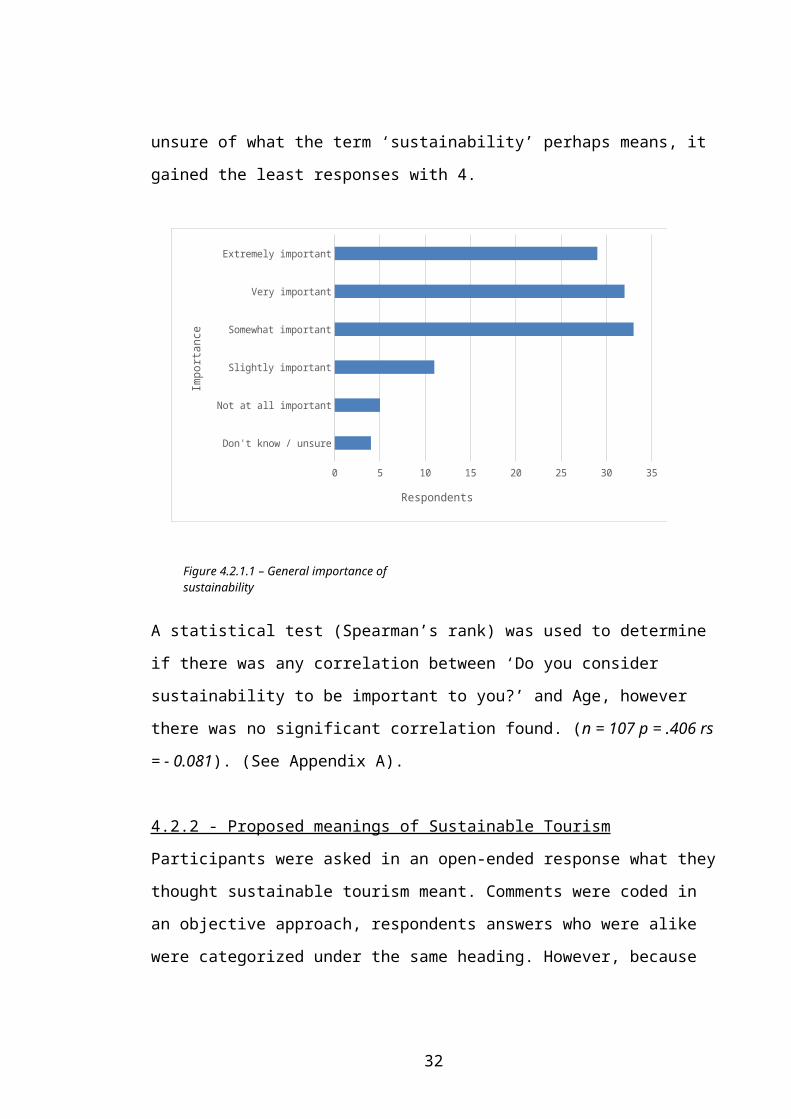
4.2.1 General importance of sustainability
Results (see figure 4.2.1.1) represent how the participants viewed sustainability in
general. The most common response ‘Somewhat important’, gained 33 responses
whilst ‘Very important’ gained 32. Out of the two ‘extremes’ of responses, ‘Extremely
important’ gained more responses at 29 compared to 5 in ‘No not at all important’,
slightly important gained 11 responses. Although ‘Don’t know / Unsure’ may have
been an easy option for participants unsure of what the term ‘sustainability’ perhaps
means, it gained the least responses with 4.
Don't know / unsure
Not at all important
Slightly important
Somewhat important
Very important
Extremely important
0 5 10 15 20 25 30 35
Respondents
Impo
rtan
ce
Figure 4.2.1.1 – General importance of sustainability
22
A statistical test (Spearman’s rank) was used to determine if there was any correlation
between ‘Do you consider sustainability to be important to you?’ and Age, however
there was no significant correlation found. (n = 107 p = .406 rs = - 0.081). (See
Appendix A).
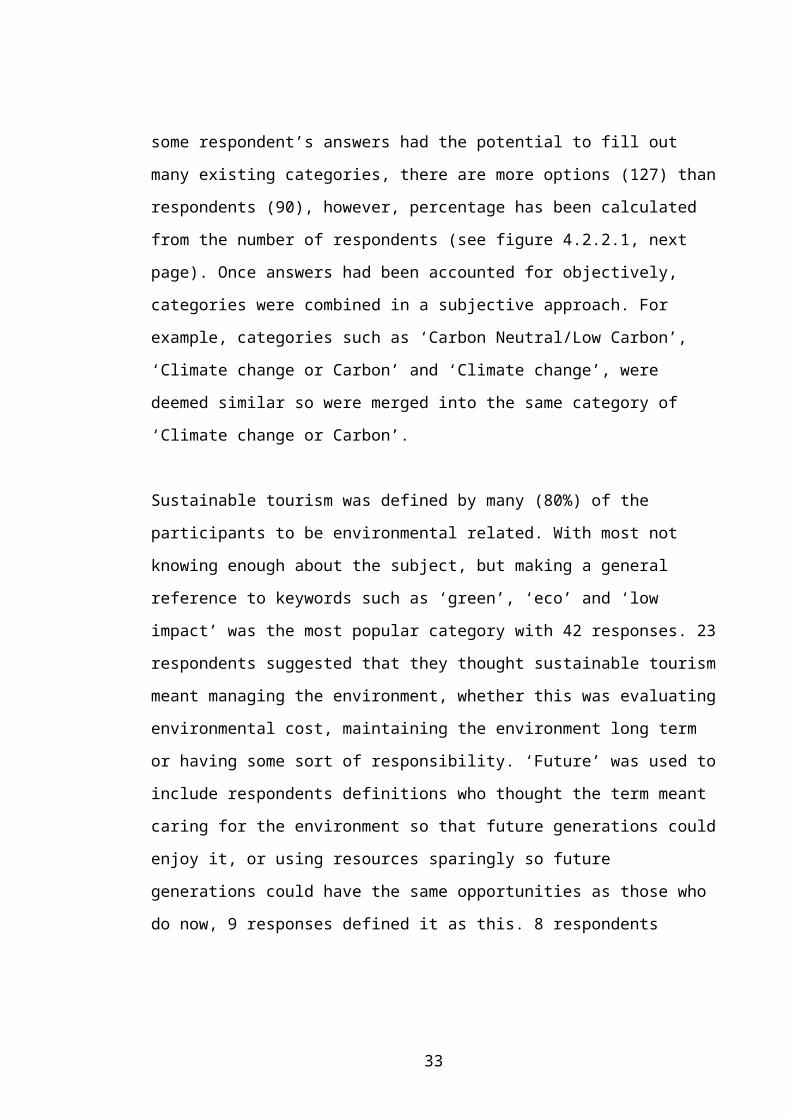
4.2.2 - Proposed meanings of Sustainable Tourism
Participants were asked in an open-ended response what they thought sustainable
tourism meant. Comments were coded in an objective approach, respondents answers
who were alike were categorized under the same heading. However, because some
respondent’s answers had the potential to fill out many existing categories, there are
more options (127) than respondents (90), however, percentage has been calculated
from the number of respondents (see figure 4.2.2.1, next page). Once answers had
been accounted for objectively, categories were combined in a subjective approach.
For example, categories such as ‘Carbon Neutral/Low Carbon’, ‘Climate change or
Carbon’ and ‘Climate change’, were deemed similar so were merged into the same
category of ‘Climate change or Carbon’.
Sustainable tourism was defined by many (80%) of the participants to be
environmental related. With most not knowing enough about the subject, but making
a general reference to keywords such as ‘green’, ‘eco’ and ‘low impact’ was the most
popular category with 42 responses. 23 respondents suggested that they thought
sustainable tourism meant managing the environment, whether this was evaluating
environmental cost, maintaining the environment long term or having some sort of
responsibility. ‘Future’ was used to include respondents definitions who thought the
term meant caring for the environment so that future generations could enjoy it, or
using resources sparingly so future generations could have the same opportunities as
those who do now, 9 responses defined it as this. 8 respondents thought the term
meant having only a positive impact on the environment or ‘geography’.
23
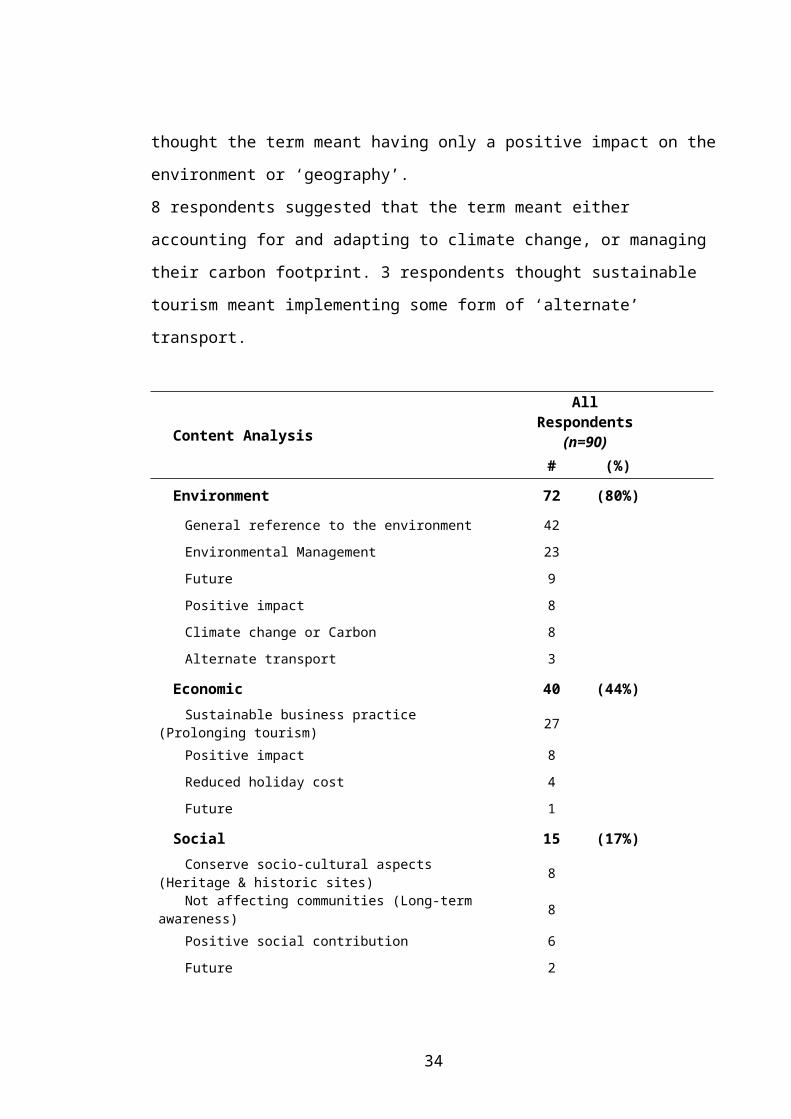
8 respondents suggested that the term meant either accounting for and adapting to
climate change, or managing their carbon footprint. 3 respondents thought sustainable
tourism meant implementing some form of ‘alternate’ transport.
Content Analysis
All Respondents(n=90)
# (%)
Environment 72 (80%)
General reference to the environment 42
Environmental Management 23
Future 9
Positive impact 8
Climate change or Carbon 8
Alternate transport 3
Economic 40 (44%)
Sustainable business practice (Prolonging tourism) 27
Positive impact 8
Reduced holiday cost 4
Future 1
Social 15 (17%)
Conserve socio-cultural aspects (Heritage & historic sites) 8
Not affecting communities (Long-term awareness) 8
Positive social contribution 6
Future 2
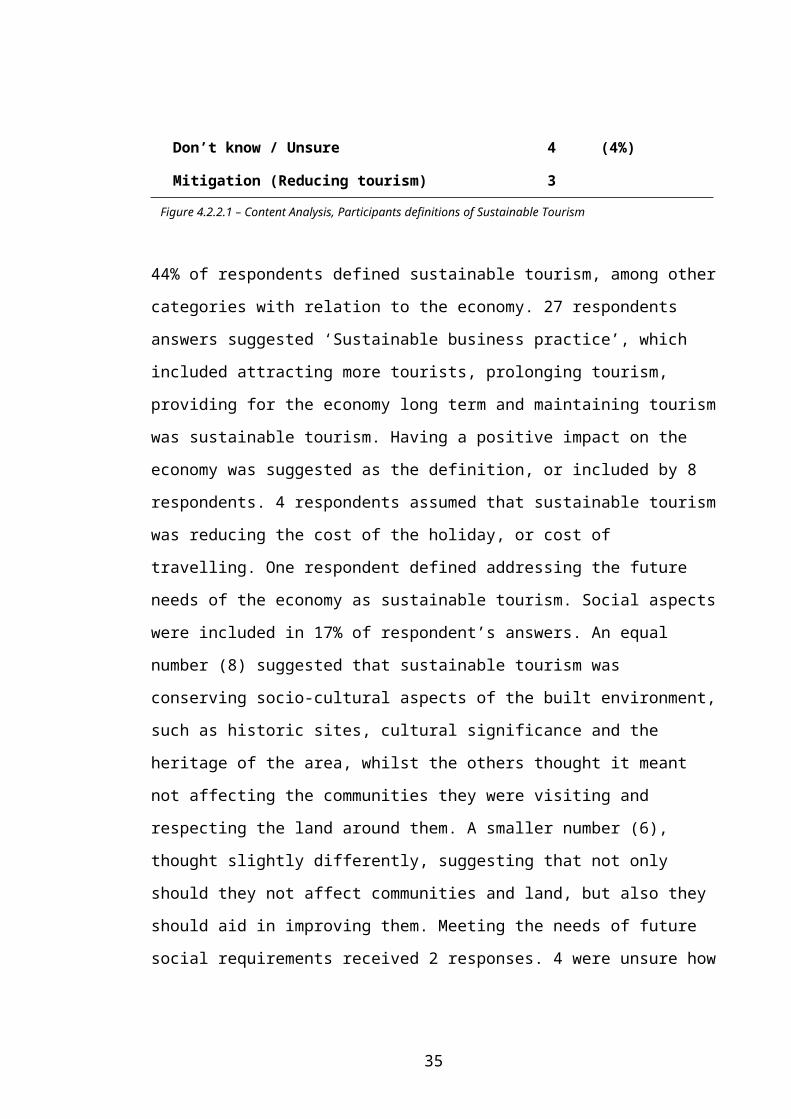
Don’t know / Unsure 4 (4%)
Mitigation (Reducing tourism) 3
44% of respondents defined sustainable tourism, among other categories with relation
to the economy. 27 respondents answers suggested ‘Sustainable business practice’,
Figure 4.2.2.1 – Content Analysis, Participants definitions of Sustainable Tourism
24
which included attracting more tourists, prolonging tourism, providing for the
economy long term and maintaining tourism was sustainable tourism. Having a
positive impact on the economy was suggested as the definition, or included by 8
respondents. 4 respondents assumed that sustainable tourism was reducing the cost
of the holiday, or cost of travelling. One respondent defined addressing the future
needs of the economy as sustainable tourism. Social aspects were included in 17% of
respondent’s answers. An equal number (8) suggested that sustainable tourism was
conserving socio-cultural aspects of the built environment, such as historic sites,
cultural significance and the heritage of the area, whilst the others thought it meant
not affecting the communities they were visiting and respecting the land around them.
A smaller number (6), thought slightly differently, suggesting that not only should they
not affect communities and land, but also they should aid in improving them. Meeting
the needs of future social requirements received 2 responses. 4 were unsure how to
answer the question. Mitigation or reducing tourism was seen as being the best
definition of sustainable tourism to 3 respondents.
Azapagic et al., (2005) found similar findings in their study in an international survey of
sustainable development perceptions in engineering students. Key findings suggested
that students thought sustainable development was important for future generations
rather than for current generations (Azapagic et al., 2005). Crucially, the study also
found that most students related sustainable development to environmental aspects
like participants did in this survey, albeit on ‘sustainable tourism’, however a significant
knowledge gap existed in social and economic aspects of sustainable development
(Azapagic et al., 2005). Similarly, a study to assess conceptions of sustainable
development in student teachers (Summers et al., 2004), found similar findings in that
a large proportion (87%) related sustainable development to environmental aspects.
Participants related economic (69%) and social (49%) aspects less so, with about a
third highlighting all three factors (Summers et al., 2004).
25
A third study looking at dissonance in students perceptions of sustainable
development found that students, like the above studies and this study, strongly relate
environmental aspects of sustainable development more so than economic and social
aspects (Kagawa, 2007). Evidently, the general conception is that sustainable
development is largely based on the environmental dimension, while social and
economic aspects are marginal.
4.2.3 Importance of sustainability on holiday
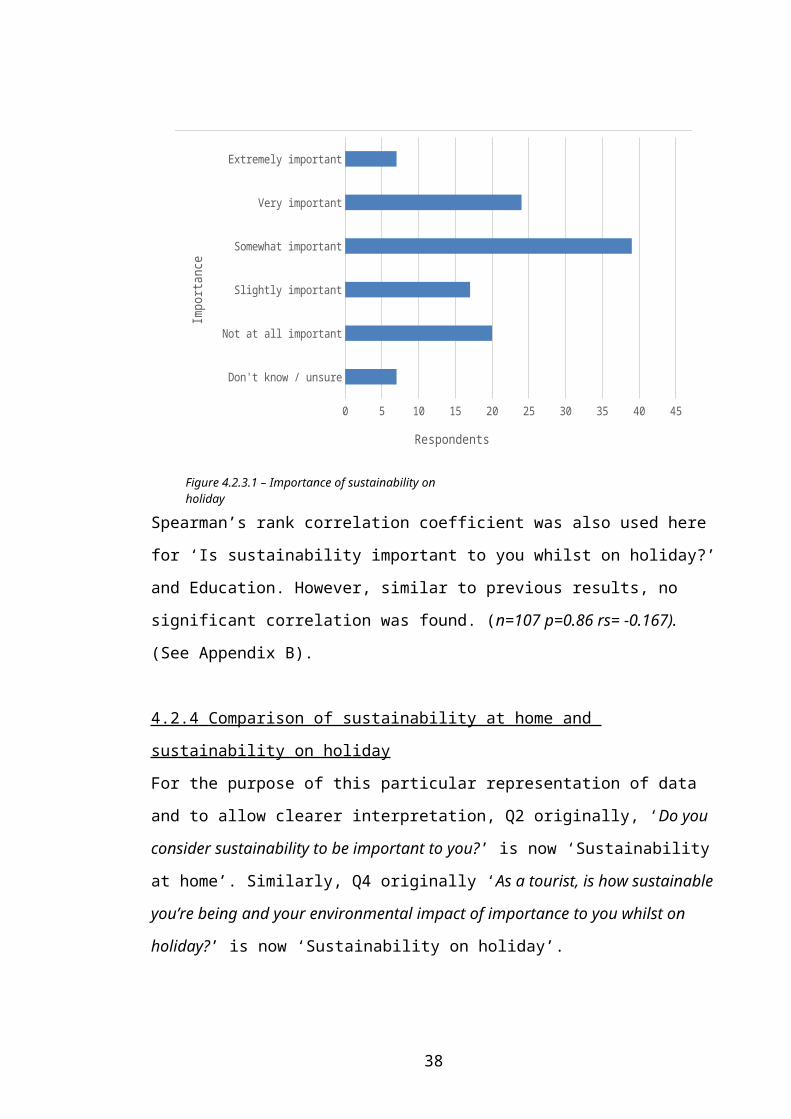
Figure 4.2.3.1 asked how participants felt about sustainability whilst on holiday.
Compared to fig 4.2.1.1 the participant’s responses are more dispersed across the
range of possible selections provided. ‘Somewhat important’ gathered the greatest
selection at 39, with ‘Very important’ collecting 29 and ‘Slightly important’ 17. ‘Not at
all important’ collected 20 responses. Both selections at the far end of the question
‘Extremely important’ and ‘Don’t know / unsure’ gathered the same number of
responses at 7.
Don't know / unsure
Not at all important
Slightly important
Somewhat important
Very important
Extremely important
0 5 10 15 20 25 30 35 40 45
Respondents
Impo
rtanc
e
Figure 4.2.3.1 – Importance of sustainability on holiday
26
Spearman’s rank correlation coefficient was also used here for ‘Is sustainability
important to you whilst on holiday?’ and Education. However, similar to previous
results, no significant correlation was found. (n=107 p=0.86 rs= -0.167). (See Appendix
B).
4.2.4 Comparison of sustainability at home and sustainability on holiday
For the purpose of this particular representation of data and to allow clearer
interpretation, Q2 originally, ‘Do you consider sustainability to be important to you?’ is
now ‘Sustainability at home’. Similarly, Q4 originally ‘As a tourist, is how sustainable
you’re being and your environmental impact of importance to you whilst on holiday?’ is
now ‘Sustainability on holiday’.
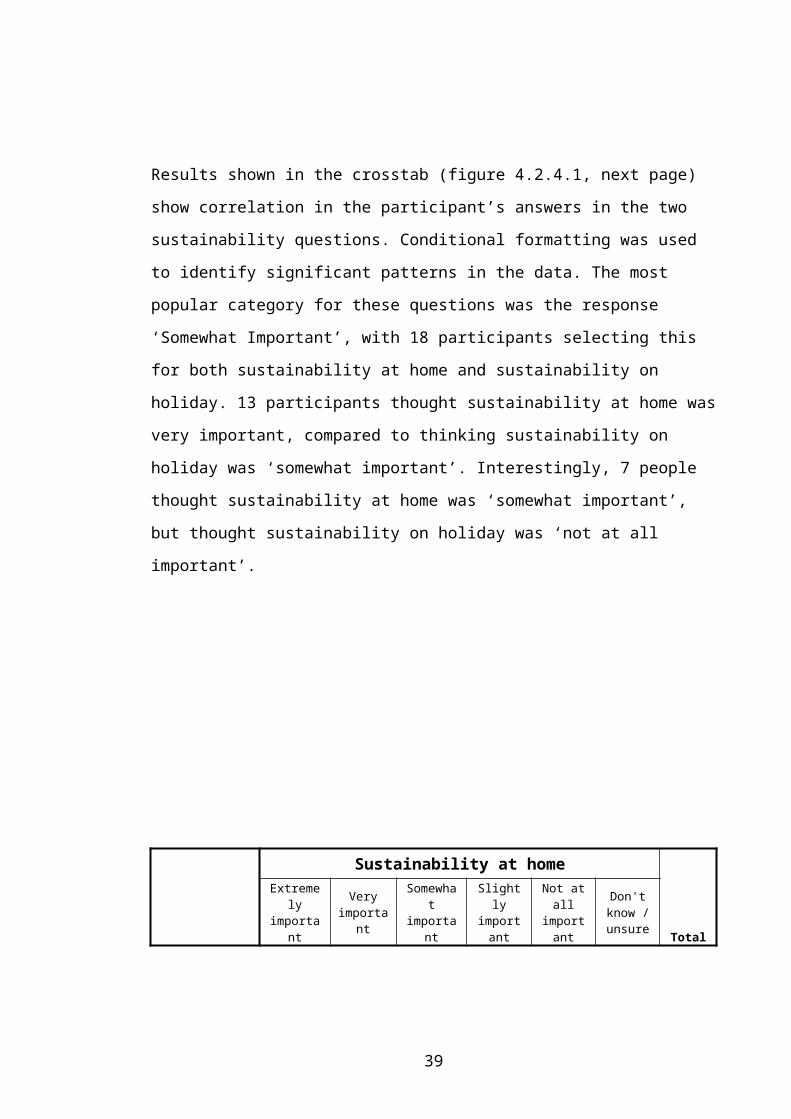
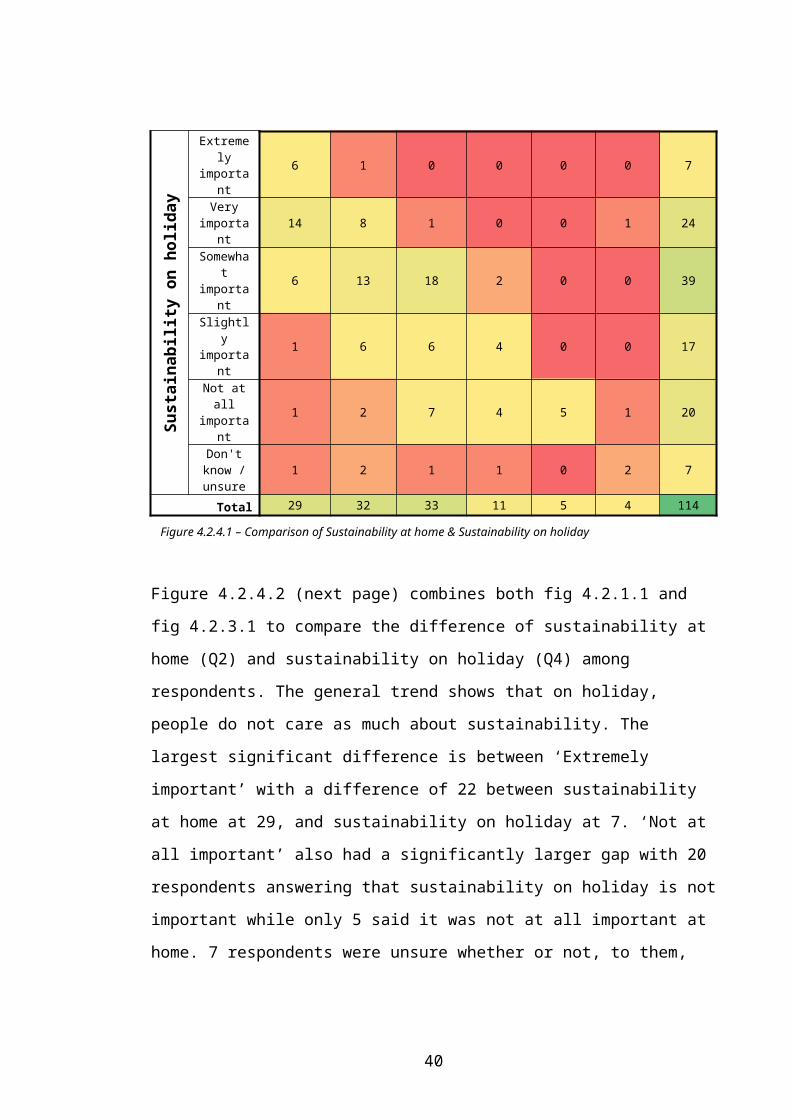
Results shown in the crosstab (figure 4.2.4.1, next page) show correlation in the
participant’s answers in the two sustainability questions. Conditional formatting was
used to identify significant patterns in the data. The most popular category for these
questions was the response ‘Somewhat Important’, with 18 participants selecting this
for both sustainability at home and sustainability on holiday. 13 participants thought
sustainability at home was very important, compared to thinking sustainability on
holiday was ‘somewhat important’. Interestingly, 7 people thought sustainability at
home was ‘somewhat important’, but thought sustainability on holiday was ‘not at all
important’.
27
Sustainability at home
Total
Extremely important
Very important
Somewhat important
Slightly important
Not at all important
Don't know / unsure
Sust
aina
bilit
y on
hol
iday
Extremely important
6 1 0 0 0 0 7
Very important
14 8 1 0 0 1 24
Somewhat important
6 13 18 2 0 0 39
Slightly important
1 6 6 4 0 0 17
Not at all important
1 2 7 4 5 1 20
Don't know / unsure
1 2 1 1 0 2 7
Total 29 32 33 11 5 4 114
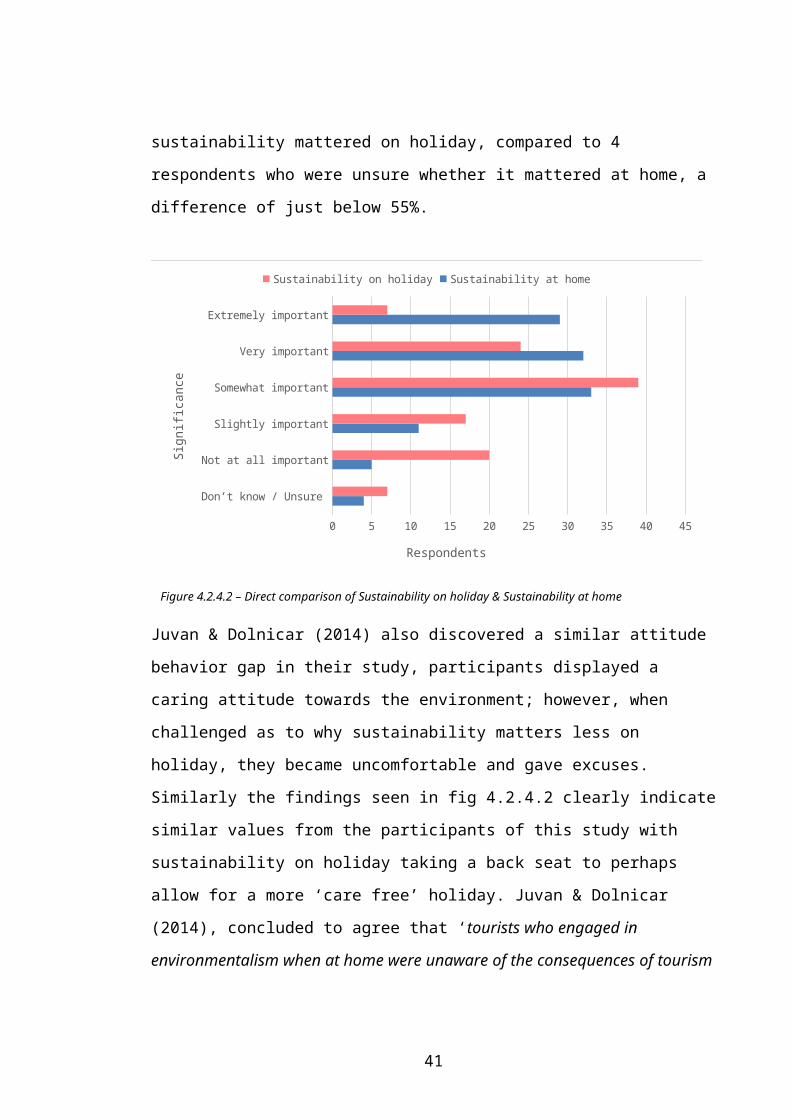
Figure 4.2.4.2 (next page) combines both fig 4.2.1.1 and fig 4.2.3.1 to compare the
difference of sustainability at home (Q2) and sustainability on holiday (Q4) among
respondents. The general trend shows that on holiday, people do not care as much
about sustainability. The largest significant difference is between ‘Extremely
important’ with a difference of 22 between sustainability at home at 29, and
sustainability on holiday at 7. ‘Not at all important’ also had a significantly larger gap
with 20 respondents answering that sustainability on holiday is not important while
only 5 said it was not at all important at home. 7 respondents were unsure whether or
not, to them, sustainability mattered on holiday, compared to 4 respondents who
were unsure whether it mattered at home, a difference of just below 55%.
Figure 4.2.4.1 – Comparison of Sustainability at home & Sustainability on holiday
28
Don’t know / Unsure
Not at all important
Slightly important
Somewhat important
Very important
Extremely important
0 5 10 15 20 25 30 35 40 45
Sustainability on holiday Sustainability at home
Respondents
Sign
ifica
nce
Juvan & Dolnicar (2014) also discovered a similar attitude behavior gap in their study,
participants displayed a caring attitude towards the environment; however, when
challenged as to why sustainability matters less on holiday, they became
uncomfortable and gave excuses. Similarly the findings seen in fig 4.2.4.2 clearly
indicate similar values from the participants of this study with sustainability on holiday
taking a back seat to perhaps allow for a more ‘care free’ holiday. Juvan & Dolnicar
(2014), concluded to agree that ‘tourists who engaged in environmentalism when at
home were unaware of the consequences of tourism in general on the environment’,
although this study doesn’t reveal whether or not participants are unaware of this, it
does reveal that whilst on holiday they are certainly less inclined to care about
sustainable practices. As discussed cognitive dissonance is the discomfort that is
caused by two contradicting beliefs. Although not categorically asked in this survey,
the theory can certainly be applied to the context of sustainable tourism within certain
data sets such as Figure 4 (Juvan & Dolnicar, 2014).
Figure 4.2.4.2 – Direct comparison of Sustainability on holiday & Sustainability at home
29
4.3 Voluntary fee for Sustainable Tourism policies
This question asked participants whether they would be prepared to pay a voluntary
fee on top of the cost of their holiday to ensure sustainable tourism policies could be
implemented.
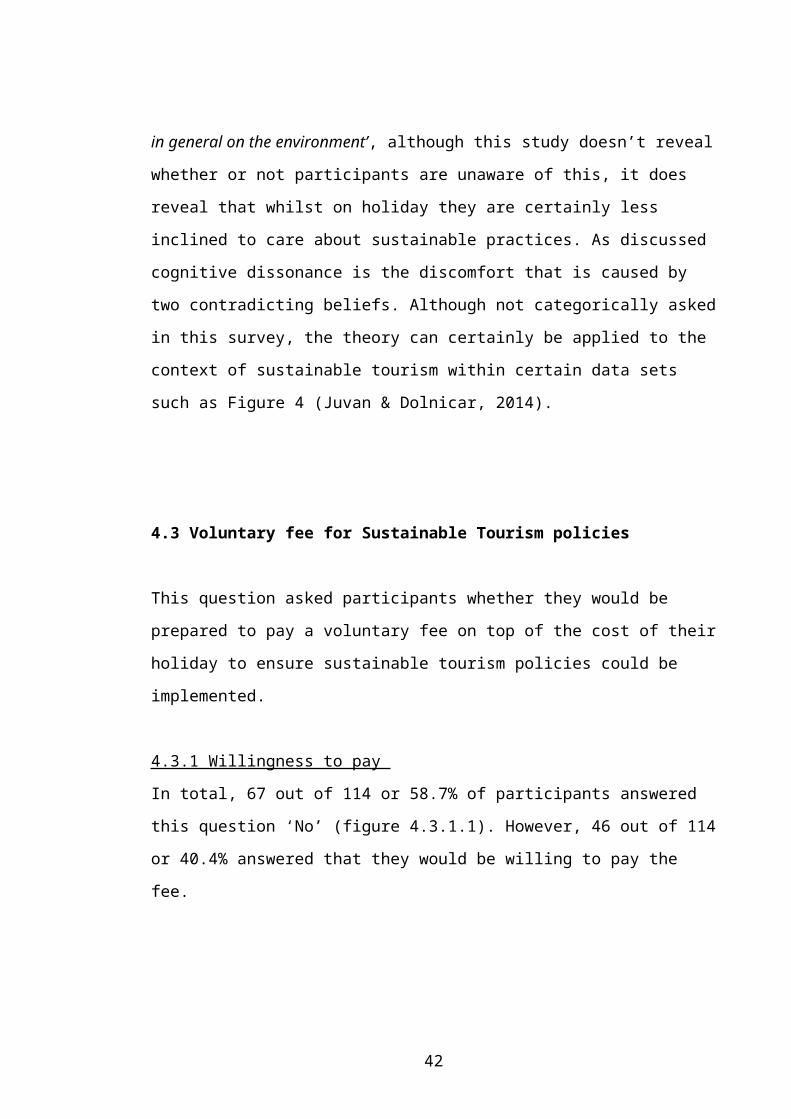
4.3.1 Willingness to pay
In total, 67 out of 114 or 58.7% of participants answered this question ‘No’ (figure
4.3.1.1). However, 46 out of 114 or 40.4% answered that they would be willing to pay
the fee.
Yes No0
10
20
30
40
50
60
70
80
Response
No. o
f res
pond
ents
A crosstab (see next page, figure 4.3.1.2), was created to show correlation between
the answer that participants gave for ‘Sustainability on holiday’, and whether they
were willing to pay for offset schemes. As seen, the most popular category was
‘Somewhat important’, 16 participants who selected this said they would be willing to
pay a voluntary fee, compared to 22 who selected the same level importance but
wouldn’t be willing to pay. 10 participants, who deemed sustainability on holiday ‘very
important’, said they would not be willing to pay, compared to 14 who said they would
Figure 4.3.1.1 –Willingness to pay for voluntary offsets
30
be. Surprisingly, out of the 7 participants who selected ‘extremely important’, only 2
said they would be willing to pay a voluntary fee, compared to 5 who said they
wouldn’t, these results matched ‘Don’t know / unsure’. Out of 17 participants who
selected ‘slightly important’ 7 said they wouldn’t pay a voluntary fee, compared to 10
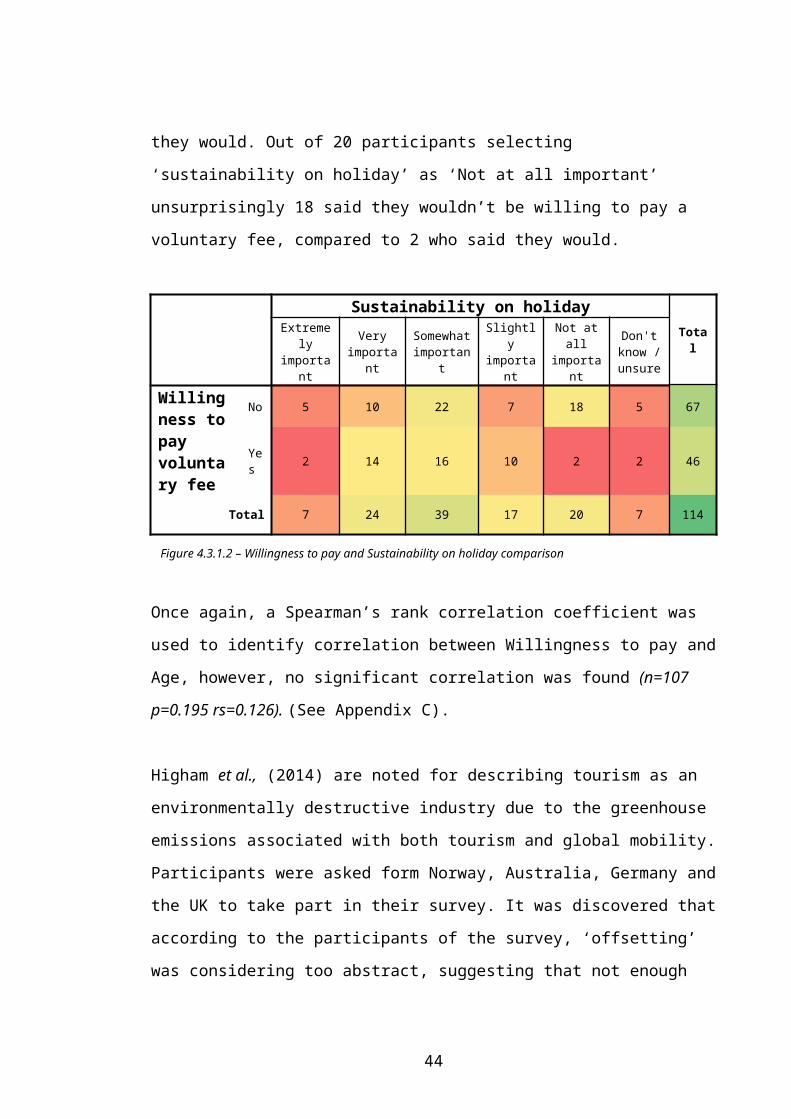
who said they would. Out of 20 participants selecting ‘sustainability on holiday’ as ‘Not
at all important’ unsurprisingly 18 said they wouldn’t be willing to pay a voluntary fee,
compared to 2 who said they would.
Sustainability on holidayTotalExtremely
importantVery
importantSomewhat important
Slightly important
Not at all important
Don't know / unsure
Willingness to pay voluntary fee
No 5 10 22 7 18 5 67
Yes 2 14 16 10 2 2 46
Total 7 24 39 17 20 7 114
Once again, a Spearman’s rank correlation coefficient was used to identify correlation
between Willingness to pay and Age, however, no significant correlation was found
(n=107 p=0.195 rs=0.126). (See Appendix C).
Higham et al., (2014) are noted for describing tourism as an environmentally
destructive industry due to the greenhouse emissions associated with both tourism
and global mobility. Participants were asked form Norway, Australia, Germany and the
UK to take part in their survey. It was discovered that according to the participants of
the survey, ‘offsetting’ was considering too abstract, suggesting that not enough
information is given on where the money would be going (Higham et al., 2014).
Additionally, in light of figure 4.3.1, the consensus among participants was that very
few travelers purchased voluntary offsets (Higham et al., 2014).
Figure 4.3.1.2 – Willingness to pay and Sustainability on holiday comparison
31
Some respondents were also asked to give feedback as to why they don’t purchase
voluntary offsets: ‘Perhaps if somebody showed me – of your daily living you're using
the equivalent of a year's worth to travel there, that's a huge amount, maybe that
would make me rethink. Maybe. I've never seen anything that tells me that’. Another
participant simply stated, ‘I don’t think we get enough information’ (Higham et al.,
2014).
By using a subjective approach, it is assumed that to a majority of the participants,
‘sustainable tourism policies’, most likely meant carbon offsetting. Among the 41
voluntary offsetting schemes currently in circulation in the aviation industry (Gossling
et al., 2009), carbon offsetting is the most heard of and accessible (i.e. when booking
flights). Comments selected from this study also suggest the same ‘Carbon offsetting
you mean? Controversial’. Carbon offsetting works by attempting to ‘neutralize’
emissions by paying for the consumption of one process in an industry and then
compensating a more often than not ‘sustainable’ industry sector such as renewable
energy (Gossling et al., 2009). However, as seen, the legitimacy and transparency that
carbon offset providers grant is questionable, with criticism often originating from the
media (Gossling et al., 2007).
Higham et al., (2014) also addresses the issues surrounding offset schemes, also
suggesting that transparency and legitimacy issues are of main concern. Broderick,
(2008) is also noted for saying that a large majority view carbon offsetting as skeptical
and uncertain as well as supporting past research that emphasizes the skepticism and
distrust associated which such voluntary offset schemes. Another participant in
Higham’s et al. (2014) survey was noted for saying the following: ‘You don’t really
know where the money goes, like, what are they being used to?... People don’t really
know what they pay to and when they do they’re not sure – so its abit of mixed
information’.
32
Similar comments were also made in this study in the optional comment box
underneath ‘Would you pay a voluntary fee?’:
- ‘If I was told exactly where the money was being spent’.
- ‘I would, but it would be extremely hard unless you were shown exactly where
the extra money went and saw the changes actually happening for everyone to
see its effect’.
- ‘Because I wouldn’t trust the true value of it and suspect companies would
mostly benefit financially at a cost to the environment’.
- ‘Would be skeptical of its effectiveness’.
Carbon offsetting as a means to smooth over the cracks of a guilty conscience due to
excessive traveling is comparable to that of cognitive dissonance associated with the
attitude behavior gap, with one participant addressing the flaw in voluntary schemes
‘it’s a way of buying conscious, but we have to change attitude’, (Higham et al., 2014).
Another study undertaken by Becken, (2007) subjected volunteers to three policy
scenarios on air travel, this being voluntary initiatives, air travel taxes and a carbon
budget. Participants argued that voluntary initiatives do not work and do not result in
any reduction in GHG emissions, similar to the comments found in this survey and
Higham et al., (2014), (Becken, 2007). Additionally, a small number of tourists also
suggested that they did not feel responsible for the emissions generated by air travel,
joking about other ways of travel such as swimming or sailing (Becken, 2007). Becken,
(2007) notes that this kind of defensive behaviour can be interpreted as ‘internal
‘dissonance’.
Interestingly however, the findings of this study discern that of Gossling’s et al., (2009)
study. Conclusively, the study suggests that ‘the broad majority of air travelers do not
seem aware of carbon offsetting as a means to reduce the environmental impacts of
33
aviation’, (Gossling et al., 2009) suggesting that if travelers were made aware of such
schemes they would be more inclined to pay the voluntary costs. Alternatively, some
participants whether they are aware of the effects of such schemes or aware of
schemes in the first place think it is the providers, operators or airlines fundamental
responsibility to cover the cost of sustainable policies and offset schemes as well as
delivering more accessible information on GHG emissions Higham et al., (2014). Similar
comments were also seen in this study with one participant commenting: ‘Operators
should take responsibility for ensuring it is covered for everyone within their costs’.
However, as previously seen even when given the option of technically any sustainable
tourism policy or offset scheme that may help protect or improve the environment,
participants answering ‘no’, significantly outnumbered the quantity of participants
who answered ‘yes’.
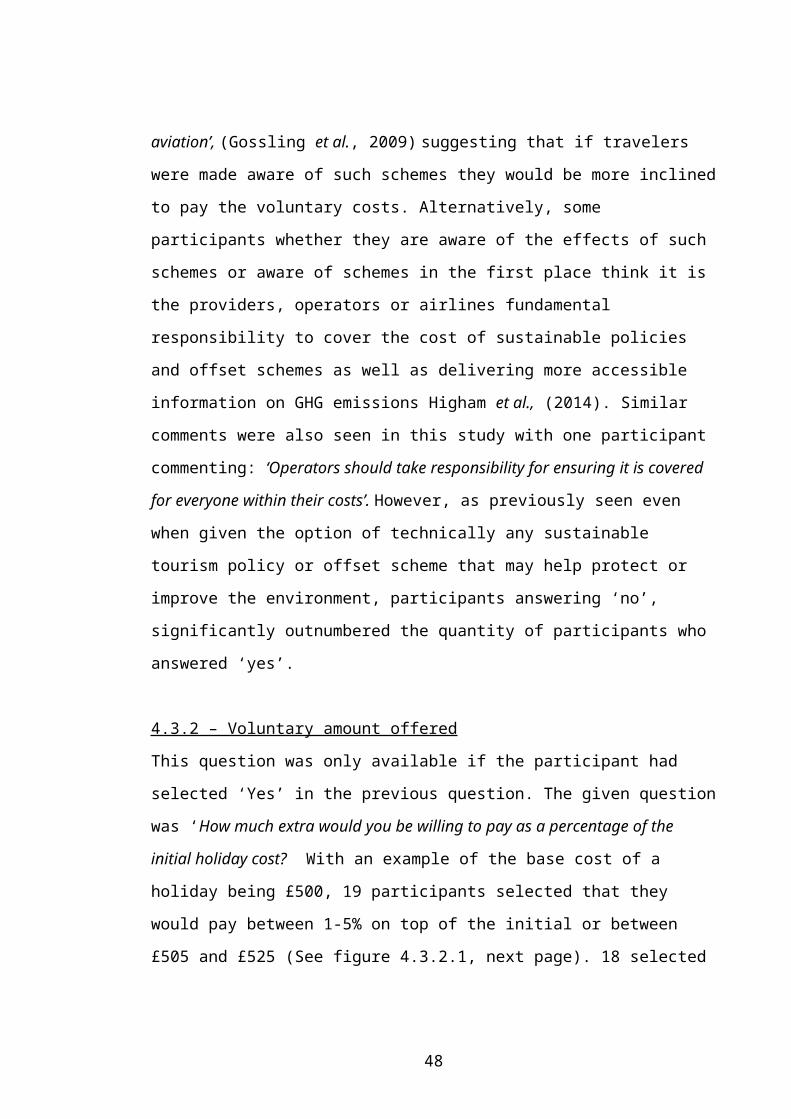
4.3.2 – Voluntary amount offered
This question was only available if the participant had selected ‘Yes’ in the previous
question. The given question was ‘How much extra would you be willing to pay as a
percentage of the initial holiday cost? With an example of the base cost of a holiday
being £500, 19 participants selected that they would pay between 1-5% on top of the
initial or between £505 and £525 (See figure 4.3.2.1, next page). 18 selected that they
would pay an extra 5-10% or £535 - £550. However only 8 selected that they would
pay between 10-15% or an extra £550-£575. Increasing optional pay scales were also
included between 15-25% (£575-£600), 20-25% (£600-£625) and more than 25%
(£625+), however nobody selected these options. It’s important to note that in fig 123
there are a total of 46 respondents in the ‘yes’ selection, however in fig 4321 there are
only 45, this is due to there being no percentage value displayed in the imported data.
34
1-5% 5-10% 10-15%0
2
4
6
8
10
12
14
16
18
20 1918
8
Percentage
Resp
onde
nts
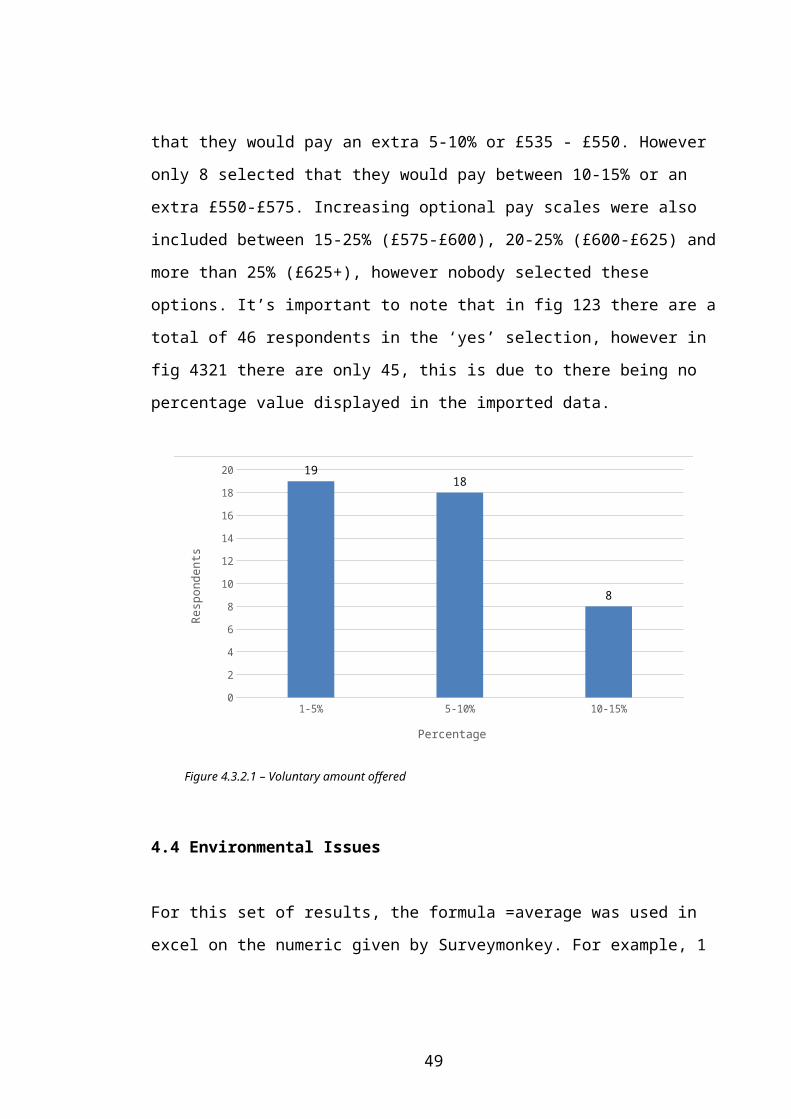
4.4 Environmental Issues
For this set of results, the formula =average was used in excel on the numeric given by
Surveymonkey. For example, 1 was ‘Very serious problem’ and 5 ‘Not at all a problem’,
therefore the lower the average the more important the issue. ‘Don’t know / Unsure’
was excluded.
Water pollution was the voted the most serious issue among participants with an
average of 2.02 (See figure 4.4.1, next page). Depletion of natural resources had an
average of 2.06. Loss of biodiversity had an average of 2.09. Shortages of freshwater
had a calculated average of 2.16. Air pollution averaged at 2.31. Climate change was
third from the bottom, with an average of 2.41, deeming it somewhere between a
serious problem and reasonably serious problem. Vehicle emissions averaged at 2.49
and Ozone layer depletion was the least serious for participants with an average of
2.55.
Figure 4.3.2.1 – Voluntary amount offered
35
Ozone layer depletion (Layer that absorbs UV radiation)
Vehicle emissions
Climate change
Air pollution
Shortages of freshwater
Loss of biodiversity (Reduction of wildlife)
Depletion of natural resources
Water pollution
0 0.5 1 1.5 2 2.5 3
Somewhat similar to the findings of this study, Brulle et al., (2012), found that Climate
change consistently ranks at the bottom of public concern in national surveys in the
United States. More recently, a study involving 1002 people funded by the Universities
of Cardiff and Nottingham discovered that although 88% of participants believe the
climate is changing, an all-time low of just 18% are concerned about it (Gosden, 2015).
4.5 Climate Change Perceptions
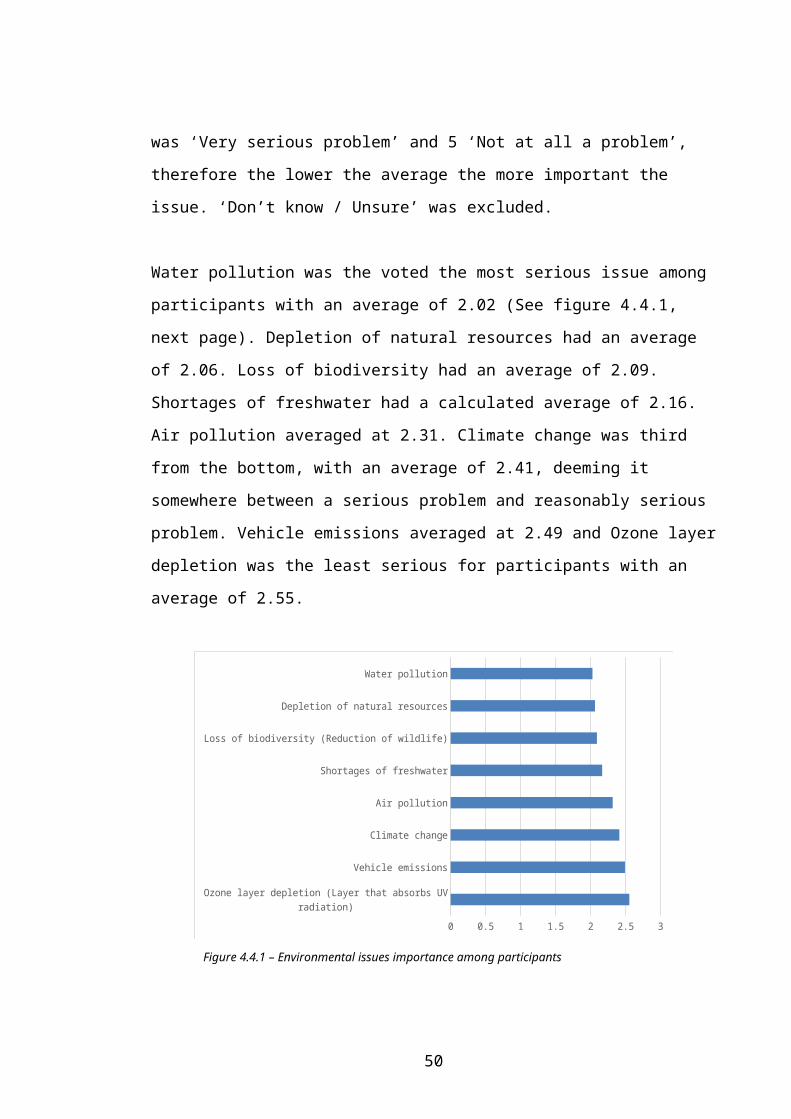
4.5.1 Participants perception on Climate Change
The first of a series of more specific questions shown in Figure 4.5.1.1 (next page)
asked the participants ‘On the subject of recent climate change (from around 1950
onwards), please select the statement below that best describes what you think’. 43%
of participants concluded that climate change was due to human activity alone, where
as 42% thought that climate change was the result of both human activity and natural
factors such as volcanoes etc. However, only 12% thought that natural factors were
the only reason the climate was changing and humans did not effect it. 2% of the
participants thought that the world’s climate is not changing, and 1% did not know.
Figure 4.4.1 – Environmental issues importance among participants
36
43%
42%
13%
2% 1%
The world's climate is changing, where this is largely due to human activities (e.g. greenhouse gas emissions)
The world's climate is changing, where this is due to both human activities (e.g. greenhouse gas emissions) and natural factors (e.g. vol-canoes, sunspot cycles)
The world's climate is changing, where this is largely due to natural factors (e.g. volcanoes, sunspot cycles)
The world's climate is not changing
Don’t know / Unsure
A similar study by Nisbet & Myers (2007) that complied surveys administered over 20
years showed how people’s opinions had changed on climate change over time. Figure
4.5.1.2 (next page) shows similar results to Figure 4.5.1.1, with participants in both
studies acknowledging that climate change is not solely due to human activity, but
through natural causes as well. Similarly, the questions were formatted so the
participants were given the choice of selecting the statement they agree with the
most, the question asked was as follows: ‘Every time we use coal or oil or gas, we
contribute to the greenhouse effect’, (Nisbet & Myers, 2007). Results are shown on the
next page.
Figure 4.5.1.1 – Participants perceptions on Climate Change
37
4.5.1.2 - Level of agreement (Greenhouse effect)
01/1994 – 05/1994 02/2000 – 05/2000
Definitely true (%) 14 18
Probably true (%) 47 44
Probably not true (%) 21 19
Definitely not true (%) 4 5
Can’t choose (%) 14 15
N 2992 2817
(Nisbet & Myers, 2007)
The study also asks participants whether or not they believe in global warming:
‘How convinced are you that global warming or the greenhouse effect is actually
happening – would you say that you are completely convinced, mostly convinced, not
so convinced, or not convinced at all?’. Results are shown below:
4.5.1.3 - Convinced by greenhouse effect
06/05 09/05
Completely convinced (%) 23 23
Mostly convinced (%) 36 33
Not so convinced (%) 24 22
Not convinced at all (%) 16 17
No opinion (%) 2 4
N 1002 1019
(Nisbet & Myers, 2007)
Another more recent study looking at climate change perceptions in Wales asked the
same question in this study about whether climate change arose from human activity,
natural processes, or a combination of both. 52% of respondents agreed that climate
38
change arose from a combination of both, with 35% considering it was due to human
activity and 11% stating that climate change was due to natural processes (Capstick et
al., 2013). Beliefs about the degree to which climate change is caused are somewhat in
line with findings of this study with the most common viewpoint being that the cause
of climate change is a mixture of both human and natural processes. The study also
suggested that the public’s perception of climate change fluctuates over time, in line
with the findings of Nisbet & Myers (2007) study.
Kempton (1991) identified four aspects to public perceptions on climate change. The
first was that participants commonly linked or mistook climate change for ozone layer
damage. Second, they confused greenhouse gases with other pollutants in the
troposphere. Third, participants assumed that because of increasing CO2 levels, global
oxygen levels would decrease due to the absorption process in photosynthesis. Finally,
participants related unusual weather events such as hot summers and cold winters to
climate change. However, according to Henry (2000), since this study was undertaken
the public are better informed about what climate change is. Similarly, a study
undertaken by Becken (2004) found that tourists were moderately educated about
climate change, however like participants in Kempton’s (1991) study tended to confuse
it with other environmental problems (see also Lorenzoni & Pidgeon, 2006; Stoll-
Kleemann et al., 2001).
A study by Brulle et al., (2012) in the United States found that climate change and
environmental issues consistently rank at the bottom of public concern. Conclusively,
Brulle et al., (2012) discovered that media coverage of climate change could
significantly influence the public’s perception of its importance as well as quantity in
which it is distributed, in line with Becken’s (2007) study that agreed the discourse
surrounding climate change such as media has an important role in influencing public
perception. Clearly, the media, political and governmental environment are the single
biggest influencers on the public’s perception of climate change, as was also found by
39
McDonald (2009), ‘When elites disagree, polarization occurs, and citizens rely on other
indicators, such as political party or source credibility, to make up their minds’, which
coincidentally, is the case for climate change.
4.6 Winter Sports questions results
4.6.1 Winter Sports Qualifying question
Participants were asked if they had been on a winter sports holiday in the last 3 years.
By answering yes to this question, participants were able to access ski industry specific
questions and participants who answered ‘no’ skipped the ski industry section. 83%
answered ‘yes’ 17% answered ‘no’.
93
19
Yes No
Figure 4.6.1.1 – Winter sports qualifying question
40
4.6.2 – Winter Sports Disciplines
Figure 4.6.2.1 represents the winter sports activity which respondents took part in.
Skiing was the most popular winter sports activity with 74 participants selecting it.
Snowboarding was the second most popular with 31 participants selecting it. Cross-
country skiing and ‘other’ both collected 5 responses. Activities categorized under
‘other’ include snowmobiling, snowshoeing, photography and mountaineering. It is
important to note that due to some respondents have multiple winter sports
disciplines, there are more than 114 responses (the total number of responses for the
whole survey).
Snowboarding Skiing Cross-country skiing Other0
10
20
30
40
50
60
70
80
Activity
Resp
onde
nts
4.6.3 – Frequency of winter sports holidays
Figure 4.6.3.1 (next page) displays the frequency participants went on a winter sports
holiday. Interestingly, 38 out of 88 participants or 43% said that they went on a winter
sports holiday more than twice per year. 27 out of 88 went on winter sports holidays
once per year with 12 participants going twice per year. 7 participants went on a
winter sports once every two years and only 4 less than once every two years.
Figure 4.6.2.1 – Winter sports disciplines
41
More than twice per year
Twice per year Once per year Once every two years
Less than once every two years
0
5
10
15
20
25
30
35
40
Frequency
Resp
onde
nts
4.6.4 – Participants who have been on a Winter Sports Holiday to more than one
location
Aiming to identify how many participants had visited more than one location for a
winter sports holiday, 58% had been to more than one location. 42% had only been to
one (Figure 4.6.4.1).
Participants who had been to more than one loca-tion
Participants who had only been to one location0
10
20
30
40
50
60
Resp
onse
s
Figure 4.6.3.1 – Frequency of winter sports holidays
Figure 4.6.4.1 – Participants who had been on a winter sports holiday to more than one location
42
4.6.5 – Most frequented country
Europe was the most frequented country with 90 participants selecting it (Figure
4.6.5.1). N.America received 29 responses. 19 participants had visited Canada. 15
participants had visited New Zealand. S.America only received 4 visitors. Australia and
Japan had an equal number of visitors (3). S.Korea and Scandinavia only received 1
response. There are more than 114 responses because as seen previously in fig312
58% of participants had been to more than one location.
Scandinavia
S. Korea
Australia
Japan
S. America
NZ
Canada
N. America
Europe
0 10 20 30 40 50 60 70 80 90 100
Responses
Coun
try
4.6.6 – Factors of importance when choosing a holiday destination
Participants were asked what they considered the most important factors when
choosing a destination for their winter sports holiday (See results, figure 4.6.6.1 next
page). For this set of results, the formula =average was used in excel on the numeric
given by Surveymonkey. For example, 1 was ‘Very important’ and 5 ‘Not at all
important’, therefore the lower the average the more important the factor. Reliability
of snow cover was voted the most important factor, having the lowest average of 1.6.
Resort size & quality was the second most important with an average of 1.8. Cost of
trip had an average of 2.1. Quality of accommodation & facilities had an average of 2.3.
Figure 4.6.5.1 – Most frequented country
43
Location had an average of 2.4. Location had an overall average of 2.4. Due to there
being 5 responses, factors with an average of higher than 2.5, were ‘overall’ less
important, such as Living costs when there and Word of mouth / recommendation
from friends and family with an equal average of 2.6. Becoming less important, where
family or friends are going had an average of 3.1. The sustainability of the resort
unsurprisingly was deemed slightly less than moderately important with an average of
3.2. Travel distance had an average of 3.2. The sustainability of the accommodation
and facilities, surprisingly however was more important to participants than Nightlife,
with an average of 3.2 compared to 3.3.
Night life (Apres Ski)
The sustainability of the accommodation & facilities
Travel distance from home to destination
The sustainability of the resort
Where family or friends are going
Word of mouth / recommendation from friends and family
Living costs when there
Location (country / region / mountain range)
Quality of accommodation & facilities
Cost of trip (travel, accommodation, ski pass)
Resort size & quality (e.g. variety of runs, lifts etc.)
The reliability of snow cover
0 0.5 1 1.5 2 2.5 3 3.5
Figure 4.6.6.1 – Factors of importance when choosing holiday destination
44
4.6.7 – Perceptions on the current impact of climate change on the length of the
natural ski season
In a two-part question, participants were asked if they thought the impact of climate
change is already having an impact on the length of the natural ski season (see figure
4.6.7.1) and whether they thought it would have an impact in the future or not
(section 4.6.8, next page). A majority, or 57%, participants thought that climate change
was having an impact on the length of the natural ski season. Interestingly however,
35% participants thought that climate change does not have an impact on the length
of the ski season. 8% participants thought that climate change was set to increase the
length of the natural ski season.
31
7
51
The natural snow ski season is not changing as a result of climate change
The natural snow ski season is increas-ing in length as a result of climate change
The natural snow ski season is reducing in length as a result of climate change
Figure 4.6.7.1 – Perceptions of current impact of climate change on length of the natural ski season
45
4.6.8 – Perceptions on whether the impact of climate change will have an effect on ski
season length in the future
70% of participants agreed that in the future, the length of the natural snow ski season
is likely to decrease as a result of climate change. 22% said the length of the natural ski
season is not likely to be affected by climate change, while 8% said the length of the
natural ski season would increase.
20
7
62
The length of the natural snow ski season is not likely to be affected by climate change in the futureIn the future, the length of the natu-ral snow ski season is likely to in-crease as a result of climate changeIn the future, the length of the natu-ral snow ski season is likely to de-crease as a result of climate change
Figure 4.6.8.1 – Perceptions on whether impact of climate change will have an effect on ski season length in the future
46
4.6.9 - Comparison of climate change impacts now, and in the future responses
The following results (figure 4.5.9.1) aim to compare the responses participants gave
for the previous two questions. Q14 is current effects on ski season length; Q15 is
effects on ski season length in the future. Due to the length of the given responses,
numbers have been allocated as follows:
Q14:
1. The natural snow ski season is not changing as a result of climate change
2. The natural snow ski season is increasing in length as a result of climate change
3. The natural snow ski season is decreasing in length as a result of climate change
Q15:
1. The length of the snow ski season is not likely to be affected by climate change
in the future
2. In the future, the length of the natural snow ski season is likely to increase as a
result of climate change
3. In the future, the length of the natural snow ski season is likely to decrease as a
result of climate change
1 2 3
1 17 1 2 202 5 2 0 73 9 4 49 62
31 7 51 116
Q14Total
Q15
Total
Numeric 3 was the most common duplet of responses from participants, stating that
climate change is decreasing the length of the natural ski season now and will continue
to do so in the future. Surprisingly, numeric 1 was the second most common
combination, stating that the ski season and length of it is not changing due to climate
change.
4.6.10 - Comparison of artificial and natural snow
Figure 4.5.9.1 – Comparison of climate change impacts now and in the future responses
47
Participants were asked whether they could tell the difference between artificial and
natural snow and whether they preferred it to natural snow (figure 4.6.10.1).
Evidently, a majority of respondents (77%) said they could tell the difference between
artificial and natural snow, saying they preferred natural snow. 17% of respondents
said that they could tell the difference, but there is no difference in the quality of
experience they have. A small proportion (6%) said they could not tell the difference
between natural and artificial snow. Predictably, not one participant said that they
preferred artificial snow to natural snow.
Yes - I can tell the difference - natu-ral snow is better than artificial snowYes - I can tell the difference - BUT there is no difference in the quality of the experience on natural or arti-ficial snowYes - I can tell the difference - arti-ficial snow is better than natural snowNo - I cannot tell the difference be-tween natural and artificial snow
4.6.11 - How should artificial snow be used?
Figure 4.6.10.1 – Comparison of artificial and natural snow
48
A Likert type scale response was used to compile level of agreement data. Participants
were asked to select their level of agreement to the statements shown in the results
below (see fig 4.6.11.1). Using the numeric given (such as 1 matched ‘strongly agree’
and 2 ‘agree’, etc), the average was found for each of the statements given. The
formula =1/ was then used to show the true level of importance, i.e. reversing the
data. A rank method was then used on these to identify the overall level of agreement
for each statement.
As seen, a majority of respondents strongly agreed that artificial snow should be used
in high traffic areas to maintain the snow base and accessibility. The next most popular
response was to use artificial snow in low altitude areas to prolong the ski season
towards the end. Next, participants voted that artificial snow should be used to extend
the length of the natural ski season and continue to attract winter sports tourists.
Second from the bottom, participants said they’d like to see artificial snow being used
to extend the season in spring. The least popular use for artificial snow among
participants was to open the resort earlier in the Autumn/Fall.
Artificial snow should be used to allow the ski season to be opened earlier in the Autumn/Fall.
Artificial snow should be used to extend the ski season later in the Spring.
The use of artificial snow is a sustainable way to extend the length of the natural snow season and to continue to attract winter sports tourists
Artificial snow should be used in low altitude areas, so that a prolonged snow base can be guaranteed in these locations during the end of the season.
Artificial snow should be used in high traffic areas to maintain the snow base and accessibility.
0 1 2 3 4 5 6
Level of importance
Resp
onse
4.6.12 - Negative effects associated with using artificial snowFigure 4.6.11.1 – How should artificial snow be used?
49
A large proportion (61) said they think that using artificial snow has negative effects,
while only 27 respondents thought that using it caused no negative effects (figure
4.5.12.1).
Yes No0
10
20
30
40
50
60
70
4.6.13 - Willingness to visit resort if large proportion of snow was artificial
Participants were asked how willing they would be to visit a resort if they knew it was
largely artificial snow (see 4.6.13.1, next page). A considerable number of tourists (31)
said they would be much less inclined. An equal number of tourists (25), said they
would either be somewhat less inclined, or where neither more nor less inclined. 6
respondents said they would be somewhat more inclined, perhaps due to the
possibility of guaranteed snow cover. Surprisingly, 1 respondent said they would be
more inclined to visit the resort, again, surprising considering in fig 4.6.10.1 no one
suggested they prefer artificial snow to natural snow.
Figure 4.6.12.1 – Negative effects associated with using artificial snow
50
More inclined
Somewhat more inclined
Neither more or less inclined
Somewhat less inclined
Much less inclined
0 5 10 15 20 25 30 35
As seen, participants in this study were asked whether they could differentiate
between artificial snow and natural snow, a majority voted that natural snow is better,
with the second highest voting that there is no difference, and even less saying there
was no difference. However, not one participant agreed that artificial snow is better
than natural snow. As previously mentioned, snow making machines are being used to
mitigate the effects of climate change in low-lying resorts. Scott & Dawson (2007),
agree that due to the large investment in artificial snow making over the last 25 years,
the vulnerability of some resorts has been delayed until at least mid-century. Artificial
snowmaking was also discovered to be surprisingly efficient albeit expensive (English,
2014), contrary to what participants and perhaps winter tourists in general think, as
was discovered in the optional comment section at the end of these questions:
- ‘Imagine it is energy intensive’
- ‘Waste of water and energy!’
- Fuel use
- Unnecessary increased carbon footprint
Figure 4.6.13.1 – Willingness to visit resort if large proportion of snow was artificial
51
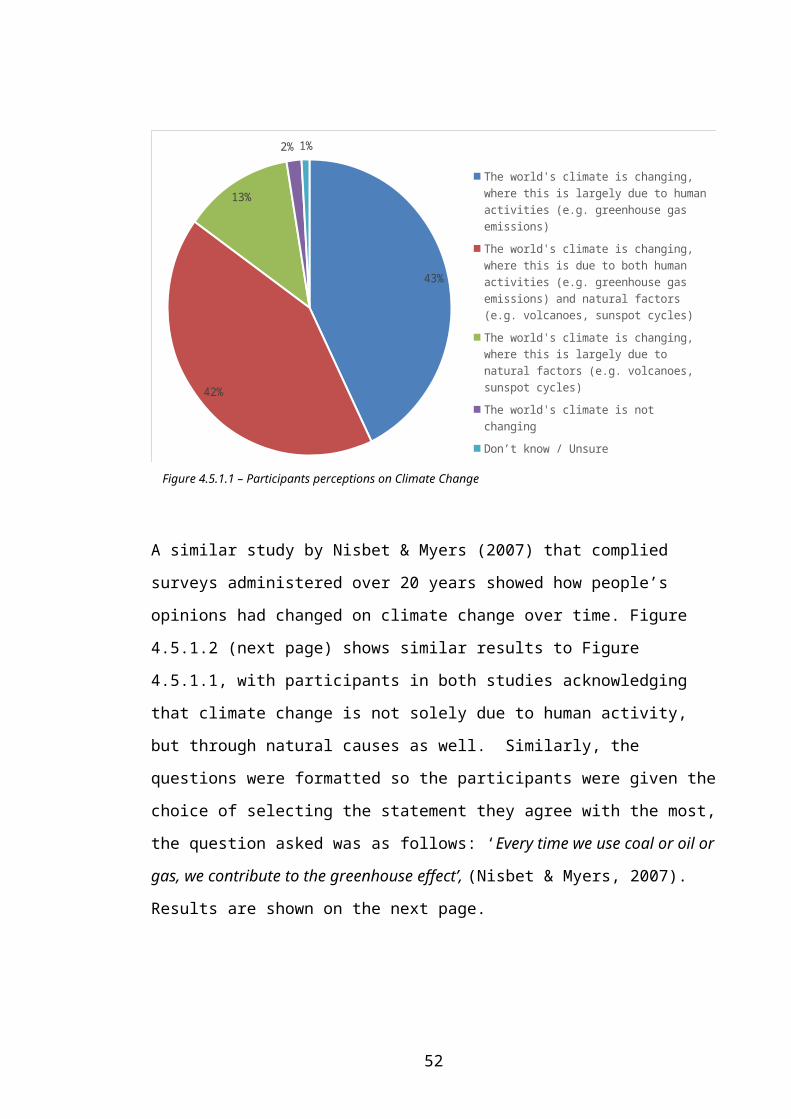
- A lot of energy is used making artificial snow
- Uses a lot of resources
Some of those who left comments seemed aware of the consequences of using it as a
means of technical adaptation to climate change; however, others suggested that they
would rather not see it used as much, while some agreed it could be used to sustain
local resorts:
- ‘Artificial snow cannot be used to extend the season, but it can assist it I think’
- ‘To help sustain the local economy and the health and wellbeing of sedentary
tourists make snow but be aware of the costs’
- ‘Different types of artificial snow. Some use chemicals, which then run off into
the water table with possible negative consequences’
- ‘If I've fork(ed) out lots of money to only ride artificial snow I'll be ragin'
4.6 General Information
4.6.1 - Gender of participants
38% of participants were female; where as 62% of participants were male.
Male Female
Figure 4.6.1.1 – Gender of participants
52
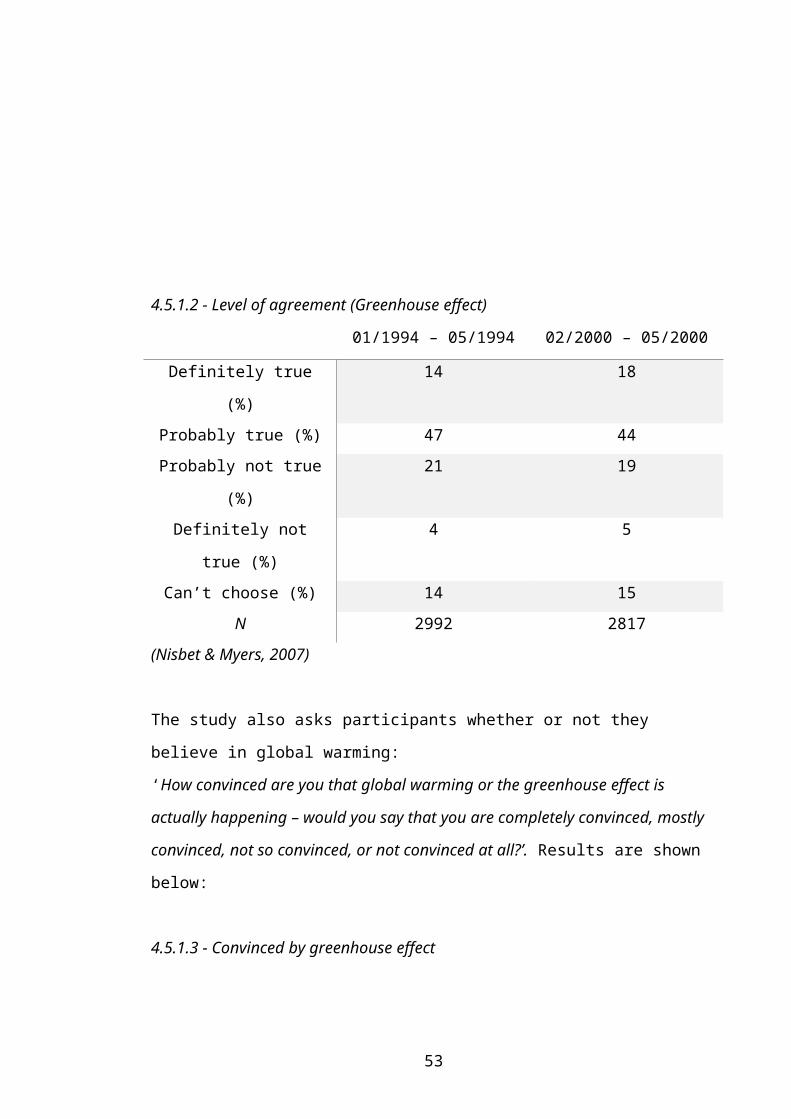
4.6.2 - Age range of participants
A majority of participants were aged between 16 – 24 (42). 18 participants were aged
between 25 – 34 and 17 participants were aged between 35 – 44. An equal number of
participants were aged between 45 – 54 and 55 – 64 (15), (see figure.
16 - 24 25 - 34 35 - 44 45 - 54 55 - 640
5
10
15
20
25
30
35
40
45
4.6.3 - Level of Qualifications
An undergraduate degree was held by a majority of the participants (51). 28
participants held a postgraduate degree. 16 Participants held an A level or BTEC. 5
Participants held a GCSE / O level. 6 participants would rather not say, and 1 held no
formal qualifications (See results, 4.6.3.1).
Postgraduate Degree
Undergraduate Degree
A Level / BTEC
GCSE / O Level
No formal qualifications
Rather not say
0 10 20 30 40 50 60
Figure 4.6.3.1 – Level of Qualifications
Figure 4.6.2.1 – Age range of participants
53
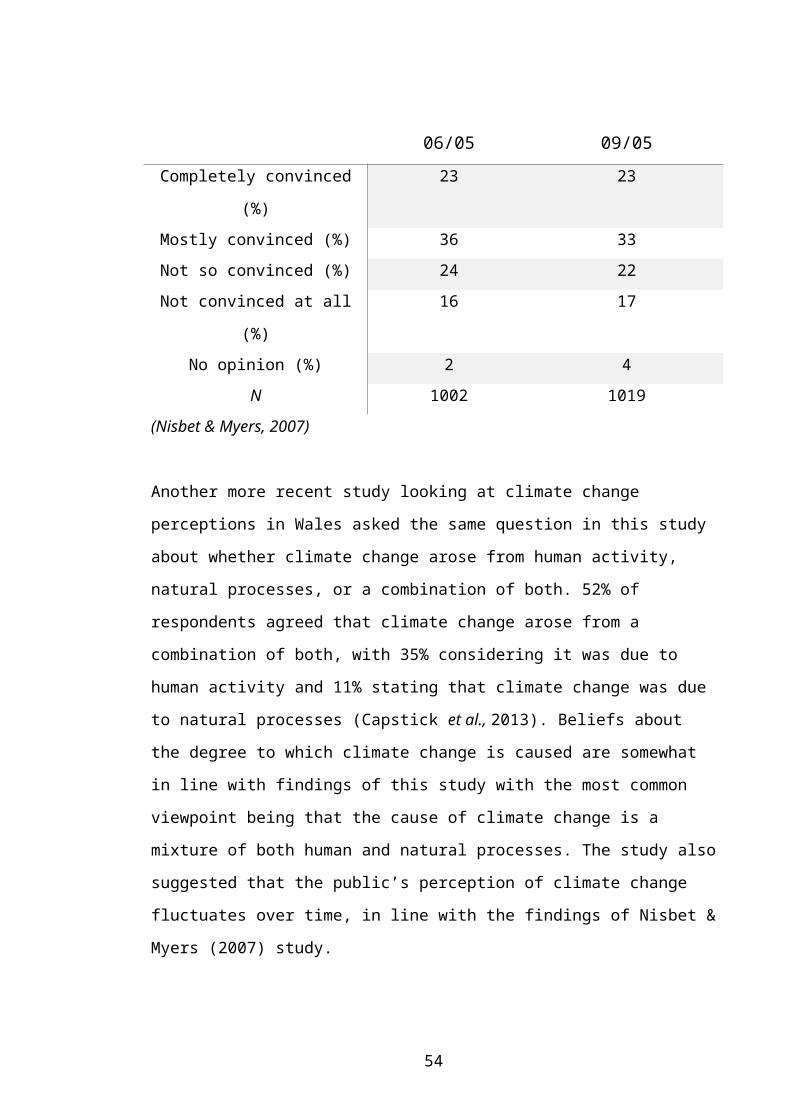
5. CONCLUSIONS
This paper primarily focuses on tourism and climate change with a focus on the ski
industry as a prime example, supplemented by a detailed analysis of the attitude
behavior gap that lies within sustainable tourism and means of technical adaptation to
climate change. Building upon similar and past research investigations of climate
change, cognitive dissonance, tourism and the winter sports industry, the paper aims
to mediate an understanding of public perception on sustainable tourism and
investigate whether technical adaptation can be used to mitigate the effects of climate
change. Additionally it has been discovered that tourists are generally unwilling to aid
in sustainable development, stating they feel skeptical and unsure of voluntary offset
schemes as well as feel unaccountable for the emissions impacts they have in
travelling.
For example, perceptions on climate change fluctuate over time as seen in numerous
papers throughout this study. Ultimately leading to the public ceasing to act against
climate change. Voluntary carbon offsetting for example, is viewed as skeptical and
uncertain by many, part in due to widespread criticism from the media and lack of
information. Brown & Fraser (2006) suggest that what they call the business case,
which builds on neoclassical economics, generally favours a voluntary approach. The
data collected in this paper, as well as the synthesis of data from other topically similar
papers fits in well with this idea, as there are no defined policies for environmental
tourism and sustainable development. Additionally, it was suggested that it is the
tourism industry, operators and airlines responsibility to define and implement
environmental sustainability, suggesting that it is not required of the tourist, or
consumers to be environmentally aware (Nilsen & Ellingsen, 2015). Conveniently, for
the consumer at least, this ties in with Juvan & Dolnicar’s (2014), study that sought to
investigate attitudes towards sustainability. It proved that although consumers care
about the environment and the impact they have whilst on holiday, they are not
54
willing to make sacrifices in order to protect it, and become uncomfortable and
defensive at the thought of doing so.
Conclusively, and as is stated throughout this paper, people generally care about the
environment and do not wish to harm it, however are not willing to make sacrifices in
their own lives in order to preserve it for future generations. People are also less
concerned about being sustainable on holiday, perhaps due to their belief of a shifting
of responsibility when they leave their country, awarding that responsibility to travel
providers and large corporates. Voluntary offset schemes, such as carbon offsets are
seen as ‘skeptical’ and ‘untrustworthy’, further distancing tourists from the concept of
sustainable travel. The theory of cognitive dissonance and the psychological
dimensions of tourists do, and will continue to have a mitigating effect on the progress
of sustainable development and travel. Until factors such as climate change, voluntary
offset schemes, and sustainability in general are made more transparent, more
available, and more up to date, the public and tourists will continue to feel alienated
from the concept of sustainable travel and development.
6. REFERENCES
Adler, N., Martini, G. and Volta, N. (2013) 'Measuring the environmental efficiency of the global aviation fleet'. Transportation Research Part B: Methodological, 53 pp.82-100.
Albers, S., Bühne, J. and Peters, H. (2009) 'Will the EU-ETS instigate airline network reconfigurations?’. Journal of Air Transport Management, 15(1) pp.1-6.
Azapagic, A., Perdan, S. and Shallcross, D. (2005) 'How much do engineering students know about sustainable development? The findings of an international survey and possible implications for the engineering curriculum'. European Journal of Engineering Education, 30(1) pp.1-19.
Becken, S. (2004) 'How Tourists and Tourism Experts Perceive Climate Change and Carbon-offsetting Schemes'. Journal of Sustainable Tourism, 12(4) pp.332-345.
55
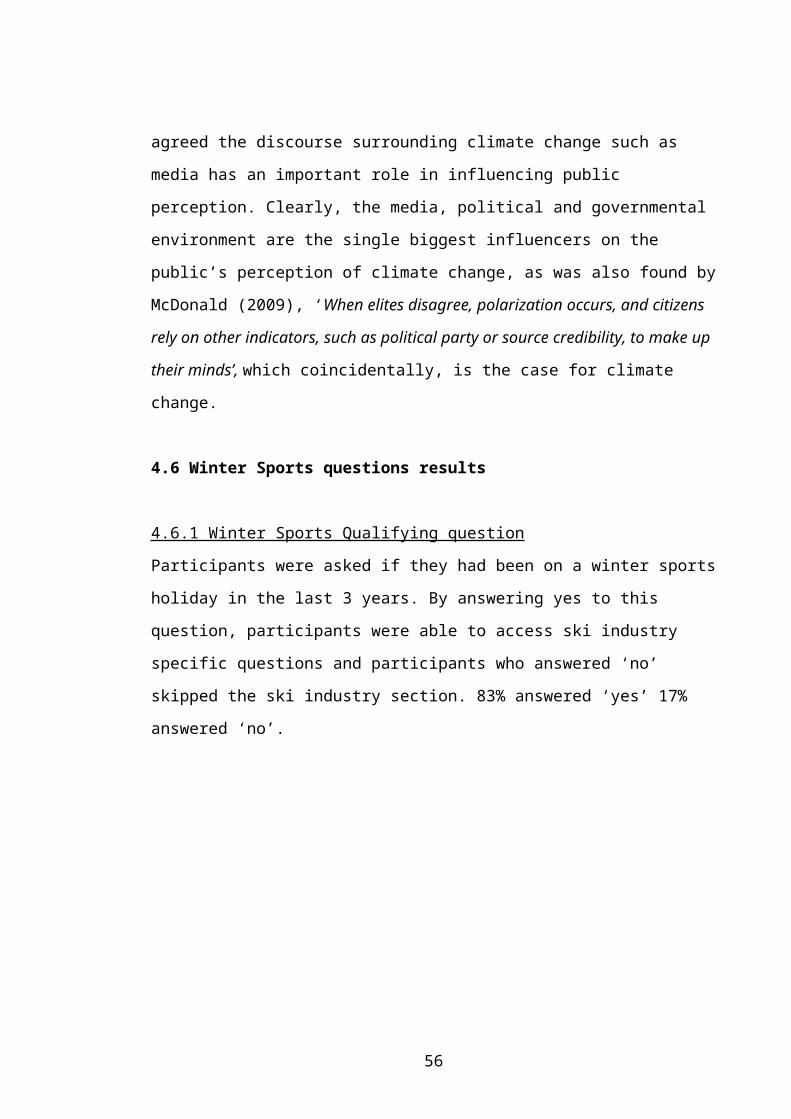
Becken, S. (2007) 'Tourists' Perception of International Air Travel's Impact on the Global Climate and Potential Climate Change Policies'. Journal of Sustainable Tourism, 15(4) pp.351-368.
Boulstridge, E. and Carrigan, M. (2000) 'Do consumers really care about corporate responsibility? Highlighting the attitude—behaviour gap'. Journal of Communication Management, 4(4) pp.355-368.
Bows, A., Anderson, K. and Upham, P. (2009) Aviation and climate change. New York: Routledge.
Bramwell, B. and Lane, B. (2000) 'Tourism Collaboration and Partnerships - Politics, Practice & Sustainability'. Aspects of Tourism 2.
Breiling, M., Charamza, P. and Skage, O. (1997) 'Klimasensibilität österreichischer Bezirkemit besonderer Berucksichtigung des Wintertourisms'. Department of Landscape Planning Alnarp, Swedish University of Agricultural Sciences.
Broderick, (2008) 'Voluntary carbon offsets - a contribution to sustainable tourism?’
Brown, J. and Fraser, M. (2006) 'Approaches and perspectives in social and environmental accounting: an overview of the conceptual landscape'. Bus. Strat. Env., 15(2) pp.103-117.
Brulle, R., Carmichael, J. and Jenkins, J. (2012) 'Shifting public opinion on climate change: an empirical assessment of factors influencing concern over climate change in the U.S., 2002–2010'. Climatic Change, 114(2) pp.169-188.
Burns, P. and Bibbings, L. (2009) 'The end of tourism? Climate change and societal challenges'. Twenty-First Century Society, 4(1) pp.31-51.
Byrd, E. (2007) 'Stakeholders in sustainable tourism development and their roles: applying stakeholder theory to sustainable tourism development'. Tourism Review, 62(2) pp.6-13.
Capstick, S., Pidgeon, N. and Whitehead, M. (2013) 'Public perceptions of climate change in Wales: Summary findings of a survey of the Welsh public conducted during November and December 2012.’ Climate Change Consortium of Wales, Cardiff.
Chapman, L. (2007) 'Transport and climate change: a review'. Journal of Transport Geography, 15(5) pp.354-367.
Davies, M. (2007) Doing a successful research project. Basingstoke [England]: Palgrave Macmillan.
Dawson, J. and Scott, D. (2013) 'Managing for climate change in the alpine ski sector'. Tourism Management, 35 pp.244-254.
Drexhage, J. and Murphy, D. (2010) Sustainable Development: From Brundtland to Rio 2012. [Online] New York. [Accessed on 17 April 2015]
56
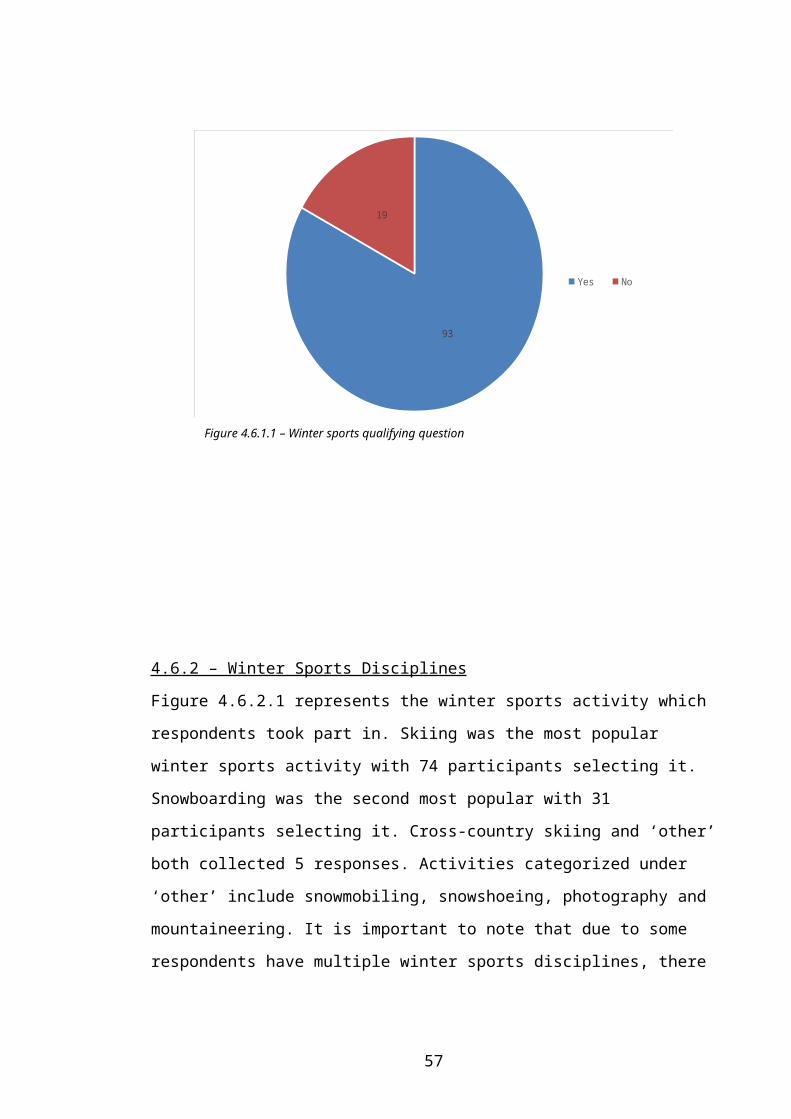
http://www.un.org/wcm/webdav/site/climatechange/shared/gsp/docs/GSP1-6_Background%20on%20Sustainable%20Devt.pdf.
Dunfee, R. (2012) The Ski Industry Lobby for Climate Change. POWDER Magazine. [Online] [Accessed on 18 April 2015] http://www.powder.com/stories/climate-change-politics/#TecZDQ51iVS5ubhL.97.
English, C. (2014) Why snow machines are cold comfort as the Alps warm. The Guardian. [Online] [Accessed on 9 April 2015] http://www.theguardian.com/science/2014/nov/07/snow-climate-change-effect-on-skiing.
Festinger, L. (1962) 'Cognitive Dissonance'. Sci Am, 207(4) pp.93-106.
Freeman, R. and McVea, J. (1984) 'A Stakeholder Approach to Strategic Management'. SSRN Journal, p.46.
Goodwin, H. and Francis, J. (2003) 'Ethical and responsible tourism: Consumer trends in the UK'. Journal of Vacation Marketing, 9(3) pp.271-284.
Gosden, E. (2015) 'Britons believe in climate change... but do they care?’ [Online] The Telegraph. [Accessed on 17 April 2015] http://www.telegraph.co.uk/news/earth/environment/climatechange/11375124/Britons-believe-in-climate-change...-but-do-they-care.html.
Gössling, S. (2002) 'Global environmental consequences of tourism'. Global Environmental Change, 12(4) pp.283-302.
Gössling, S., Broderick, J., Upham, P., Ceron, J., Dubois, G., Peeters, P. and Strasdas, W. (2007) 'Voluntary Carbon Offsetting Schemes for Aviation: Efficiency, Credibility and Sustainable Tourism'. Journal of Sustainable Tourism, 15(3) pp.223-248.
Gössling, S., Haglund, L., Kallgren, H., Revahl, M. and Hultman, J. (2009) 'Swedish air travellers and voluntary carbon offsets: towards the co-creation of environmental value?’ Current Issues in Tourism, 12(1) pp.1-19.
Gössling, S., Hall, C. and Weaver, D. (2008) Sustainable Tourism Futures. Hoboken: Taylor & Francis.
Henry, A. (2000) 'Public Perceptions of Global Warming'. Research in Human Ecology.
Higham, J., Cohen, S., Cavaliere, C., Reis, A. and Finkler, W. (2014) 'Climate change, tourist air travel and radical emissions reduction'. Journal of Cleaner Production.
Hopkins, D. (2013) 'The sustainability of climate change adaptation strategies in New Zealand's ski industry: a range of stakeholder perceptions'. Journal of Sustainable Tourism, 22(1) pp.107-126.
Hsieh, H. and Kung, S. (2013) 'The Linkage Analysis of Environmental Impact of Tourism Industry'. Procedia Environmental Sciences, 17 pp.658-665.
57
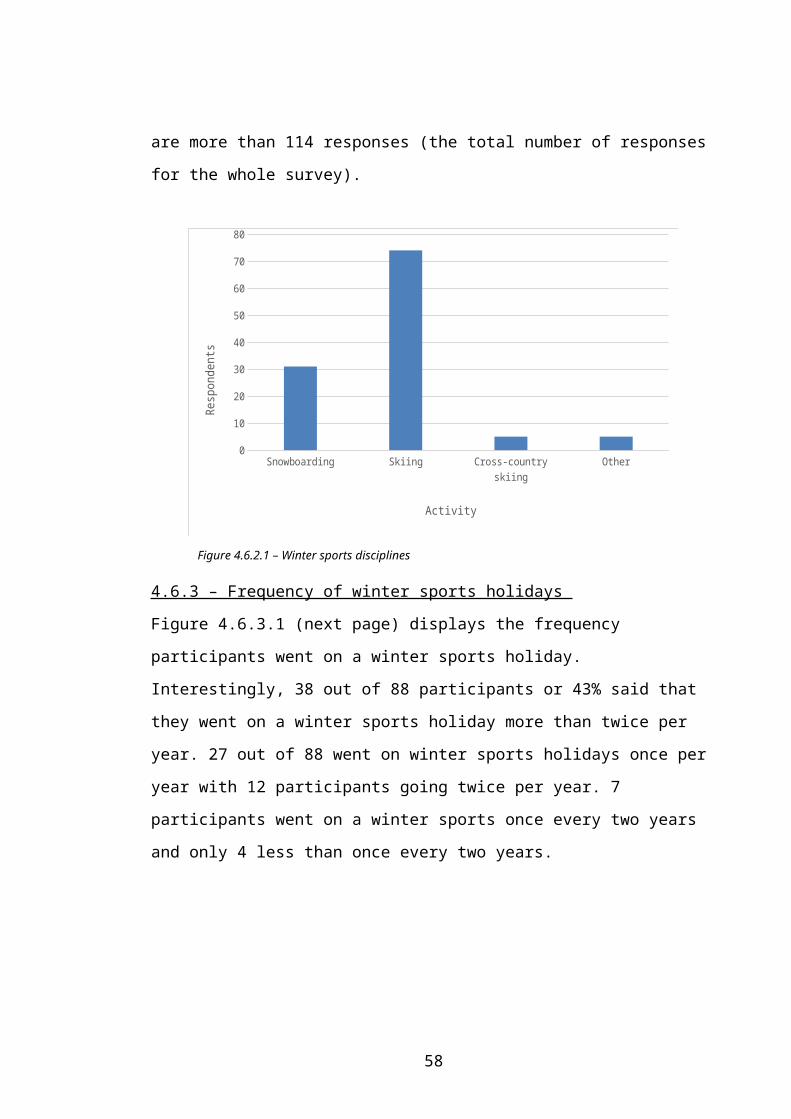
IPCC, (2014) Climate Change 2014. Impacts, Adaptation & Vulnerability. [Online] Intergovernmental Panel on Climate Change. [Accessed on 17 April 2015] https://ipcc-wg2.gov/AR5/images/uploads/WG2AR5_SPM_FINAL.pdf.
IPCC, (2014) Detection and attribution of observed impacts. Climate Change 2014: Impacts, Adaptation, and Vulnerability. Part A: Global and Sectoral Aspects. Contribution of Working Group II to the Fifth Assessment Report of the Intergovernmental Panel on Climate Change. [Online] Cambridge: Cambridge University Press, pp.979-1037. [Accessed on 19 April 2015] http://www.ipcc.ch/pdf/assessment-report/ar5/wg2/WGIIAR5-Chap18_FINAL.pdf.
Jamal, T. and Getz, D. (1995) 'Collaboration theory and community tourism planning'. Annals of Tourism Research, 22(1) pp.186-204.
Juvan, E. and Dolnicar, S. (2013) 'Can tourists easily choose a low carbon footprint vacation?’ Journal of Sustainable Tourism, 22(2) pp.175-194.
Juvan, E. and Dolnicar, S. (2014) 'The attitude–behaviour gap in sustainable tourism'. Annals of Tourism Research, 48 pp.76-95.
Kagawa, F. (2007) 'Dissonance in students' perceptions of sustainable development and sustainability'. Int J of Sus in Higher Ed, 8(3) pp.317-338.
Kempton, W. (1991) 'Public understanding of global warming'. Society & Natural Resources, 4(4) pp.331-345.
König, U. (1998) Tourism in a warmer world.
Leiserowitz, A., Maibach, E., Roser-Renouf, C. and Smith, N. (2010) CClimate Change in the American Mind: Americans' Global Warming Beliefs and Attitudes in June 2010. Yale University and George Mason University. New Haven, CT: Yale Project on Climate Change Communication. [Online] [Accessed on 17 April 2015] http://www.climatechangecommunication.org/images/files/ClimateBeliefsJune2010(1).pdf.
Liu, Z. (2003) 'Sustainable Tourism Development: A Critique'. Journal of Sustainable Tourism, 11(6) pp.459-475.
Lorenzoni, I. and Pidgeon, N. (2006) 'Public Views on Climate Change: European and USA Perspectives'. Climatic Change, 77(1-2) pp.73-95.
McDonald, S. (2009) 'Changing climate, changing minds; applying the literature on media effects, public'. Int J Sustain Commun, 4 pp.45-63.
Moen, J. and Fredman, P. (2007) 'Effects of Climate Change on Alpine Skiing in Sweden'. Journal of Sustainable Tourism, 15(4) pp.418-437.
Nilsen, H. and Ellingsen, M. (2015) 'The power of environmental indifference. A critical discourse analysis of a collaboration of tourism firms'. Ecological Economics, 109 pp.26-33.
58
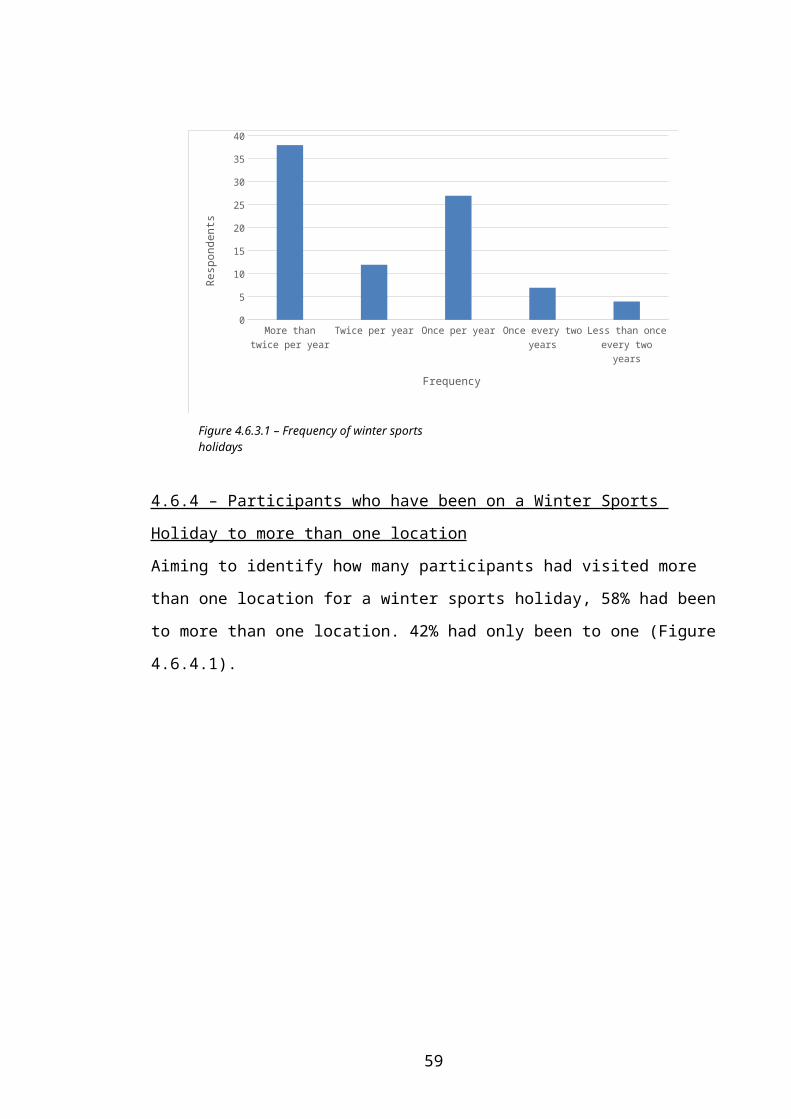
Nisbet, M. and Myers, T. (2007) 'The Polls Trends: Twenty Years of Public Opinion about Global Warming'. Public Opinion Quarterly, 71(3) pp.444-470.
Peeters, P. (2007) 'THE IMPACT OF TOURISM ON CLIMATE CHANGE'.
Peeters, P. and Eijgelaar, E. (2014) 'Tourism's climate mitigation dilemma: Flying between rich and poor countries'. Tourism Management, 40 pp.15-26.
Penner, J., Lister, D., Griggs, D., Dokken, D. and McFarland, M. (1999) Aviation and the Global Atmosphere. Summary for Policymakers. [Online] IPCC. [Accessed on 17 April 2015] https://www.ipcc.ch/pdf/special-reports/spm/av-en.pdf.
Sautter, E. and Leisen, B. (1999) 'Managing stakeholders a Tourism Planning Model'. Annals of Tourism Research, 26(2) pp.312-328.
Scott, D. and McBoyle, G. (2006) 'Climate change adaptation in the ski industry'. Mitigation and Adaptation Strategies for Global Change, 12(8) pp.1411-1431.
Scott, D., McBoyle, G. and Mills, B. (2003) 'Climate change and the skiing industry in southern Ontario (Canada): exploring the importance of snowmaking as a technical adaptation'. Clim. Res., 23 pp.171-181.
Sharpley, R. (2014) 'Host perceptions of tourism: A review of the research'. Tourism Management, 42 pp.37-49.
Stoll-Kleemann, S., O’Riordan, T. and Jaeger, C. (2001) 'The psychology of denial concerning climate mitigation measures: evidence from Swiss focus groups'. Global Environmental Change, 11(2) pp.107-117.
Summers, M., Corney, G. and Childs, A. (2004) 'Student teachers’ conceptions of sustainable development: the starting-points of geographers and scientists'. Educational Research, 46(2) pp.163-182.
Trawöger, L. (2014) 'Convinced, ambivalent or annoyed: Tyrolean ski tourism stakeholders and their perceptions of climate change'. Tourism Management, 40 pp.338-351.
UNFCC, (2015) Kyoto Protocol. [Online] [Accessed on 22 March 2015] http://unfccc.int/kyoto_protocol/items/2830.php.
Upham, P., Thomas, C., Gillingwater, D. and Raper, D. (2003) 'Environmental capacity and airport operations: current issues and future prospects'. Journal of Air Transport Management, 9(3) pp.145-151.
Van Teijlingen, E. and Hundley, V. (2002) 'The importance of pilot studies'. Nursing Standard, 16(40) pp.33-36.
Viner, D. and Agnew, M. (1999) Climate Change and Its Impacts on Tourism. [Online] Climatic Research Unit, University of East Anglia. [Accessed on 17 April 2015] http://www.wwf.org.uk/filelibrary/pdf/tourism_and_cc_full.pdf.
59
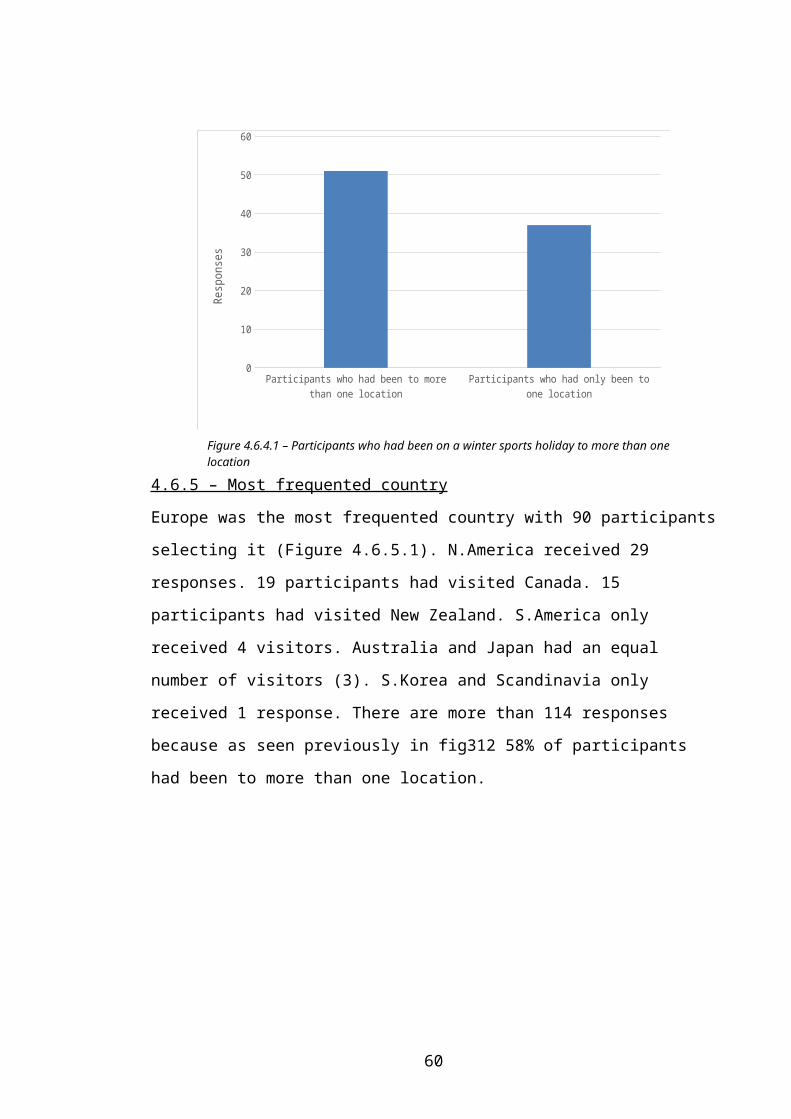
Wade, V. (2006) Likert-Type Scale Response Anchors. Clemson International Institute for Tourism & Research Development, Department of Parks, Recreation and Tourism Management: Clemson University.
Wearing, S., Cynn, S., Ponting, J. and McDonald, M. (2002) 'Converting Environmental Concern into Ecotourism Purchases: A Qualitative Evaluation of International Backpackers in Australia'. Journal of Ecotourism, 1(2-3) pp.133-148.
Whitelegg, J. and Williams, N. (2000) The Plane Truth: Aviation and the Environment. London: Transport 2000 & The Ashden Trust.
Whitmarsh, L., O’Neill, S. and Lorenzoni, I. (2011) 'Climate change or social change? Debate within, amongst, and beyond disciplines'. Environ. Plann. A, 43(2) pp.258-261.
World Tourism Organisation, (2003) Climate Change and Tourism. Proceedings of the 1st International Conference on Climate Change and Tourism Djerba, Tunisia.
WTO & UNEP, (2008) Climate Change and Tourism. Responding to Global Challenges. [Online] Madrid: World Tourism Association & United Nations Environment Programme, pp.67-69. [Accessed on 22 March 2015] https://books.google.co.uk/books?id=C_4gBTp-ioYC&pg=PA68&lpg=PA68&dq=value+of+global+ski+industry&source=bl&ots=XwRZ_ktT3w&sig=6LdXQorZaAZ7O60npLXLGDwrCDo&hl=en&sa=X&ei=7rMOVYOSC4PhaJzKgYAC&ved=0CCEQ6AEwAA#v=onepage&q=value%20of%20global%20ski%20industry&f=false.
7. ACKNOWLEDGEMENTS
First and foremost, I would like to thank my project supervisor Dr. Rachel Dunk.
Without her assistance, patience and dedicated involvement, this research project
would have more than likely never reached satisfactory completion.
I would also like to thank the statistics drop in lecturers on a Wednesday afternoon in
C1.01.
60
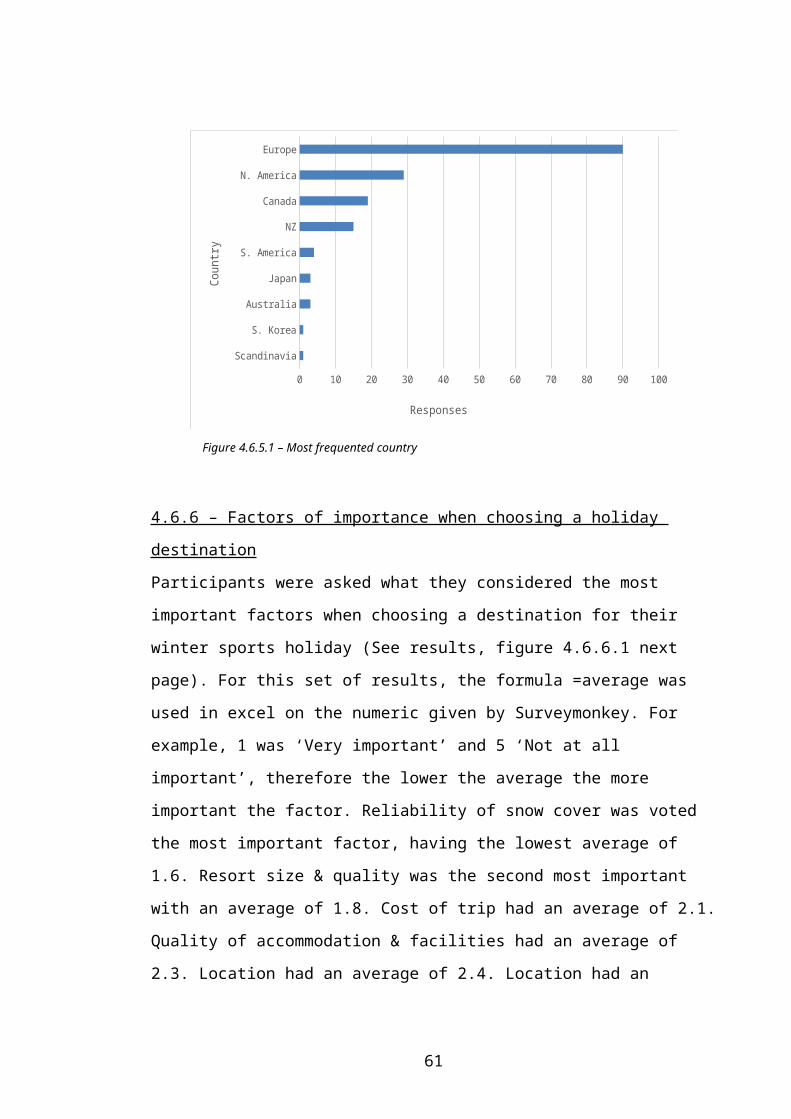
8. APPENDICES
Appendix A: Correlation between ‘Do you consider sustainability to be important to you?’ and Age.
Do you consider
sustainability to be
important to you?
Age
Spearman's
rho
Do you consider
sustainability to be
important to you?
Correlation Coefficient 1.000 .016
Sig. (2-tailed) . .872
N 107 107
Age
Correlation Coefficient .016 1.000
Sig. (2-tailed) .872 .
N 107 107
Appendix B: Correlation between ‘Is sustainability important to you whilst on holiday?’ and Education
Is sustainability
important to you
whilst on holiday?
Education
Spearman's
rho
Is sustainability
important to you
whilst on holiday?
Correlation Coefficient 1.000 -.167
Sig. (2-tailed) . .086
N 107 107
Education
Correlation Coefficient -.167 1.000
Sig. (2-tailed) .086 .
N 107 107
Appendix C: Correlation between ‘Would you be willing to pay a voluntary offset fee?’ and Age.
Would you be willing
to pay a voluntary
offset fee?
Age
Spearman's
rho
Would you willing
to pay a voluntary
offset fee?
Correlation Coefficient 1.000 .126
Sig. (2-tailed) . .195
N 107 107
Age
Correlation Coefficient .126 1.000
Sig. (2-tailed) .195 .
N 107 107
61
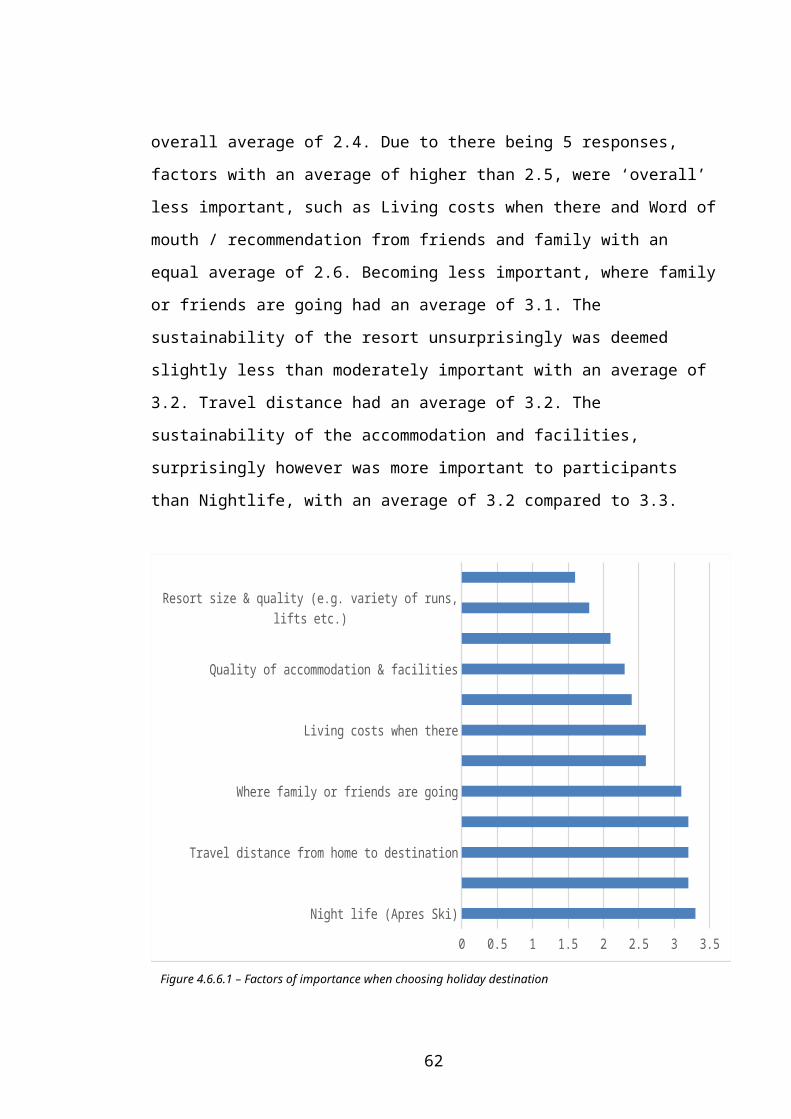
62


![Attitudes and Perceptions of Local Residents and Tourists ... · International Journal of Humanities and Social Science Vol. 3 No. 4 [Special Issue – February 2013] 18 Attitudes](https://img.dokumen.tips/doc/110x75/60103ac9a804a350295442c4/attitudes-and-perceptions-of-local-residents-and-tourists-international-journal.jpg)