Embed Size (px)
Citation preview
Wind Direction Estimates from Synthetic Aperture Radar Imagery of the Sea Surface
Todd D. Sikora
Millersville University P.O. Box 1002
Millersville, PA 17551-0302 phone: (717) 872-3289 fax: (717) 871-4725 email: [email protected]
Grant Number: N0001405WR20319
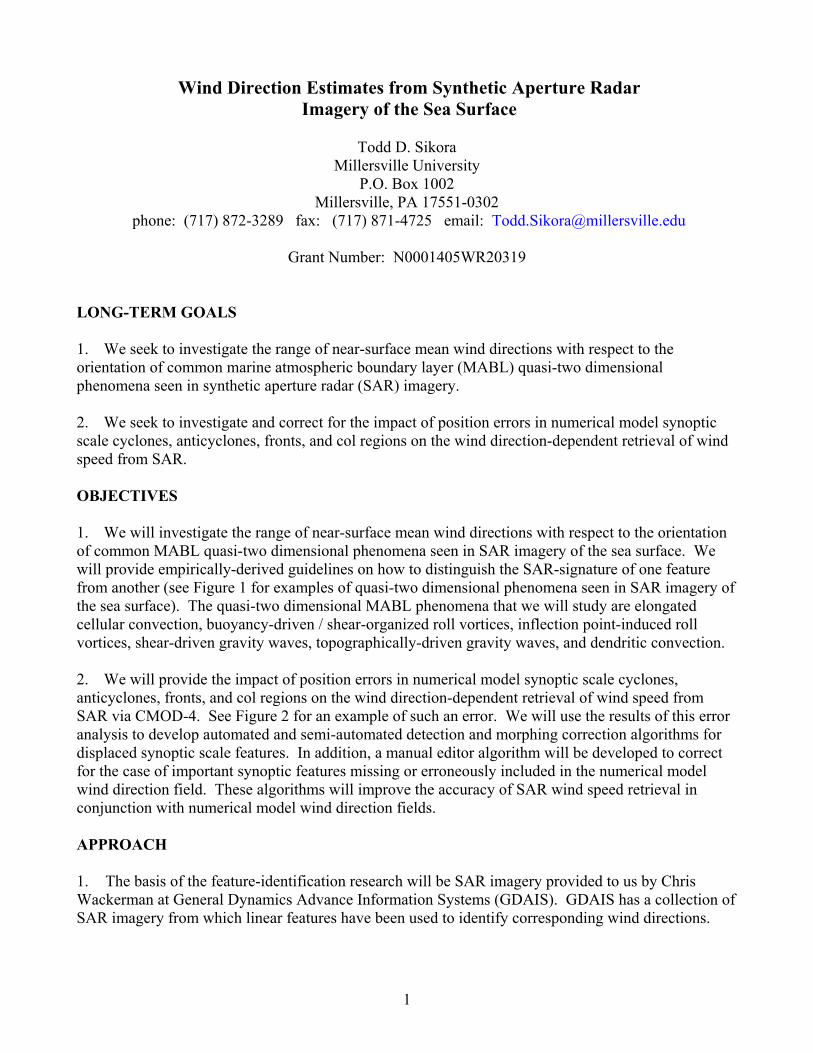
LONG-TERM GOALS 1. We seek to investigate the range of near-surface mean wind directions with respect to the orientation of common marine atmospheric boundary layer (MABL) quasi-two dimensional phenomena seen in synthetic aperture radar (SAR) imagery. 2. We seek to investigate and correct for the impact of position errors in numerical model synoptic scale cyclones, anticyclones, fronts, and col regions on the wind direction-dependent retrieval of wind speed from SAR. OBJECTIVES 1. We will investigate the range of near-surface mean wind directions with respect to the orientation of common MABL quasi-two dimensional phenomena seen in SAR imagery of the sea surface. We will provide empirically-derived guidelines on how to distinguish the SAR-signature of one feature from another (see Figure 1 for examples of quasi-two dimensional phenomena seen in SAR imagery of the sea surface). The quasi-two dimensional MABL phenomena that we will study are elongated cellular convection, buoyancy-driven / shear-organized roll vortices, inflection point-induced roll vortices, shear-driven gravity waves, topographically-driven gravity waves, and dendritic convection. 2. We will provide the impact of position errors in numerical model synoptic scale cyclones, anticyclones, fronts, and col regions on the wind direction-dependent retrieval of wind speed from SAR via CMOD-4. See Figure 2 for an example of such an error. We will use the results of this error analysis to develop automated and semi-automated detection and morphing correction algorithms for displaced synoptic scale features. In addition, a manual editor algorithm will be developed to correct for the case of important synoptic features missing or erroneously included in the numerical model wind direction field. These algorithms will improve the accuracy of SAR wind speed retrieval in conjunction with numerical model wind direction fields. APPROACH 1. The basis of the feature-identification research will be SAR imagery provided to us by Chris Wackerman at General Dynamics Advance Information Systems (GDAIS). GDAIS has a collection of SAR imagery from which linear features have been used to identify corresponding wind directions.
1
Report Documentation Page Form ApprovedOMB No. 0704-0188
Public reporting burden for the collection of information is estimated to average 1 hour per response, including the time for reviewing instructions, searching existing data sources, gathering andmaintaining the data needed, and completing and reviewing the collection of information. Send comments regarding this burden estimate or any other aspect of this collection of information,including suggestions for reducing this burden, to Washington Headquarters Services, Directorate for Information Operations and Reports, 1215 Jefferson Davis Highway, Suite 1204, ArlingtonVA 22202-4302. Respondents should be aware that notwithstanding any other provision of law, no person shall be subject to a penalty for failing to comply with a collection of information if itdoes not display a currently valid OMB control number.
1. REPORT DATE 30 SEP 2005 2. REPORT TYPE
3. DATES COVERED 00-00-2005 to 00-00-2005
4. TITLE AND SUBTITLE Wind Direction Estimates from Synthetic Aperture Radar Imagery of theSea Surface
5a. CONTRACT NUMBER
5b. GRANT NUMBER
5c. PROGRAM ELEMENT NUMBER
6. AUTHOR(S) 5d. PROJECT NUMBER
5e. TASK NUMBER
5f. WORK UNIT NUMBER
7. PERFORMING ORGANIZATION NAME(S) AND ADDRESS(ES) Millersville University,P.O. Box 1002,Millersville,PA,17551
8. PERFORMING ORGANIZATIONREPORT NUMBER
9. SPONSORING/MONITORING AGENCY NAME(S) AND ADDRESS(ES) 10. SPONSOR/MONITOR’S ACRONYM(S)
11. SPONSOR/MONITOR’S REPORT NUMBER(S)
12. DISTRIBUTION/AVAILABILITY STATEMENT Approved for public release; distribution unlimited
13. SUPPLEMENTARY NOTES code 1 only
14. ABSTRACT
15. SUBJECT TERMS
16. SECURITY CLASSIFICATION OF: 17. LIMITATION OF ABSTRACT Same as
Report (SAR)
18. NUMBEROF PAGES
7
19a. NAME OFRESPONSIBLE PERSON
a. REPORT unclassified
b. ABSTRACT unclassified
c. THIS PAGE unclassified
Standard Form 298 (Rev. 8-98) Prescribed by ANSI Std Z39-18
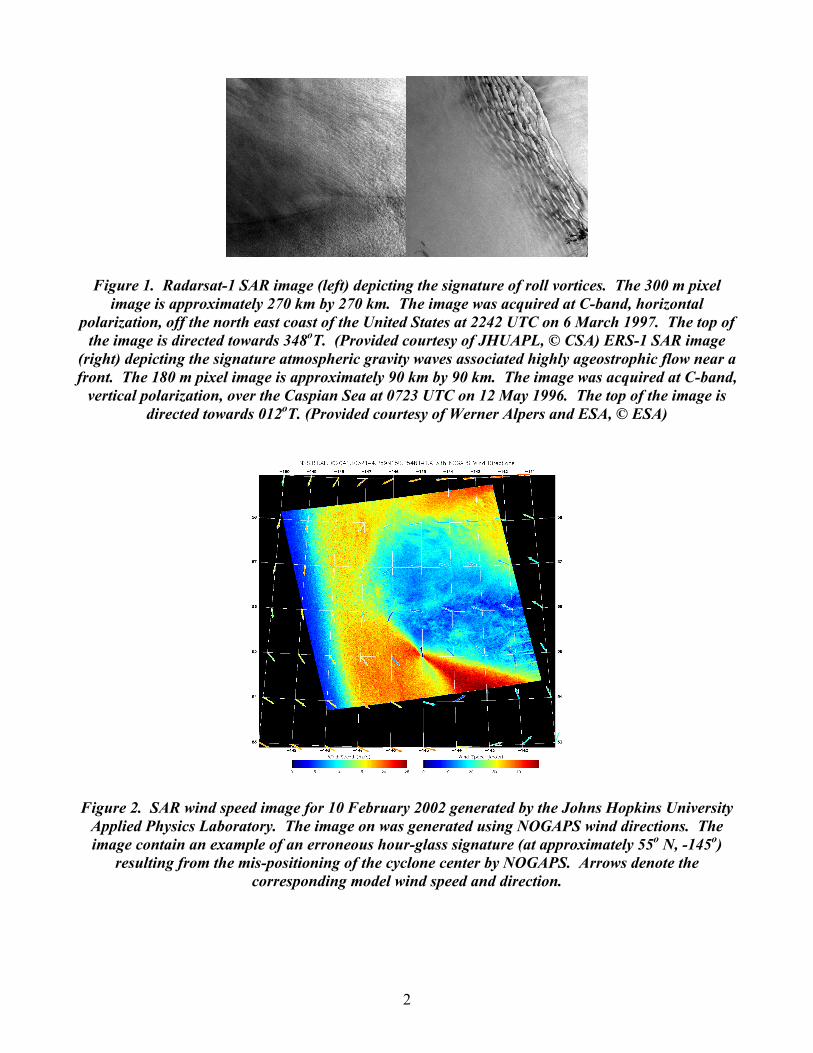
Figure 1. Radarsat-1 SAR image (left) depicting the signature of roll vortices. The 300 m pixel image is approximately 270 km by 270 km. The image was acquired at C-band, horizontal
polarization, off the north east coast of the United States at 2242 UTC on 6 March 1997. The top of the image is directed towards 348oT. (Provided courtesy of JHUAPL, © CSA) ERS-1 SAR image
(right) depicting the signature atmospheric gravity waves associated highly ageostrophic flow near a front. The 180 m pixel image is approximately 90 km by 90 km. The image was acquired at C-band,
vertical polarization, over the Caspian Sea at 0723 UTC on 12 May 1996. The top of the image is directed towards 012oT. (Provided courtesy of Werner Alpers and ESA, © ESA)
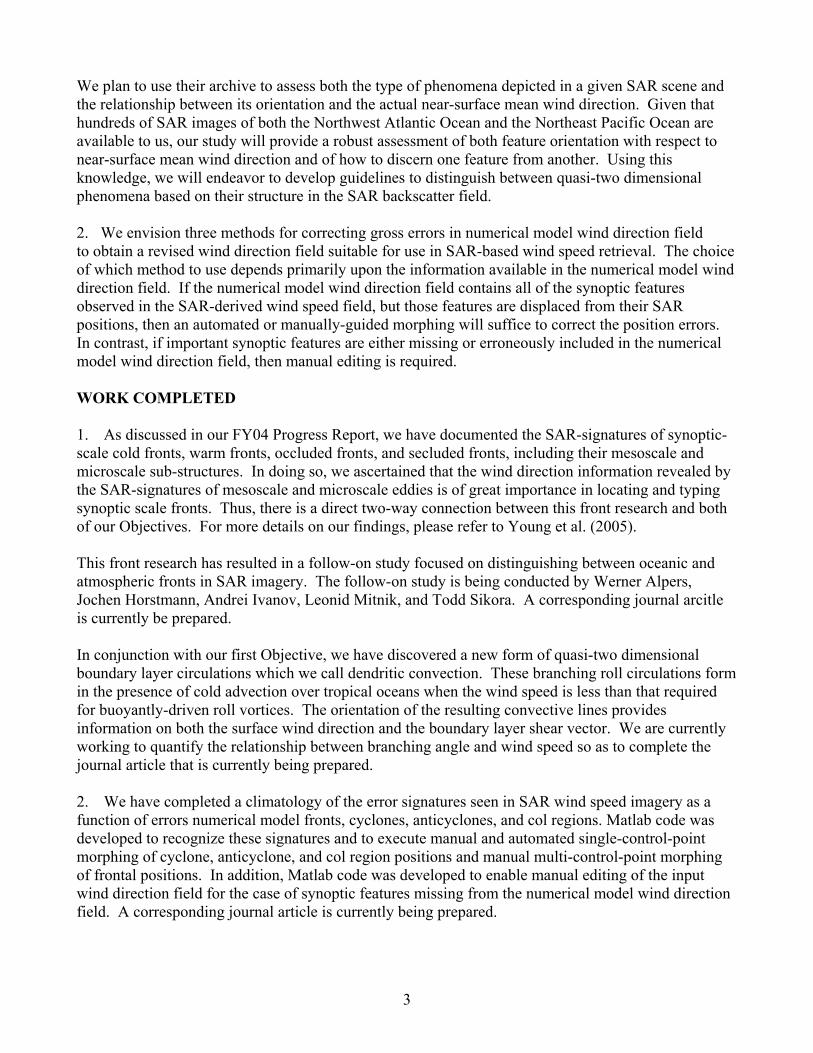
Figure 2. SAR wind speed image for 10 February 2002 generated by the Johns Hopkins University
Applied Physics Laboratory. The image on was generated using NOGAPS wind directions. The image contain an example of an erroneous hour-glass signature (at approximately 55o N, -145o)
resulting from the mis-positioning of the cyclone center by NOGAPS. Arrows denote the corresponding model wind speed and direction.
2
We plan to use their archive to assess both the type of phenomena depicted in a given SAR scene and the relationship between its orientation and the actual near-surface mean wind direction. Given that hundreds of SAR images of both the Northwest Atlantic Ocean and the Northeast Pacific Ocean are available to us, our study will provide a robust assessment of both feature orientation with respect to near-surface mean wind direction and of how to discern one feature from another. Using this knowledge, we will endeavor to develop guidelines to distinguish between quasi-two dimensional phenomena based on their structure in the SAR backscatter field. 2. We envision three methods for correcting gross errors in numerical model wind direction field to obtain a revised wind direction field suitable for use in SAR-based wind speed retrieval. The choice of which method to use depends primarily upon the information available in the numerical model wind direction field. If the numerical model wind direction field contains all of the synoptic features observed in the SAR-derived wind speed field, but those features are displaced from their SAR positions, then an automated or manually-guided morphing will suffice to correct the position errors. In contrast, if important synoptic features are either missing or erroneously included in the numerical model wind direction field, then manual editing is required. WORK COMPLETED 1. As discussed in our FY04 Progress Report, we have documented the SAR-signatures of synoptic-scale cold fronts, warm fronts, occluded fronts, and secluded fronts, including their mesoscale and microscale sub-structures. In doing so, we ascertained that the wind direction information revealed by the SAR-signatures of mesoscale and microscale eddies is of great importance in locating and typing synoptic scale fronts. Thus, there is a direct two-way connection between this front research and both of our Objectives. For more details on our findings, please refer to Young et al. (2005). This front research has resulted in a follow-on study focused on distinguishing between oceanic and atmospheric fronts in SAR imagery. The follow-on study is being conducted by Werner Alpers, Jochen Horstmann, Andrei Ivanov, Leonid Mitnik, and Todd Sikora. A corresponding journal arcitle is currently be prepared. In conjunction with our first Objective, we have discovered a new form of quasi-two dimensional boundary layer circulations which we call dendritic convection. These branching roll circulations form in the presence of cold advection over tropical oceans when the wind speed is less than that required for buoyantly-driven roll vortices. The orientation of the resulting convective lines provides information on both the surface wind direction and the boundary layer shear vector. We are currently working to quantify the relationship between branching angle and wind speed so as to complete the journal article that is currently being prepared. 2. We have completed a climatology of the error signatures seen in SAR wind speed imagery as a function of errors numerical model fronts, cyclones, anticyclones, and col regions. Matlab code was developed to recognize these signatures and to execute manual and automated single-control-point morphing of cyclone, anticyclone, and col region positions and manual multi-control-point morphing of frontal positions. In addition, Matlab code was developed to enable manual editing of the input wind direction field for the case of synoptic features missing from the numerical model wind direction field. A corresponding journal article is currently being prepared.
3
This research has resulted in a follow-on study focused on the generation of a SAR-derived wind speed risk assessment product. Our product allows one to assess the lower and upper bounds on SAR-based wind speed, and thus the wind-related risk to maritime operations. The risk product consists of a pair of wind speed images bounding the wind speed range consistent with the observed SAR data. We envision the risk product to be most useful in coastal regions where the large concentration of maritime operations requires accurate, high-resolution wind speed data and when uncertainty in the a priori knowledge of the wind direction precludes the generation of accurate SAR-based wind speed fields. For more details on this product, please refer to Sikora et al. (in press). RESULTS 1. We have documented the SAR-signatures of synoptic-scale cold fronts, warm fronts, occluded fronts, and secluded fronts, including their wind direction-related mesoscale and microscale sub-structures. An example of our frontal identification findings can be seen in Figure 3. This research has been formalized in Young et al. (2005) and addresses both of our Objectives. A related paper on distinguishing between oceanic and atmospheric fronts is being prepared by Todd Sikora several co-authors. However, much work remains to be completed in connection to our first Objective. The primary obstacle we have faced is securing a large quantity of high-resolution SAR data from which the signatures of linear MABL phenomena can be discerned. We hope GDAIS SAR collection will fill our need. We have developed a space/time climatology of dendritic convection and a conceptual model explaining its structure and orientation in terms on a non-linear interaction between buoyantly driven quasi-two dimensional rolls. This conceptual model allows us to determine the surface wind speed and boundary layer shear from the orientation of the quasi-two dimensional structures. Thus, this research relates closely to our first Objective. We plan to complete this work by statistically relating the surface wind speed to branching angle. Our research is being formalized by a journal article currently in preparation. 2. We have developed manual and automated morphing Matlab algorithms as well as a manual wind direction Matlab editor algorithm in fulfillment of our second objective. We have used our Matlab products to demonstrate that substantial improvements in the SAR-derived wind speed field can be obtained by correctly editing or morphing the numerical model wind direction fields before application of CMOD-4. Our research is being formalized in a journal article currently in preparation. A related follow-on study focusing on the generation of a SAR-derived wind speed risk assessment product has been completed and is formalized in Sikora et al. (in press). IMPACT/APPLICATIONS The research described herein fulfills ONR objectives by working towards the integration of standard meteorological theory and synthetic aperture radar data with the goal of providing high-resolution remotely sensed estimates of near-surface wind field in in situ data-sparse regions over the ocean, including the coastal zone. For example, the frontal identification and risk assessment work we’ve completed thus far will help train forecasters to use SAR to its full potential in marine synoptic scale frontal analysis. The morphing software we’ve developed will allow users to obtain accurate SAR-derived wind speeds even when numerical model analyses used for the wind direction field have position errors for key synoptic features.
4
RELATED PROJECTS George Young has an NSF-funded SAR project that supports the development of analysis tools essential to our ONR-funded research. The Matlab CMOD-4 code was developed jointly with NSF-co-PI Nathaniel Winstead. An interactive SAR wind field analysis program with a graphical user interface was developed by George Young as part of this project and will serve as the host application for the automated and interactive wind-direction field morphing routines developed under ONR funding. Todd Sikora is collaborating with Werner Alpers, Jochen Horstmann, Andrei Ivanov, and Leonid Mitnik, on a study focused on distinguishing between oceanic and atmospheric fronts in SAR imagery.
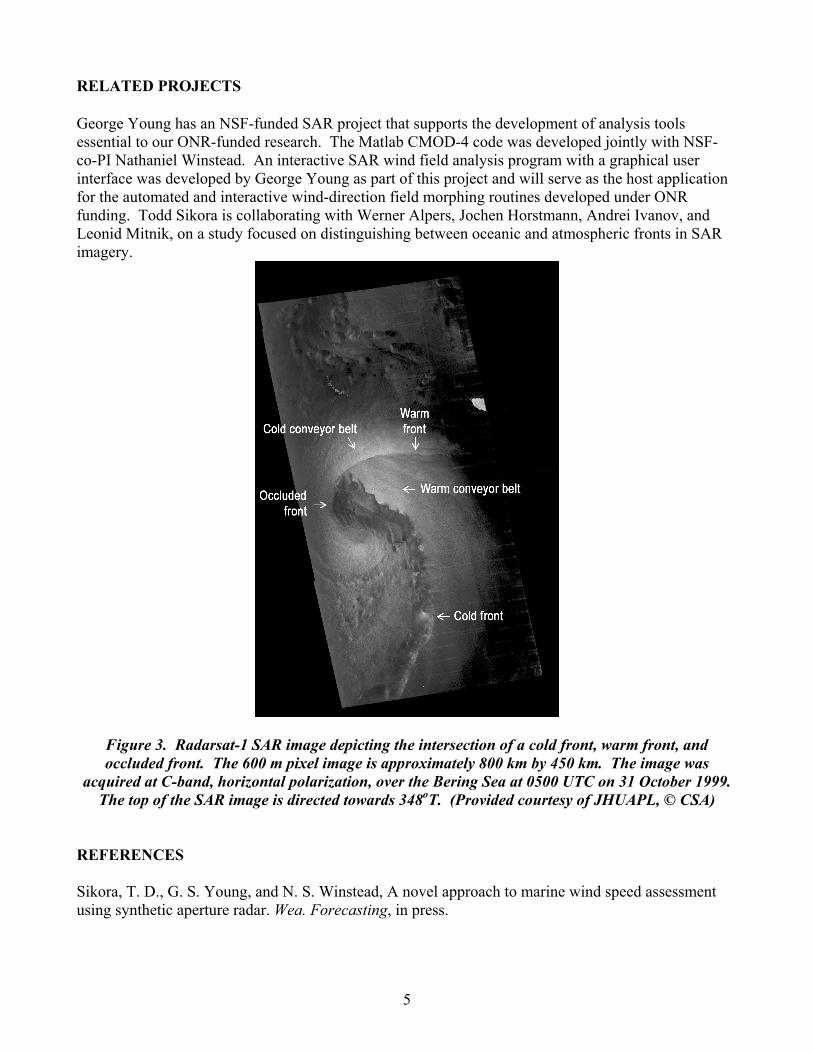
Figure 3. Radarsat-1 SAR image depicting the intersection of a cold front, warm front, and occluded front. The 600 m pixel image is approximately 800 km by 450 km. The image was
acquired at C-band, horizontal polarization, over the Bering Sea at 0500 UTC on 31 October 1999. The top of the SAR image is directed towards 348oT. (Provided courtesy of JHUAPL, © CSA)
REFERENCES Sikora, T. D., G. S. Young, and N. S. Winstead, A novel approach to marine wind speed assessment using synthetic aperture radar. Wea. Forecasting, in press.
5
Young, G. S., T. D. Sikora, and N. S. Winstead, 2005: Use of synthetic aperture radar in fine-scale surface analysis of synoptic-scale fronts at sea. Wea. Forecasting, 20, 311-327. PUBLICATIONS Foster, R., T. D. Sikora, and G. S. Young, 2004: The correction of surface layer wind speeds for atmospheric stratification and height. Proc. Second Workshop on Coastal and Marine Applications of SAR, Svalbard, Norway, 2003 September, European Space Agency SP-565, 39-47. Mondaldo, F. M., and others including T. D. Sikora, 2004: The SAR measurement of ocean surface winds: an overview. Proc. Second Workshop on Coastal and Marine Applications of SAR, Svalbard, Norway, 2003 September, European Space Agency SP-565, 15-32. Sikora, T. D., G. S. Young, R. C. Beal, F. M. Monaldo, and P. W. Vachon, Applications of synthetic aperture radar in marine meteorology. Advances in Fluid Mechanics: Atmosphere Ocean Interactions-Volume 2, W. Perrie, Ed., Wessex Institute of Technology, in press. Sikora, T. D., G. S. Young, and N. S. Winstead, A novel approach to marine wind speed assessment using synthetic aperture radar. Wea. Forecasting, in press. Young, G. S., T. D. Sikora, and N. S. Winstead, 2005: Use of synthetic aperture radar in fine-scale surface analysis of synoptic-scale fronts at sea. Wea. Forecasting, 20, 311-327.
6