Embed Size (px)
Citation preview
This article was downloaded by: [Northeastern University]On: 04 October 2014, At: 01:04Publisher: Taylor & FrancisInforma Ltd Registered in England and Wales Registered Number: 1072954 Registered office: Mortimer House,37-41 Mortimer Street, London W1T 3JH, UK
Behaviour & Information TechnologyPublication details, including instructions for authors and subscription information:http://www.tandfonline.com/loi/tbit20
Why don't consumers go internet shopping in Korea?Segmentation of consumer lifestyle approachSeung-Bae Park a , Yong-Ki Lee b & Namho Chung ca Department of Industrial System Management , Seoil College , Seoul , Republic of Koreab Department of Business Administration , Sejong University , Seoul , Republic of Koreac College of Hotel & Tourism Management , Kyung Hee University , 1 Hoegi-dong,Dogdaemun-gu, Seoul , 130-170 , Republic of KoreaAccepted author version posted online: 03 May 2012.Published online: 22 Jun 2012.
To cite this article: Seung-Bae Park , Yong-Ki Lee & Namho Chung (2013) Why don't consumers go internet shoppingin Korea? Segmentation of consumer lifestyle approach, Behaviour & Information Technology, 32:5, 468-479, DOI:10.1080/0144929X.2012.687771
To link to this article: http://dx.doi.org/10.1080/0144929X.2012.687771
PLEASE SCROLL DOWN FOR ARTICLE
Taylor & Francis makes every effort to ensure the accuracy of all the information (the “Content”) containedin the publications on our platform. However, Taylor & Francis, our agents, and our licensors make norepresentations or warranties whatsoever as to the accuracy, completeness, or suitability for any purpose of theContent. Any opinions and views expressed in this publication are the opinions and views of the authors, andare not the views of or endorsed by Taylor & Francis. The accuracy of the Content should not be relied upon andshould be independently verified with primary sources of information. Taylor and Francis shall not be liable forany losses, actions, claims, proceedings, demands, costs, expenses, damages, and other liabilities whatsoeveror howsoever caused arising directly or indirectly in connection with, in relation to or arising out of the use ofthe Content.
This article may be used for research, teaching, and private study purposes. Any substantial or systematicreproduction, redistribution, reselling, loan, sub-licensing, systematic supply, or distribution in anyform to anyone is expressly forbidden. Terms & Conditions of access and use can be found at http://www.tandfonline.com/page/terms-and-conditions
Why don’t consumers go internet shopping in Korea? Segmentation of consumer lifestyle approach
Seung-Bae Parka, Yong-Ki Leeb and Namho Chungc*
aDepartment of Industrial System Management, Seoil College, Seoul, Republic of Korea; bDepartment of Business Administration,Sejong University, Seoul, Republic of Korea; cCollege of Hotel & Tourism Management, Kyung Hee University, 1 Hoegi-dong,
Dogdaemun-gu, Seoul 130-170, Republic of Korea
(Received 1 July 2010; final version received 4 April 2012)
Due to the rapid increase of internet users, internet shopping malls in Korea are growing at a very rapid rate, thougha structural vulnerability is also being revealed. About 55.8% of internet users in Korea use internet shopping malls.Therefore, to enlarge the sizes of internet shopping markets, it is paramount to attract shoppers who do notcurrently shop on the internet. In this regard, this study analysed the characteristics of internet shoppers and non-internet shoppers from diverse aspects based on surveys conducted on 4298 subjects residing across Korea, using 28consumer lifestyle measurement items. The results of the analysis indicated that non-internet shoppers are married,earning relatively high incomes, and have little experience in accessing the internet. A Chi-square AutomaticInteraction Detection (CHAID) analysis was conducted, and the result indicated that internet shoppers pursued theproduct/service information from internet shopping, but non-internet shoppers did not want to use credit cardsduring internet shopping. Based on the above mentioned study results, it was attempted to present detail strategiesfor internet shopping mall businesses to attract non-internet shoppers to internet shopping markets.
Keywords: internet shopper; consumer lifestyle; customer value; chi-square automatic interaction detection(CHAID); segmentation
1. Introduction
The internet shopping market has grown explosivelysince the 1990s. In the United States, as of 2008, theamount consumed via the internet was US$208 billion,which is equivalent to 7% of the total retail sales (Yeet al. 2011). In Korea, the number of internet usersincreased from 19 million in 2000 to 37 million in 2010,and 74% of the total population use the internet(Korea internet & Security Agency 2011). In particu-lar, 55.8% of these internet users use internet shopping(among internet users who are 12 years old or older,those who have bought any goods or service throughthe internet within the last one year). In terms of theamount consumed, the consumers had spent 25 trillionand 155 million won on the internet in 2010 as against20 trillion and 643 million won in 2009 (an increase of21.9%), which indicates tremendous growth.
The scale of internet shopping transactions inKorea is expected to grow even further as recentadvances in the mobile internet technology haveenabled consumers to shop on the internet anytimeand anywhere. In this context, the internet purchasepropensity of consumers needs to be accuratelyidentified. Some psychological and marketing researchsuggests that the lifestyle of a consumer is animportant determinant of consumer behaviour (Lazer
1963). Lifestyle refers to the way in which an individuallives, including the person’s dress, habits, friendships,values, and so on (Coreil et al. 1985). A lifestyle can beidentified by a wide range of activities, interests, andopinion. In the marketing discipline, numerous studieshave shown that lifestyle is a better predictor thandemographic information for consumer purchasingbehaviour (Ye et al. 2011).
For a systematic understanding of the lifestyle ofonline users, Smith and Swinyard (2001), Brengmanet al. (2005), and Ye et al. (2011) developed a webusage-related lifestyle measurement instrument toanalyse the behaviour of internet shoppers and non-internet shoppers. However, it is hard to accuratelydetermine the lifestyle of non-internet shoppers be-cause this measurement measures only the onlinelifestyle. Considering the rapid increase in the propa-gation and use of the internet in Korea, it is veryimportant to analyse the characteristics of non-internetshoppers as well. Accordingly, this study aims toaccomplish the following purposes by using surveyquestions for measuring lifestyles of generalconsumers.
Firstly, in Korea, the penetration rate of theinternet and the amount consumed through internetshopping has been rapidly increasing, which is not a
*Corresponding author. Email: [email protected]
� 2013 Taylor & Francis
Behaviour & Information Technology, 2013Vol. 32, No. 5, 468–479, http://dx.doi.org/10.1080/0144929X.2012.687771
Dow
nloa
ded
by [
Nor
thea
ster
n U
nive
rsity
] at
01:
04 0
4 O
ctob
er 2
014
common phenomenon in the United States or theEuropean Union. Thus, its cause needs to bedetermined.
Secondly, this study intends to help to understandKorea’s emerging market with its high internetpenetration rate and the increase in the internettransactions by analysing the difference between onlineshoppers and non-online shoppers.
2. Theoretical background
2.1. Lifestyle
The term lifestyle has been defined and applied invarious ways, and it was initially defined as a livingstyle that is determined by the social status of a group(Coreil et al. 1985). The concept of lifestyle was firstapplied to the field of marketing by Lazer (1963) andthen actively examined in terms of consumer behaviourby Anderson and Golden (1984) and Plummer (1974).Lifestyle has been used for studies of consumerbehaviour because it enables explanation about thedifferences among various types of consumer beha-viour related to products, brands, and use of mediaand is regarded as a significant concept in classifyingconsumers. It is also applied to the field of marketingin predicting consumer behaviour and explainingconsumers’ responses to marketing activities and tothe field of healthcare in determining the differences inrisks for diseases according to lifestyle (Coreil et al.1985, Lawson and Todd 2002). Along with the adventof the internet, the concept of lifestyle began to be usedto explain consumer behaviour on the internet. Thisstudy intends to use the concept to examine thedifferences between internet shoppers and non-internetshoppers (Swinyard and Smith 2003, Brengman et al.2005, Teo 2006, Ye et al. 2011).
2.2. Value
To effectively analyse demographical differences be-tween internet shoppers and non-internet shoppers, itis necessary to theoretically review what they perceivewhen selecting shopping malls. Based on existingstudies, the issue of shoppers’ choices whether to selectinternet shopping malls for shopping can be ap-proached from the viewpoint of the ‘value’ recognisedby the shoppers (Jones et al. 2006).
Values are defined differently by different research-ers. They are sometimes defined as beliefs that prefercertain situations to others (Solomon 1996) orexplained in relation to value creations or consumptionexperience (Holbrook 1994, Chen and Tsai 2008). Inaddition, Keeny (1999) classified shoppers’ values ininternet commerce into nine categories to maximisecustomer satisfaction. Mathwick et al. (2001) classified
those values in internet and catalog shopping environ-ments into four types, and Anckar et al. (2002)classified shoppers’ values in online food shoppingmalls into four types. Carpenter et al. (2005) and Toet al. (2007) classified shoppers’ values in internetcommerce into utilitarian value and hedonic value (seeTable 1). As such, values are used as very wide andcomprehensive concepts, depending on the contentsbeing studied, and vary with the contexts of studies(Holbrook and Corfman 1985). However, on reviewingthe above-mentioned studies, values could be sum-marised as essentially consumers’ perceptions arisingfrom relationships between the costs inputted toproducts or services and the benefits obtained fromthe products or services. If this logic is applied toshopping mall environments, then it is evident that therelationships between inputted costs and obtainedbenefits will determine whether consumers will electinternet shopping malls or offline shopping malls. Inthat case, the convenience, navigability, visual designs,and product diversity are the evaluation tools tomeasure the benefits obtained by consumers frominternet shopping malls suggested by Jarvenpaa andTodd (1997) and Lohse and Spiller (1998), and whichare acknowledged as universal evaluation criteria forinternet shopping malls (Lin et al. 2010).
3. Methods
3.1. Data collection
To conduct this study, data from Media and Con-sumer Research (MCR) conducted by Korea Broad-cast Advertising Corporation (KOBACO) were used.These data were obtained from a survey conducted inJune 2007 through the propositional probabilitysampling method based on the population census andface to face interviews with 6000 men and women inthe age range of 13–64 living in Korea. The surveyregions were 40 cities across the country (includingJeju-do), including the Seoul Metropolis, six metropo-litan cities (Busan, Daegu, Gwangju, Daejon, Incheon,Ulsan), and 33 small or medium cities.
The MCR data are composed of media usebehaviour surveys, overall living attitude and lifestylesurveys, and product buying behaviour surveys. Thisstudy intends to mainly analyse whether the subjectshad experience in using internet shopping, theirlifestyles relating to consumption patterns, and theirdemographic characteristics. From the 6000 respon-dents in total, 17 respondents were excluded since theydid not answer the question asking whether they hadexperience in shopping in internet shopping malls. Inthis survey, the question about purchase experiencedoes not ask of ‘‘your purchase experience in recentyear’’ as the Korea internet & Security Agency (2011)
Behaviour & Information Technology 469
Dow
nloa
ded
by [
Nor
thea
ster
n U
nive
rsity
] at
01:
04 0
4 O
ctob
er 2
014
did, instead, it asks that ‘‘if you have an experience inpurchasing an item online at least once.’’. Rather, inorder to measure actual experience in shopping online,it asked, ‘Have you ever bought an item throughinternet shopping?’ Therefore, the respondents whoanswered ‘no’ to this question are non-internetshoppers in a more strict sense than those who hadno shopping experience for the last year. Respondentswho answered ‘rarely access’ (n ¼ 870) or ‘do notaccess’ (n ¼ 777) and those who ‘did not answer’(n ¼ 38) were excluded from the subjects of this studybecause it was difficult to regard them as internet users.Therefore, 4298 out of the 6000 total respondents wereselected as subjects of this study to conduct theanalyses.
The characteristics of the 4298 respondents are asfollows (Table 2). The sample consists of more males(54.7%) than females (45.3%), 54.2% are married, andthe majority have a college or lower (59.1%) studylevel. The highest monthly income is 3–4 million won(28.1%), followed by 2–3 million won (23.5%). Interms of occupation, students are the dominant group,representing 24.3% of the total, followed by house-wives (15.0%).
3.2. Analysis methods and procedure
The descriptive analysis and t-tests were conducted inorder to review differences between internet shoppersand non-internet shoppers, as well as cross-tabulationanalyses conducted depending on the scales ofvariables. In addition, factor analyses were conductedin order to see differences in the characteristics oflifestyles.
The major analytical method used in this researchis the Decision Tree Analysis. The approach is feasiblethrough classifiers such as Chi-square Automatic
Interaction Detection (CHAID), Automatic Interac-tion Detection (AID), Classification And RegressionTree (CART), and Artificial Neural Networks. Theselection of the classification algorithm rests onspecific data characteristics and desire computationmethods. On the other hand, CHAID algorithm hasbeen more actively applied in the field of consumerresearch (Magidson 1994). This and AID algorithmsare similar classification methods that can be used toanalyse categorical data. However, the latter onlyuses binary data as a dependent variable whileCHAID incorporates a dependent variable that hastwo or more categories. Since the dependent variableof this study involves six category levels, it usedCHAID algorithm as the classification algorithm.
4. Analyses and results
4.1. Profile of respondents
The demographical characteristics of the 4298 respon-dents used in this study were taken from therespondents of the MCR survey, it was first attemptedto review the characteristics of internet shopping mallusers and non-internet shoppers.
The result of the demographical statistical analy-sis of the respondents shown in Table 2 indicatesthat of the 4298 respondents, the number of internetshoppers was 2206 (51.3%) and the number of non-internet shoppers was 2092 (48.7%). Given that thepercentage of persons with experience in internetshopping was 55.8% in the result of the surveyconducted by the Korea internet & Security Agency(2011), the samples were collected relatively well.Although the difference in the internet shoppingexperience between genders was not shown to begreat, in the case of the non-internet shoppers, thepercentage of men was shown to be somewhat higher
Table 1. Previous research in internet shopping value.
Related researches Definition Value type
Keeny (1999) Maximise customer satisfaction Product quality, cost, time to receive product,convenience, time spent, privacy, shoppingenjoyment, safety, environmental impact
Mathwick et al. (2001) Experiential value has been said to offer bothextrinsic and intrinsic benefit
consumer return on investment, service excellence,playfulness, and aesthetic appeal
Anckar et al. (2002) Value added service Price level, product rage, shopping convenience,customer service
Kim (2002) Consumer value as a relativistic preferencecharacterising a consumer’s experiences ofinteracting with some object
Convenience, resources (time, effort, and money),product performance, customer services,entertainment, social interaction, ambience
Carpenter et al. (2005) Utilitarian value: Consumer’s evaluation ofwhether the outcome of a shopping experiencewas successful in terms of satisfying the need
Utilitarian value (cost saving, convenience,selection, information, lack of sociality,customised product), hedonic value (adventure/explore, social, idea, authority)
To et al. (2007) Hedonic value: Shopping experience reflects theemotional and psychological worth of theexperience
S-B. Park et al.470
Dow
nloa
ded
by [
Nor
thea
ster
n U
nive
rsity
] at
01:
04 0
4 O
ctob
er 2
014

than that of women. With regard to marriage status,no significant difference between the numbers ofmarried and unmarried respondents was shown inthe internet shoppers while the percentage of
unmarried respondents was shown to be lower thanthat of married respondents in the non-internetshoppers. This suggests that unmarried persons useinternet shopping malls relatively more actively.
Table 2. Respondents’ demographical characteristics.
CharacteristicsTotal respondents
(n ¼ 4298)Internet
shoppers (n ¼ 2206)Non-internet
shoppers (n ¼ 2092)
GenderMale 2352 (54.7%) 1069 (48.5%) 1283 (61.3%)Female 1946 (45.3%) 1137 (51.5%) 809 (38.7%)
Marital statusMarried 2330 (54.2%) 1.028 (46.6%) 1302 (62.2%)Unmarried 1924 (44.8%) 1.159 (52.5%) 765 (36.6%)Others/no answer 44 (1.1%) 19 (0.8%) 25 (1.2%)
Final educationCollege or lower 2542 (59.1%) 1194 (54.0%) 1348 (64.5%)University undergraduate 353 (8.2%) 264 (12.0%) 89 (4.3%)University graduate 1190 (27.7%) 637 (28.9%) 553 (26.4%)Graduate school or higher 116 (2.7%) 65 (3.0%) 51 (2.4)No answer 97 (2.3%) 46 (2.1%) 51 (2.4)
Monthly incomeLess than 2 million won 330 (7.7%) 176 (8.0%) 154 (7.4%)2–3 million won 1010 (23.5%) 497 (22.5%) 513 (24.5%)3–4 million won 1208 (28.1%) 1023 (46.4%) 625 (29.9%)4–5 million won 878 (20.4%) 300 (13.6%) 438 (20.9%)5 million won or more 820 (19.1%) 185 (8.4%) 335 (16.0%)No answer 52 (1.2%) 25 (1.1%) 27 (1.3%)
OccupationHousewife 643 (15.0%) 349 (15.8%) 294 (13.3%)Student 1043 (24.3%) 609 (27.6%) 434 (19.6%)Professional 283 (6.6%) 135 (6.1%) 148 (6.7%)Company employee 570 (13.3%) 339 (15.4%) 231 (10.5%)Private business 337 (7.8%) 142 (6.4%) 195 (8.8%)Sales/service 482 (11.2%) 243 (11.0%) 239 (10.8%)Engineer/labourer 635 (14.8%) 237 (10.7%) 398 (18.0%)Others/no answer 305 (7.1%) 152 (6.9%) 270 (12.2%)
DomicileCapital zone (Seoul, Gyeonggi) 1796 (41.8%) 993 (45.0%) 803 (36.4%)Others 2502 (58.2%) 1213 (55.0%) 1289 (61.6%)
Income typeBoth the husband and wife work 951 (22.1%) 417 (18.9%) 534 (25.5%)Only the husband works 1308 (30.4%) 585 (26.5%) 723 (34.6%)Only the wife works 34 (0.8%) 11 (0.5%) 23 (1.1%)Others/no answer 37 (0.9%) 15 (0.7%) 22 (1.1%)
AgeMean (standard deviation) 32.0 (11.6) 29.8 (10.1) 34.5 (12.6)
Note: 1 US $ ¼ 1100 won.
Figure 1. Relationship between marital status and gender on internet shopping experience.
Behaviour & Information Technology 471
Dow
nloa
ded
by [
Nor
thea
ster
n U
nive
rsity
] at
01:
04 0
4 O
ctob
er 2
014

In addition to the marriage status-based analysis,both marriage status and gender are analysed (seeFigure 1).
Figure 1 shows the changing habits of malestowards internet shopping after marriage. It is clearlyshown that single men do more internet shopping thansingle women, but married men are less likely to shoponline. However after marriage, the percentage offemales engaged in internet shopping somewhatincreases more than that of males.
With respect to education level, the percentage ofuniversity undergraduates was shown to be low in thenon-internet shoppers, but no significant difference ineducation was shown in general. With regard tomonthly income, 3–4 million won per month occupiedthe largest percentage for both internet shopping mallusers and non-internet shoppers. However, in the caseof high-income respondents earning at least 5 millionwon per month, the percentage of non-internetshoppers was shown to be nearly two times that ofusers. This can be considered to be because of thecharacteristics of the product group of internetshopping malls that handle relatively low–mediumpriced products. With regard to occupations, internetshoppers included relatively high ratios of students andcompany employees, and the ratios of engineers/labourers were shown to be relatively high for non-internet shoppers. This leads to an inference that theuse of internet shopping malls might be correlated withthe frequency of exposure to the internet. In terms ofdomiciles divided into the capital zone and otherregions, no significant difference was shown betweeninternet shoppers and non-internet shoppers. Again,no significant difference in whether both the husbandand wife work was shown between the two groups.However, the respondents’ ages were averaged forcomparison between internet shoppers and non-inter-net shoppers, and based on the result, the average ageof the internet shoppers was 29.8 years and that of thenon-internet shoppers was 34.5 years. Thus, the ages ofthe non-internet shoppers were higher (t ¼713.560,p 5 0.01). In fact, it is more likely for an older personto be married. The correlation analysis result provedthe same, showing a high correlation coefficientbetween the two, 0.778 (p 5 0.01). On reviewing the
above-mentioned result of the demographical statisti-cal analyses, it can be considered that non-internetshoppers (1) include more married persons, (2) includepeople with a high income, (3) include many engineers/labourers with low frequencies of access to the internetand (4) are relatively older.
Meanwhile, t-tests were conducted in order tograsp whether internet usage time is significantlydifferent between internet shoppers and non-internetshoppers. For analysis, internet usage time was dividedinto four types: ‘total daily usage time (minutes)’,‘usage time during each weekday (minutes)’, ‘usagetime on Saturday (minutes)’, and ‘usage time onSunday (minutes)’. The result of the analysis is shownin Table 3.
These results indicated that not only the ‘total dailyusage time (minutes)’, but also that each of the othertypes of usage time of the internet shoppers werestatistically significantly longer than those of the non-internet shoppers. This can be considered evidence thatstraightforwardly shows that the internet shoppingexperience is very closely related to the length of internetusage time. In particular, it was indicated that differencesin internet usage time between the internet shoppers andthe non-internet shoppers were larger in ‘Saturday usagetime (minutes)’ and ‘Sunday usage time (minutes)’ thanin ‘weekday usage time (minutes)’. That is, it can beinterpreted that the internet shoppers tend to useinternet to do internet shopping during weekends whilethe internet shopping mall non-internet shoppers do notuse the internet very much during weekends.
Thus, the study deals on the diffusion of innovationas a way to understand non-usage and limited usage ofthe internet as a whole and its effect on the adoption ofa subsequent later innovation internet shopping.
4.2. Analysis of lifestyles in internet shopper
The MCR data measured lifestyle patterns in 10areas (value, human relations, dietary life, education,dwelling-life, health, fashion/beauty treatment, lei-sure/habit, and media use and consumption patterns)with 129 questions. Additionally, measurement vari-ables were measured with a 6-point Likert intervalscale (1 ¼ strongly disagree, 2 ¼ disagree, 3 ¼ tend
Table 3. t-test result of internet using time (minutes).
Characteristics
Internet shopping experience
Difference in means t-value Sig.Internet shoppers Non-internet shoppers
Total daily internet using time on average 109.92 87.98 21.939 9.353 0.000Internet using time during each weekday 106.99 87.49 19.502 7.198 0.000Internet using time on Saturday 112.66 88.24 24.419 9.060 0.000Internet using time on each Sunday 109.75 88.10 21.651 7.161 0.000
S-B. Park et al.472
Dow
nloa
ded
by [
Nor
thea
ster
n U
nive
rsity
] at
01:
04 0
4 O
ctob
er 2
014

to disagree, 4 ¼ tend to agree, 5 ¼ agree, 6 ¼strongly agree).
In this study, it was attempted to view the differencesbetween internet shoppers and non-internet shoppers asdifferences in perceptions of values in shopping, and itcan be seen that these values in shopping are very closelyrelated to individuals’ propensities to consume (Babinet al. 1994, Childer et al. 2001, To et al. 2007). Therefore,from the questions mentioned above, only the 28questions relating to ‘consumption patterns’ wereselected in order to review differences between internetshoppers and non-internet shoppers. The detail ques-tions to measure consumption pattern related lifestylesare shown in Table 4.
4.2.1. Assessment of measurement properties
Although the consumption pattern related lifestylesused in this study had been already verified through theMCR survey, their reliability and validity wereexamined again since only 28 consumption patternquestions separately extracted were used. First, theCronbach’s a was used to measure the reliability of themeasurement variables, and the Cronbach’s a values ofall factors were shown to be at least 0.6, indicating thatthe measurement constructs were valid. Also, factoranalyses were conducted to review the construct
validity of the consumption pattern related lifestylequestions. In the factor analyses, the varimax, anorthogonal rotation method, was used to extractfactors with an eigenvalue of at least 1 and a factorloading of at least 0.5. After the varimax rotation, fourquestions with low explanatory power (‘I thinkexpensive products are excellent in quality’ (v6); ‘Ihave had troubles due to credit card arrearages’ (v7);‘Shopping is enjoyable’ (v19); and ‘I would like to buyan imported car rather than a car made in Korea iftheir conditions are the same’ (v28)) were excluded,and the second factor analysis was conducted on theremaining 24 questions. After the varimax rotation,seven factors with a 1 or higher Eigen value and afactor loading of 0.5 or higher were extracted. Theextracted factors are named as ‘enjoy shopping’,‘planned buying’, ‘credit cards preference’, ‘economicalconsuming’, ‘information pursuing’, ‘brands prefer-ence’, and ‘rational buying’. These seven factorsexplained 60.396% of the entire variance. Table 5shows the result of the factor analysis.
4.2.2. Analysis of differences in consumption patternrelated lifestyles
The purpose of the second research question of thisstudy is to grasp differences in the characteristics of
Table 4. Measurement scale.
No Measurement item Mean S.D.
v1 I actively search information to buy satisfactory products 3.741 1.072v2 I obtain information on products faster than others 3.625 1.048v3 I prepare lists before shopping in an attempt to reduce impulse buying 3.667 1.090v4 I select products with reliable A/S even if the prices are high 4.076 1.003v5 I buy new products just released faster than others 3.422 1.134v6 I think expensive products are excellent in quality 4.008 1.049v7 I have had trouble due to credit card arrearages 3.022 1.420v8 I consider specific manufactures when buying products 3.972 1.036v9 I continue buying products that I have bought before 4.004 1.002v10 I prefer instalment purchases to lump-sum payment purchases, if possible 3.590 1.241v11 I usually use credit cards or check cards when buying products. 3.735 1.305v12 I carefully review credit card and coupon discount benefits 3.694 1.201v13 I look around many shops and sufficiently compare before buying products 3.887 1.080v14 I buy products with good performance or quality rather than those with good designs 4.040 1.042v15 I mainly use large discount stores rather than department stores or general shops 4.086 1.071v16 I buy products during sale periods 4.014 1.066v17 I use products for a long time until they become unusable 3.919 1.084v18 I receive cash receipts when buying goods in cash 3.822 1.262v19 Shopping is enjoyable 3.906 1.143v20 I get stressed when I am unable to buy something that I want to buy 3.540 1.189v21 I buy products with famous brands even if they are expensive 3.526 1.151v22 My friends buy products after I bought them in many cases 3.547 1.100v23 I feel regretful when I came home after buying products in many cases 3.476 1.100v24 I buy products that were not in my plans on impulse in many cases 3.490 1.100v25 I buy products that I definitely want regardless of price 3.508 1.172v26 I buy products recommended by salespeople or those surrounding me in many cases 3.592 1.093v27 I frequently buy products through internet shopping or home shopping 3.465 1.190v28 I would like to buy an imported car rather than a car made in Korea if their conditions were the same 3.503 1.269
Behaviour & Information Technology 473
Dow
nloa
ded
by [
Nor
thea
ster
n U
nive
rsity
] at
01:
04 0
4 O
ctob
er 2
014
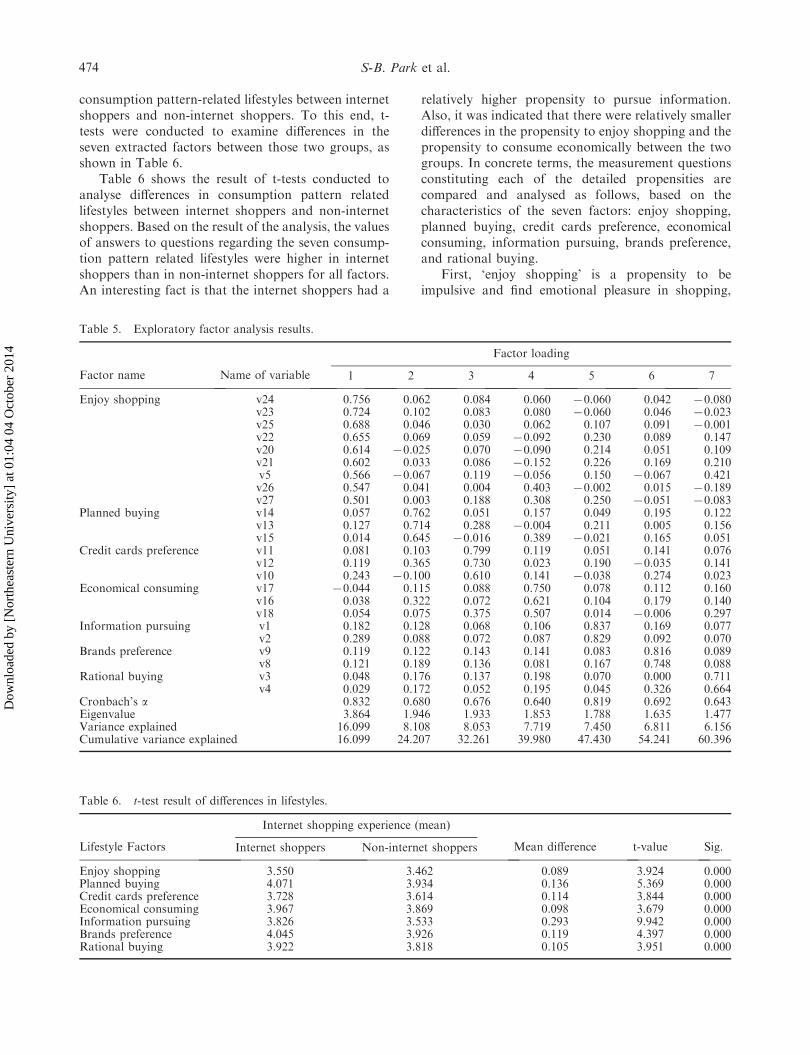
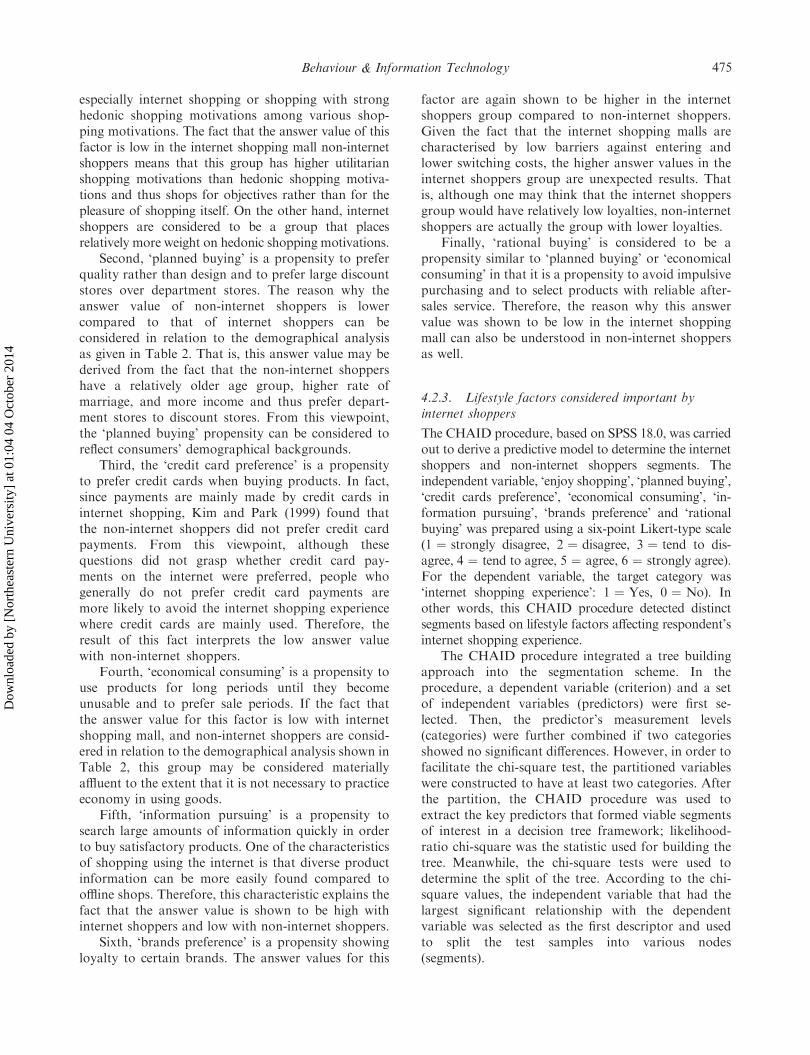
consumption pattern-related lifestyles between internetshoppers and non-internet shoppers. To this end, t-tests were conducted to examine differences in theseven extracted factors between those two groups, asshown in Table 6.
Table 6 shows the result of t-tests conducted toanalyse differences in consumption pattern relatedlifestyles between internet shoppers and non-internetshoppers. Based on the result of the analysis, the valuesof answers to questions regarding the seven consump-tion pattern related lifestyles were higher in internetshoppers than in non-internet shoppers for all factors.An interesting fact is that the internet shoppers had a
relatively higher propensity to pursue information.Also, it was indicated that there were relatively smallerdifferences in the propensity to enjoy shopping and thepropensity to consume economically between the twogroups. In concrete terms, the measurement questionsconstituting each of the detailed propensities arecompared and analysed as follows, based on thecharacteristics of the seven factors: enjoy shopping,planned buying, credit cards preference, economicalconsuming, information pursuing, brands preference,and rational buying.
First, ‘enjoy shopping’ is a propensity to beimpulsive and find emotional pleasure in shopping,
Table 5. Exploratory factor analysis results.
Factor name Name of variable
Factor loading
1 2 3 4 5 6 7
Enjoy shopping v24 0.756 0.062 0.084 0.060 70.060 0.042 70.080v23 0.724 0.102 0.083 0.080 70.060 0.046 70.023v25 0.688 0.046 0.030 0.062 0.107 0.091 70.001v22 0.655 0.069 0.059 70.092 0.230 0.089 0.147v20 0.614 70.025 0.070 70.090 0.214 0.051 0.109v21 0.602 0.033 0.086 70.152 0.226 0.169 0.210v5 0.566 70.067 0.119 70.056 0.150 70.067 0.421v26 0.547 0.041 0.004 0.403 70.002 0.015 70.189v27 0.501 0.003 0.188 0.308 0.250 70.051 70.083
Planned buying v14 0.057 0.762 0.051 0.157 0.049 0.195 0.122v13 0.127 0.714 0.288 70.004 0.211 0.005 0.156v15 0.014 0.645 70.016 0.389 70.021 0.165 0.051
Credit cards preference v11 0.081 0.103 0.799 0.119 0.051 0.141 0.076v12 0.119 0.365 0.730 0.023 0.190 70.035 0.141v10 0.243 70.100 0.610 0.141 70.038 0.274 0.023
Economical consuming v17 70.044 0.115 0.088 0.750 0.078 0.112 0.160v16 0.038 0.322 0.072 0.621 0.104 0.179 0.140v18 0.054 0.075 0.375 0.507 0.014 70.006 0.297
Information pursuing v1 0.182 0.128 0.068 0.106 0.837 0.169 0.077v2 0.289 0.088 0.072 0.087 0.829 0.092 0.070
Brands preference v9 0.119 0.122 0.143 0.141 0.083 0.816 0.089v8 0.121 0.189 0.136 0.081 0.167 0.748 0.088
Rational buying v3 0.048 0.176 0.137 0.198 0.070 0.000 0.711v4 0.029 0.172 0.052 0.195 0.045 0.326 0.664
Cronbach’s a 0.832 0.680 0.676 0.640 0.819 0.692 0.643Eigenvalue 3.864 1.946 1.933 1.853 1.788 1.635 1.477Variance explained 16.099 8.108 8.053 7.719 7.450 6.811 6.156Cumulative variance explained 16.099 24.207 32.261 39.980 47.430 54.241 60.396
Table 6. t-test result of differences in lifestyles.
Lifestyle Factors
Internet shopping experience (mean)
Mean difference t-value Sig.Internet shoppers Non-internet shoppers
Enjoy shopping 3.550 3.462 0.089 3.924 0.000Planned buying 4.071 3.934 0.136 5.369 0.000Credit cards preference 3.728 3.614 0.114 3.844 0.000Economical consuming 3.967 3.869 0.098 3.679 0.000Information pursuing 3.826 3.533 0.293 9.942 0.000Brands preference 4.045 3.926 0.119 4.397 0.000Rational buying 3.922 3.818 0.105 3.951 0.000
S-B. Park et al.474
Dow
nloa
ded
by [
Nor
thea
ster
n U
nive
rsity
] at
01:
04 0
4 O
ctob
er 2
014
especially internet shopping or shopping with stronghedonic shopping motivations among various shop-ping motivations. The fact that the answer value of thisfactor is low in the internet shopping mall non-internetshoppers means that this group has higher utilitarianshopping motivations than hedonic shopping motiva-tions and thus shops for objectives rather than for thepleasure of shopping itself. On the other hand, internetshoppers are considered to be a group that placesrelatively more weight on hedonic shopping motivations.
Second, ‘planned buying’ is a propensity to preferquality rather than design and to prefer large discountstores over department stores. The reason why theanswer value of non-internet shoppers is lowercompared to that of internet shoppers can beconsidered in relation to the demographical analysisas given in Table 2. That is, this answer value may bederived from the fact that the non-internet shoppershave a relatively older age group, higher rate ofmarriage, and more income and thus prefer depart-ment stores to discount stores. From this viewpoint,the ‘planned buying’ propensity can be considered toreflect consumers’ demographical backgrounds.
Third, the ‘credit card preference’ is a propensityto prefer credit cards when buying products. In fact,since payments are mainly made by credit cards ininternet shopping, Kim and Park (1999) found thatthe non-internet shoppers did not prefer credit cardpayments. From this viewpoint, although thesequestions did not grasp whether credit card pay-ments on the internet were preferred, people whogenerally do not prefer credit card payments aremore likely to avoid the internet shopping experiencewhere credit cards are mainly used. Therefore, theresult of this fact interprets the low answer valuewith non-internet shoppers.
Fourth, ‘economical consuming’ is a propensity touse products for long periods until they becomeunusable and to prefer sale periods. If the fact thatthe answer value for this factor is low with internetshopping mall, and non-internet shoppers are consid-ered in relation to the demographical analysis shown inTable 2, this group may be considered materiallyaffluent to the extent that it is not necessary to practiceeconomy in using goods.
Fifth, ‘information pursuing’ is a propensity tosearch large amounts of information quickly in orderto buy satisfactory products. One of the characteristicsof shopping using the internet is that diverse productinformation can be more easily found compared tooffline shops. Therefore, this characteristic explains thefact that the answer value is shown to be high withinternet shoppers and low with non-internet shoppers.
Sixth, ‘brands preference’ is a propensity showingloyalty to certain brands. The answer values for this
factor are again shown to be higher in the internetshoppers group compared to non-internet shoppers.Given the fact that the internet shopping malls arecharacterised by low barriers against entering andlower switching costs, the higher answer values in theinternet shoppers group are unexpected results. Thatis, although one may think that the internet shoppersgroup would have relatively low loyalties, non-internetshoppers are actually the group with lower loyalties.
Finally, ‘rational buying’ is considered to be apropensity similar to ‘planned buying’ or ‘economicalconsuming’ in that it is a propensity to avoid impulsivepurchasing and to select products with reliable after-sales service. Therefore, the reason why this answervalue was shown to be low in the internet shoppingmall can also be understood in non-internet shoppersas well.
4.2.3. Lifestyle factors considered important byinternet shoppers
The CHAID procedure, based on SPSS 18.0, was carriedout to derive a predictive model to determine the internetshoppers and non-internet shoppers segments. Theindependent variable, ‘enjoy shopping’, ‘planned buying’,‘credit cards preference’, ‘economical consuming’, ‘in-formation pursuing’, ‘brands preference’ and ‘rationalbuying’ was prepared using a six-point Likert-type scale(1 ¼ strongly disagree, 2 ¼ disagree, 3 ¼ tend to dis-agree, 4 ¼ tend to agree, 5 ¼ agree, 6 ¼ strongly agree).For the dependent variable, the target category was‘internet shopping experience’: 1 ¼ Yes, 0 ¼ No). Inother words, this CHAID procedure detected distinctsegments based on lifestyle factors affecting respondent’sinternet shopping experience.
The CHAID procedure integrated a tree buildingapproach into the segmentation scheme. In theprocedure, a dependent variable (criterion) and a setof independent variables (predictors) were first se-lected. Then, the predictor’s measurement levels(categories) were further combined if two categoriesshowed no significant differences. However, in order tofacilitate the chi-square test, the partitioned variableswere constructed to have at least two categories. Afterthe partition, the CHAID procedure was used toextract the key predictors that formed viable segmentsof interest in a decision tree framework; likelihood-ratio chi-square was the statistic used for building thetree. Meanwhile, the chi-square tests were used todetermine the split of the tree. According to the chi-square values, the independent variable that had thelargest significant relationship with the dependentvariable was selected as the first descriptor and usedto split the test samples into various nodes(segments).
Behaviour & Information Technology 475
Dow
nloa
ded
by [
Nor
thea
ster
n U
nive
rsity
] at
01:
04 0
4 O
ctob
er 2
014
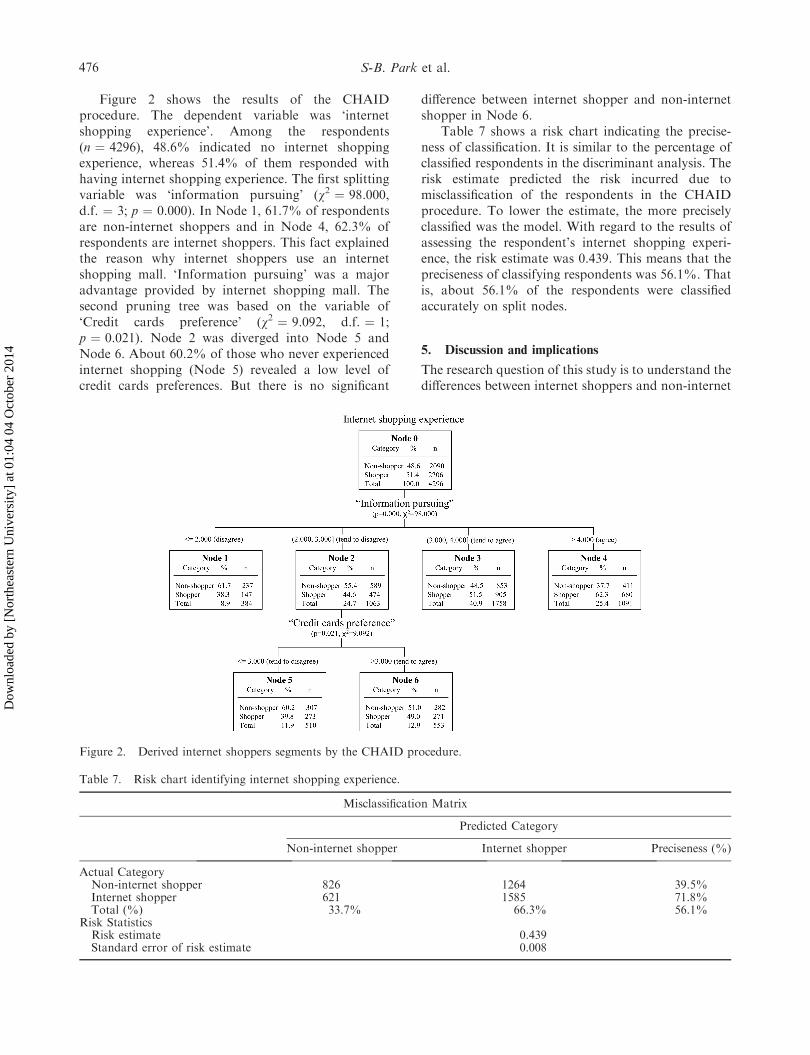
Figure 2 shows the results of the CHAIDprocedure. The dependent variable was ‘internetshopping experience’. Among the respondents(n ¼ 4296), 48.6% indicated no internet shoppingexperience, whereas 51.4% of them responded withhaving internet shopping experience. The first splittingvariable was ‘information pursuing’ (w2 ¼ 98.000,d.f. ¼ 3; p ¼ 0.000). In Node 1, 61.7% of respondentsare non-internet shoppers and in Node 4, 62.3% ofrespondents are internet shoppers. This fact explainedthe reason why internet shoppers use an internetshopping mall. ‘Information pursuing’ was a majoradvantage provided by internet shopping mall. Thesecond pruning tree was based on the variable of‘Credit cards preference’ (w2 ¼ 9.092, d.f. ¼ 1;p ¼ 0.021). Node 2 was diverged into Node 5 andNode 6. About 60.2% of those who never experiencedinternet shopping (Node 5) revealed a low level ofcredit cards preferences. But there is no significant
difference between internet shopper and non-internetshopper in Node 6.
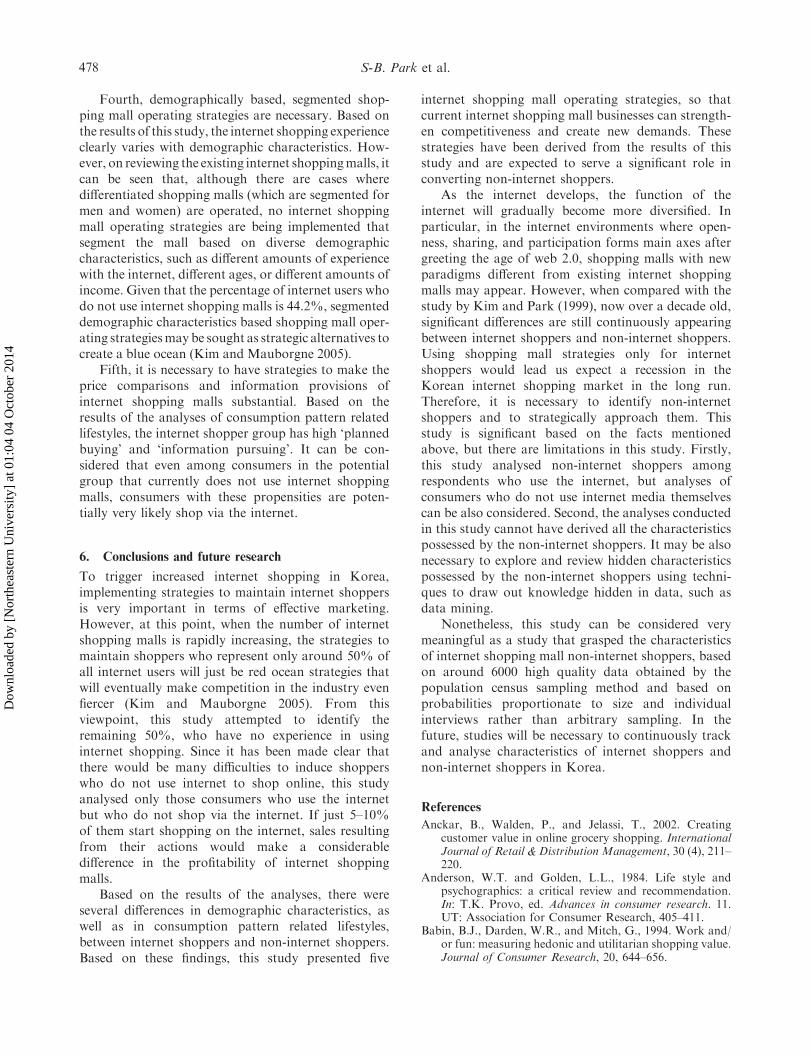
Table 7 shows a risk chart indicating the precise-ness of classification. It is similar to the percentage ofclassified respondents in the discriminant analysis. Therisk estimate predicted the risk incurred due tomisclassification of the respondents in the CHAIDprocedure. To lower the estimate, the more preciselyclassified was the model. With regard to the results ofassessing the respondent’s internet shopping experi-ence, the risk estimate was 0.439. This means that thepreciseness of classifying respondents was 56.1%. Thatis, about 56.1% of the respondents were classifiedaccurately on split nodes.
5. Discussion and implications
The research question of this study is to understand thedifferences between internet shoppers and non-internet
Table 7. Risk chart identifying internet shopping experience.
Misclassification Matrix
Predicted Category
Non-internet shopper Internet shopper Preciseness (%)
Actual CategoryNon-internet shopper 826 1264 39.5%Internet shopper 621 1585 71.8%Total (%) 33.7% 66.3% 56.1%
Risk StatisticsRisk estimate 0.439Standard error of risk estimate 0.008
Figure 2. Derived internet shoppers segments by the CHAID procedure.
S-B. Park et al.476
Dow
nloa
ded
by [
Nor
thea
ster
n U
nive
rsity
] at
01:
04 0
4 O
ctob
er 2
014

shoppers. First, it was reviewed whether there weredemographic differences between internet shoppersand non-internet shoppers, and the results indicatedthat there was no prominent difference between thegroups. However, upon carefully review, it could beseen that there were clear differences between internetshoppers and non-internet shoppers. Based on theresults of this study, it was shown that more non-internet shoppers are married than unmarried. It wasalso shown that although there was not muchdifference in the percentage of users and non-internetshoppers with an income of 3–4 million won permonth, the percentage of non-internet shoppersincreased among consumers with higher incomes.This result is understandable considering the fact thatinternet shopping mall users showed a high plannedbuying propensity, a propensity to prefer credit cards,and a propensity to consume economically in theirconsumption pattern related lifestyles. Also, withregard to occupations, it was shown that engineers/labourers had less experience in using internet shop-ping malls, thereby indicating that frequency of accessto internet media is highly related to internet shopping.In addition, it was indicated that consumers in theinternet shopping mall and those who are in the non-internet shoppers’ category were older than those inthe internet shoppers group.
With regard to internet media usage time, t-testswere conducted on relationships between internetusage times and whether internet shopping mallswere adopted, and the result indicated that the internetusage times of the internet shoppers were statisticallysignificantly longer compared to the non-internetshoppers. This can be said to be evidence directlyshowing that the adoption of internet shopping malls isvery closely related to the length of internet usage time.As mentioned in a study by Kim and Park (1999, 52p),it can be said that internet shoppers show relativelyhigher average values of internet usage times comparedto non-internet shoppers. In their study, it wasanalysed that the daily average internet usage time ofpeople who had experience in buying (internetshoppers) was 82.2 min and that of people who hadno experience in buying (non-internet shoppers) was60.6 minutes. It is interesting that at this moment,approximately 10 years since that study, although theoverall internet usage times of internet shoppers andnon-internet shoppers have increased by at least20 min, the internet usage time of internet shoppersincreased more than non-internet shoppers.
The characteristics of the consumption patternrelated lifestyles of internet shoppers were comparedwith those of non-internet shoppers, and the resultindicated higher answer values on all of the sevenlifestyle factors of internet shoppers compared to non-
internet shoppers. This can be explained by type. Inrespect of the ‘enjoy shopping’ factor, the internetshoppers group was judged as having more hedonicmotivations for shopping. Also, the ‘planned buying’and ‘information pursuing’ factors were major advan-tages provided by internet shopping malls. This factexplained the reason why the internet shoppers grouphad higher propensities in these factors. These resultsare also supported by the CHAID procedure. Withregard to the ‘credit cards preference’ factor, thereason why this propensity is higher with internetshoppers can be seen by reviewing existing studies,indicating that non-internet shoppers feel quiteuneasy about using credit cards on the internet.Especially, these results are also supported by theCHAID procedure. Finally, the reason for thedifferences in answer values for the ‘economicalconsuming’, the ‘brands preference’, and the ‘rationalbuying’ factors can be inferred in light of thedemographical characteristics of the internet shop-pers and the non-internet shoppers.
Based on the results of the analyses of demogra-phical differences between internet shoppers and non-internet shoppers, the results of analyses of consump-tion pattern related lifestyles between the groups, thefollowing strategic suggestions are presented for thecreation of new shoppers by internet shopping mallbusinesses.
First, strategies to increase the frequency ofconsumers’ access to the internet are necessary. Thatis, it is necessary to provide services that will enableconsumers to obtain or grasp diverse informationthrough the internet, even if they do not shop, in orderto keep shoppers on the internet. If this is done, asreviewed in this study, it is very likely that current non-internet shoppers will become internet shoppers.
Second, strategies to upgrade internet shoppingmalls are necessary. Based on the results of this study,groups of married persons, persons with high incomes,and older persons have less experience in adoptinginternet shopping malls. These groups include peoplein the age zones who are economically rich and notfamiliar with the internet, so they can be considered aspreferring offline shopping to internet shopping. Third,strategies to diversify and reinforce convenience arenecessary. As mentioned above, the non-internetshoppers group is not familiar with the internet. Giventhat the ratio of engineers/labourers is high, even iftheir incomes are not very high, measures to improvethe convenience of transactions are necessary. Thecurrent credit card centered payment method canbecome a reason to prevent consumers unfamiliar tothe internet from easily participating in internetshopping due to internet security and the complexityof transactions.
Behaviour & Information Technology 477
Dow
nloa
ded
by [
Nor
thea
ster
n U
nive
rsity
] at
01:
04 0
4 O
ctob
er 2
014
Fourth, demographically based, segmented shop-ping mall operating strategies are necessary. Based onthe results of this study, the internet shopping experienceclearly varies with demographic characteristics. How-ever, on reviewing the existing internet shoppingmalls, itcan be seen that, although there are cases wheredifferentiated shopping malls (which are segmented formen and women) are operated, no internet shoppingmall operating strategies are being implemented thatsegment the mall based on diverse demographiccharacteristics, such as different amounts of experiencewith the internet, different ages, or different amounts ofincome. Given that the percentage of internet users whodo not use internet shopping malls is 44.2%, segmenteddemographic characteristics based shopping mall oper-ating strategiesmay be sought as strategic alternatives tocreate a blue ocean (Kim and Mauborgne 2005).
Fifth, it is necessary to have strategies to make theprice comparisons and information provisions ofinternet shopping malls substantial. Based on theresults of the analyses of consumption pattern relatedlifestyles, the internet shopper group has high ‘plannedbuying’ and ‘information pursuing’. It can be con-sidered that even among consumers in the potentialgroup that currently does not use internet shoppingmalls, consumers with these propensities are poten-tially very likely shop via the internet.
6. Conclusions and future research
To trigger increased internet shopping in Korea,implementing strategies to maintain internet shoppersis very important in terms of effective marketing.However, at this point, when the number of internetshopping malls is rapidly increasing, the strategies tomaintain shoppers who represent only around 50% ofall internet users will just be red ocean strategies thatwill eventually make competition in the industry evenfiercer (Kim and Mauborgne 2005). From thisviewpoint, this study attempted to identify theremaining 50%, who have no experience in usinginternet shopping. Since it has been made clear thatthere would be many difficulties to induce shopperswho do not use internet to shop online, this studyanalysed only those consumers who use the internetbut who do not shop via the internet. If just 5–10%of them start shopping on the internet, sales resultingfrom their actions would make a considerabledifference in the profitability of internet shoppingmalls.
Based on the results of the analyses, there wereseveral differences in demographic characteristics, aswell as in consumption pattern related lifestyles,between internet shoppers and non-internet shoppers.Based on these findings, this study presented five
internet shopping mall operating strategies, so thatcurrent internet shopping mall businesses can strength-en competitiveness and create new demands. Thesestrategies have been derived from the results of thisstudy and are expected to serve a significant role inconverting non-internet shoppers.
As the internet develops, the function of theinternet will gradually become more diversified. Inparticular, in the internet environments where open-ness, sharing, and participation forms main axes aftergreeting the age of web 2.0, shopping malls with newparadigms different from existing internet shoppingmalls may appear. However, when compared with thestudy by Kim and Park (1999), now over a decade old,significant differences are still continuously appearingbetween internet shoppers and non-internet shoppers.Using shopping mall strategies only for internetshoppers would lead us expect a recession in theKorean internet shopping market in the long run.Therefore, it is necessary to identify non-internetshoppers and to strategically approach them. Thisstudy is significant based on the facts mentionedabove, but there are limitations in this study. Firstly,this study analysed non-internet shoppers amongrespondents who use the internet, but analyses ofconsumers who do not use internet media themselvescan be also considered. Second, the analyses conductedin this study cannot have derived all the characteristicspossessed by the non-internet shoppers. It may be alsonecessary to explore and review hidden characteristicspossessed by the non-internet shoppers using techni-ques to draw out knowledge hidden in data, such asdata mining.
Nonetheless, this study can be considered verymeaningful as a study that grasped the characteristicsof internet shopping mall non-internet shoppers, basedon around 6000 high quality data obtained by thepopulation census sampling method and based onprobabilities proportionate to size and individualinterviews rather than arbitrary sampling. In thefuture, studies will be necessary to continuously trackand analyse characteristics of internet shoppers andnon-internet shoppers in Korea.
References
Anckar, B., Walden, P., and Jelassi, T., 2002. Creatingcustomer value in online grocery shopping. InternationalJournal of Retail & Distribution Management, 30 (4), 211–220.
Anderson, W.T. and Golden, L.L., 1984. Life style andpsychographics: a critical review and recommendation.In: T.K. Provo, ed. Advances in consumer research. 11.UT: Association for Consumer Research, 405–411.
Babin, B.J., Darden, W.R., and Mitch, G., 1994. Work and/or fun: measuring hedonic and utilitarian shopping value.Journal of Consumer Research, 20, 644–656.
S-B. Park et al.478
Dow
nloa
ded
by [
Nor
thea
ster
n U
nive
rsity
] at
01:
04 0
4 O
ctob
er 2
014
Brengman, M., et al., 2005. Segmenting internet shoppersbased on their web usage-related lifestyle: a cross-culturalvalidation. Journal of Business Research, 58 (1), 79–88.
Carpenter, J.M., Moore, M., and Fairhurst, A.E., 2005.Consumer shopping value for retail brands. Journal ofFashion Marketing and Management, 9 (1), 43–53.
Chen, C.F. and Tsai, M.H., 2008. Perceived value, satisfac-tion, and loyalty of TV travel product shopping:involvement as a moderator. Tourism Management, 29,1166–1171.
Childer, T., et al., 2001. Hedonic and utilitarian motivationsfor online retail shopper behavior. Journal of Retailing,77, 511–535.
Coreil, J., Levin, J., and Jaco, E., 1985. Life style – anemergent concept in the sociomedical sciences. Medicineand Psychiatry, 9 (4), 423–437.
Holbrook, M.B., 1994. The nature of customer value: anaxiology of services in the consumption experience, inservices quality. In: Roland T. Rust and Richard L.Oliver, eds. New directions in theory and practice.London: Sage Publications, 21–71.
Holbrook, M.B. and Corfman, K.P., 1985. Quality and valuein the consumption experience: Phaedrus Ridges again.In: Jacob Jacoby and Jerry C. Olson, eds. Perceivedquality: how consumers view stores and merchandise.Lexinton, MA: Heath, 31–57.
Jarvenpaa, S.L. and Todd, P.A., 1997. Consumer reactionsto electronic shopping on the World Wide Web.International Journal of Electronic Commerce, 1 (2), 59–88.
Jones, M.A., Reynolds, K.E., and Arnold, M.J., 2006.Hedonic and utilitarian shopping value: investigatingdifferential effects on retail outcomes. Journal of BusinessResearch, 59 (9), 974–981.
Keeny, R., 1999. The value of internet commerce to thecustomer. Management Science, 45 (4), 533–542.
Kim, S.Y. and Park, S.Y., 1999. A study of decision factorsfor purchase intention at the electronic commerce.Journal of Consumer Studies (Korean Journal), 10 (3),45–66.
Kim, W.C. and Mauborgne, R., 2005. Blue ocean strategy.Boston: Harvard Business School Press.
Kim, Y.K., 2002. Consumer value: an application to malland internet shopping. International Journal of Retail &Distribution Management, 30 (12), 595–602.
Korea Internet & Security Agency, 2011. 2011 Korea internetusage analysis white paper. Available from: www.ki-sa.or.kr [Accessed 11 May 2012].
Lawson, R. and Todd, S., 2002. Consumer lifestyles: a socialstratification perspective. Marketing Theory, 2 (3), 295–307.
Lazer, W., 1963. Life style concepts and marketing. In:Stephen A. Greyser, ed. Toward scientific marketing.Chicago: American Marketing Association, 140–151.
Lin, W.S., Cassaigne, N., and Huan, T.C., 2010. A frame-work of online shopping support for informationrecommendations. Expert Systems with Applications, 37(10), 6874–6884.
Lohse, G.L. and Spiller, P., 1998. Electronic shopping.Communications of the ACM, 41 (7), 81–87.
Magidson, J., 1994. The CHAID approach to segmentationmodeling: chi-square automatic interaction detection. In:R. Bagozzi, ed. Advanced method of marketing research.Cambridge, MA: Blackwell, 118–159.
Mathwick, C., Malhota, N., and Rigdon, E., 2001. Experi-ential value: conceptualization, measurement and appli-cation in the catalog and internet shopping environment.Journal of Retailing, 77 (1), 39–56.
Plummer, J.T., 1974. The concept and application of life stylesegmentation. Journal of Marketing, 38 (1), 33–37.
Smith, S.M. and Swinyard, W.R., 2001. The identification ofshopping behaviors among internet users. In: Worldmarketing congress, Cardiff Business School, June 28–July1, Cardiff, UK.
Solomon, M.R., 1996. Consumer behavior: buying, having andbeing. 3rd ed. Englewood Cliffs, NJ: Prentice Hall.
Swinyard, W.R. and Smith, S.M., 2003. Why people (don’t)shop online: a lifestyle study of the internet consumer.Psychology & Marketing, 20 (7), 567–597.
Teo, T.S.H., 2006. To buy or not to buy online: adopters andnon-adopters of online shopping in Singapore. Behaviour& Information technology, 25 (6), 497–509.
To, P.L., Liao, C., and Lin, T.H., 2007. Shopping motiva-tions on internet: a study based on utilitarian andhedonic value. Technovation, 27 (12), 774–787.
Ye, Q., Li, G., and Gu, B., 2011. A cross-cultural validationof the web usage-related lifestyle scale: an empiricalinvestigation in China. Electronic Commerce Researchand Applications, 10, 304–312.
Behaviour & Information Technology 479
Dow
nloa
ded
by [
Nor
thea
ster
n U
nive
rsity
] at
01:
04 0
4 O
ctob
er 2
014