Embed Size (px)
Citation preview
Whole-exome sequencing to analyze populationstructure, parental inbreeding, and familial linkageAziz Belkadia,b,1, Vincent Pedergnanaa,b,c,1, Aurélie Cobata,b, Yuval Itand, Quentin B. Vincenta,b, Avinash Abhyankare,Lei Shangd, Jamila El Baghdadif, Aziz Bousfihag, the Exome/Array Consortium2, Alexandre Alcaisa,b,Bertrand Boissona,b,d, Jean-Laurent Casanovaa,b,d,h,i,3, and Laurent Abela,b,d,3
aLaboratory of Human Genetics of Infectious Diseases, Necker Branch, INSERM U1163, Necker Hospital for Sick Children, 75015 Paris, France; bImagineInstitute, Paris Descartes University, 75015 Paris, France; cWellcome Trust Centre for Human Genetics, University of Oxford, Oxford OX3 7BN, UnitedKingdom; dSt. Giles Laboratory of Human Genetics of Infectious Diseases, Rockefeller Branch, Rockefeller University, New York, NY 10065; eNew YorkGenome Center, New York, NY 10013; fGenetics Unit, Military Hospital Mohammed V, Hay Riad, 10100 Rabat, Morocco; gClinical Immunology Unit of thePediatric Infectious Disease Service, Ibn Roshd Hospital, Hassan II University, Casablanca 20460, Morocco; hHoward Hughes Medical Institute, New York, NY10065; and iPediatric Haematology–Immunology Unit, Necker Hospital for Sick Children, 75015 Paris, France
Contributed by Jean-Laurent Casanova, April 27, 2016 (sent for review March 3, 2016; reviewed by Luis B. Barreiro and Jacques Fellay)
Principal component analysis (PCA), homozygosity rate estimations,and linkage studies in humans are classically conducted throughgenome-wide single-nucleotide variant arrays (GWSA). We comparedwhole-exome sequencing (WES) and GWSA for this purpose. Weanalyzed 110 subjects originating from different regions of the world,including North Africa and the Middle East, which are poorly coveredby public databases and have high consanguinity rates. We tested andapplied a number of quality control (QC) filters. Comparedwith GWSA,we found that WES provided an accurate prediction of populationsubstructure using variants with a minor allele frequency > 2%(correlation = 0.89 with the PCA coordinates obtained by GWSA).WES also yielded highly reliable estimates of homozygosity ratesusing runs of homozygosity with a 1,000-kb window (correlation =0.94 with the estimates provided by GWSA). Finally, homozygositymapping analyses in 15 families including a single offspring withhigh homozygosity rates showed that WES provided 51% less ge-nome-wide linkage information than GWSA overall but 97% moreinformation for the coding regions. At the genome-wide scale,76.3% of linked regions were found by both GWSA and WES,17.7% were found by GWSA only, and 6.0% were found by WESonly. For coding regions, the corresponding percentages were83.5%, 7.4%, and 9.1%, respectively. With appropriate QC filters,WES can be used for PCA and adjustment for population substruc-ture, estimating homozygosity rates in individuals, and powerfullinkage analyses, particularly in coding regions.
exome sequencing | genotyping array | population structure |homozygosity mapping | linkage analysis
Whole-exome sequencing (WES) has become the leadingstrategy for uncovering germ-line exome variants in hu-
mans. A number of gene- and variant-level methods have beenproposed for the analysis of WES data to select candidate variants inrare Mendelian disorders and more common traits (1–13). Theseanalyses benefit from the use of additional information, such as fa-milial linkage, homozygosity rate, and ethnic background, which arecommonly used in the study of inherited diseases (14–17). Genome-wide single-nucleotide variant array (GWSAs) are the gold standardmethod for linkage analysis, because they provide maximal linkageinformation for the whole genome (18). GWSAs are also classicallyused to estimate homozygosity rate in patients, confirming or some-times, revealing parental consanguinity through the inbreedingcoefficient parameter F in particular (19, 20). Population stratificationcan be an issue in the analysis of population-based genetic data, in-cluding WES, particularly for association studies (21–24). Populationstructures have been widely determined by GWSA (25, 26) in Eu-ropean (27), African (28, 29), Asian (30), Jewish (31), Mexican (32),and other populations (33). These analyses are mostly based onprincipal component analysis (PCA) (34), which can also be used toconfirm or reveal the ethnicity of an individual patient (or his orher parents).
Unlike WES, which provides thorough coverage for less than2% of the human genome for both rare and common variants,GWSAs cover the whole genome for common variants but onlypatchily, with a mean interval between variants of about 2–4 kb.Obtaining both WES and GWSA data in patients, kindreds, orpopulations is DNA-, resource-, and time-consuming. Twostudies comparing WES and GWSA in linkage analyses based onreal data from three families (35) or both simulated and real datafrom two families (36) showed that the two sets of genetic datadefined linkage peaks (35) and excluded genomic regions (36) ina consistent manner. A recent study estimating homozygosityrates with both GWSA and WES data in patients born to con-sanguineous families provided recommendations for the de-tection of homozygous regions by WES (37). Finally, a methodfor estimating individual ancestry from a PCA map generatedfrom data for a reference set of individuals also showed addedvalue for a combination of single-nucleotide variant (SNV) datafrom exome chips or targeted sequencing with genotyping andimputed data for accurate ancestry estimation, particularly forEuropean populations (38). We performed both GWSA andWES on 110 subjects originating from various regions of the
Significance
We compared the information provided by whole-exome se-quencing (WES) and genome-wide single-nucleotide variant arraysin terms of principal component analysis, homozygosity rate esti-mation, and linkage analysis using 110 subjects originating fromdifferent regions of theworld.WES provided an accurate predictionof population substructure using high-quality variants with a minorallele frequency > 2% and reliable estimation of homozygosityrates using runs of homozygosity. Finally, homozygosity mappingin 15 consanguineous families showed that WES led to powerfullinkage analyses, particularly in coding regions. Overall, our studyshows that WES could be used for several analyses that are veryhelpful to optimize the search for disease-causing exome variants.
Author contributions: A. Belkadi, V.P., A.C., Y.I., A. Alcais, J.-L.C., and L.A. designed research;A. Belkadi, V.P., A.C., Y.I., Q.B.V., A. Abhyankar, L.S., J.E.B., A. Bousfiha, E./A.C., and B.B.performed research; A. Belkadi, V.P., A.C., Y.I., Q.B.V., A. Abhyankar, and B.B. contributednew reagents/analytic tools; A. Belkadi, V.P., A.C., Y.I., Q.B.V., A. Abhyankar, L.S., A. Alcais,B.B., J.-L.C., and L.A. analyzed data; A. Belkadi, V.P., A.C., Y.I., A. Alcais, J.-L.C., and L.A. wrotethe paper; and J.E.B., A. Bousfiha, and E./A.C. provided clinical data.
Reviewers: L.B.B., Centre Hospitalo-Universitaire (CHU) Sainte-Justine/University ofMontreal; and J.F., Ecole Polytechnique Fédérale de Lausanne (EPFL).
The authors declare no conflict of interest.
Freely available online through the PNAS open access option.1A. Belkadi and V.P. contributed equally to this work.2A complete list of the Exome/Array Consortium can be found in Supporting Information.3To whom correspondence may be addressed. Email: [email protected] or [email protected].
This article contains supporting information online at www.pnas.org/lookup/suppl/doi:10.1073/pnas.1606460113/-/DCSupplemental.
www.pnas.org/cgi/doi/10.1073/pnas.1606460113 PNAS | June 14, 2016 | vol. 113 | no. 24 | 6713–6718
MED
ICALSC
IENCE
S
Dow
nloa
ded
by g
uest
on
May
28,
202
0
world, including North Africa and the Middle East. Both of theseregions are poorly covered by the HapMap Project and the 1000Genomes Project and have high consanguinity rates. We comparedthe information provided by the two datasets for the estimation ofhomozygosity rate and linkage analysis by homozygosity mapping.We also defined the optimal criteria for selecting WES variants tooptimize PCA and ancestry prediction for individuals of variousethnic origins.
ResultsWe performed genotyping with the Affymetrix GWSA 6.0 arrayand WES with the Agilent Sureselect All Exons V4 Kit on 110unrelated individuals (58 male and 52 female subjects) originatingfrom six regions of the world, including North Africa (27 subjects)and the Middle East (16 subjects) (Table 1). After the applicationof quality control (QC) filters (Methods), 810,914 high-quality(HQ) GWSA SNVs and 249,310 HQWES SNVs were retained forour analyses (Fig. S1). In total, 10,598 of these SNVs, with a callrate (CR) of 100%, were common to both WES and GWSA. Wechecked the genotype matching rate of these common variantsbetweenWES and GWSA with the PLINK Identity by State matrix(39). The mean Identity by State genotype matching rate betweenWES and GWSA was 99.37% (SD = 1.02%), a value similar tothat reported in previous studies (40).We first conducted PCA using 375 unrelated individuals from
five world regions as the reference (Table S1). Data for theseindividuals were present in both the HapMap Project (HapMaprelease 3) (41) and the most recent 1000 Genomes Project phase3 (42) database available since May of 2013. We merged ourGWSA data with the HapMap data, such that all of the 810,914HQ SNVs of our sample were present in the HapMap dataset.The resulting merged database was then used for PCA. Wefound that 183,065 (73.4%) of the 249,310 HQ SNVs detected inour 110 WES samples were present in the SNVs included in the1000 Genomes Project phase 3 (Fig. S1). The difference in thenumber of variants in our WES data and the 1000 GenomesProject reflects the enrichment of our WES data in rare variants.We first conducted PCA on the HapMap/GWSA data (Fig. 1).Consistent with their geographic origin, the North African indi-viduals mapped between the European and African clusters,whereas the Middle Eastern individuals mapped between theEuropean and Asian clusters (Fig. 1). Like subjects from theMiddle East, Central and South Americans were located be-tween the European and Asian clusters for the first two principalcomponents (PCs). However, the South American and MiddleEastern subjects were separated by the third PC.We then performed a more formal comparison of PCA between
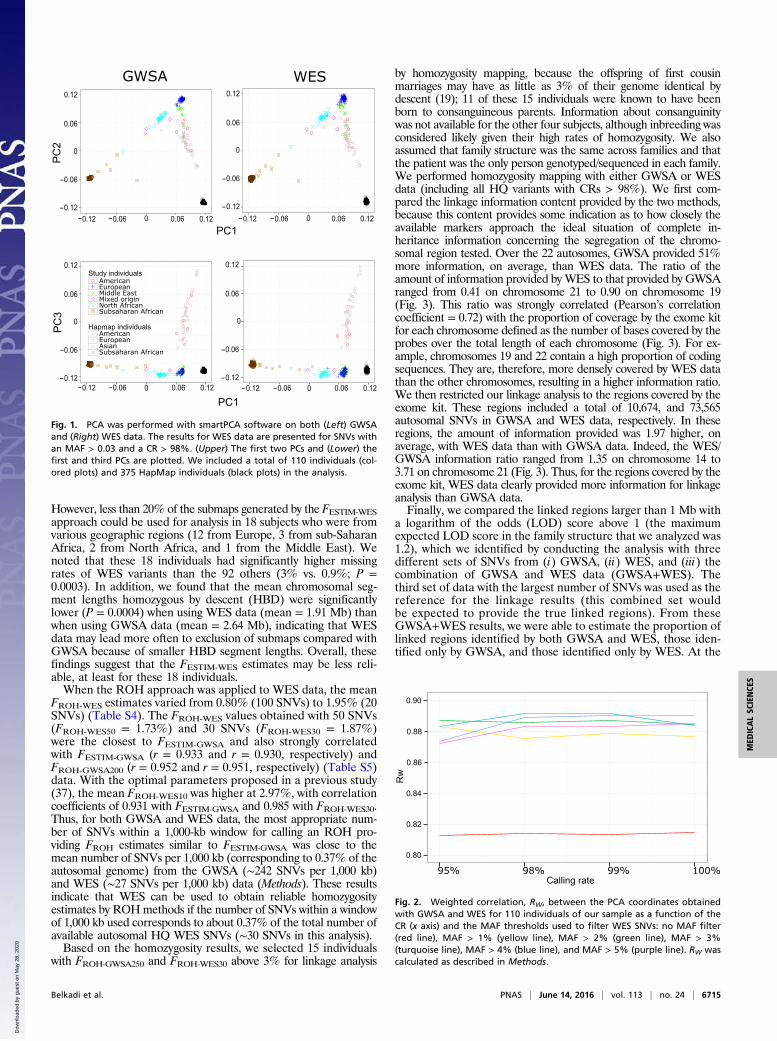
the GWSA/HapMap data used as a gold standard and the WES/1000 Genomes Project data using the RW correlation coefficientweighted by the eigenvalues of the significant PCs (Methods). Weconsidered different CRs (range = 95–100%) and different minorallele frequency (MAF) thresholds (range = 0–5%) for the WESSNVs, because higher CRs and MAFs would be expected to in-crease variant quality while decreasing the number of variants(range = 39,391–183,013) (Table S2). The RW correlation co-efficient was calculated for the 14 PCs significant at P < 0.05 (TableS3). Correlations were particularly strong (RW > 0.98) for the fourfirst PCs, which accounted for >85% of the scaled eigenvalues inboth GWSA and WES (Table S3). Overall, we found strong cor-relations (range = 0.813–0.892) between the PCA coordinatesobtained by GWSA and WES for our 110 subjects for all combi-nations of CR and MAF (Fig. 2). The exclusion of rare variants(MAF < 2%) from the PCA clearly decreased the number ofvariants but increased the strength of the correlation. The strongestcorrelations were observed with WES variants with an MAF > 2%,and for MAF values in this range, CR had very little influence. Thepanel of WES variants with an MAF > 3% and a CR > 98%provided the highest RW value at 0.892, corresponding to 85,112variants in total, whereas the corresponding value was 183,013 inthe largest panel (Table S2). The results of PCA with this panel of85,112 SNVs are shown in Fig. 1, in which the distribution of
population structures is very similar to that derived from theGWSA/HapMap data.Next, we considered the prediction of coordinates for a single
individual from WES data and a sample of publicly available data.Based on our previous findings, we used variants with an MAF >3% and a CR > 98% when WES data for this single individual weremerged with the 1000 Genomes Project data. Predictions were madeindependently for each of our 110 individuals, and the RW correla-tion coefficient for the whole sample was again very strong at 0.844(0.841 when MAF was >2% and CR was >98%). Interestingly, thiscorrelation was also very strong when we considered only ethnicgroups not represented in the reference panels of the HapMapProject and the 1000 Genomes Project, such as 16 individuals fromthe Middle East (RW = 0.853), 27 individuals from North Africa(RW = 0.829), and 3 subjects of mixed origin (RW = 0.949). All ofthese results indicate that WES data based on common variants areappropriate for use in population structure analyses and inferringthe ethnic ancestry of an individual. Finally, we compared the per-formance of WES and GWSA in terms of local ancestry inferenceusing Hapmix (43), which can consider two ancestral populations(Methods). The correlation between the proportions of ancestryobtained by GWSA or WES data in our 110 individuals was high,varying from 0.84 to 0.99 (Fig. S2) according to the two ancestralpopulations considered among the four HapMap/1000 Genomespopulations European (CEU), Han Chinese (CHB), YorubaNigerian (YRI), and Mexican (MEX). An example for the analysisusing CEU and YRI as ancestral populations is shown in Fig. S2.These high correlations are consistent with our PCA results, furtherindicating that WES data could be used to infer local ancestry.We then estimated homozygosity rates by calculating the in-
breeding coefficient F by two approaches: one based on the searchfor runs of homozygosity (ROHs) over a given length of the ge-nome (20) and the other based on the use of Markov processes tomodel homozygous states throughout the genome by the FEstimmethod (19). We identified ROHs with PLINK (39), in which asliding window of 1,000 kb is passed across the genome, withhomozygosity determined at each window. We considered differ-ent numbers of SNVs within the sliding window (Methods). WithGWSA data, the mean homozygosity of our sample, estimatedby FEstim (FESTIM-GWSA), was 1.64% (SD = 3.44%; range =0–15.50%) (Table S4). As expected, with the ROH approach,the mean homozygosity (FROH-GWSA) increased as the num-ber of SNVs included in the window decreased from 1.34%(300 SNVs) to 2.27% (100 SNVs). The FROH-GWSA values ob-tained with 200 SNVs (FROH-GWSA200 = 1.67%) and 250 SNVs(FROH-GWSA250 = 1.47%) were the closest to FESTIM-GWSA,which could be considered the reference estimate (44). Theywere also strongly correlated with the FESTIM-GWSA estimates(r = 0.973 and r = 0.975, respectively). With WES data, theestimated FESTIM value was higher than that obtained withGWSA data at 2.53% (SD = 5.23%; range = 0–22.50%), and thecoefficient of correlation with the FESTIM-GWSA estimates was 0.889.
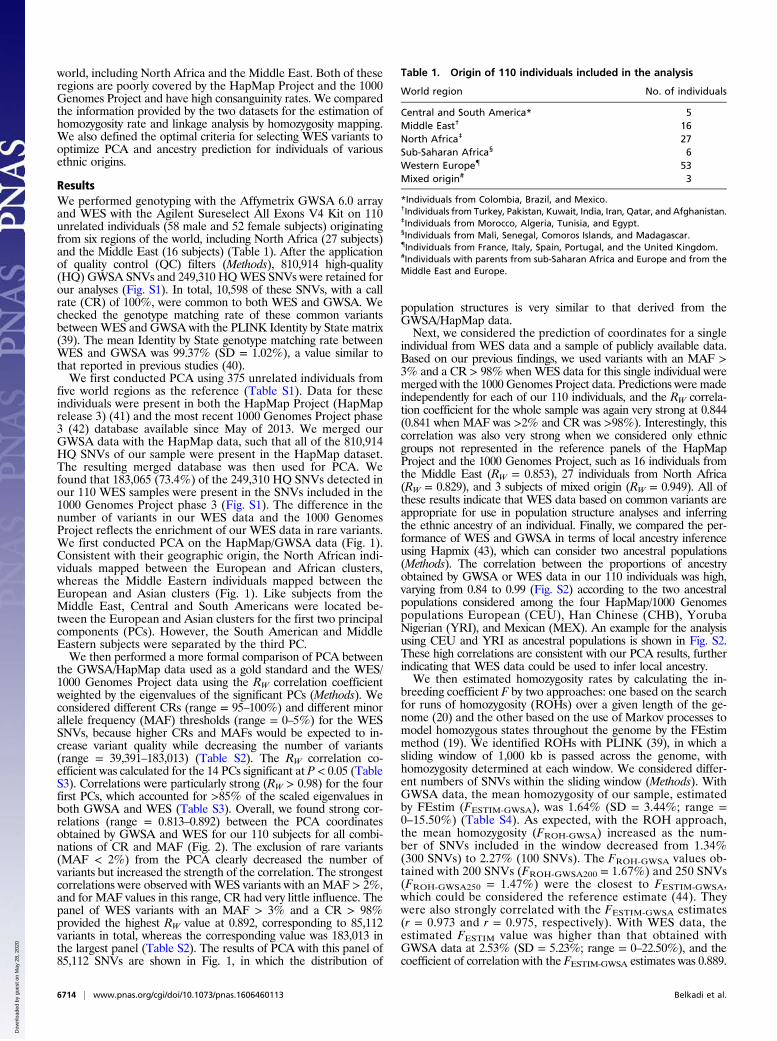
Table 1. Origin of 110 individuals included in the analysis
World region No. of individuals
Central and South America* 5Middle East† 16North Africa‡ 27Sub-Saharan Africa§ 6Western Europe{ 53Mixed origin# 3
*Individuals from Colombia, Brazil, and Mexico.†Individuals from Turkey, Pakistan, Kuwait, India, Iran, Qatar, and Afghanistan.‡Individuals from Morocco, Algeria, Tunisia, and Egypt.§Individuals from Mali, Senegal, Comoros Islands, and Madagascar.{Individuals from France, Italy, Spain, Portugal, and the United Kingdom.#Individuals with parents from sub-Saharan Africa and Europe and from theMiddle East and Europe.
6714 | www.pnas.org/cgi/doi/10.1073/pnas.1606460113 Belkadi et al.
Dow
nloa
ded
by g
uest
on
May
28,
202
0
However, less than 20% of the submaps generated by the FESTIM-WESapproach could be used for analysis in 18 subjects who were fromvarious geographic regions (12 from Europe, 3 from sub-SaharanAfrica, 2 from North Africa, and 1 from the Middle East). Wenoted that these 18 individuals had significantly higher missingrates of WES variants than the 92 others (3% vs. 0.9%; P =0.0003). In addition, we found that the mean chromosomal seg-ment lengths homozygous by descent (HBD) were significantlylower (P = 0.0004) when using WES data (mean = 1.91 Mb) thanwhen using GWSA data (mean = 2.64 Mb), indicating that WESdata may lead more often to exclusion of submaps compared withGWSA because of smaller HBD segment lengths. Overall, thesefindings suggest that the FESTIM-WES estimates may be less reli-able, at least for these 18 individuals.When the ROH approach was applied to WES data, the mean
FROH-WES estimates varied from 0.80% (100 SNVs) to 1.95% (20SNVs) (Table S4). The FROH-WES values obtained with 50 SNVs(FROH-WES50 = 1.73%) and 30 SNVs (FROH-WES30 = 1.87%)were the closest to FESTIM-GWSA and also strongly correlatedwith FESTIM-GWSA (r = 0.933 and r = 0.930, respectively) andFROH-GWSA200 (r = 0.952 and r = 0.951, respectively) (Table S5)data. With the optimal parameters proposed in a previous study(37), the mean FROH-WES10 was higher at 2.97%, with correlationcoefficients of 0.931 with FESTIM-GWSA and 0.985 with FROH-WES30.Thus, for both GWSA and WES data, the most appropriate num-ber of SNVs within a 1,000-kb window for calling an ROH pro-viding FROH estimates similar to FESTIM-GWSA was close to themean number of SNVs per 1,000 kb (corresponding to 0.37% of theautosomal genome) from the GWSA (∼242 SNVs per 1,000 kb)and WES (∼27 SNVs per 1,000 kb) data (Methods). These resultsindicate that WES can be used to obtain reliable homozygosityestimates by ROHmethods if the number of SNVs within a windowof 1,000 kb used corresponds to about 0.37% of the total number ofavailable autosomal HQ WES SNVs (∼30 SNVs in this analysis).Based on the homozygosity results, we selected 15 individuals
with FROH-GWSA250 and FROH-WES30 above 3% for linkage analysis
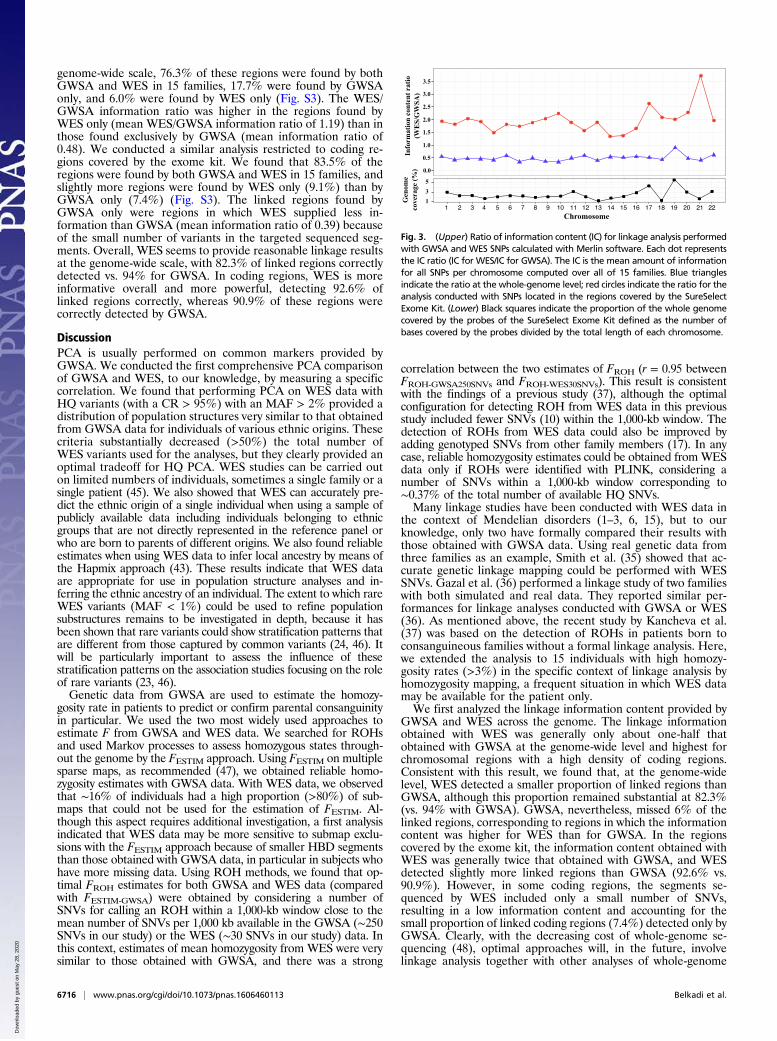
by homozygosity mapping, because the offspring of first cousinmarriages may have as little as 3% of their genome identical bydescent (19); 11 of these 15 individuals were known to have beenborn to consanguineous parents. Information about consanguinitywas not available for the other four subjects, although inbreeding wasconsidered likely given their high rates of homozygosity. We alsoassumed that family structure was the same across families and thatthe patient was the only person genotyped/sequenced in each family.We performed homozygosity mapping with either GWSA or WESdata (including all HQ variants with CRs > 98%). We first com-pared the linkage information content provided by the two methods,because this content provides some indication as to how closely theavailable markers approach the ideal situation of complete in-heritance information concerning the segregation of the chromo-somal region tested. Over the 22 autosomes, GWSA provided 51%more information, on average, than WES data. The ratio of theamount of information provided byWES to that provided by GWSAranged from 0.41 on chromosome 21 to 0.90 on chromosome 19(Fig. 3). This ratio was strongly correlated (Pearson’s correlationcoefficient = 0.72) with the proportion of coverage by the exome kitfor each chromosome defined as the number of bases covered by theprobes over the total length of each chromosome (Fig. 3). For ex-ample, chromosomes 19 and 22 contain a high proportion of codingsequences. They are, therefore, more densely covered by WES datathan the other chromosomes, resulting in a higher information ratio.We then restricted our linkage analysis to the regions covered by theexome kit. These regions included a total of 10,674, and 73,565autosomal SNVs in GWSA and WES data, respectively. In theseregions, the amount of information provided was 1.97 higher, onaverage, with WES data than with GWSA data. Indeed, the WES/GWSA information ratio ranged from 1.35 on chromosome 14 to3.71 on chromosome 21 (Fig. 3). Thus, for the regions covered by theexome kit, WES data clearly provided more information for linkageanalysis than GWSA data.Finally, we compared the linked regions larger than 1 Mb with
a logarithm of the odds (LOD) score above 1 (the maximumexpected LOD score in the family structure that we analyzed was1.2), which we identified by conducting the analysis with threedifferent sets of SNVs from (i) GWSA, (ii) WES, and (iii) thecombination of GWSA and WES data (GWSA+WES). Thethird set of data with the largest number of SNVs was used as thereference for the linkage results (this combined set wouldbe expected to provide the true linked regions). From theseGWSA+WES results, we were able to estimate the proportion oflinked regions identified by both GWSA and WES, those iden-tified only by GWSA, and those identified only by WES. At the
0.80
0.82
0.84
0.86
0.88
0.90
95% 98% 99% 100%Calling rate
Rw
Fig. 2. Weighted correlation, RW, between the PCA coordinates obtainedwith GWSA and WES for 110 individuals of our sample as a function of theCR (x axis) and the MAF thresholds used to filter WES SNVs: no MAF filter(red line), MAF > 1% (yellow line), MAF > 2% (green line), MAF > 3%(turquoise line), MAF > 4% (blue line), and MAF > 5% (purple line). RW wascalculated as described in Methods.
−0.12 −0.06 0 0.06 0.12
−0.12 −0.06 0 0.06 0.12−0.12 −0.06 0 0.06 0.12
−0.12 −0.06 0 0.06 0.12−0.12
−0.06
0
0.06
0.12
−0.12
−0.06
0
0.06
0.12
−0.12
−0.06
0
0.06
0.12
−0.12
−0.06
0
0.06
0.12
PC
2P
C3
PC1
PC1
GWSA WES
AmericanEuropeanMiddle EastMixed originNorth AfricanSubsaharan African
AmericanEuropeanAsianSubsaharan African
Study individuals
Hapmap individuals
Fig. 1. PCA was performed with smartPCA software on both (Left) GWSAand (Right) WES data. The results for WES data are presented for SNVs withan MAF > 0.03 and a CR > 98%. (Upper) The first two PCs and (Lower) thefirst and third PCs are plotted. We included a total of 110 individuals (col-ored plots) and 375 HapMap individuals (black plots) in the analysis.
Belkadi et al. PNAS | June 14, 2016 | vol. 113 | no. 24 | 6715
MED
ICALSC
IENCE
S
Dow
nloa
ded
by g
uest
on
May
28,
202
0
genome-wide scale, 76.3% of these regions were found by bothGWSA and WES in 15 families, 17.7% were found by GWSAonly, and 6.0% were found by WES only (Fig. S3). The WES/GWSA information ratio was higher in the regions found byWES only (mean WES/GWSA information ratio of 1.19) than inthose found exclusively by GWSA (mean information ratio of0.48). We conducted a similar analysis restricted to coding re-gions covered by the exome kit. We found that 83.5% of theregions were found by both GWSA and WES in 15 families, andslightly more regions were found by WES only (9.1%) than byGWSA only (7.4%) (Fig. S3). The linked regions found byGWSA only were regions in which WES supplied less in-formation than GWSA (mean information ratio of 0.39) becauseof the small number of variants in the targeted sequenced seg-ments. Overall, WES seems to provide reasonable linkage resultsat the genome-wide scale, with 82.3% of linked regions correctlydetected vs. 94% for GWSA. In coding regions, WES is moreinformative overall and more powerful, detecting 92.6% oflinked regions correctly, whereas 90.9% of these regions werecorrectly detected by GWSA.
DiscussionPCA is usually performed on common markers provided byGWSA. We conducted the first comprehensive PCA comparisonof GWSA and WES, to our knowledge, by measuring a specificcorrelation. We found that performing PCA on WES data withHQ variants (with a CR > 95%) with an MAF > 2% provided adistribution of population structures very similar to that obtainedfrom GWSA data for individuals of various ethnic origins. Thesecriteria substantially decreased (>50%) the total number ofWES variants used for the analyses, but they clearly provided anoptimal tradeoff for HQ PCA. WES studies can be carried outon limited numbers of individuals, sometimes a single family or asingle patient (45). We also showed that WES can accurately pre-dict the ethnic origin of a single individual when using a sample ofpublicly available data including individuals belonging to ethnicgroups that are not directly represented in the reference panel orwho are born to parents of different origins. We also found reliableestimates when using WES data to infer local ancestry by means ofthe Hapmix approach (43). These results indicate that WES dataare appropriate for use in population structure analyses and in-ferring the ethnic ancestry of an individual. The extent to which rareWES variants (MAF < 1%) could be used to refine populationsubstructures remains to be investigated in depth, because it hasbeen shown that rare variants could show stratification patterns thatare different from those captured by common variants (24, 46). Itwill be particularly important to assess the influence of thesestratification patterns on the association studies focusing on the roleof rare variants (23, 46).Genetic data from GWSA are used to estimate the homozy-
gosity rate in patients to predict or confirm parental consanguinityin particular. We used the two most widely used approaches toestimate F from GWSA and WES data. We searched for ROHsand used Markov processes to assess homozygous states through-out the genome by the FESTIM approach. Using FESTIM on multiplesparse maps, as recommended (47), we obtained reliable homo-zygosity estimates with GWSA data. With WES data, we observedthat ∼16% of individuals had a high proportion (>80%) of sub-maps that could not be used for the estimation of FESTIM. Al-though this aspect requires additional investigation, a first analysisindicated that WES data may be more sensitive to submap exclu-sions with the FESTIM approach because of smaller HBD segmentsthan those obtained with GWSA data, in particular in subjects whohave more missing data. Using ROH methods, we found that op-timal FROH estimates for both GWSA and WES data (comparedwith FESTIM-GWSA) were obtained by considering a number ofSNVs for calling an ROH within a 1,000-kb window close to themean number of SNVs per 1,000 kb available in the GWSA (∼250SNVs in our study) or the WES (∼30 SNVs in our study) data. Inthis context, estimates of mean homozygosity from WES were verysimilar to those obtained with GWSA, and there was a strong
correlation between the two estimates of FROH (r = 0.95 betweenFROH-GWSA250SNVs and FROH-WES30SNVs). This result is consistentwith the findings of a previous study (37), although the optimalconfiguration for detecting ROH from WES data in this previousstudy included fewer SNVs (10) within the 1,000-kb window. Thedetection of ROHs from WES data could also be improved byadding genotyped SNVs from other family members (17). In anycase, reliable homozygosity estimates could be obtained fromWESdata only if ROHs were identified with PLINK, considering anumber of SNVs within a 1,000-kb window corresponding to∼0.37% of the total number of available HQ SNVs.Many linkage studies have been conducted with WES data in
the context of Mendelian disorders (1–3, 6, 15), but to ourknowledge, only two have formally compared their results withthose obtained with GWSA data. Using real genetic data fromthree families as an example, Smith et al. (35) showed that ac-curate genetic linkage mapping could be performed with WESSNVs. Gazal et al. (36) performed a linkage study of two familieswith both simulated and real data. They reported similar per-formances for linkage analyses conducted with GWSA or WES(36). As mentioned above, the recent study by Kancheva et al.(37) was based on the detection of ROHs in patients born toconsanguineous families without a formal linkage analysis. Here,we extended the analysis to 15 individuals with high homozy-gosity rates (>3%) in the specific context of linkage analysis byhomozygosity mapping, a frequent situation in which WES datamay be available for the patient only.We first analyzed the linkage information content provided by
GWSA and WES across the genome. The linkage informationobtained with WES was generally only about one-half thatobtained with GWSA at the genome-wide level and highest forchromosomal regions with a high density of coding regions.Consistent with this result, we found that, at the genome-widelevel, WES detected a smaller proportion of linked regions thanGWSA, although this proportion remained substantial at 82.3%(vs. 94% with GWSA). GWSA, nevertheless, missed 6% of thelinked regions, corresponding to regions in which the informationcontent was higher for WES than for GWSA. In the regionscovered by the exome kit, the information content obtained withWES was generally twice that obtained with GWSA, and WESdetected slightly more linked regions than GWSA (92.6% vs.90.9%). However, in some coding regions, the segments se-quenced by WES included only a small number of SNVs,resulting in a low information content and accounting for thesmall proportion of linked coding regions (7.4%) detected only byGWSA. Clearly, with the decreasing cost of whole-genome se-quencing (48), optimal approaches will, in the future, involvelinkage analysis together with other analyses of whole-genome
Chromosome
Info
rmat
ion
cont
ent r
atio
(W
ES/
GW
SA)
Gen
ome
cove
rage
(%)
0.5
1.0
1.5
2.0
2.5
3.0
3.5
0.0
135
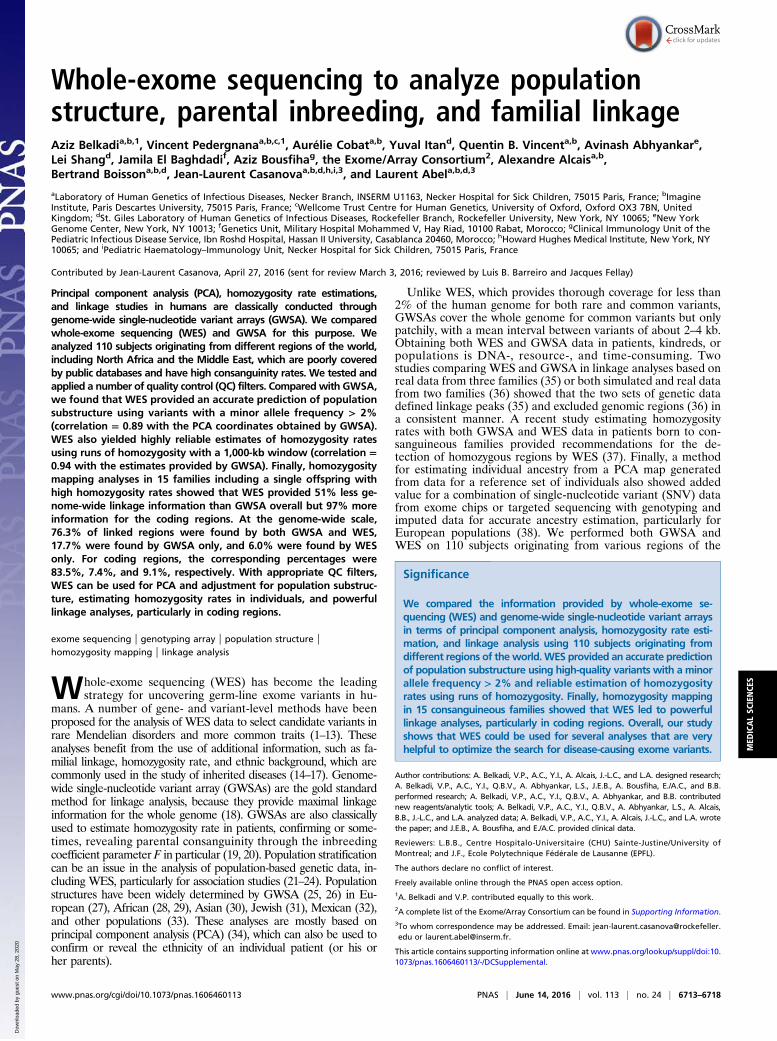
Fig. 3. (Upper) Ratio of information content (IC) for linkage analysis performedwith GWSA and WES SNPs calculated with Merlin software. Each dot representsthe IC ratio (IC for WES/IC for GWSA). The IC is the mean amount of informationfor all SNPs per chromosome computed over all of 15 families. Blue trianglesindicate the ratio at the whole-genome level; red circles indicate the ratio for theanalysis conducted with SNPs located in the regions covered by the SureSelectExome Kit. (Lower) Black squares indicate the proportion of the whole genomecovered by the probes of the SureSelect Exome Kit defined as the number ofbases covered by the probes divided by the total length of each chromosome.
6716 | www.pnas.org/cgi/doi/10.1073/pnas.1606460113 Belkadi et al.
Dow
nloa
ded
by g
uest
on
May
28,
202
0
sequencing data (49). However, it is currently possible to useWES data for PCA after the application of the appropriate QCfilters and adjustment for population substructure to estimatehomozygosity rates by ROH and perform reliable linkage analy-ses, particularly for coding regions.
MethodsStudy Subjects. The individuals used in the analysis were selected fromsamples ascertained by our laboratory and recruitedwith the collaboration ofmany clinicians. They presented a variety of severe infectious diseases and/orprimary immunodeficiencies. Although these individuals do not form arandom sample, they were ascertained through a number of distinct phe-notypes and in different countries. Cohort-specific effects are, therefore, notexpected to bias patterns of variation. Among these patients, we studied only110 individuals who had bothWES by Agilent Sureselect All Exons V4 (50 Mb)Single-Sample Capture and genotyping by the Affymetrix Genome-Wide SNV6.0 Array. The retained 110 subjects studied (58 male and 52 female patients)originated from different regions of the world (Table 1). Written consent wasobtained from all subjects included in this study, which was overseen by theComité de Protection des Personnes (Institutional Review Board) Ile deFrance 2 (Institutional Review Board no. 00001072).
WES.WES was performed on an Illumina HiSeq 2000 by Agilent Sureselect AllExons V4 (50 Mb) Single-Sample Capture at the Rockefeller core facilities andthe New York Genome Center. Sequencing was performed with 2 × 100 bppaired end reads, and we pooled five samples per lane. We used the Ge-nome Analysis Software Kit (GATK) best practice pipeline to analyze ourWES data (50). Reads were aligned with the human reference genome(hg19) with the Maximum Exact Matches algorithm in Burrows–WheelerAligner (51). Local realignment around indels was performed with the GATK(52). PCR duplicates were removed with Picard tools (broadinstitute.github.io/picard/). The GATK base quality score recalibrator was applied to correctsequencing artifacts. Individual genomic variant call files were generatedwith the GATK HaplotypeCaller, and joint genotyping was performedwith the GATK Genotype genomic variant call files. The calling process tar-geted regions covered by the WES 50-Mb Kit, including 200 bp flankingeach region.
All variants with a Phred-scaled SNV quality ≤ 30 were filtered out. Wethen used the GATK Variant Quality Score Recalibrator (50) on the combinedvariant call file for 110 samples. We retained 1,213,952 SNVs that passed theVariant Quality Score (VQS) Recalibrator filter (VQS log-odds > −0.682). Wefiltered out sample genotypes with a coverage < 8×, a genotype quality <20, or a ratio of reads for the less covered allele (reference or variant allele)over the total number of reads covering the position at which the variantwas called in the heterozygous genotypes of <20% using an in-house script.Finally, we excluded from the analysis 704,954 variants, for which more than10% of the genotypes were missing. A set of 249,310 HQ variants wasretained for the analysis (Fig. S1).
GWSA. In total, 110 individuals were genotypedwith the Affymetrix Genome-Wide SNV 6.0 Array. Genotype calling was achieved with Affymetrix PowerTools (www.affymetrix.com/estore) for all individuals. In total, 909,622 rawSNVs were detected. We applied QC criteria similar to those used in Hapmaprelease 3 (41) by removing SNVs with a CR < 95% and a P value in Fisher’sexact test for Hardy–Weinberg equilibrium on 53 European individuals of<10−6. In total, 810,914 HQ SNVs passed this Hapmap filter and wereretained for analysis.
PCA and Local Ancestry Inference. PCA was carried out with the smartPCAprogram (53). We initially included 375 unrelated individuals from five re-gions of the world (Table S1) present in both the 1000 Genomes Project andthe Hapmap (Hapmap release 3) Project. We used the data from the Affy-metrix 6.0 array and the 1000 Genomes Project for these 375 individuals as areference for our PCA with GWSA and WES data, respectively. We furtherconsidered four different CRs for WES SNVs (95%, 98%, 99%, and 100%)and different MAF thresholds for WES variants (0.01, 0.02, 0.03, 0.04, and0.05), because these parameters may affect the results of the PCA (54).
We compared PCAs on GWSA and WES data using our whole sample of 110individuals by calculating the weighted correlation, RW, between the coordi-nates of our individuals obtained with GWSA or WES data. These correlationswere summed over the M significant PCs and weighted by the mean eigen-values of the corresponding GWSA and WES components as follows:
RW =XM
j=0
�PWESj + PGWSAj
�
2 corPearson
�WESj , GWSAj
�,
where PWESj and PGWSAj are the normalized eigenvalues of the PC j in theanalysis of WES and GWSA data, respectively; WESj and GWSAj are thevectors of the coordinates for PC j in our 110 individuals obtained in PCA onWES and GWSA data, respectively; M is the number of significant PCs(P value < 0.05) obtained with unsupervised Tracy–Widom statistics (TableS3); and the RW correlation coefficient was calculated for each of 25 com-binations of CRs and MAF shown in Table S2.
The local ancestry for 110 study individuals was inferred by Hapmix (43).Because Hapmix assumes two ancestral populations, we ran the softwarefor six sets of two ancestral populations from four HapMap/1000 GenomesProjects: CEU and YRI, CEU and CHB, CEU and MEX, YRI and CHB, YRI andMEX, and CHB and MEX. Because the MEX population included only44 independent individuals with both HapMap and 1000 Genomes data,we also used a set of 44 independent individuals for three other ancestralpopulations. The correlation between the proportions of ancestryestimated in our 110 individuals using the GWSA or the WES data wascomputed over the whole autosomal genome for each of six sets ofancestral populations.
Estimation of Homozygosity. Several approaches have been proposed forestimating the inbreeding coefficient F from genetic data (20). Chromosomalregions that are HBD can be identified by searching for ROHs over a givenlength, providing an estimate of F based on the proportion of the autosomalgenome in ROHs (20). For these analyses, we used the HQ autosomal SNVswith an MAF > 0.05 (654,155) identified by GWSA and 73,565 SNVs with aCR > 98% and an MAF > 0.05 identified by WES. We identified ROHs withPLINK (39), which has several advantages over other methods (37). We used theclassical PLINK method with default parameters, in which a 1,000-kb window ismoved across the genome, with homozygosity determined for each window.Wevaried the number of SNVs within the 1,000-kb window required to call an ROHusing a smaller number for WES (20, 30, 50, and 100) than for GWSA (100, 200,250, and 300) to account for the lower total autosomal SNV counts in WES thanin GWSA data (37). The choice of these numbers was based on the fact that awindow of 1,000 kb corresponds to ∼0.37% of the autosomal genome, givingmean numbers of available SNVs per 1,000 kb of ∼27 for WES data and ∼242 forGWSA data. We also considered the PLINK parameters reported to be optimal ina recent study (37) for the analysis of the WES data. These parameters included10 SNVs within the 1,000-kb window. We obtained a genomic measurement ofindividual homozygosity (FROH) by determining the proportion of the autosomalgenome present in ROHs (20).
Another approach for estimating F involves modeling the HBD states of thedifferent markers of one individual along the genome as a Markov processusing hiddenMarkov models as initially proposed in the FESTIM method (19). Thismethod assumes that marker alleles are independent conditionally on HBDstate, which is not true for dense SNVs (in array or exome data), for whichlinkage disequilibrium (LD) may occur. We used the FEstim_SUBS method tominimize LD between SNVs as recommended in a previous study (44) for therandom extraction of sparse markers every 0.5 cM to create 1,000 submaps. Thisstrategy does not require the estimation of LD scores for the data, and F isestimated by calculating the median value of the estimates obtained from thedifferent maps. The FSuite program was used to calculate FESTIM for each in-dividual from both GWSA and WES data (47).
Linkage Analysis. We performed linkage analysis assuming autosomal recessiveinheritance with complete penetrance (homozygosity mapping) on individualsfound to have a high rate of homozygosity. For each individual, we created thesame family structurebasedonauniqueconsanguinity loopat the first cousin level.The main goal of our study was to compare the linkage information provided byWES with that provided by GWSA using the same familial structure and the samedata for all families, consisting of nine individuals with a single genotyped subjectassumed to be affected (the offspring of the youngest generation).We carried outparametric multipoint linkage analysis by homozygosity mapping (55) with Merlinsoftware (56). A population disease allele frequency of 0.0001 was specified to-gether with a fully penetrant recessive genetic model. LOD scores were calculatedfor every marker (from WES or GWSA data), and 1000 Genomes Project allelefrequencies were used (42). Information content was also estimated for bothWESand GWSA data, because this parameter provides an indication of how closelythe available markers approach the ideal situation of complete inheritance in-formation for the segregation of the chromosomal region considered.
Belkadi et al. PNAS | June 14, 2016 | vol. 113 | no. 24 | 6717
MED
ICALSC
IENCE
S
Dow
nloa
ded
by g
uest
on
May
28,
202
0
ACKNOWLEDGMENTS. We thank all Exome/Array Consortium members forcontributing to the collection of samples: Waleed Al-Herz, Cigdem Arikan,Peter Arkwright, Cigdem Aydogmus, Olivier Bernard, Lizbeth Blancas-Galicia,Stéphanie Boisson-Dupuis, Damien Bonnet, Omar Boudghene Stambouli, LobnaBoussafara, Jeannette Boutros, Jacinta Bustamante, Michael Ciancanelli,Theresa Cole, Antonio Condino-Neto, Mukesh Desai, Claire Fieschi, JoséLuis Franco, Philippe Ichai, Emmanuelle Jouanguy, Melike Keser-Emiroglu,Sara S. Kilic, Seyed Alireza Mahdaviani, Nizar Malhaoui, Davood Mansouri,Nima Parvaneh, Capucine Picard, Anne Puel, Didier Raoult, Nima Rezaei,
Ozden Sanal, Silvia Sanchez Ramon, François Vandenesch, Guillaume Vogt,and Shen-Ying Zhang (Supporting Information). We also thank LahouariAmar and Yelena Nemirovskaya for their invaluable help. The Laboratoryof Human Genetics of Infectious Diseases is supported by European ResearchCouncil Grant ERC-2010-AdG-268777, the French National Research Agencyunder the “Investments for the Future” Program Grant ANR-10-IAHU-01,National Institute of Allergy and Infectious Diseases Grant 5U01AI088685,and grants from INSERM, Paris Descartes University, the St. Giles Foundation,and the Rockefeller University.
1. Ng SB, et al. (2010) Exome sequencing identifies the cause of a Mendelian disorder.Nat Genet 42(1):30–35.
2. Bolze A, et al. (2010) Whole-exome-sequencing-based discovery of human FADDdeficiency. Am J Hum Genet 87(6):873–881.
3. Bamshad MJ, et al. (2011) Exome sequencing as a tool for Mendelian disease genediscovery. Nat Rev Genet 12(11):745–755.
4. Kiezun A, et al. (2012) Exome sequencing and the genetic basis of complex traits. NatGenet 44(6):623–630.
5. Tennessen JA, et al.; Broad GO; Seattle GO; NHLBI Exome Sequencing Project (2012)Evolution and functional impact of rare coding variation from deep sequencing ofhuman exomes. Science 337(6090):64–69.
6. Bolze A, et al. (2013) Ribosomal protein SA haploinsufficiency in humans with isolatedcongenital asplenia. Science 340(6135):976–978.
7. Chakravarti A, Clark AG, Mootha VK (2013) Distilling pathophysiology from complexdisease genetics. Cell 155(1):21–26.
8. Itan Y, et al. (2013) The human gene connectome as a map of short cuts for morbidallele discovery. Proc Natl Acad Sci USA 110(14):5558–5563.
9. Rausell A, et al. (2014) Analysis of stop-gain and frameshift variants in human innateimmunity genes. PLOS Comput Biol 10(7):e1003757.
10. Cirulli ET, et al.; FALS Sequencing Consortium (2015) Exome sequencing in amyotrophiclateral sclerosis identifies risk genes and pathways. Science 347(6229):1436–1441.
11. Itan Y, et al. (2015) The human gene damage index as a gene-level approach toprioritizing exome variants. Proc Natl Acad Sci USA 112(44):13615–13620.
12. Itan Y, Casanova J-L (2015) Can the impact of human genetic variations be predicted?Proc Natl Acad Sci USA 112(37):11426–11427.
13. Itan Y, et al. (2016) The mutation significance cutoff: Gene-level thresholds for variantpredictions. Nat Methods 13(2):109–110.
14. Boisson B, et al. (2013) An ACT1 mutation selectively abolishes interleukin-17 re-sponses in humans with chronic mucocutaneous candidiasis. Immunity 39(4):676–686.
15. Byun M, et al. (2013) Inherited human OX40 deficiency underlying classic Kaposisarcoma of childhood. J Exp Med 210(9):1743–1759.
16. Carr IM, et al. (2013) Autozygosity mapping with exome sequence data. Hum Mutat34(1):50–56.
17. Santoni FA, Makrythanasis P, Antonarakis SE (2015) CATCHing putative causativevariants in consanguineous families. BMC Bioinformatics 16:310.
18. Goddard KAB, Wijsman EM (2002) Characteristics of genetic markers and maps forcost-effective genome screens using diallelic markers. Genet Epidemiol 22(3):205–220.
19. Leutenegger A-L, et al. (2003) Estimation of the inbreeding coefficient through use ofgenomic data. Am J Hum Genet 73(3):516–523.
20. McQuillan R, et al. (2008) Runs of homozygosity in European populations. Am J HumGenet 83(3):359–372.
21. Pritchard JK, Donnelly P (2001) Case-control studies of association in structured oradmixed populations. Theor Popul Biol 60(3):227–237.
22. Moore CB, et al. (2013) Low frequency variants, collapsed based on biologicalknowledge, uncover complexity of population stratification in 1000 genomes projectdata. PLoS Genet 9(12):e1003959.
23. Zawistowski M, et al. (2014) Analysis of rare variant population structure in Europeansexplains differential stratification of gene-based tests. Eur J Hum Genet 22(9):1137–1144.
24. O’Connor TD, et al.; NHLBI GO Exome Sequencing Project; ESP Population Geneticsand Statistical Analysis Working Group, Emily Turner (2015) Rare variation facilitatesinferences of fine-scale population structure in humans. Mol Biol Evol 32(3):653–660.
25. Pickrell JK, Pritchard JK (2012) Inference of population splits and mixtures from ge-nome-wide allele frequency data. PLoS Genet 8(11):e1002967.
26. Raj A, Stephens M, Pritchard JK (2014) fastSTRUCTURE: Variational inference ofpopulation structure in large SNP data sets. Genetics 197(2):573–589.
27. Novembre J, et al. (2008) Genes mirror geography within Europe. Nature 456(7218):98–101.28. Bryc K, et al. (2010) Genome-wide patterns of population structure and admixture in
West Africans and African Americans. Proc Natl Acad Sci USA 107(2):786–791.29. Pickrell JK, et al. (2014) Ancient west Eurasian ancestry in southern and eastern Africa.
Proc Natl Acad Sci USA 111(7):2632–2637.
30. Abdulla MA, et al.; HUGO Pan-Asian SNP Consortium; Indian Genome Variation Con-sortium (2009) Mapping human genetic diversity in Asia. Science 326(5959):1541–1545.
31. Behar DM, et al. (2010) The genome-wide structure of the Jewish people. Nature466(7303):238–242.
32. Moreno-Estrada A, et al. (2014) Human genetics. The genetics of Mexico recapitulatesNative American substructure and affects biomedical traits. Science 344(6189):1280–1285.
33. Li JZ, et al. (2008) Worldwide human relationships inferred from genome-wide pat-terns of variation. Science 319(5866):1100–1104.
34. Patterson N, Price AL, Reich D (2006) Population structure and eigenanalysis. PLoSGenet 2(12):e190.
35. Smith KR, et al. (2011) Reducing the exome search space for mendelian diseases usinggenetic linkage analysis of exome genotypes. Genome Biol 12(9):R85.
36. Gazal S, et al. (2016) Can whole-exome sequencing data be used for linkage analysis?Eur J Hum Genet 24(4):581–586.
37. Kancheva D, et al. (October 22, 2015) Novel mutations in genes causing hereditaryspastic paraplegia and Charcot-Marie-Tooth neuropathy identified by an optimizedprotocol for homozygosity mapping based on whole-exome sequencing. Genet Med,10.1038/gim.2015.139.
38. Wang C, Zhan X, Liang L, Abecasis GR, Lin X (2015) Improved ancestry estimation forboth genotyping and sequencing data using projection procrustes analysis and ge-notype imputation. Am J Hum Genet 96(6):926–937.
39. Purcell S, et al. (2007) PLINK: A tool set for whole-genome association and pop-ulation-based linkage analyses. Am J Hum Genet 81(3):559–575.
40. Szpiech ZA, et al. (2013) Long runs of homozygosity are enriched for deleteriousvariation. Am J Hum Genet 93(1):90–102.
41. International HapMap 3 Consortium (2010) Integrating common and rare geneticvariation in diverse human populations. Nature 467(7311):52–58.
42. 1000 Genomes Project Consortium (2012) An integrated map of genetic variationfrom 1,092 human genomes. Nature 491(7422):56–65.
43. Price AL, et al. (2009) Sensitive detection of chromosomal segments of distinct an-cestry in admixed populations. PLoS Genet 5(6):e1000519.
44. Gazal S, et al. (2014) Inbreeding coefficient estimation with dense SNP data: Com-parison of strategies and application to HapMap III. Hum Hered 77(1-4):49–62.
45. Casanova J-L, Conley ME, Seligman SJ, Abel L, Notarangelo LD (2014) Guidelines forgenetic studies in single patients: Lessons from primary immunodeficiencies. J ExpMed 211(11):2137–2149.
46. Mathieson I, McVean G (2012) Differential confounding of rare and common variantsin spatially structured populations. Nat Genet 44(3):243–246.
47. Gazal S, Sahbatou M, Babron M-C, Génin E, Leutenegger A-L (2014) FSuite: Exploitinginbreeding in dense SNP chip and exome data. Bioinformatics 30(13):1940–1941.
48. Belkadi A, et al. (2015) Whole-genome sequencing is more powerful than whole-exomesequencing for detecting exome variants. Proc Natl Acad Sci USA 112(17):5473–5478.
49. Ott J, Wang J, Leal SM (2015) Genetic linkage analysis in the age of whole-genomesequencing. Nat Rev Genet 16(5):275–284.
50. DePristo MA, et al. (2011) A framework for variation discovery and genotyping usingnext-generation DNA sequencing data. Nat Genet 43(5):491–498.
51. Li H, Durbin R (2010) Fast and accurate long-read alignment with Burrows-Wheelertransform. Bioinformatics 26(5):589–595.
52. McKenna A, et al. (2010) The Genome Analysis Toolkit: A MapReduce framework foranalyzing next-generation DNA sequencing data. Genome Res 20(9):1297–1303.
53. Price AL, et al. (2006) Principal components analysis corrects for stratification in ge-nome-wide association studies. Nat Genet 38(8):904–909.
54. He H, et al. (2011) Effect of population stratification analysis on false-positive ratesfor common and rare variants. BMC Proc 5(Suppl 9):S116.
55. Lander ES, Botstein D (1987) Homozygosity mapping: A way to map human recessivetraits with the DNA of inbred children. Science 236(4808):1567–1570.
56. Abecasis GR, Cherny SS, Cookson WO, Cardon LR (2002) Merlin–rapid analysis ofdense genetic maps using sparse gene flow trees. Nat Genet 30(1):97–101.
6718 | www.pnas.org/cgi/doi/10.1073/pnas.1606460113 Belkadi et al.
Dow
nloa
ded
by g
uest
on
May
28,
202
0