Embed Size (px)
Citation preview
16-22 Sráid na Faiche, Baile Átha Cliath 7, D07 CR20 16-22 Green Street, Dublin 7, D07 CR20
Guthán/Phone + 353 (0) 1 858 9601 Facs/Fax + 353 (0) 1 858 9609 Ríomhphost/Email [email protected] Idirlíon/Web www.ihrec.ie
Whitaker Square, Sir John Rogerson’s Quay Dublin 2
Phone +353 1 8632000 Fax +353 1 8632100 Email [email protected] Web www.esri.ie
RESEARCH SERIESRESEARCH SERIES
Who experiences discrimination in Ireland?Evidence from the QNHS Equality Modules
Frances McGinnity, Raffaele Grotti, Oona Kenny and Helen Russell
Who
exp
erie
nces
dis
crim
inat
ion
in Ir
elan
d?
RESEARCH SERIES
Who experiences discrimination in Ireland?Evidence from the QNHS Equality Modules
Frances McGinnity, Raffaele Grotti, Oona Kenny and Helen Russell
This report was written by Frances McGinnity, Raffaele Grotti, Oona Kenny and Helen Russell. It was prepared for the Irish Human Rights and Equality Commission by the Economic and Social Research Institute as part of the Research Programme on Human Rights and Equality. The report has been peer-reviewed prior to publication. The views expressed in this report are those of the authors and do not necessarily represent those of the Economic and Social Research Institute or the Irish Human Rights and Equality Commission.
The Irish Human Rights and Equality Commission was established under statute on 1 November 2014 to protect and promote human rights and equality in Ireland, to promote a culture of respect for human rights, equality and intercultural understanding, to promote understanding and awareness of the importance of human rights and equality, and to work towards the elimination of human rights abuses and discrimination.
The Economic and Social Research Institute (ESRI) is an independent research institute working towards a vision of ‘Informed policy for a better Ireland’. The ESRI seeks to support sustainable economic growth and social progress in Ireland by providing a robust knowledge base capable of providing effective solutions to public policy challenges.
2017. Copyright is held jointly by the Economic and Social Research Institute and the Irish Human Rights and Equality Commission.
Irish Human Rights and Equality Commission, 16–22 Green Street, Dublin 7.
Economic and Social Research Insititute, Whitaker Square, Sir John Rogerson’s Quay, Dublin.
ISBN 978-0-7070-0438-9
DOI https://doi.org/10.26504/bkmnext342
Available to download from www.esri.ie
FOREWORD
I am delighted to introduce Who experiences discrimination?, the first in a series of pieces of research prepared for the Irish Human Rights and Equality Commission by the Economic and Social Research Institute (ESRI), as part of the Commission’s Research Programme on Human Rights and Equality.
Access to and use of good quality data and empirical research are of crucial importance in identifying the barriers to the full enjoyment of human rights and equality that persist in our society, as well as the people whom these barriers most affect. During their recent examinations of Ireland, United Nations human rights treaty monitoring bodies have regularly underscored the importance of such data, and the Irish Human Rights and Equality Commission has regularly highlighted the need in Ireland for more systematic data collection across a range of areas, including gender, criminal justice, and disability.
The Irish Human Rights and Equality Commission’s core statutory role is to protect and promote human rights and equality in Ireland. As such, it is a strategic priority of the Commission, working with specialists such as the ESRI, to make a contribution to the knowledge base necessary for better understanding, and therefore challenging, gaps in human rights and equality protection in Ireland.
This piece of research draws on the data collected for the equality module of the 2014 Quarterly National Household Survey, carried out by the Central Statistics Office (CSO). Participants were asked if, in the previous two years, they had experienced discrimination, whether in the workplace, while seeking work, in public services or in private services. The data therefore provides an invaluable insight into the groups most likely to report experiencing discrimination in Ireland, and the context in which it occurs.
This report also compares the 2014 data to findings in 2004 and 2010, allowing us to build a clearer picture of how the experience of discrimination in Ireland has changed over the course of a decade, as well as a baseline against which to measure developments since 2014.
We hope that the insights presented in this report will be of use not only to those working in the protection and promotion of human rights and equality, but will be brought to bear in the wider social policy and policy-making sphere.
I would like to thank the report’s authors, Professor Frances McGinnity, Dr Raffaele Grotti, Oona Kenny and Professor Helen Russell.
Emily Logan Chief Commissioner, Irish Human Rights and Equality Commission.
ABOUT THE AUTHORS
Frances McGinnity is an Associate Research Professor at the ESRI and an Adjunct Professor of Sociology at Trinity College Dublin (TCD). Raffaele Grotti is a Post-doctoral Research Fellow at the ESRI. Oona Kenny is a Research Assistant at the ESRI. Helen Russell is an Associate Research Professor at the ESRI and an Adjunct Professor of Sociology at TCD.
AUTHORS’ ACKNOWLEDGEMENTS
We gratefully acknowledge the funding received from the Irish Human Rights and Equality Commission (IHREC) to support the research programme. We would like to thank the members of the steering board for their input and constructive comments – Cliona Doherty (IHREC), Laurence Bond (IHREC), Grainne Collins (NDA) and Mary Murphy (Maynooth University). The report also benefited greatly from the comments of two ESRI reviewers and an international expert reviewer, as well as Emer Smyth, who acted as editor of the report. Particular thanks go also to Maureen Delamere from the Central Statistics Office for her efforts in supplying us with the datasets for the Equality module of the Quarterly National Household Survey and for answering our queries.
Table of contents |i
TABLE OF CONTENTS
EXECUTIVE SUMMARY .................................................................................................................. III
1 INTRODUCTION ........................................................................................................................... 1
2 DISCRIMINATION: PREVIOUS LITERATURE AND THE IRISH CONTEXT ........................................ 3
2.1 Measuring discrimination ................................................................................................ 3
2.2 Previous evidence on discrimination ................................................................................ 4
2.3 The experience of discrimination in boom, recession and recovery ................................ 7
2.4 Equality legislation in Ireland ............................................................................................ 9
3 THE EQUALITY MODULE AND HOW IT IS ANALYSED ................................................................ 11
3.1 Measuring discrimination using the Equality module .................................................... 11
3.2 Measuring equality groups and modelling discrimination ............................................. 12
4 THE EXPERIENCE OF DISCRIMINATION IN 2014 AND CHANGE OVER TIME.............................. 17
4.1 Risk of discrimination in 2014 and over time ................................................................. 17
4.2 Risk of discrimination for different equality groups in 2014 .......................................... 22
5 MODELLING THE RISK OF WORK-RELATED AND SERVICE DISCRIMINATION ............................ 31
5.1 Introduction .................................................................................................................... 31
5.2 Work-related discrimination ........................................................................................... 31
5.3 Discrimination in public and private services ................................................................. 36
5.4 Change over time in the experience of discrimination ................................................... 38
6 CONCLUSION ............................................................................................................................. 43
REFERENCES ................................................................................................................................. 47
APPENDIX ..................................................................................................................................... 51
ii| Lists of tables and figures
LIST OF TABLES
Table 5.1 Model of discrimination in the workplace and looking for work (2014) ........................... 32 Table 5.2 Models of discrimination in public and private services (2014)........................................ 37
Table 5.3 Comparing discrimination in 2004, 2010 and 2014 .......................................................... 38 Table 6.1 Summary of reports of discrimination for each equality group ........................................ 43
Table A1 Group proportions in the QNHS 2004, 2010 and 2014 Equality modules (weighted) ......................................................................................................................... 51
Table A2 Incidence and rates of discrimination across domains ..................................................... 52 Table A3 Model of discrimination in the workplace and looking for work with and without
additional controls (2014) ................................................................................................. 52 Table A4 Model of discrimination in the public and private services with and without
additional controls (2014) ................................................................................................. 54
Table A5 Number and proportion of grounds given for discrimination by domain ......................... 55
LIST OF FIGURES Figure 4.1 Rates of overall, work- and services-related discrimination (2014) .................................. 18 Figure 4.2 Rates of discrimination in each individual service (2014) ................................................. 19
Figure 4.3 Rates of overall, work, and services related discrimination (2004, 2010 and 2014) ........ 20 Figure 4.4 Rates of discrimination in each individual service (2004, 2010 and 2014) ....................... 21
Figure 4.5 Rates of discrimination in the workplace by equality groups (2014) ................................ 24 Figure 4.6 Rates of discrimination while looking for work by equality groups (2014)....................... 26
Figure 4.7 Rates of discrimination in public services by equality groups (2014) ............................... 27 Figure 4.8 Rates of discrimination in private services by equality groups (2014) .............................. 28
Executive summary | iii
EXECUTIVE SUMMARY
Who is most likely to report experiencing discrimination in Ireland and how has this changed over time? This study draws on a large, nationally representative survey from 2014, which asked 15,000 adults about their experience of discrimination. It also compares the 2014 responses to those from identical surveys conducted in 2004 and 2010. Discrimination is understood as a situation in which individuals are treated differently due to their membership of specific groups; that is, because of who they are. For example, it may be because they are young or old, male or female, or with or without a disability. Discrimination violates the human right of equal treatment, is a contributing factor to inequality and may challenge social cohesion.
Internationally, human rights conventions provide for equal treatment and protection from discrimination. At national level, equality legislation currently protects against discrimination in employment and services across ten grounds. This report investigates outcomes for the following ‘equality groups’, related to these grounds, for which we have information: men or women; different age groups; those with or without a disability; Travellers or non-Travellers and national/ethnic groups; different religious groups; and marital and family type groups. No information was available on sexual orientation.1
In line with best practice to minimise bias in self-reports of discrimination, respondents are asked whether they believe they have experienced discrimination according to a definition that reflects Irish law. The questions also refer to a specified time period – the last two years – and to specific contexts. The contexts are:
• in the workplace; • while looking for work; • in public services (education, health, transport and other public services);
and • in private services (shops/pubs/restaurants, banks and other financial
services and housing).
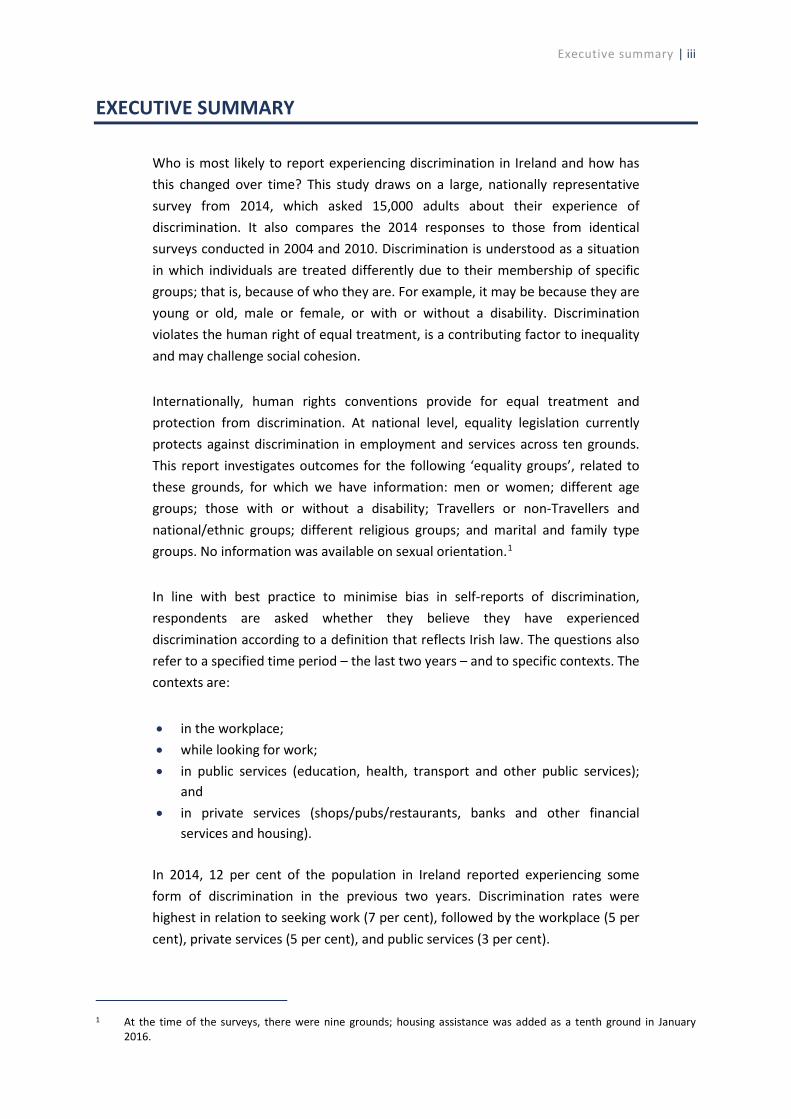
In 2014, 12 per cent of the population in Ireland reported experiencing some form of discrimination in the previous two years. Discrimination rates were highest in relation to seeking work (7 per cent), followed by the workplace (5 per cent), private services (5 per cent), and public services (3 per cent).
At the time of the surveys, there were nine grounds; housing assistance was added as a tenth ground in January 2016.
1
iv | Who experiences discrimination?
To enhance our understanding of the headline figures provided in the CSO statistical release of the Equality module (CSO, 2015), this report uses models to estimate whether group differences in perceived discrimination remain when personal characteristics are controlled, that is membership of other equality groups, as well as education, employment status and housing tenure.2 Results from the models for 2014 show the following.
• Women report higher discrimination in the workplace, though we find no gender differences in other areas.
• Older workers (45–64 years) perceive more discrimination than younger workers in seeking work, but in private services, older adults experience less discrimination, particularly those aged 65 years and over.
• Compared to White Irish respondents, Black respondents report higher discrimination in the workplace, in public services and in private services. Asian respondents report more discrimination than White Irish in private services.3
• In 2014, White Non-Irish do not differ from White Irish respondents in reported discrimination in any domain: the workplace, seeking work, or in relation to public or private services.
• Irish Travellers report very high rates of discrimination in seeking work, where they are ten times more likely than White Irish to experience discrimination, and extremely high rates of discrimination in private services, where they were over 22 times more likely to report discrimination, particularly in shops, pubs and restaurants. The number of Travellers among survey respondents was too low to examine workplace discrimination.
• Compared to Catholics, members of minority religions report somewhat higher discrimination rates in the workplace and in public and private services.
• Never-married lone parents are more likely to experience discrimination in public and private services than single childless adults.
• Those with a disability experience higher rates of discrimination than those without a disability in all areas – in the workplace, while seeking work, in private services and public services.
Did self-reports of discrimination change over time? Overall, reported discrimination has remained stable between 2004 (during the economic boom), 2010 (during the recent recession) and 2014 (during early recovery). This masks diverging trends: a small rise in discrimination in recruitment offset by a fall in discrimination in private services. Recruitment discrimination remained stable during the boom and the recession (just under 6 per cent in 2004 and 2010), but rose in early recovery to over 7 per cent (2014). By contrast, in private services –
2 The models do not examine the grounds on which people felt discriminated against; these are reported in Table A5. 3 Measures of ethnicity and nationality are combined to give white Irish, white non-Irish, black, Asian, other, and Irish
Traveller.
Executive summary | v
shops/restaurants and financial services, though not housing – discrimination fell, from 7 per cent in 2004 to 5 per cent in 2010 and under 5 per cent in 2014. Perceived discrimination in the workplace remained stable over the period, as did discrimination in access to public services.
Did group differences in perceptions of discrimination change in the period 2004– 2014? In the workplace, the gap between Black and White Irish respondents grew between 2004 and 2014. In recruitment, the gap between White Non-Irish and White Irish fell, so that by 2014 there was no difference between these groups. Women were more likely to report discrimination in the workplace and this was unchanged from 2004 and 2010. There were no gender differences in other domains over much of the period (seeking work, public and private services).4
Those with a disability reported much higher workplace discrimination in 2004 than those without a disability; this gap narrowed in 2010 but rose again in 2014. In public services, by contrast, the gap between those with and without a disability fell between 2004 and 2010 and the 2010 gap was maintained in 2014.
The negative consequences of discrimination for individuals and the societies in which they live strengthen the policy imperative to increase awareness and reduce discrimination. Building the evidence base is an essential step towards developing effective policy, and this study highlights the need to monitor access and outcomes across a wide range of areas. Self-reports of discrimination form an important part of this picture; other sources of information complement such data. Given the experience of different ethnic groups, measuring ethnicity to monitor outcomes in surveys and administrative data would be very informative. Irish Travellers in particular, who report very high levels of discrimination, are often not identified in surveys, which highlights the importance of making use of census data and adding an ethnic identifier to administrative data to monitor outcomes. Further statistical analysis and experimental work could also investigate in more depth the changing rates of discrimination experienced by those with a disability in the workplace, and the challenges experienced by some groups in the housing market.
The one exception: in 2004, men were more likely to have reported experiencing discrimination in recruitment, while in 2010 and 2014 there were no gender differences observed in recruitment.
4
Introduction | 1
CHAPTER 1
Introduction
This report seeks to measure the experience of discrimination in Ireland and how this varies across social groups. The study is based on individuals’ own reports of discrimination in the labour market and while accessing goods or services.5
Discrimination is understood here as a situation in which individuals believe they are treated differently due to their membership of specific groups – that is, because of who they are, for example: young or old, male or female, with or without a disability. Discrimination is thus the lived experience of unequal treatment ‘on the ground’, as reported by the individuals who experience it.
Why does discrimination matter? Firstly, discrimination violates the fundamental human right of equal treatment, established, alongside other rights, by the Universal Declaration of Human Rights in 1948 (OECD, 2013). Secondly, it is a contributing factor to overall inequality between groups: where systematic discrimination persists, equality can never be achieved. Thirdly, it may have damaging consequences for the individuals involved – both in terms of mental and physical health, self-esteem and underperformance of the minority group (Schmitt et al., 2010). It has been shown that perceived racial discrimination at work is positively associated with turnover intent (Goldman et al., 2006; Triana et al., 2010); perceived racial discrimination is also associated with poor health, especially mental health (Gee, 2002). Fourthly, to the extent that individuals who experience discrimination feel marginalised and deliberately excluded from society, this could present a threat to social cohesion (De Vroome et al., 2014). Finally, discrimination in the labour market may be economically inefficient, as the skills and competencies of individuals are not efficiently utilised. Measuring and tracking the extent of discrimination is thus an extremely valuable exercise.
Yet measuring discrimination accurately is challenging (Pager and Shephard, 2008; OECD, 2013). One way of doing so is to ask people directly about their experience. While by nature somewhat subjective (see Chapter 2), this method allows us to assess group differences in the experience of discrimination, and change in perceptions of discrimination over time. The analyses in this project use data from a nationally representative survey of self-reports of discrimination in Ireland, carried out by the CSO in the third quarter of 2014 – the Equality module of the Quarterly National Household Survey. In doing so, it enhances our understanding of the headline figures provided by the CSO statistical release on this Quarterly National Household Survey (QNHS) Equality module (CSO, 2015). The Equality module of the survey was completed by almost 15,000 adults.
The next chapter discusses some of the advantages as well as limitations of using these self-reports, which are by their nature subjective.
5
2 | Who experiences discrimination?
Respondents were asked about the experience of discrimination across nine social situations or domains, two of which were work-related, with the remaining seven related to accessing services. The 2014 results are compared with earlier, identical modules from 2004 and 2010. An important feature of the Equality modules is that they are surveys of the whole population, not just minority groups, or indeed one minority. This allows us to compare the experience of different minority groups with majority groups. At the time of the survey, discrimination was illegal in Ireland on nine grounds: gender, civil status (including marriage and civil partnership), family status, age, race/nationality, religion, disability and membership of the Traveller community.6
This report uses the QNHS data to classify and investigate outcomes for seven categories, referred to here as ‘equality groups’. They are: men/women; different age groups, those with/without a disability, Travellers or non-Travellers; ethnic/national groups; different religious groups; and marital and family type groups.7
Three key questions are addressed. Firstly, what is the extent of discrimination in each of the work and service domains in 2014? Secondly, which groups experience the highest rates of discrimination? Thirdly, how has the experience of discrimination changed over time? The period 2004 to 2014 was one of considerable economic and social change in Ireland, so the report will also investigate whether and how patterns of the experience of discrimination change between 2004 (economic boom), 2010 (recession) and 2014 (early recovery).
The report builds on analysis in Russell et al. (2008) and McGinnity et al. (2012), which examines the first two Equality modules carried out by the CSO in 2004 and 2010. As such, it enhances our understanding of the headline figures provided in the CSO’s statistical release on the QNHS Equality module (CSO, 2015).
Chapter 2 briefly reviews measurement issues, previous literature and the legislative context in Ireland. Chapter 3 discusses the Equality module questionnaire, and how it is analysed. Chapter 4 presents rates of discrimination experienced in different situations and by different groups in 2014, with some discussion of change over time. Chapter 5 presents the results of statistical modelling to identify whether group characteristics are associated with discrimination when other factors are accounted for, in which domains this occurs and which groups are most at risk. Chapter 6 sets out the conclusions of the report.
6 In January 2016, a tenth ground, that of ‘housing assistance’, was added. 7 No information was available on sexual orientation. The gender ground prohibits discrimination on the basis of inter-
sex and transgender, but respondents are only identified as male or female in the survey.
Discrimination: Previous literature and the Irish context | 3
CHAPTER 2
Discrimination: Previous literature and the Irish context
2.1 MEASURING DISCRIMINATION
While it is important to measure the extent of discrimination, doing so presents challenges, and a number of different methods have been used (Bond et al., 2010; OECD, 2013). One common technique is to compare group outcomes, such as wages, and statistically control for non-discriminatory sources of difference, such as education and experience (Pager and Shephard, 2008). The remaining differences are often attributed to discrimination, though this is problematic: there may be other factors underlying such outcomes. This method is thus best used for assessing group differences, not discrimination.
A second method is the use of surveys to measure the attitudes of the whole population to minority groups. Such surveys provide an insight into the attitudinal climate towards particular groups, but holding negative attitudes to a group is not the same as treating them unfairly, though these may be related (McGinnity and Lunn, 2011).
A third method is to measure trends in successful legal or tribunal cases in a given jurisdiction over time. This can be useful but does not give an accurate measure of incidence or prevalence of discrimination. As the OECD (2013) notes, the difficulties of taking a case to court mean the number of successful cases is typically low and represents the tip of the iceberg.
Field experiments comprise a fourth means of examining discrimination; they are a powerful method for providing direct observations of discrimination. They retain key elements of experiments (matching, random assignment) and apply them to real-world contexts (job applications, house hunting). Typically, two matched fictitious candidates (one from a majority group, one from a minority group) apply for the same job or accommodation and responses are recorded, allowing researchers to measure the extent of discrimination. While experiments provide compelling evidence in areas they test, they are limited to a particular time and space, usually only one criterion can be tested, and many situations in life are less amenable to testing.8
A final tool for monitoring discrimination over time, and the approach taken in this study, is to ask respondents directly about their experience of discrimination.
For example, in the labour market, experiments are better suited to testing recruitment than promotion within a job or workplace harassment. In services, housing discrimination where there are several applicants for a given residence, is easier to test than discrimination while using public transport.
8
4 | Who experiences discrimination?
The strengths of this method lie in the size and representativeness of the sample; the diverse social groups who report their experience; and the range of situations covered. This allows us to compare minority experience with majority experiences, for example by asking whether poor treatment in shops or restaurants is more commonly reported by a specific group or a general feature of life in Ireland. It also allows us to analyse a very wide range of important aspects of people’s lives – not just when they apply for a job, but, for example, also when they use public services, public transport and health services. In addition, follow-up questions can be asked about the impact of discrimination on people’s lives and the actions they may or may not have taken.
The chief weakness of this method is that responses are subjective as they depend on respondents’ assessment of their treatment by others. Unlike legal cases, there is no independent judge to assess whether or not unfair treatment took place (Bond et al., 2010).9 Self-reports of discrimination may be subject to incomplete information and bias. Discrimination may be under-reported because it is not observable to the respondent (a landlord might discriminate against a prospective tenant but the prospective tenant might never find out or may not attribute the behaviour to discrimination). Discrimination may also be over-reported, if a candidate incorrectly attributes their treatment to discrimination when in fact it was due to another factor (for example, denial of a job promotion could be due to poor work performance rather than discrimination). Such under-or over- reporting is partly accounted for by comparing group experiences (young with old, male with female), but it is particularly problematic if it varies systematically between groups. Some studies have found for example that highly educated people tend to report more discrimination in a range of situations, despite being comparatively advantaged (McGinnity et al., 2012; Tolsma et al., 2012). While this bias cannot be eliminated, it can be minimised by asking very specific questions about life situations and time periods and, in particular, by giving respondents a clear definition of what counts as discrimination, and what does not (see Blank et al., 2004). Section 3.1 discusses how the surveys underlying this report follow best practice so as to minimise bias.
2.2 PREVIOUS EVIDENCE ON DISCRIMINATION
Previous research has found considerable differences in self-reported discrimination, depending on the country, the social situation being investigated and the framing of questions in the questionnaires. Often these studies are linked to particular types of discrimination, particularly on the basis of gender or race/ethnicity. Much of this research has been conducted in the US, though there have been some important cross-national European surveys in the past decade.
Although even legal cases require the complainant to attribute the behaviour to discrimination before taking a case. 9
Discrimination: Previous literature and the Irish context | 5
For example, a European study on migrants’ self-reports of racism and discrimination was conducted across 12 EU Member States including Ireland (EUMC, 2006). The questionnaire was replicated across countries, though the sampling strategies and migrant groups analysed differed considerably. Overall, discrimination in the workplace or in seeking work was highest, though discrimination on the street and in public places was also common in many countries. In the Irish sample of non-EU migrants, discrimination was most commonly reported in the street or on public transport, followed by harassment at work and recruitment discrimination (McGinnity et al., 2006). In order to counter the problem caused by considerable cross-country variation in terms of size and composition of ethnic minority populations, McGinnity and Gijsberts (forthcoming) examine the experience of discrimination on the basis of ethnicity/nationality among a sample of recently arrived Polish migrants in both Ireland and the Netherlands. They find higher rates of discrimination in the Netherlands and attribute this in part to the negative attitudinal climate towards eastern European migrants there. Even when the same migrant group is analysed, the identification of ‘out-groups’ and the salience of group boundaries can differ across countries (see McGinnity and Gijsberts, forthcoming, for a discussion).
A number of cross-national European surveys have asked questions about discrimination to the broader population. In 2015, the Eurobarometer (an EU-wide survey) focused on the perceptions, attitudes, knowledge and awareness of discrimination and inequality across the European Union. Around one in five (21 per cent) of the whole European sample reported having experienced discrimination or harassment in the previous 12 months. This is higher than estimates of discrimination from previous Equality modules in Ireland, which puts experience of any discrimination at under 12 per cent in the previous two years (Russell et al., 2008; McGinnity et al., 2012). However, the questions in Ireland are domain-specific (that is, they relate to specific matters such as the workplace, seeking work and accessing different services) and are limited to unfair treatment, which might exclude harassment.10 The sixth European Working Conditions Survey, conducted in 2015, also asked workers about their experience of discrimination at work in the 12 months preceding the survey. Some 7 per cent of workers felt they had been discriminated against at work on the basis of sex, race, religion, age, nationality, disability or sexual orientation. This is much closer to previous estimates from Equality modules in Ireland, where, for example in 2010, 5.3 per cent reported discrimination in the workplace (McGinnity et al., 2012). Detailed results of self-reported discrimination from the earlier Equality modules are reported in Chapters 4 and 5 of this report.
The Eurobarometer survey defines harassment for respondents: Harassment is commonly understood to arise when unwanted behaviour takes place with the purpose or effect of violating the dignity of a person and of creating a hostile, degrading, humiliating or offensive environment.
10
6 | Who experiences discrimination?
There have been a number of group-specific surveys in Ireland. A study of pregnancy discrimination found that 30 per cent of women reported unfair treatment at work during their pregnancy (Russell et al., 2011). At the most extreme, 5 per cent of women reported that they had been made redundant, dismissed or were so badly treated that they had to leave as a result of their pregnancy.11 Travellers report very high levels of discrimination in Ireland. The All Ireland Traveller Health Survey, in 2008, found that 61 per cent of Travellers reported ever having experienced discrimination being served in a pub, restaurant or shop; 56 per cent reported discrimination getting accommodation, and 55 per cent reported discrimination in seeking work (AITHS, 2010).12
Results from field experiments, though limited to specific domains, generally support the findings from self-report data. Significant levels of racial and ethnic discrimination in recruitment have been detected in 18 countries; typically, discrimination is higher towards non-white minorities in Western countries (Zschirnt and Ruedin, 2016). In Ireland, McGinnity and Lunn (2011) found that candidates with Irish names were over twice as likely to be invited to interview for advertised jobs as candidates with identifiably non-Irish names (Asian, African or European), even though both submitted equivalent CVs.13 Experiments have also been used to test recruitment discrimination on the basis of gender, age, religion, disability, family status and sexual orientation, and in credit and mortgage applications (Rich, 2014).
In Ireland, a body of evidence of inequalities has been established on a range of grounds (gender, age, ethnicity, nationality, disability and membership of the Traveller community) using statistical analysis of outcomes (Watson et al., 2013; McGinnity et al., 2014; Russell et al., 2014; Watson et al., 2017; Barrett et al., 2017). McGinnity et al. (2014), in an analysis of labour market and poverty outcomes before (2007) and after recession (2012), found that equality groups were differentially affected and the overall impact of austerity and recession was complex.
Studies that combine self-reports of discrimination with an assessment of objective outcomes confirm the validity of such measures. In the US, Coleman et al. (2008) found that nearly all black workers who report discrimination in work
11 The most common form of unfair treatment at work during pregnancy was being ‘given unsuitable work or workloads’, which was reported by 12 per cent of employees.
12 Respondents were asked: ‘Have you ever experienced discrimination, been stopped from doing something, or been hassled or made to feel inferior in any of the following situations because you are a member of the Traveller community?’ The situations were then listed. These results may be influenced by the wide reference period and will be different to surveys that ask about a specific life event for example, pregnancy, in the previous two years. The sample size was large – 1,604 Travellers in the Republic of Ireland.
13 The authors did not find significant differences in the degree of discrimination faced by candidates with Asian, African or German names. The results for this sample of jobs indicated strong discrimination against minority candidates and this applied broadly across all sectors and occupations tested.
Discrimination: Previous literature and the Irish context | 7
also show statistical evidence of wage discrimination. For an application of multiple methods to the Irish labour market, see for example Kingston et al. (2013) on immigrants and Watson et al. (2013) on people with disabilities. McGinnity and Gijsberts (forthcoming), using a longitudinal survey of Polish migrants in Ireland and the Netherlands, find that new Polish migrants who report discrimination also experience poorer objective outcomes, such as losing their job in the 18 months between the waves of the survey.
2.3 THE EXPERIENCE OF DISCRIMINATION IN BOOM, RECESSION, AND RECOVERY
As noted at the outset, the primary aim of this report is to look at the situation in 2014. Change over time is a secondary aim, and the focus of this subsection. Specifically, we discuss some expectations about how the experience of discrimination may have changed over time. Changes in perceived discrimination arise from a number of factors; for example, the economic context, population movements, policy changes, changes in openness to diversity among the population and the treatment of minorities.14 Changes can also occur in terms of people’s tendency to name poor treatment as discrimination and to see it as illegitimate. Normative shifts or greater awareness of equality issues could initiate such changes. Or indeed, we may observe persistence in discrimination that is not sensitive to these factors.
The three waves of the equality survey cover a period of considerable turbulence in the economic and labour market situation in Ireland, going from boom and almost full employment in 2004, to the worst recession in the history of the state in 2010, and on to early recovery in 2014. As a crude indicator, the unemployment rate was just over 4 per cent in 2004; over 14 per cent in 2010; and just over 11 per cent and falling in 2014.15 What are the potential implications of this for the experience of discrimination?
Discrimination may play a greater role when resources are scarce, favouring majority groups such as men, White Irish, and those who are not disabled. This notion of scarce resources may have different implications for the labour market and service provision. Theories of labour market discrimination would suggest that discrimination in recruitment will rise in recession, as many more candidates apply for jobs and employers can afford to be more selective.16 What have previous studies found? Zschirnt and Ruedin (2016), in their meta-analysis based on 43 field experiments conducted in OECD countries between 1990 and 2015,
14 Note equality and diversity does not always imply that there needs to be a minority group, for example in the case of gender and age groups.
15 ILO unemployment rates, 15–74 years: 2004 Q3 – 4.4 per cent; 2010 Q4 – 14.4 per cent; 2014 Q3 – 11.3 per cent. Source: CSO Statbank, Quarterly National Household Surveys.
16 See McGinnity and Lunn (2011) for a discussion of theories of discrimination.
8 | Who experiences discrimination?
find no clear link between the economic cycle (boom/recession) and discrimination against minorities in recruitment.17 Using self-report data, Kingston et al. (2015) found considerable differences between national/ethnic groups in reported discrimination in Ireland, but no evidence of a rise in the perception of discrimination between 2004 (boom) and 2010 (recession). While theory might lead us to expect a rise in perceived labour market discrimination against minorities during a recession, the limited empirical evidence, albeit only on national/ethnic minorities, seems to suggest that this does not vary with the economic cycle. This may be due to job-seekers attributing negative experiences to the macro employment climate or a reluctance to identify discrimination in a tight labour market during a recession.
That said, there are no studies specifically focusing on the period of labour market recovery. It could be that, as vacancies open up, employers can exercise a discriminatory preference for members of the ‘in-group’ from the still large pool of job-seekers. In tandem, the expectations of job-seekers may rise and they may be less inclined to attribute not getting a job to poor labour market conditions, but to their personal characteristics (such as age, gender, nationality/ethnicity, disability, and marital or family status). This would lead to the expectation that labour market discrimination would increase between 2010 and 2014.
In services, one might expect private services to be more vulnerable to economic change than public services. Theories of discrimination might predict that a sharp fall in sales and financial transactions would be associated with lower discrimination in private services, as service providers struggle to remain profitable. Thus, the experience of discrimination in private services would be lower in 2010 than in 2004. However, there may also be processes specific to domains: For example, while the demand for housing in Ireland was very high in the boom, it is also very high in recovery (Duffy et al., 2014), so housing discrimination may not fall in the same way as discrimination in, say, financial services or in shops and restaurants.
In general, we might expect public services like health and education to be less susceptible to the economic cycle than private services. However, due to the extent of the fiscal crisis in Ireland and the conditions of the bailout, budgets and staffing of many public services were cut, while at the same time there was increased demand due to falling household incomes (NESC, 2013). Where cutbacks result in an overall reduction in the level of service provision, it is likely that more vulnerable groups may be disproportionately affected as they are more dependent on public services. Funding to local and community groups has also
Field experiments provide direct evidence of discrimination in recruitment, but the design means a boom/recession comparison within an experiment is often not possible and it can be difficult to compare across experiments.
17
Discrimination: Previous literature and the Irish context | 9
been drastically affected by the crisis, which also results in the loss of supports for the most disadvantaged (IHREC, 2015).
Some economic hypotheses see discrimination as a conscious strategy employed when necessary. However, in a meta-analysis of discrimination studies, Al Ramiah et al. (2010) show that implicit prejudice is a powerful predictor of subtle and informal discriminatory behaviour. Where discrimination is unconscious or automatic, we might expect it to be more robust to contextual change.
As noted at the outset, policy (either general equality/discrimination policy or that directed at particular groups, such as people with disabilities) may also play a role. For example, Watson et al. (2013) suggest that the fall in the experience of both work- and service-related discrimination among those with a disability between 2004 and 2010 may be related to policy initiatives in that period.
Detailed discussion of policy in each domain and for each group is beyond the scope of this report, but where relevant to findings, specific policies or initiatives are mentioned.
2.4 EQUALITY LEGISLATION IN IRELAND
At an international level, the Universal Declaration of Human Rights provides the most fundamental framework for anti-discrimination (OECD, 2013).18 In Ireland, protection against discrimination is covered by the Employment Equality Acts 1998 to 2015, which prohibit discrimination in the workplace and in vocational training, and the Equal Status Acts 2000 to 2015, which prohibit discrimination in the provision of goods and services, accommodation, housing assistance and education. The legislation outlaws discrimination on the grounds of gender, civil status, family status, age, race/nationality, religion, disability, sexual orientation or membership of the Traveller community.19 Both Acts define discrimination as treating a person less favourably than another person is being, has been, or would be treated in a comparable situation on any of the grounds specified. There are a considerable number of exemptions to both Equality Acts, in relation to specific services and groups. For example, regarding the Equal Status Acts, schools with only one sex are allowed; discrimination may also be permitted on the basis of religious affiliation in schools where it is essential to maintain the school's particular religious ethos. Financial service providers are allowed to treat
18 Its principles have been applied in more detailed conventions such as convention 111 of the ILO on discrimination in employment and occupation, which was ratified by 171 countries.
19 In 2011, the ground of ‘civil status’ replaced ‘marital status’ in the legislation to also take account of same-sex civil partnerships. Also the Equality (Miscellaneous Provisions) Act 2015 has inserted a tenth ground in the provision of accommodation only; the ‘housing assistance’ ground; http://www.irishstatutebook.ie/eli/2015/act/43/enacted/en/ html.
10 | Who experiences discrimination?
people differently based on a number of equality grounds in the case of pensions and insurance and other matters relating to risk assessments.20
A key limitation of anti-discrimination law in all countries is that legal rules are not self-enforcing: they rely on the actions of individuals who feel discriminated against (OECD, 2013). Moreover, taking a legal action can be costly, complex and time-consuming; it is often an adversarial process, even with financial support and advice from equality and human rights bodies. Previous research in Ireland has shown that only 10 per cent of those who had experienced discrimination took legal action (McGinnity et al., 2012). This highlights the importance of actions and initiatives by equality and human rights bodies to minimise discrimination outside the courts. It also highlights the importance of surveys – like the one reported here – asking people about their experience of discrimination, in order to monitor its extent and how it changes over time, even if these surveys rely on the extent to which people recognise or fail to recognise discrimination.
Following a Court of Justice ruling, since 2012 insurance companies are no longer allowed to discriminate on the basis of gender, though age is still permitted if related to risk assessment. For example, as evidence suggests younger drivers are at greater risk of car accidents, insurance premiums are higher for younger drivers. For details of provision and exemptions in the Equality Acts, see https://www.ihrec.ie/guides-and-tools/human-rights-and-equality-for-employers/what-does-the-law-say/exemptions-to-the-employment-equality-acts/ and http://www.ihrec.ie/guides-and-tools/human-rights-and-equality-in-the-provision-of-good-and-services/what-does-the-law-say/exceptions/.
20
The Equality module and how it is analysed | 11
CHAPTER 3
The Equality module and how it is analysed
3.1 MEASURING DISCRIMINATION USING THE EQUALITY MODULE
The analyses in this report are based on the Equality module from the Quarterly National Household Survey conducted in the third quarter of 2014, with some supplementary analysis of two previous modules, from 2010 and 2004. The QNHS is a very large, nationally representative random sample of private households in Ireland, designed to collect data on labour market indicators.21 Special survey modules are sometimes included in the survey, and results are matched with the main QNHS to allow respondents to be classified into groups on the basis of personal characteristics like gender, age, education, family status, nationality, housing tenure and broad region, as well as employment status and occupation and sector, if employed. These modules also include information about group membership not routinely collected in the main QNHS, for example detailed information on religious affiliation and a question on ethnicity. This information, and the very large sample size, permits analysis of the experience of relatively small social groups, as well as a comparison of experiences across different groups. No information was collected on sexual orientation. Regarding membership of the Traveller community, in 2014 the number of survey respondents is too small to report rates of discrimination for Travellers, but this group is separately distinguished in the models.22 Travellers are not separately identified in the data in 2004 and 2010.
The Equality module of the QNHS in 2014 was completed by just under 15,000 individuals all aged 18 years and over, who were interviewed directly – there were no proxy respondents. Respondents were asked about the experience of discrimination across nine social situations or domains, two of which were work-related (‘in the workplace’ and ‘looking for work’), with the remaining seven related to accessing services (in shops/pubs/restaurants; while using banks, insurance companies and other financial institutions; in relation to education; in looking for housing or accommodation; in accessing health services; in using transport services; and in accessing other public services).23
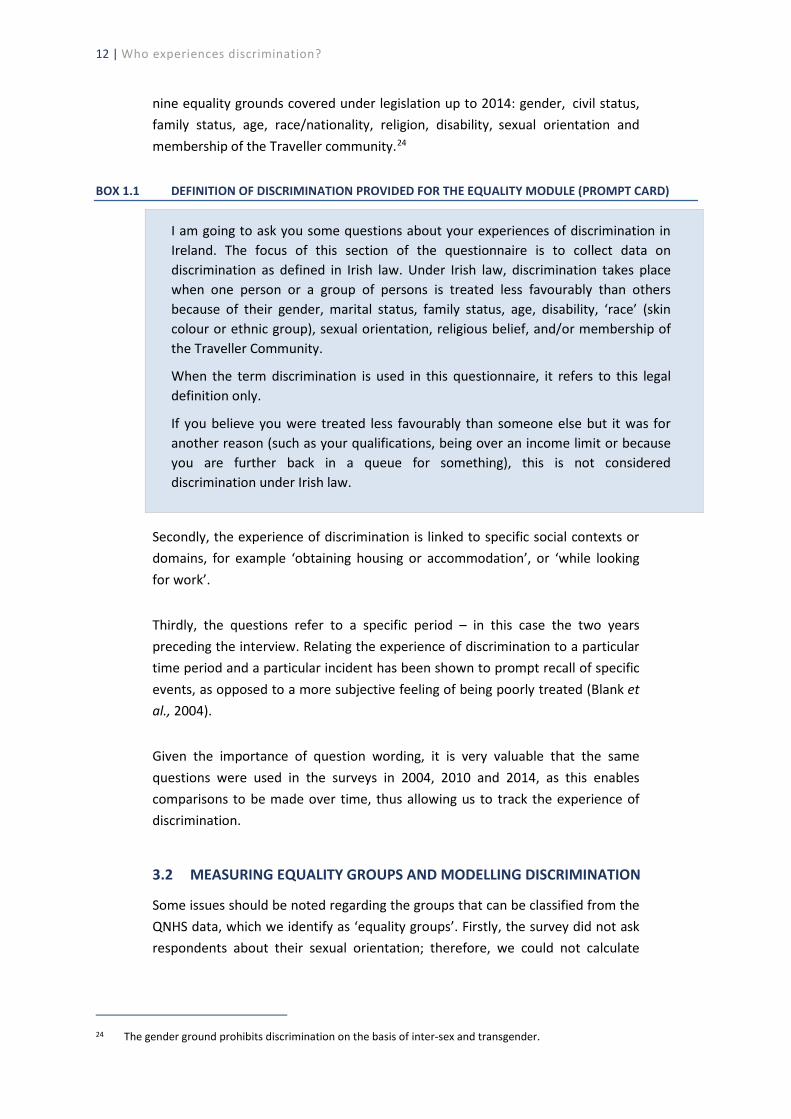
The survey follows international best practice to minimise bias in the estimates of discrimination (see Blank et al., 2004). Firstly, respondents were provided with a clear definition of discrimination and a number of concrete examples of what is and is not considered discrimination (See Box 1.1). This includes clarity on the
21 For further details, see: http://www.cso.ie/en/qnhs/abouttheqnhs/whatistheqnhs/. 22 The QNHS Equality module 2014 surveyed 55 Travellers. 23 For the full questionnaire see: http://www.cso.ie/en/media/csoie/qnhs/documents/QNHSequalityQ32014.pdf.
12 | Who experiences discrimination?
nine equality grounds covered under legislation up to 2014: gender, civil status, family status, age, race/nationality, religion, disability, sexual orientation and membership of the Traveller community.24
BOX 1.1 DEFINITION OF DISCRIMINATION PROVIDED FOR THE EQUALITY MODULE (PROMPT CARD)
I am going to ask you some questions about your experiences of discrimination in Ireland. The focus of this section of the questionnaire is to collect data on discrimination as defined in Irish law. Under Irish law, discrimination takes place when one person or a group of persons is treated less favourably than others because of their gender, marital status, family status, age, disability, ‘race’ (skin colour or ethnic group), sexual orientation, religious belief, and/or membership of the Traveller Community.
When the term discrimination is used in this questionnaire, it refers to this legal definition only.
If you believe you were treated less favourably than someone else but it was for another reason (such as your qualifications, being over an income limit or because you are further back in a queue for something), this is not considered discrimination under Irish law.
Secondly, the experience of discrimination is linked to specific social contexts or domains, for example ‘obtaining housing or accommodation’, or ‘while looking for work’.
Thirdly, the questions refer to a specific period – in this case the two years preceding the interview. Relating the experience of discrimination to a particular time period and a particular incident has been shown to prompt recall of specific events, as opposed to a more subjective feeling of being poorly treated (Blank et al., 2004).
Given the importance of question wording, it is very valuable that the same questions were used in the surveys in 2004, 2010 and 2014, as this enables comparisons to be made over time, thus allowing us to track the experience of discrimination.
3.2 MEASURING EQUALITY GROUPS AND MODELLING DISCRIMINATION
Some issues should be noted regarding the groups that can be classified from the QNHS data, which we identify as ‘equality groups’. Firstly, the survey did not ask respondents about their sexual orientation; therefore, we could not calculate
The gender ground prohibits discrimination on the basis of inter-sex and transgender. 24
25
26
27
28
29
The Equality module and how it is analysed | 13
rates of perceived discrimination for this group.25 Secondly, due to small numbers in certain categories, some groups have been collapsed. For example, the smaller religious groups are re-categorised as ‘other religions’, which includes other Christian, Muslim, Jewish or other religions. For the same reason, the Traveller group has been merged with White Irish for rates of discrimination (Section 4.2);26 however, Travellers are separately identified in the models in Chapter 5. Respondents who identify their ethnicity as Black are combined with the ‘Other’ ethnicity group when describing rates of discrimination in Section 4.2, and because these groups are related, the information for both nationality and ethnicity is combined into mutually exclusive categories. Similarly, family and marital status are combined so that a distinction can be made between, for example, those who are married with children and those who are cohabiting with children, as outcomes for these groups have been shown to differ (McGinnity et al., 2014). For the proportion within each group, see Table A1 in the appendix.
Disability is measured in the QNHS 2014 by asking respondents whether they experience any of a set of long-lasting conditions.27 The same wording was used in 2010, but not in 2004.28 Given that identifying those with a disability is sensitive to question wording, Watson et al. (2012) analysed the effect of this question wording change on working-age respondents between 2004 and 2010 and conclude that roughly the same thresholds apply, in terms of degree of difficulty, though some differences in who is defined as having a disability are observed.29 Table A1 shows that the proportion of respondents with a disability is similar across all three years.
Lastly, it should be noted that the groups we identify may not necessarily feel discriminated on the ‘matching’ ground as people have multiple identities and so may belong to two or more groups (for example, people with a disability who feel discriminated against based on their age). Previous research has looked at the overlap between characteristics and grounds (see Watson and Lunn, 2010) but it is beyond the scope of this report to conduct an in-depth analysis of grounds across groups.
Applying statistical models to data can be useful for identifying group differences in the risk of discrimination (Blank et al., 2004). In this report, we use regression
However, respondents who report discrimination can indicate sexual orientation as one of the grounds on which they were discriminated against (see CSO 2015). Travellers are not separately identified in the data for 2004 and 2010. These conditions are: blindness or a serious vision impairment; deafness or a serious hearing impairment; a difficulty with basic physical activities such as walking, climbing stairs, reaching, lifting or carrying; an intellectual disability; a difficulty with learning, remembering or concentrating; a psychological or emotional condition; a difficulty with pain, breathing, or any other chronic illness or condition. In 2004, the filter question on disability refers to any ‘long-lasting conditions’ but this phrasing was extended in 2010 and 2014 to ‘long-lasting conditions or difficulties’, following by specific mention of additional conditions (such as ‘remembering or concentrating’, ‘pain’ and ‘breathing’), which were not mentioned in 2004. See Watson et al. (2012) for further details.
14 | Who experiences discrimination?
analysis to analyse the risks of discrimination in work and service domains, for different groups of people, while holding other factors constant. Reporting the average rate of discrimination across groups like men and women or different age groups is informative; however, it does not allow us to isolate the effects of particular risk factors on discrimination. In practice, characteristics often overlap. The models that we present allow us to test, for example, whether religion has an additive effect for nationality groups. The models do not test multiplicative effects, namely whether religion has a different effect across nationality groups, as this was beyond the scope of the report.30
The regression modelling strategy that we follow allows us to look at the effect of membership of one equality group on the risk of discrimination separately by holding all the other characteristics constant. In each case, a subcategory within a group – for example within the ethnicity category White – is used as the reference group and the model estimates odds of discrimination for those in one of the other subcategories (Black, Asian, Other, Irish Traveller in the case of ethnicity) relative to this reference group.
The models also control for other characteristics related to the educational and financial resources people may have available, such as economic status, education qualifications and housing tenure. The relationship between these resources and discrimination is complex. On one hand, these factors affect individuals’ exposure and response to discrimination (since they may have less economic power). On the other hand, resource inequalities can be partially the outcome of discriminatory processes. Unemployment is a general indicator of economic vulnerability and, to some extent, being inactive in the labour market indicates a lack of direct access to income from employment. We would expect level of education to be related to a person’s knowledge of their entitlements and also to their level of competence and confidence in dealing with employers and service providers. Housing tenure is a good general indicator of resources. Local authority renters tend to be a particularly vulnerable group; private renters also tend to be less well-resourced than homeowners.31 We also identify three regions: the reference category, Dublin; Border Midlands and West (BMW); and the South and East region.32 For the work-related models, we include sector,
30 Multiplicative effects were not tested for a number of reasons. Firstly, allowing for multiplicative effects between equality groups would have introduced a high degree of complexity with the drawback of making difficult the interpretation of results. Secondly, such analysis would require a very large sample size and the low number of some equality groups would not permit that. Thirdly, previous research has shown that the presence of multiplicative effects across equality groups is far from being the norm (see, for example, Watson and Lunn (2010) on multiple disadvantages in education-related and labour market-related outcomes).
31 Those living in their accommodation rent-free are a very small group – only 1 per cent of the population – so are merged with those in private rented accommodation.
32 Dublin includes Dublin city and the regions of Dun Laoghaire/Rathdown, Fingal, and South Dublin. The Border, Midlands and West (BMW) includes the counties of Cavan, Donegal, Galway, Laois, Leitrim, Longford, Louth, Mayo, Monaghan, Offaly, Roscommon, Sligo and Westmeath. The South and East region includes the counties of Carlow, Clare, Cork, Kerry, Kilkenny, Kildare, Limerick, Meath, Tipperary (South), Waterford, Wexford and Wicklow.
The Equality module and how it is analysed | 15
occupation, employment status, part-time status and union membership. Including these controls in the models allows us to account for changes to the population, for example in terms of educational qualifications, when considering change over time.
However, given that these characteristics – such as education and employment status – may be associated with both equality groups and reported discrimination, the final model results should be considered as conservative estimates of discrimination (Tables A3 and A4 in the appendix report models with and without control variables).
The experience of discrimination in 2014 and change over time | 17
CHAPTER 4
The experience of discrimination in 2014 and change over time
4.1 RISK OF DISCRIMINATION IN 2014 AND OVER TIME
4.1.1 Introduction
The QNHS Equality module records self-reported discrimination over the previous two years, across nine different situations or contexts. For some of the analysis in this chapter, four major categories of discrimination have been used:
• in the workplace;
• while looking for work;
• in public services – education, health, transport and other publicservices;33 and
• in private services – shops/pubs/restaurants, banks and other financialservices and housing.34
This chapter first examines the rates of reported discrimination within these contexts in 2014 and any changes between 2010 and 2014.35 It then goes on to consider how these rates vary across equality groups for the four broad contexts. Statistical models of discrimination risk, and change in this respect over time, are presented in Chapter 5.
4.1.2 Risk of discrimination in 2014
In total, 14,849 respondents were included in the special module of the survey, which was carried out in the third quarter of 2014. The rates of discrimination reported below are based on the ‘eligible population’ within this sample that has been weighted to represent the population of Ireland.36
This means that respondents who indicated that a particular question was not applicable to them were excluded; for example, those who did not use any housing or education services in the previous two years, or those who were not looking for work or not currently employed in a workplace. Appendix Table A2 presents the eligible
33 Education and health services are also supplied by private and voluntary sector providers; however, in the great majority of cases these also receive funding from the state so are classified public services.
34 While housing is also a public service, it has been categorised as a private service for the purpose of our analysis because there is a very high level of private home ownership in Ireland and because a low proportion of the population live in public housing. Less than 10 per cent of the population live in local authority housing (Table A1).
35 Some domains consist of multiple questions (private and public services) and others of singular (at work and while looking for work). This may impede direct comparison as there is more chance of exposure to discrimination in domains with multiple contexts, though readers should note exposure will vary across domains in any case.
36 The data are weighted using CSO QNHS survey weights derived from grossing factors based on total population estimates.
18 | Who experiences discrimination?
population in each case. Using only eligible cases allows us to calculate a more accurate rate of discrimination in each context.
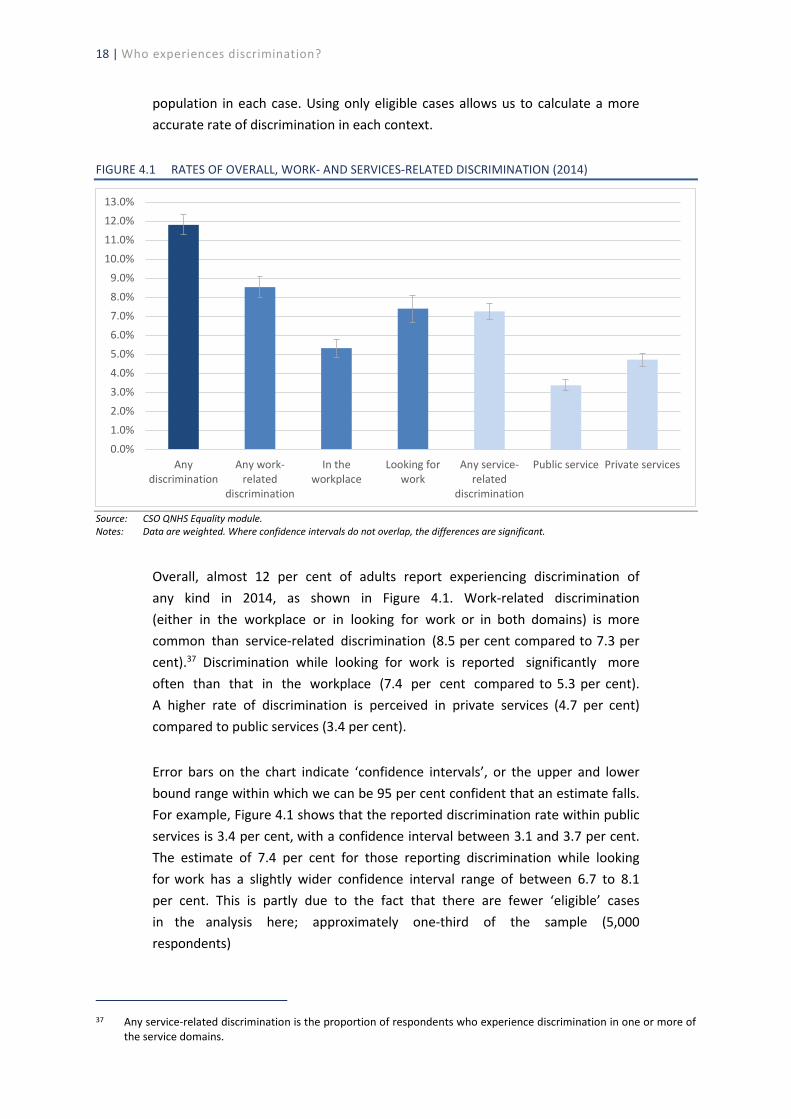
FIGURE 4.1 RATES OF OVERALL, WORK- AND SERVICES-RELATED DISCRIMINATION (2014)
0.0%
1.0%
2.0%
3.0%
4.0%
5.0%
6.0%
7.0%
8.0%
9.0%
10.0%
11.0%
12.0%
13.0%
Any discrimination
Any work-related
discrimination
In the workplace
Looking for work
Any service-related
discrimination
Public service Private services
Source: CSO QNHS Equality module. Notes: Data are weighted. Where confidence intervals do not overlap, the differences are significant.
Overall, almost 12 per cent of adults report experiencing discrimination of any kind in 2014, as shown in Figure 4.1. Work-related discrimination (either in the workplace or in looking for work or in both domains) is more common than service-related discrimination (8.5 per cent compared to 7.3 per cent).37 Discrimination while looking for work is reported significantly more often than that in the workplace (7.4 per cent compared to 5.3 per cent). A higher rate of discrimination is perceived in private services (4.7 per cent) compared to public services (3.4 per cent).
Error bars on the chart indicate ‘confidence intervals’, or the upper and lower bound range within which we can be 95 per cent confident that an estimate falls. For example, Figure 4.1 shows that the reported discrimination rate within public services is 3.4 per cent, with a confidence interval between 3.1 and 3.7 per cent. The estimate of 7.4 per cent for those reporting discrimination while looking for work has a slightly wider confidence interval range of between 6.7 to 8.1 per cent. This is partly due to the fact that there are fewer ‘eligible’ cases in the analysis here; approximately one-third of the sample (5,000 respondents)
Any service-related discrimination is the proportion of respondents who experience discrimination in one or more of the service domains.
37
•
The experience of discrimination in 2014 and change over time | 19
reported looking for work in the previous two years, compared to the almost full sample of about 14,845 who accessed public services (see also Table A2).38
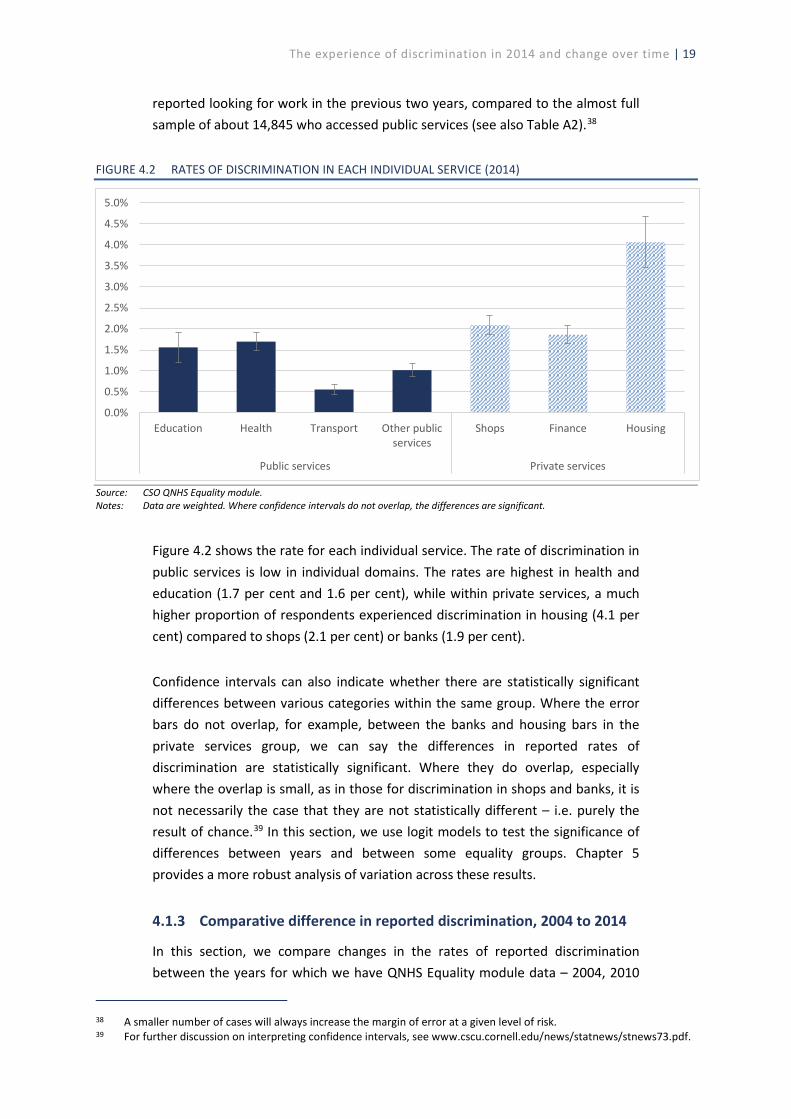
FIGURE 4.2 RATES OF DISCRIMINATION IN EACH INDIVIDUAL SERVICE (2014)
0.0%
0.5%
1.0%
1.5%
2.0%
2.5%
3.0%
3.5%
4.0%
4.5%
5.0%
Education Health Transport Other public services
Shops Finance Housing
Public services Private services
Source: CSO QNHS Equality module. Notes: Data are weighted. Where confidence intervals do not overlap, the differences are significant.
Figure 4.2 shows the rate for each individual service. The rate of discrimination in public services is low in individual domains. The rates are highest in health and education (1.7 per cent and 1.6 per cent), while within private services, a much higher proportion of respondents experienced discrimination in housing (4.1 per cent) compared to shops (2.1 per cent) or banks (1.9 per cent).
Confidence intervals can also indicate whether there are statistically significant differences between various categories within the same group. Where the error bars do not overlap, for example, between the banks and housing bars in the private services group, we can say the differences in reported rates of discrimination are statistically significant. Where they do overlap, especially where the overlap is small, as in those for discrimination in shops and banks, it is not necessarily the case that they are not statistically different – i.e. purely the result of chance.39 In this section, we use logit models to test the significance of differences between years and between some equality groups. Chapter 5 provides a more robust analysis of variation across these results.
4.1.3 Comparative difference in reported discrimination, 2004 to 2014
In this section, we compare changes in the rates of reported discrimination between the years for which we have QNHS Equality module data – 2004, 2010
38 A smaller number of cases will always increase the margin of error at a given level of risk. 39 For further discussion on interpreting confidence intervals, see www.cscu.cornell.edu/news/statnews/stnews73.pdf.
--T- t ~
>> -IT._.):._.
•••••••••• ~
. :::: .
20 | Who experiences discrimination?
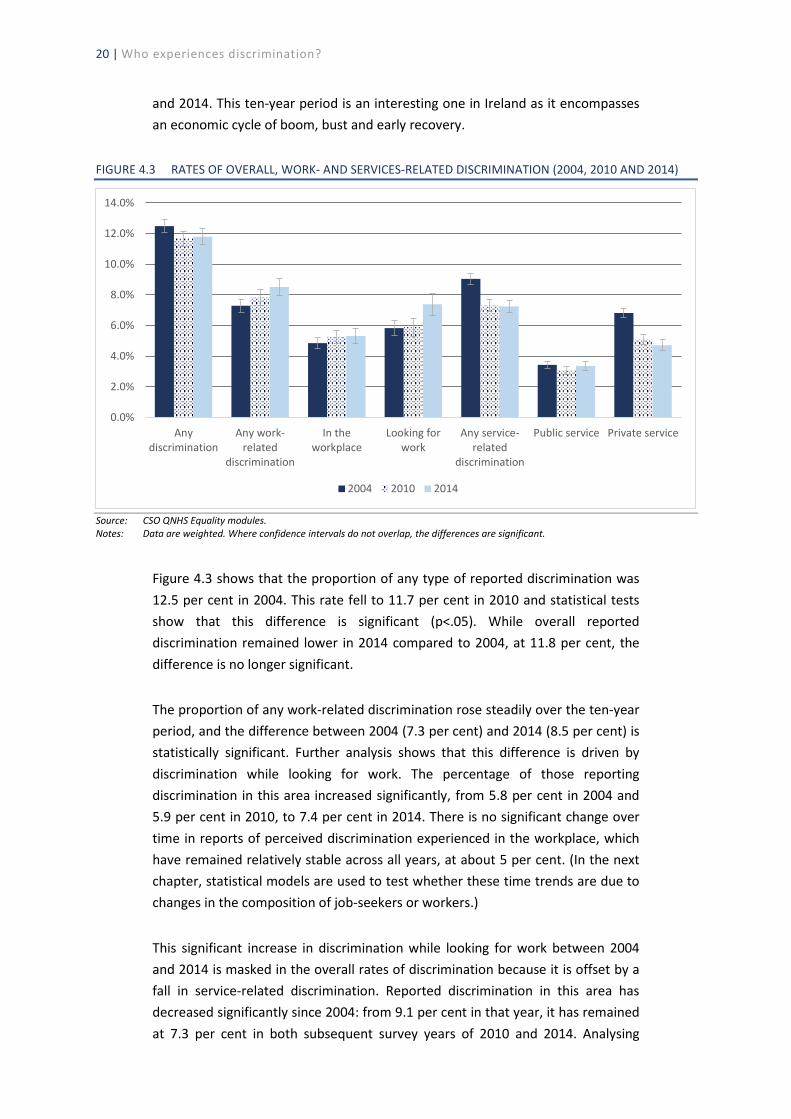
and 2014. This ten-year period is an interesting one in Ireland as it encompasses an economic cycle of boom, bust and early recovery.
FIGURE 4.3 RATES OF OVERALL, WORK- AND SERVICES-RELATED DISCRIMINATION (2004, 2010 AND 2014)
0.0%
2.0%
4.0%
6.0%
8.0%
10.0%
12.0%
14.0%
Any discrimination
Any work-related
discrimination
In the workplace
Looking for work
Any service-related
discrimination
Public service Private service
2004 2010 2014
Source: CSO QNHS Equality modules. Notes: Data are weighted. Where confidence intervals do not overlap, the differences are significant.
Figure 4.3 shows that the proportion of any type of reported discrimination was 12.5 per cent in 2004. This rate fell to 11.7 per cent in 2010 and statistical tests show that this difference is significant (p<.05). While overall reported discrimination remained lower in 2014 compared to 2004, at 11.8 per cent, the difference is no longer significant.
The proportion of any work-related discrimination rose steadily over the ten-year period, and the difference between 2004 (7.3 per cent) and 2014 (8.5 per cent) is statistically significant. Further analysis shows that this difference is driven by discrimination while looking for work. The percentage of those reporting discrimination in this area increased significantly, from 5.8 per cent in 2004 and 5.9 per cent in 2010, to 7.4 per cent in 2014. There is no significant change over time in reports of perceived discrimination experienced in the workplace, which have remained relatively stable across all years, at about 5 per cent. (In the next chapter, statistical models are used to test whether these time trends are due to changes in the composition of job-seekers or workers.)
This significant increase in discrimination while looking for work between 2004 and 2014 is masked in the overall rates of discrimination because it is offset by a fall in service-related discrimination. Reported discrimination in this area has decreased significantly since 2004: from 9.1 per cent in that year, it has remained at 7.3 per cent in both subsequent survey years of 2010 and 2014. Analysing
11 .·.·.·.·. ,
. -:-: .
The experience of discrimination in 2014 and change over time | 21
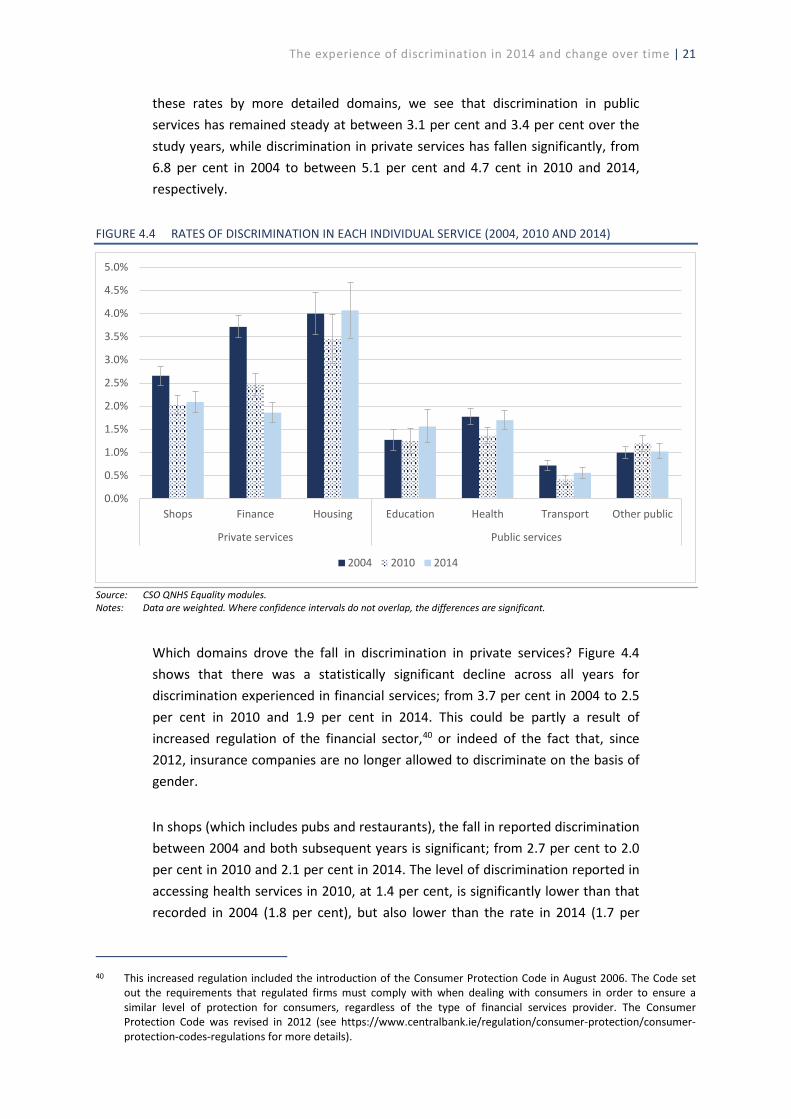
these rates by more detailed domains, we see that discrimination in public services has remained steady at between 3.1 per cent and 3.4 per cent over the study years, while discrimination in private services has fallen significantly, from 6.8 per cent in 2004 to between 5.1 per cent and 4.7 cent in 2010 and 2014, respectively.
FIGURE 4.4 RATES OF DISCRIMINATION IN EACH INDIVIDUAL SERVICE (2004, 2010 AND 2014)
0.0%
0.5%
1.0%
1.5%
2.0%
2.5%
3.0%
3.5%
4.0%
4.5%
5.0%
Shops Finance Housing Education Health Transport Other public
Private services Public services
2004 2010 2014
Source: CSO QNHS Equality modules. Notes: Data are weighted. Where confidence intervals do not overlap, the differences are significant.
Which domains drove the fall in discrimination in private services? Figure 4.4 shows that there was a statistically significant decline across all years for discrimination experienced in financial services; from 3.7 per cent in 2004 to 2.5 per cent in 2010 and 1.9 per cent in 2014. This could be partly a result of increased regulation of the financial sector,40 or indeed of the fact that, since 2012, insurance companies are no longer allowed to discriminate on the basis of gender.
In shops (which includes pubs and restaurants), the fall in reported discrimination between 2004 and both subsequent years is significant; from 2.7 per cent to 2.0 per cent in 2010 and 2.1 per cent in 2014. The level of discrimination reported in accessing health services in 2010, at 1.4 per cent, is significantly lower than that recorded in 2004 (1.8 per cent), but also lower than the rate in 2014 (1.7 per
This increased regulation included the introduction of the Consumer Protection Code in August 2006. The Code set out the requirements that regulated firms must comply with when dealing with consumers in order to ensure a similar level of protection for consumers, regardless of the type of financial services provider. The Consumer Protection Code was revised in 2012 (see https://www.centralbank.ie/regulation/consumer-protection/consumer-protection-codes-regulations for more details).
40
22 | Who experiences discrimination?
cent). For transport services, the fall from 0.8 per cent in 2004 to 0.4 per cent in 2010 is significant, but there was no significant change in this domain between 2010 and 2014. Changes in reported levels of discrimination in education, housing and other public services are not statistically significant.
It is worth noting that the highest rate of discrimination reported in any service area is in housing. This could be due to a severe shortage of housing supply in Ireland, which was emerging in 2014 (Duffy et al., 2014), leading to a higher demand among prospective tenants or house-buyers and thus a greater opportunity for housing providers to discriminate. As discussed earlier, the potential for differences between years to be significant here is reduced due to the lower number of cases in this group, as seen in the wider margins of error.
In interpreting these descriptive trends in discrimination, one has to keep in mind that the composition of the Irish population has changed over time – it has aged and become more educated, while home ownership has fallen and unemployment has risen (Table A1 in the appendix). Changes in the population/size of some groups may be important for assessing change in rates of discrimination: an increase in overall discrimination over time might be due to the increase in size of one highly discriminated group, even if the level of discrimination experienced did not increase. Using statistical models in Chapter 5, we are able to model the risks of discrimination and assess changes over time independently of the changes in the composition of the population.
4.2 RISK OF DISCRIMINATION FOR DIFFERENT EQUALITY GROUPS IN 2014
This section examines differences in the rates of discrimination reported in 2014 by certain socio-demographic sub-groups. Insofar as possible, these sub-groups are defined to reflect the equality grounds covered by the equality legislation (see Section 3.2 above). It is important to note that the perceived reason, or ground, for discrimination is not included in this analysis; that is, we have not examined whether the respondent attributed discrimination to the particular characteristic examined. For example, women did not necessarily attribute discrimination to their gender. Table A5 in the appendix presents a summary of the stated grounds on which respondents perceived discrimination to have occurred across the broad domains or contexts.
For the purpose of brevity, we focus only on discrimination in the four broad categories: in the workplace; while looking for work; accessing public services; and accessing private services. This is a compromise between examining the
The experience of discrimination in 2014 and change over time | 23
broad ‘any discrimination category’ and individual service domains.41 Note that while we restrict analysis to the eligible population, we cannot control for exposure to discrimination. Some groups, such as those with a disability, may use health services much more frequently than those without a disability.
4.2.1 Discrimination in the workplace and equality groups
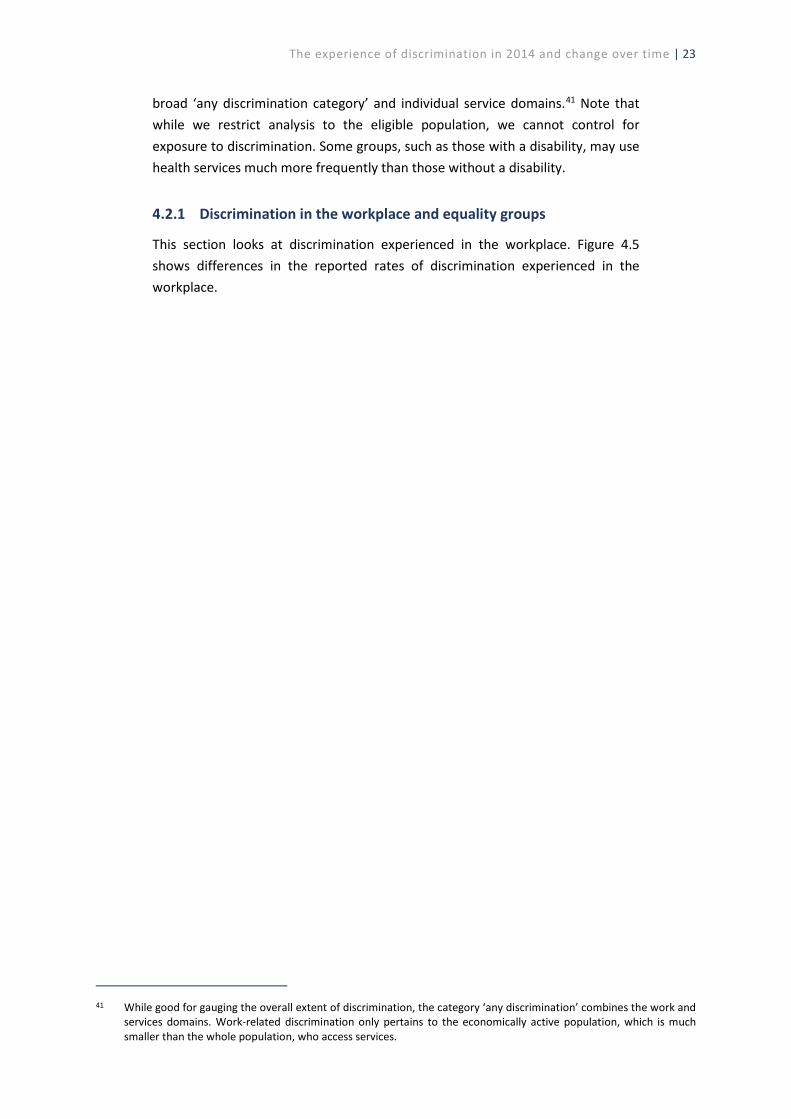
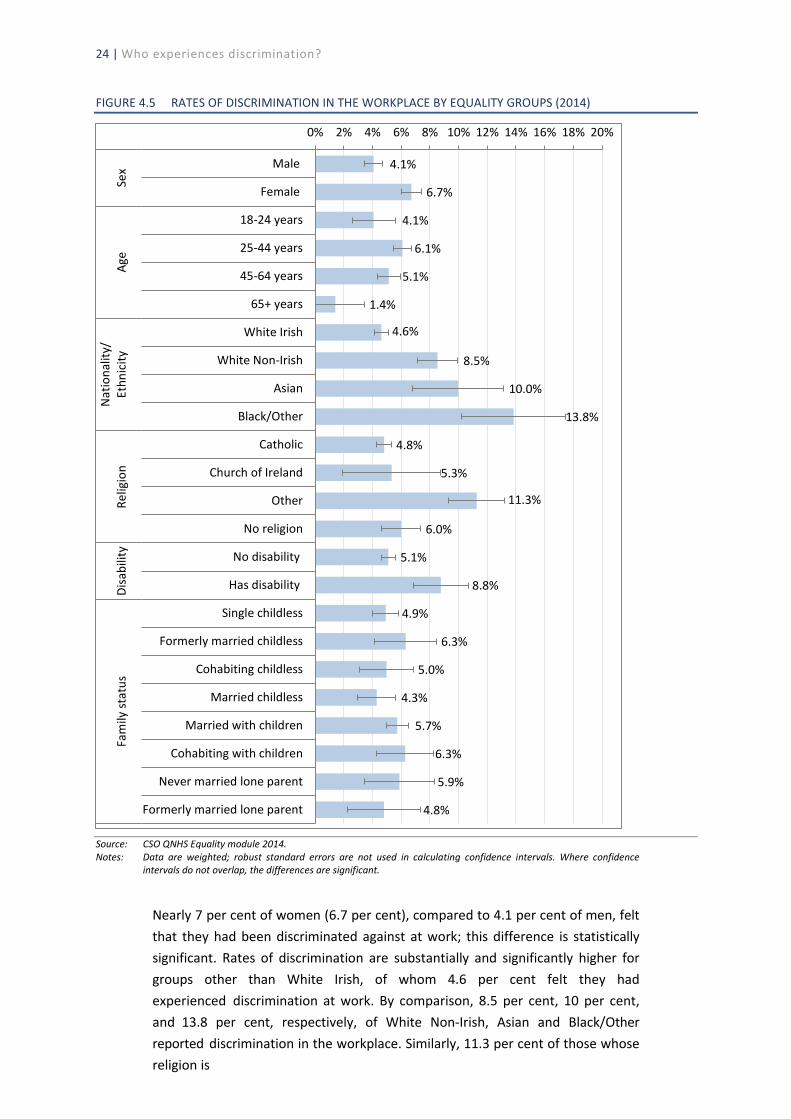
This section looks at discrimination experienced in the workplace. Figure 4.5 shows differences in the reported rates of discrimination experienced in the workplace.
While good for gauging the overall extent of discrimination, the category ‘any discrimination’ combines the work and services domains. Work-related discrimination only pertains to the economically active population, which is much smaller than the whole population, who access services.
41
1-----i
1----1
--:----i ---,--:...___..
1-----i
1----,-1
-----, ___J
1--1
I
I
- 1---i
I
I
____:_______,._
- i-------l-----1
~
---, ~
I
~
I
I
I
1---1
I
I
-I
.I
24 | Who experiences discrimination?
FIGURE 4.5 RATES OF DISCRIMINATION IN THE WORKPLACE BY EQUALITY GROUPS (2014)
4.1%
6.7%
4.1%
6.1%
5.1%
1.4%
4.6%
8.5%
10.0%
13.8%
4.8%
5.3%
11.3%
6.0%
5.1%
8.8%
4.9%
6.3%
5.0%
4.3%
5.7%
6.3%
5.9%
4.8%
0% 2% 4% 6% 8% 10% 12% 14% 16% 18% 20%
Male
Female
18-24 years
25-44 years
45-64 years
65+ years
White Irish
White Non-Irish
Asian
Black/Other
Catholic
Church of Ireland
Other
No religion
No disability
Has disability
Single childless
Formerly married childless
Cohabiting childless
Married childless
Married with children
Cohabiting with children
Never married lone parent
Formerly married lone parent
Sex
Age
Nat
iona
lity/
Ethn
icity
Relig
ion
Disa
bilit
yFa
mily
stat
us
Source: CSO QNHS Equality module 2014. Notes: Data are weighted; robust standard errors are not used in calculating confidence intervals. Where confidence
intervals do not overlap, the differences are significant.
Nearly 7 per cent of women (6.7 per cent), compared to 4.1 per cent of men, felt that they had been discriminated against at work; this difference is statistically significant. Rates of discrimination are substantially and significantly higher for groups other than White Irish, of whom 4.6 per cent felt they had experienced discrimination at work. By comparison, 8.5 per cent, 10 per cent, and 13.8 per cent, respectively, of White Non-Irish, Asian and Black/Other reported discrimination in the workplace. Similarly, 11.3 per cent of those whose religion is
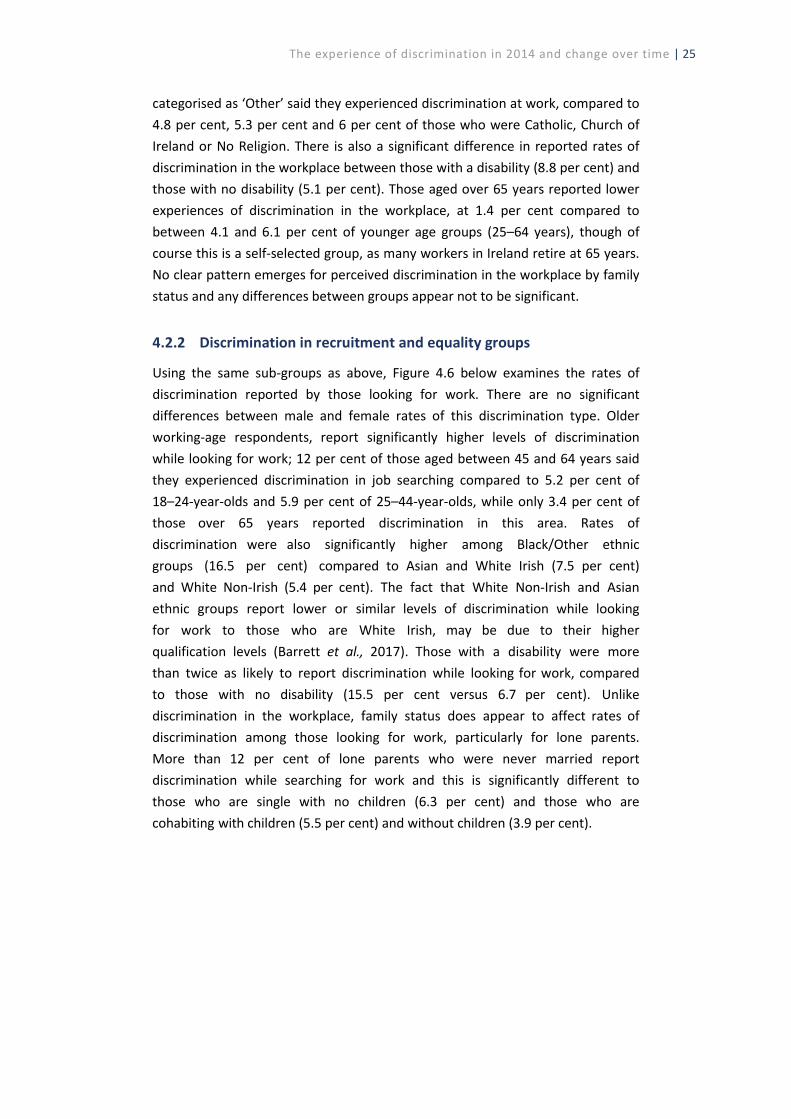
The experience of discrimination in 2014 and change over time | 25
categorised as ‘Other’ said they experienced discrimination at work, compared to 4.8 per cent, 5.3 per cent and 6 per cent of those who were Catholic, Church of Ireland or No Religion. There is also a significant difference in reported rates of discrimination in the workplace between those with a disability (8.8 per cent) and those with no disability (5.1 per cent). Those aged over 65 years reported lower experiences of discrimination in the workplace, at 1.4 per cent compared to between 4.1 and 6.1 per cent of younger age groups (25–64 years), though of course this is a self-selected group, as many workers in Ireland retire at 65 years. No clear pattern emerges for perceived discrimination in the workplace by family status and any differences between groups appear not to be significant.
4.2.2 Discrimination in recruitment and equality groups
Using the same sub-groups as above, Figure 4.6 below examines the rates of discrimination reported by those looking for work. There are no significant differences between male and female rates of this discrimination type. Older working-age respondents, report significantly higher levels of discrimination while looking for work; 12 per cent of those aged between 45 and 64 years said they experienced discrimination in job searching compared to 5.2 per cent of 18–24-year-olds and 5.9 per cent of 25–44-year-olds, while only 3.4 per cent of those over 65 years reported discrimination in this area. Rates of discrimination were also significantly higher among Black/Other ethnic groups (16.5 per cent) compared to Asian and White Irish (7.5 per cent) and White Non-Irish (5.4 per cent). The fact that White Non-Irish and Asian ethnic groups report lower or similar levels of discrimination while looking for work to those who are White Irish, may be due to their higher qualification levels (Barrett et al., 2017). Those with a disability were more than twice as likely to report discrimination while looking for work, compared to those with no disability (15.5 per cent versus 6.7 per cent). Unlike discrimination in the workplace, family status does appear to affect rates of discrimination among those looking for work, particularly for lone parents. More than 12 per cent of lone parents who were never married report discrimination while searching for work and this is significantly different to those who are single with no children (6.3 per cent) and those who are cohabiting with children (5.5 per cent) and without children (3.9 per cent).
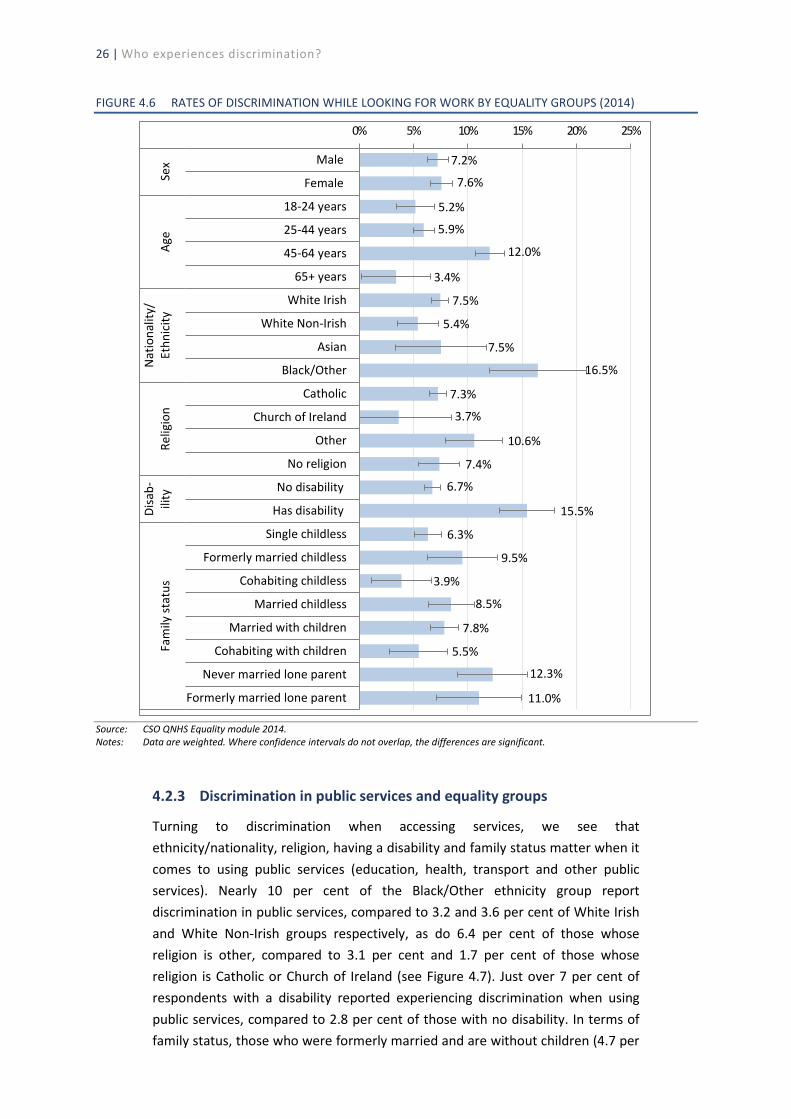
1---l
1----t
t-------1
1---l
~ -__j
1---i
_____.____,
1-T-l -- 1
1-,-l
1-----i
I
....J
---, __J
J
1----'----l
---:------, ______:________ -
26 | Who experiences discrimination?
FIGURE 4.6 RATES OF DISCRIMINATION WHILE LOOKING FOR WORK BY EQUALITY GROUPS (2014)
7.2%
7.6%
5.2%
5.9%
12.0%
3.4%
7.5%
5.4%
7.5%
16.5%
7.3%
3.7%
10.6%
7.4%
6.7%
15.5%
6.3%
9.5%
3.9%
8.5%
7.8%
5.5%
12.3%
11.0%
0% 5% 10% 15% 20% 25%
Male
Female
18-24 years
25-44 years
45-64 years
65+ years
White Irish
White Non-Irish
Asian
Black/Other
Catholic
Church of Ireland
Other
No religion
No disability
Has disability
Single childless
Formerly married childless
Cohabiting childless
Married childless
Married with children
Cohabiting with children
Never married lone parent
Formerly married lone parent
Sex
Age
Nat
iona
lity/
Ethn
icity
Relig
ion
Disa
b-ili
tyFa
mily
stat
us
Source: CSO QNHS Equality module 2014. Notes: Data are weighted. Where confidence intervals do not overlap, the differences are significant.
4.2.3 Discrimination in public services and equality groups
Turning to discrimination when accessing services, we see that ethnicity/nationality, religion, having a disability and family status matter when it comes to using public services (education, health, transport and other public services). Nearly 10 per cent of the Black/Other ethnicity group report discrimination in public services, compared to 3.2 and 3.6 per cent of White Irish and White Non-Irish groups respectively, as do 6.4 per cent of those whose religion is other, compared to 3.1 per cent and 1.7 per cent of those whose religion is Catholic or Church of Ireland (see Figure 4.7). Just over 7 per cent of respondents with a disability reported experiencing discrimination when using public services, compared to 2.8 per cent of those with no disability. In terms of family status, those who were formerly married and are without children (4.7 per
The experience of discrimination in 2014 and change over time | 27
cent) and lone parents who never married (5.9 per cent) report significantly higher levels of discrimination compared to those who are single and childless, cohabiting and childless, or married with children.
FIGURE 4.7 RATES OF DISCRIMINATION IN PUBLIC SERVICES BY EQUALITY GROUPS (2014)
3.0%
3.7%
3.5%
3.1%
3.8%
3.1%
3.2%
3.6%
5.3%
9.6%
3.1%
1.7%
6.4%
4.4%
2.8%
7.2%
2.9%
4.7%
2.4%
3.4%
2.8%
4.2%
5.9%
4.8%
0% 2% 4% 6% 8% 10% 12% 14%
Male
Female
18-24 years
25-44 years
45-64 years
65+ years
White Irish
White Non-Irish
Asian
Black/Other
Catholic
Church of Ireland
Other
No religion
No disability
Has disability
Single childless
Formerly married childless
Cohabiting childless
Married childless
Married with children
Cohabiting with children
Never married lone parent
Formerly married lone parent
Sex
Age
Nat
iona
lity/
Ethn
icity
Relig
ion
Disa
b-ili
tyFa
mily
stat
us
Source: CSO QNHS Equality module 2014. Notes: Data are weighted. Where confidence intervals do not overlap, the differences are significant.
4.2.4 Discrimination in the private services and equality groups
Figure 4.8 shows that reported rates of discrimination within private services vary significantly within all the socio-demographic groupings. (This area includes use of shops, restaurants, banks/other financial services and housing services.)
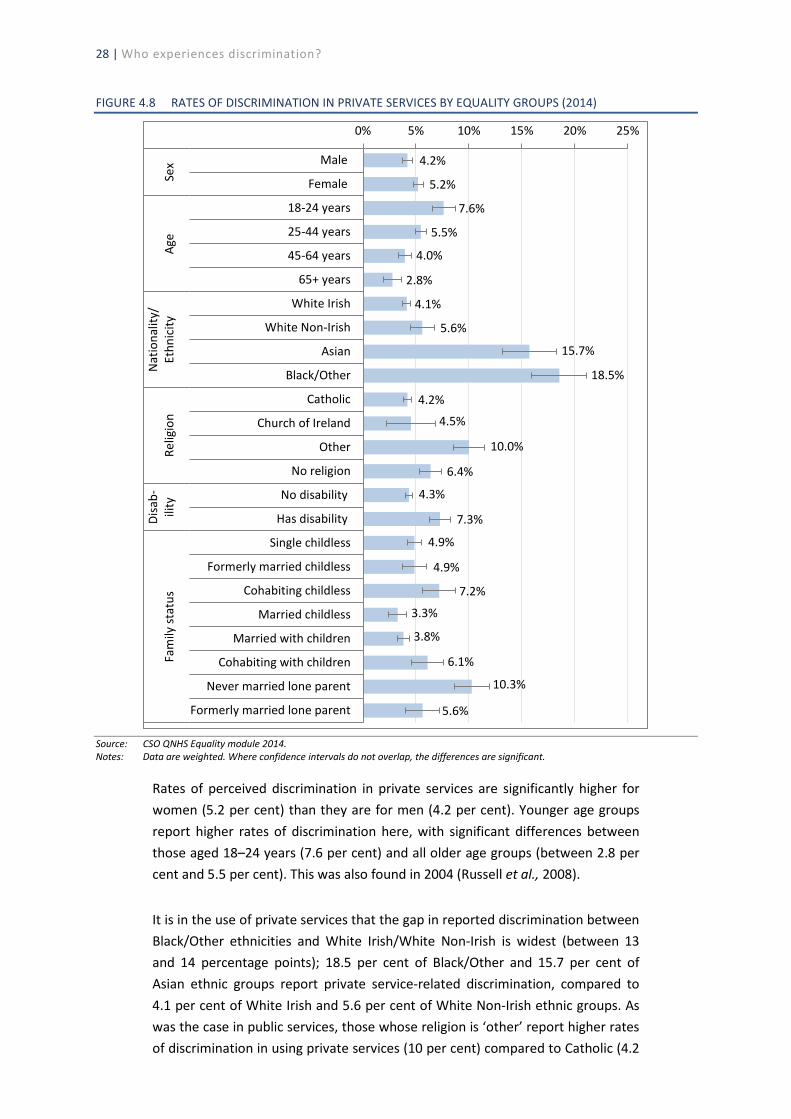
-- 1---"--t
H
H
1---1
28 | Who experiences discrimination?
FIGURE 4.8 RATES OF DISCRIMINATION IN PRIVATE SERVICES BY EQUALITY GROUPS (2014)
4.2%
5.2%
7.6%
5.5%
4.0%
2.8%
4.1%
5.6%
15.7%
18.5%
4.2%
4.5%
10.0%
6.4%
4.3%
7.3%
4.9%
4.9%
7.2%
3.3%
3.8%
6.1%
10.3%
5.6%
0% 5% 10% 15% 20% 25%
Male
Female
18-24 years
25-44 years
45-64 years
65+ years
White Irish
White Non-Irish
Asian
Black/Other
Catholic
Church of Ireland
Other
No religion
No disability
Has disability
Single childless
Formerly married childless
Cohabiting childless
Married childless
Married with children
Cohabiting with children
Never married lone parent
Formerly married lone parent
Sex
Age
Nat
iona
lity/
Ethn
icity
Relig
ion
Disa
b-ili
tyFa
mily
stat
us
Source: CSO QNHS Equality module 2014. Notes: Data are weighted. Where confidence intervals do not overlap, the differences are significant.
Rates of perceived discrimination in private services are significantly higher for women (5.2 per cent) than they are for men (4.2 per cent). Younger age groups report higher rates of discrimination here, with significant differences between those aged 18–24 years (7.6 per cent) and all older age groups (between 2.8 per cent and 5.5 per cent). This was also found in 2004 (Russell et al., 2008).
It is in the use of private services that the gap in reported discrimination between Black/Other ethnicities and White Irish/White Non-Irish is widest (between 13 and 14 percentage points); 18.5 per cent of Black/Other and 15.7 per cent of Asian ethnic groups report private service-related discrimination, compared to 4.1 per cent of White Irish and 5.6 per cent of White Non-Irish ethnic groups. As was the case in public services, those whose religion is ‘other’ report higher rates of discrimination in using private services (10 per cent) compared to Catholic (4.2
The experience of discrimination in 2014 and change over time | 29
per cent), Church of Ireland (4.5 per cent) and No Religion (6.4 per cent). Those with a disability reported more discrimination accessing private services (7.3 per cent) than those with no disability (4.3 per cent). Once again, never-married lone parents reported the highest rate of discrimination (10.3 per cent), significantly higher than those who were single or formerly married without children (4.9 per cent), married without children and married or cohabiting with children (3.3 per cent, 3.8 per cent and 6.1 per cent respectively). This group was also significantly different to the group of formerly married lone parents, of whom 5.6 per cent reported private service-related discrimination. Those who were married, both with and without children, reported the lowest rates of private service-related discrimination (3.8 and 3.3 per cent respectively), significantly lower than those who were single or formerly married and childless, cohabiting with children and never-married lone parents.
In summary, reports of statistically higher levels of perceived discrimination in the workplace were found for women, groups other than White Irish, those whose religion is categorised as Other and those with a disability, while reports of this type of discrimination are significantly lower for those aged 65 and over. Among those looking for work, the older working-age group (45–64 years), Black/Other ethnic groups, those with a disability and never-married lone parents reported significantly more discrimination. Higher levels of perceived discrimination in public services are experienced by Black/other ethnic groups, those whose religion is categorised as Other, people with a disability and those who are formerly married without children and never-married lone parents. Discrimination in private services is more likely to be reported by younger age groups (18–24 years and 25–44 years), those from Black or Other ethnic groups, Asians, those whose religion is Other, those with a disability and never-married lone parents.
Modelling the risk of work- and services-related discrimination | 31
CHAPTER 5 Modelling the risk of work- and services-related discrimination
5.1 INTRODUCTION
This chapter uses statistical modelling to explore variation between the different equality groups in relation to their experience of perceived work- and services-related discrimination while holding other characteristics constant. For example, we can examine whether women continue to report higher levels of discrimination in the workplace after we account for differences in age, nationality/ethnicity, religion, disability and family status. The models also control for differences between individuals within groups, in terms of education, region and housing tenure.42
Inclusion of these additional controls means that reported estimates are conservative in some cases, because the controls themselves may be the outcome of discrimination; for example, housing tenure may be the outcome of inability to secure credit or discrimination by a landlord. Tables A3 and A4 in the appendix show the full set of results both before and after adding additional controls.
Section 5.2 presents models of work-related discrimination, while Section 5.3 presents models of discrimination in public and private services, both relating to 2014. In Section 5.4, we compare changes between the years 2004, 2010 and 2014 in reported levels of work- and services-related discrimination, and then look at how perceived discrimination has changed over this time period for some of the equality groups.
5.2 WORK-RELATED DISCRIMINATION
This section presents logistic regression models of the risk of discrimination in the workplace and looking for work. Section 5.3 presents models of public and private services, which allow us to check whether the equality group differences presented earlier, in Section 4.2, remain when other differences between individuals are controlled (see Section 3.2 for a discussion).
The models for work-related discrimination also control for sector, occupation and other job characteristics. The services-related discrimination model includes an additional control for principle economic status.
42
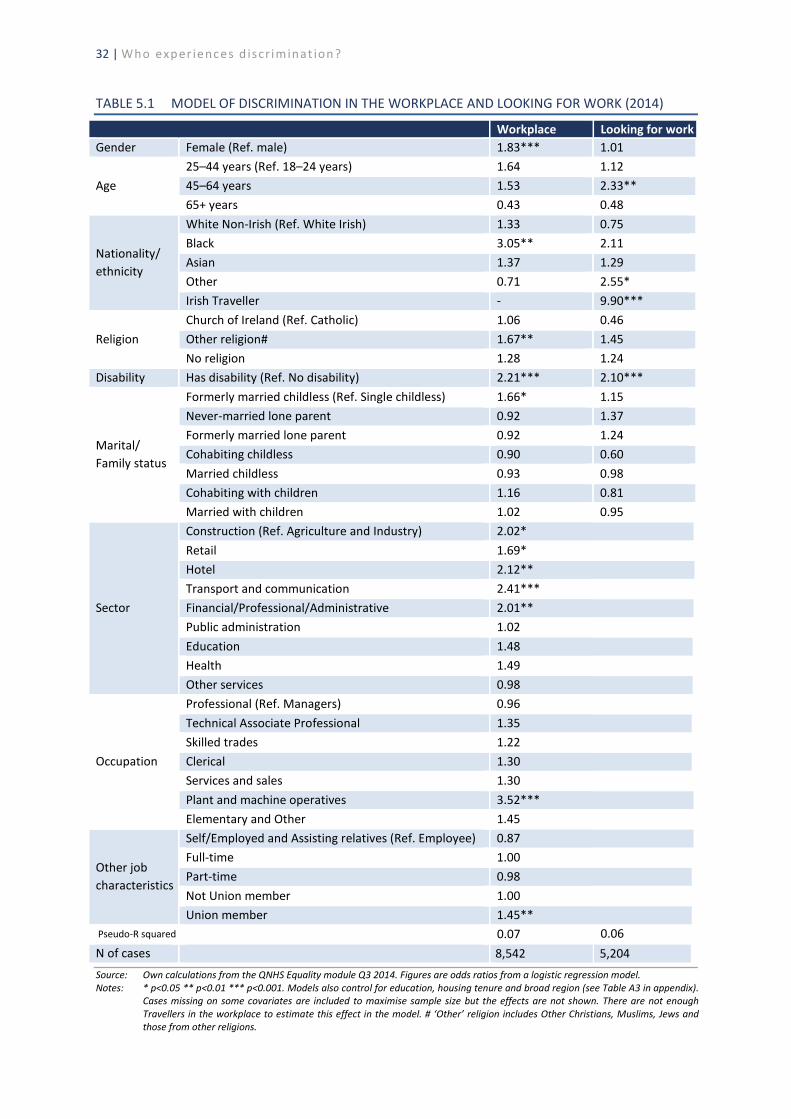
Workplace Looking for work Gender Female (Ref. male) 1.83*** 1.01
Age
Nationality/ ethnicity
25–44 years (Ref. 18–24 years) 1.64 1.12
65+ years 0.43 0.48
Black 3.05** 2.11
Other 0.71 2.55*
45–64 years 1.53 2.33**
White Non-Irish (Ref. White Irish) 1.33 0.75
Asian 1.37 1.29
Irish Traveller - 9.90*** Church of Ireland (Ref. Catholic) 1.06 0.46
Religion No religion 1.28 1.24 Other religion# 1.67** 1.45
Disability Has disability (Ref. No disability) 2.21*** 2.10***
Marital/ Family status
Formerly married childless (Ref. Single childless) 1.66* 1.15
Formerly married lone parent 0.92 1.24
Married childless 0.93 0.98
Married with children 1.02 0.95
Never-married lone parent 0.92 1.37
Cohabiting childless 0.90 0.60
Cohabiting with children 1.16 0.81
Construction (Ref. Agriculture and Industry) 2.02*
Sector
Retail 1.69*
Transport and communication 2.41***
Public administration 1.02
Health 1.49
Hotel 2.12**
Financial/Professional/Administrative 2.01**
Education 1.48
Other services 0.98
Occupation
Professional (Ref. Managers) 0.96
Skilled trades 1.22
Services and sales 1.30
Elementary and Other 1.45
Technical Associate Professional 1.35
Clerical 1.30
Plant and machine operatives 3.52***
Self/Employed and Assisting relatives (Ref. Employee) 0.87 Full-time 1.00
Other job characteristics
Not Union member 1.00 Part-time 0.98
Union member 1.45** Pseudo-R squared 0.07 0.06 N of cases 8,542 5,204
32 | Who exp er iences d iscr iminat ion ?
TABLE 5.1 MODEL OF DISCRIMINATION IN THE WORKPLACE AND LOOKING FOR WORK (2014)
Source: Own calculations from the QNHS Equality module Q3 2014. Figures are odds ratios from a logistic regression model. Notes: * p<0.05 ** p<0.01 *** p<0.001. Models also control for education, housing tenure and broad region (see Table A3 in appendix).
Cases missing on some covariates are included to maximise sample size but the effects are not shown. There are not enough Travellers in the workplace to estimate this effect in the model. # ‘Other’ religion includes Other Christians, Muslims, Jews and those from other religions.
43
44
45
Modelling the risk of work- and services-related discrimination | 33
Table 5.1 presents odds estimated from logistic regression models. If the odds of experiencing discrimination for any subgroup are greater than one, this group is more likely to experience discrimination than the reference category (whose odds are one). By contrast, if the odds for any group are less than one, the group are less likely to experience discrimination. The models also allow us to determine whether the results are robust or ‘statistically significant’, i.e. whether we can be confident that the differences would not have been generated by chance, given the sample size in each case (indicated by *** in the tables).
The workplace model tests group differences between the equality groups and also includes workplace characteristics like sector and occupation for those currently working (see Table 5.1). Additional controls for education, housing tenure and broad region are included in the model but not presented in Table 5.1 (see Table A3 for full model results without additional controls). Respondents who reported discrimination at work were asked what form this had taken. Bullying and harassment was the most common form of discrimination, followed by working conditions.43
In terms of group differences, from Table 5.1 we see that in the workplace, women are almost twice as likely as men to report discrimination, controlling for other factors. This echoes previous results (Russell et al., 2008 and McGinnity et al., 2012), though the effect is larger in 2014. Discrimination around pay and promotion was more frequently mentioned by female respondents, which is consistent with evidence on the gender pay gap and the low female representation in the most senior positions in the Irish labour market (Russell et al., 2014; O’Connor, 2015).
Table 5.1 shows no significant age differences in perceived discrimination in the workplace in 2014, but in terms of nationality/ethnicity, Black respondents were over three times more likely to report discrimination than White Irish respondents. White Non-Irish (typically White migrants) were somewhat more likely to report discrimination (1.3 times), but this is not statistically significant.44
Asian and ‘Other’ ethnic groups did not differ from White Irish, and there were not enough Travellers in the workplace to estimate an effect for this group.45
Those from a minority (‘other’) religion were 1.7 times more likely to say they experienced discrimination in the workplace than Catholics, even controlling for
Respondents were asked which of the following best described the type of discrimination experienced: bullying or harassment (32%), work conditions (22%), promotion (16%), pay (12%) and other (18%). Before controlling for sector and occupation, this group is significantly different from white Irish. This suggest that the jobs white non-Irish do, in terms of sector and occupation, offer part of the explanation as to why they might experience workplace discrimination: once we account for this difference, their experiences is not different from white Irish. This is consistent with very low employment rates of Travellers found in Watson et al. (2017), which of course in itself could be an outcome of discrimination in education and in seeking work.
34 | Who exp er iences d iscr iminat ion ?
nationality/ethnicity; those who report No Religion were 1.3 times more likely than Catholics to report discrimination but this is not significant.
People with a disability were over twice as likely to report workplace discrimination as those without a disability in 2014 though there was no difference in workplace discrimination by disability status in 2010 (McGinnity et al., 2012). In terms of marital/family status, aside from a somewhat higher risk of workplace discrimination for formerly married childless people compared to single childless adults, there are no differences between those in the single childless category and any of the other groups.
Table 5.1 also shows that, in terms of industrial sector, compared to agriculture and manufacturing, respondents are more likely to experience discrimination in construction, retail (sales), hotels/restaurants, transport and communication, as well as in the financial/professional and administrative (private) sector. Those working in public administration, health and education, all largely public sector, do not differ from agriculture and manufacturing, nor do those in the ‘other services’ category.46
Formalisation of personnel practices within an organisation reduces individual discretion, and may constrain the biasing effects of either cognitive or attitudinal biases (Pager and Shepherd, 2008). It could be that more formalised procedures in the public sector regarding pay, promotion and equality of treatment are associated with lower discrimination.47
In terms of occupations, plant and machine operatives are almost four times more likely to report workplace discrimination than managers. Workers in elementary occupations are 1.5 times more likely to report discrimination, though the effect is not significant. Other occupational groups do not differ from managers when sector is accounted for. Union members are also more likely to report discrimination than non-union members.48 Other job characteristics (for example, part-time versus full-time, employees versus self-employed) do not show significant effects when all other controls are included.
What about differences in the perception of discrimination while looking for work? As Figures 4.1 and 4.2 show, this domain shows the highest rate of discrimination of any single domain (over 7 per cent). The models are based on just over 5,200 respondents who had been seeking work in the previous two
46 Sectors based on the European Classification of Economic Activities (NACE), which is the European reference framework for the production and the dissemination of statistics related to economic activities (see http://www.cso.ie/px/u/NACECoder/NACEItems/searchnace.asp).
47 Russell and McGinnity (2011), using national workplace survey data from 2009, find both equality policies and perceptions of equality by employees vary across sectors, and are higher in the public sector in Ireland.
48 Though it is probable that people who experience discrimination are more likely to join a union.
Modelling the risk of work- and services-related discrimination | 35
years.49 There are no gender differences in the reporting of recruitment discrimination. Field experiments tend to find gender discrimination can work ‘both ways’: against men in female occupations, and against women in male occupations (Rich, 2014).
Older, working-age respondents (45–64 years) report more discrimination than younger groups. This is consistent with the (albeit limited) evidence of age discrimination from international field experiments (see Rich, 2014). Somewhat surprisingly, given McGinnity and Lunn’s (2011) results from a field experiment in Ireland in 2008, reports of recruitment discrimination do not differ between White Irish, White Non-Irish and Asian respondents. Of course, unsuccessful job-seekers may be unaware that their failure was due to discrimination, and not report it, given recruitment tends to take place ‘behind closed doors’. Black respondents are twice as likely to report recruitment discrimination as White Irish; this is consistent with previous research (Kingston et al., 2013), though it should be noted the difference is not statistically significant as the group is small (see Table A1). The Other ethnic group also report higher discrimination in looking for work (2.6 times as high) and this is statistically significant.
The ethnic group that really stands out is Irish Travellers, a group almost ten times more likely to report recruitment discrimination than the White Irish. Given the very low rate of employment among the Traveller population (Watson et al., 2017), these results suggest that discrimination may play a role in accounting for these differences, along with low levels of education and other factors.
The only other significant group difference in this model concerns disability status. Those with a disability are more than twice as likely to report discrimination in recruitment as those without a disability. The National Disability Authority (NDA) survey of public attitudes to disability in 2011 finds that, overall, 63 per cent of respondents believed that people with disabilities do not receive equal employment opportunities (NDA, 2011). While this is different from the personal experience of discrimination, the results are consistent.
There are no differences by marital/family status in terms of recruitment discrimination.50 When separate models (in the workplace and while seeking work) are estimated for men and women (not shown), some of the differences between marital/family status groups vary for 2014, but they are not statistically significant.
49 They could be currently employed or not employed; those who were not looking for a job are excluded. 50 Before controls (Table A3), never-married lone parents are 1.5 times more likely to experience discrimination looking
for work; although not significant, this falls when education, employment status and housing tenure are introduced, suggesting that the group is disadvantaged on these other characteristics associated with discrimination.
36 | Who exp er iences d iscr iminat ion ?
5.3 DISCRIMINATION IN PUBLIC AND PRIVATE SERVICES
Table 5.2 presents models of discrimination in services, controlling for education, region, economic status and housing tenure.51 For the purposes of presentation and brevity, domains related to public services (health, education, transport and other public services) are grouped together, as are private services (shops/pubs/restaurants, banks and financial services, and housing).
There are good reasons to believe that patterns of perceived discrimination should be similar within these categories (public and private services), but some group differences may vary across individual domains, variations that these models will not capture. Table 5.2 shows no gender differences in service-based discrimination, either regarding public or private services. In private services, the 45–64-year-old group and, in particular, those 65 years and over are less likely to report discrimination (particularly in shops/pubs/restaurants) than the 18–25 age group. This is consistent with findings from previous years (McGinnity et al., 2012).
In terms of national/ethnic differences in public services, Black respondents are three times more likely to report discrimination than White Irish. Those categorised as Asian, Other ethnicity and Travellers are somewhat more likely to report experiencing discrimination, but the difference is not significant. In the case of Travellers, the group is particularly small.52 In private services, ethnic differences are more pronounced. Compared to White Irish, Black respondents are almost five times more likely to report discrimination in regards to private services, such as shops, banks and housing. Asian respondents are three times more likely to do so, while those of Other ethnicity are twice as likely. Irish Travellers are over 22 times as likely to say they experience discrimination in Ireland in private services (shops, pubs, restaurants, banks and housing) than White Irish in 2014. This difference is relevant to all private services, but particularly shops, pubs and restaurants, where Travellers are 38 times more likely to report discrimination than White Irish, even after controlling for education, employment status and housing tenure (not shown).
51 Table A4 shows model results without these controls. 52 There is a significant difference between Travellers and white Irish in the specific domain ‘other public services’ (such
as social welfare services, local council services); Irish Travellers are four times more likely to experience discrimination regarding ‘other public services’, this is not the case regarding the combined public services group.
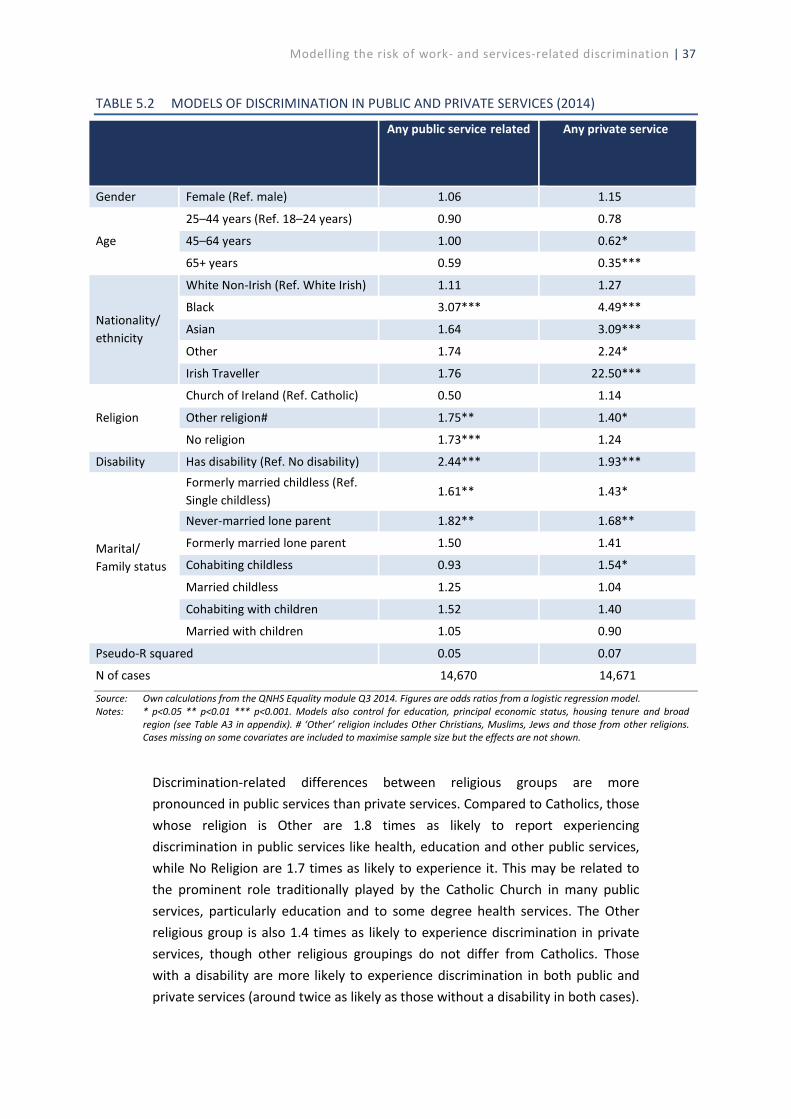
Gender Female (Ref. male) 1.06 1.15
25–44 years (Ref. 18–24 years) 0.90 0.78
Age 45–64 years 1.00 0.62*
65+ years 0.59 0.35***
White Non-Irish (Ref. White Irish) 1.11 1.27
Black 3.07*** 4.49*** Nationality/
Asian 1.64 3.09*** ethnicity
Other 1.74 2.24*
Irish Traveller 1.76 22.50***
Church of Ireland (Ref. Catholic) 0.50 1.14
Religion Other religion# 1.75** 1.40*
No religion 1.73*** 1.24
Disability Has disability (Ref. No disability) 2.44*** 1.93*** Formerly married childless (Ref.
1.61** 1.43* Single childless) Never-married lone parent 1.82** 1.68**
Formerly married lone parent 1.50 1.41 Marital/ Family status Cohabiting childless 0.93 1.54*
Married childless 1.25 1.04
Cohabiting with children 1.52 1.40
Married with children 1.05 0.90
Pseudo-R squared 0.05 0.07
N of cases 14,670 14,671
discrimination (education, health, transport, other)
related discrimination (shops/pubs,
banks/finance, housing)
Modelling the risk of work- and services-related discrimination | 37
TABLE 5.2 MODELS OF DISCRIMINATION IN PUBLIC AND PRIVATE SERVICES (2014)
Any public service related Any private service
Source: Own calculations from the QNHS Equality module Q3 2014. Figures are odds ratios from a logistic regression model. Notes: * p<0.05 ** p<0.01 *** p<0.001. Models also control for education, principal economic status, housing tenure and broad
region (see Table A3 in appendix). # ‘Other’ religion includes Other Christians, Muslims, Jews and those from other religions. Cases missing on some covariates are included to maximise sample size but the effects are not shown.
Discrimination-related differences between religious groups are more pronounced in public services than private services. Compared to Catholics, those whose religion is Other are 1.8 times as likely to report experiencing discrimination in public services like health, education and other public services, while No Religion are 1.7 times as likely to experience it. This may be related to the prominent role traditionally played by the Catholic Church in many public services, particularly education and to some degree health services. The Other religious group is also 1.4 times as likely to experience discrimination in private services, though other religious groupings do not differ from Catholics. Those with a disability are more likely to experience discrimination in both public and private services (around twice as likely as those without a disability in both cases).
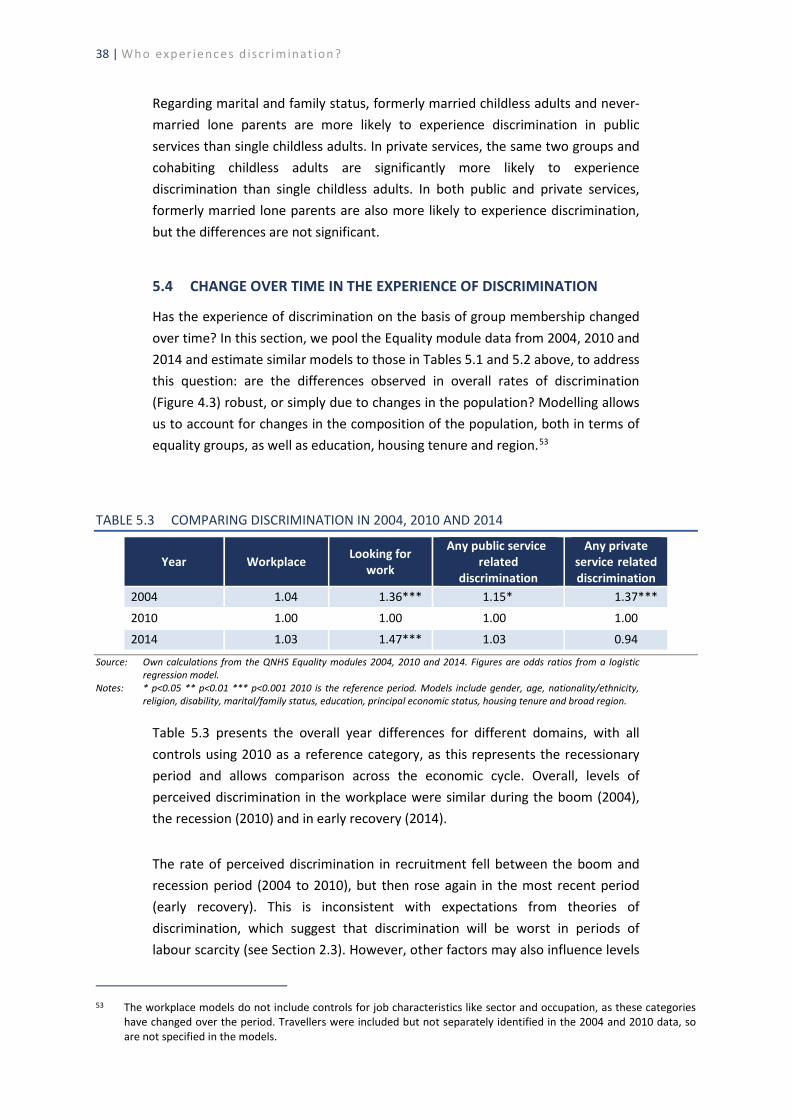
Year Workplace Looking for work
Any public service related
discrimination
Any private service related discrimination
2004 1.04 1.36*** 1.15* 1.37***
2010 1.00 1.00 1.00 1.00
2014 1.03 1.47*** 1.03 0.94
38 | Who exp er iences d iscr iminat ion ?
Regarding marital and family status, formerly married childless adults and never-married lone parents are more likely to experience discrimination in public services than single childless adults. In private services, the same two groups and cohabiting childless adults are significantly more likely to experience discrimination than single childless adults. In both public and private services, formerly married lone parents are also more likely to experience discrimination, but the differences are not significant.
5.4 CHANGE OVER TIME IN THE EXPERIENCE OF DISCRIMINATION
Has the experience of discrimination on the basis of group membership changed over time? In this section, we pool the Equality module data from 2004, 2010 and 2014 and estimate similar models to those in Tables 5.1 and 5.2 above, to address this question: are the differences observed in overall rates of discrimination (Figure 4.3) robust, or simply due to changes in the population? Modelling allows us to account for changes in the composition of the population, both in terms of equality groups, as well as education, housing tenure and region.53
TABLE 5.3 COMPARING DISCRIMINATION IN 2004, 2010 AND 2014
Source: Own calculations from the QNHS Equality modules 2004, 2010 and 2014. Figures are odds ratios from a logistic regression model.
Notes: * p<0.05 ** p<0.01 *** p<0.001 2010 is the reference period. Models include gender, age, nationality/ethnicity, religion, disability, marital/family status, education, principal economic status, housing tenure and broad region.
Table 5.3 presents the overall year differences for different domains, with all controls using 2010 as a reference category, as this represents the recessionary period and allows comparison across the economic cycle. Overall, levels of perceived discrimination in the workplace were similar during the boom (2004), the recession (2010) and in early recovery (2014).
The rate of perceived discrimination in recruitment fell between the boom and recession period (2004 to 2010), but then rose again in the most recent period (early recovery). This is inconsistent with expectations from theories of discrimination, which suggest that discrimination will be worst in periods of labour scarcity (see Section 2.3). However, other factors may also influence levels
The workplace models do not include controls for job characteristics like sector and occupation, as these categories have changed over the period. Travellers were included but not separately identified in the 2004 and 2010 data, so are not specified in the models.
53
Modelling the risk of work- and services-related discrimination | 39
of self-reported discrimination (see Chapter 2). One potential influence on this is the fact that, at the height of the recession, job-seekers may have attributed any negative job search experience to the general employment crisis rather than to discrimination, whereas at early recovery, more micro-level factors, such as discrimination, begin to be identified again. It is also possible that it is only when recruitment resumes during early recovery that employers’ biased selection from the still large pool of job-seekers becomes noticeable.
Perceived rates of discrimination in services have fallen since 2004, particularly in private services. This is consistent with the general expectation derived in Section 2.3 that a sharp fall in sales and financial transactions during the recession would be associated with a lower perception of discrimination. This trend did not change in the early recovery period (2014); it remains to be seen if increased consumer spending and economic growth will reverse this pattern.
There may be other factors alongside the economic cycle that could influence temporal changes in the rates of perceived discrimination. For example, the attitudinal climate towards some minority groups may change as a result of legislative adjustment, awareness campaigns or public debate such as that surrounding the planned divestment from religious orders in schools. The NDA has tracked attitudes towards people with different disabilities and comparable groups since 2006. These studies show a general improvement in attitudes towards minorities, with most hostility directed towards members of the Traveller community (NDA, 2006; 2011; 2017). These changes could have a two-pronged effect; they may raise awareness among some people regarding what constitutes discrimination, leading to increased reports, but at the same time, they may contribute to higher levels of tolerance, thus lowering the actual incidence of discrimination for some groups.
It would also be interesting to consider how specific domains change in terms of discrimination. For example, Figure 4.4 suggests a fall in discrimination in the private services of shops/pubs/restaurants and banks/financial services, but not in housing.
5.4.1 Changes over time for equality groups
How have the experiences of specific groups changed over time? Here we present a short summary of some statistically significant changes. This is not a comprehensive account, but rather aims to give the reader a flavour of some of the changes that have occurred. For many groups there are no changes, or
40 | Who exp er iences d iscr iminat ion ?
changes are small and not statistically significant.54 (These findings are also summarised in Table 6.1 in the next chapter.)
In the workplace, the perception of discrimination among workers of Black ethnicity, compared to White Irish, has increased over time (Table 6.1). Those in the Black category reported experiencing higher levels of discrimination than White Irish in 2004, a gap that increased in 2010 and was maintained in 2014. Evidence from other sources (such as Kingston et al., 2013, and Barrett et al., 2017) show high unemployment rates and low employment levels among those of black ethnicity; therefore, rising discrimination in the workplace for those who are employed is a problem. The wide gap between those in the minority Black category and those in the White Irish category in the other domains (seeking work, public and private services) has remained unchanged since 2004.
In seeking work, the disadvantage of White Non-Irish (both EU and non-EU nationals) compared to White Irish was highest in 2004, fell in 2010 and fell again in 2014, so that by 2014, this difference was not significant (see Table 5.1), at least after controlling for occupation, sector and other workplace characteristics. Kingston et al. (2015) suggest that the fall in reports of discrimination between 2004 and 2010 among non-Irish nationals, most of whom are immigrants, might be due to them becoming more established, and employers being better able to identify job-related characteristics. While we cannot rule out selective out-migration or changing immigrant (self-) selection in the period, which would result in changes to the immigrant population, there is no clear evidence of this from other sources (Barrett et al., 2017).55
In terms of gender differences, women were more likely than men to report discrimination in the workplace in 2014, and this is unchanged from 2004 and 2010 (Table 6.1). In 2010 and 2014, there were no gender differences observed in recruitment (women had been more advantaged in 2004). There were no gender differences in public or private services in 2014 either, and neither has this changed over time.
A different pattern is observed for disability. The gap between those with and without a disability in perceived discrimination in the workplace was significant in 2004, fell in 2010 and then rose again in 2014 (Table 6.1). In public services, the gap between those with and without a disability narrowed between 2004 and 2010, and the 2010 gap was maintained in 2014. This is not consistent with the suggestion that cuts to public service provision might be felt most keenly by
54 The models are available from the authors on request. 55 Further analysis could also investigate the role of duration in the country for individuals.
Modelling the risk of work- and services-related discrimination | 41
disadvantaged groups (see Section 2.3).56 These findings are supported in existing research by McGinnity et al. (2014), which found some improvement in the relative position of the disabled group in terms of poverty and deprivation levels over the period 2007 and 2012. No change was found in the gap between those with and without a disability in private services in the period.
In private services, we find some changes in terms of marital/family status. Compared to single childless adults, respondents cohabiting with children were more likely to report discrimination in private services in 2004 and 2010, but not in 2014 (Table 6.1). The group is small (see Table A1), but McGinnity et al. (2014) found this group to be disadvantaged in terms of labour market outcomes and poverty or deprivation by 2012.
It could be the case that people who are disadvantaged experience greater cuts to provision but do not see such cuts as discriminatory per se.
56
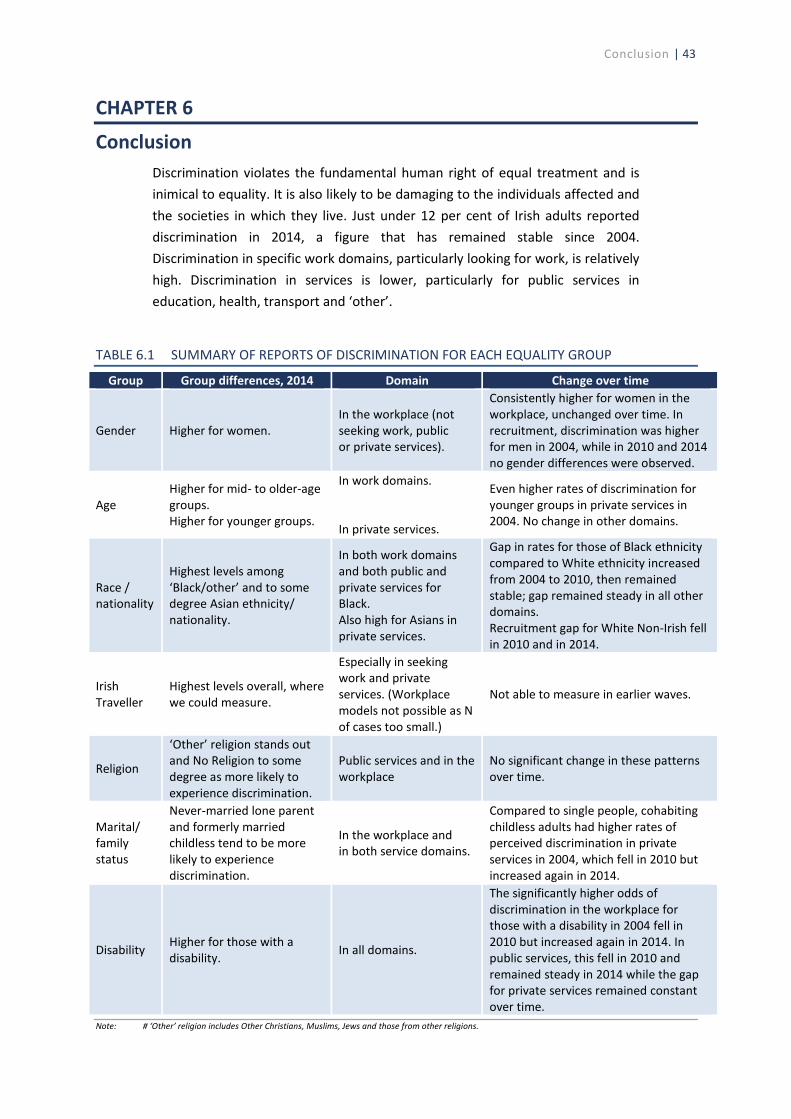
Consistently higher for women in the In the workplace (not workplace, unchanged over time. In
Gender Higher for women. seeking work, public recruitment, discrimination was higher or private services). for men in 2004, while in 2010 and 2014
Higher for mid- to older-age In work domains. Even higher rates of discrimination for Age groups. younger groups in private services in
Higher for younger groups. In private services. 2004. No change in other domains.
Race / nationality
Highest levels among ‘Black/other’ and to some degree Asian ethnicity/ nationality.
In both work domains and both public and private services for Black. Also high for Asians in private services.
Gap in rates for those of Black ethnicity compared to White ethnicity increased from 2004 to 2010, then remained stable; gap remained steady in all other domains. Recruitment gap for White Non-Irish fell
no gender differences were observed.
in 2010 and in 2014.
Irish Traveller
Religion
Highest levels overall, where we could measure.
‘Other’ religion stands out and No Religion to some degree as more likely to
Especially in seeking work and private services. (Workplace models not possible as N of cases too small.)
Public services and in the workplace
Not able to measure in earlier waves.
No significant change in these patterns over time.
experience discrimination. Never-married lone parent Compared to single people, cohabiting
Marital/ family status
and formerly married childless tend to be more likely to experience
In the workplace and in both service domains.
childless adults had higher rates of perceived discrimination in private services in 2004, which fell in 2010 but
discrimination. increased again in 2014.
Higher for those with a Disability In all domains. disability.
The significantly higher odds of discrimination in the workplace for those with a disability in 2004 fell in 2010 but increased again in 2014. In public services, this fell in 2010 and remained steady in 2014 while the gap for private services remained constant over time.
Note: # ‘Other’ religion includes Other Christians, Muslims, Jews and those from other religions.
-
Conclusion | 43
CHAPTER 6
Conclusion Discrimination violates the fundamental human right of equal treatment and is inimical to equality. It is also likely to be damaging to the individuals affected and the societies in which they live. Just under 12 per cent of Irish adults reported discrimination in 2014, a figure that has remained stable since 2004. Discrimination in specific work domains, particularly looking for work, is relatively high. Discrimination in services is lower, particularly for public services in education, health, transport and ‘other’.
TABLE 6.1 SUMMARY OF REPORTS OF DISCRIMINATION FOR EACH EQUALITY GROUP
Group Group differences, 2014 Domain Change over time
44 | Who exp er iences d iscr iminat ion ?
However, discrimination varies significantly across equality groups, and is high in multiple domains among minority ethnic groups (Black, Asian and especially Irish Travellers), minority religions and those with a disability. For other equality groups, effects vary by domain – older-age working adults experience discrimination in seeking work, but younger groups report more discrimination in private services. Women experience more discrimination in the workplace, but in other domains men and women do not differ. Never-married lone parents experience higher discrimination rates in both public and private services than single childless adults.
While this survey uses best practice in asking questions on discrimination (a large representative sample of adults are given a clear definition of discrimination, and asked about specific situations and time periods), it must rely on respondents’ own interpretation of their treatment. Nonetheless, the patterns found are broadly consistent with previous findings both in Ireland and internationally. For example, the discrimination experienced by Irish Travellers is consistent with that reported in the All Ireland Traveller Health Survey (AITHS), and with the very low employment rates among this group (Watson et al., 2017). The discrimination reported by those with a disability is consistent with international field experiments (such as Rich et al., 2014, on recruitment) and their low employment rates (Watson et al., 2013). The finding of women reporting more discrimination in the workplace but not in recruitment finds support in studies of gender differences in labour market outcomes in Ireland (Russell et al., 2014) and international studies of recruitment discrimination (Rich et al., 2014). The findings about ethnic group differences in recruitment are not entirely consistent with the 2008 field experiment in Ireland (McGinnity and Lunn, 2011), which found similar rates of discrimination among non-Irish European, Asian and African candidates – though evidence of change over time suggests the White Non-Irish have experienced a fall in discrimination since then. In addition, unsuccessful job-seekers may be unaware that their failure was due to discrimination, and not report it, given recruitment tends to take place ‘behind closed doors’.
What are the implications of discrimination for individuals? Discrimination in recruitment may mean certain groups are systematically assigned lower quality jobs or remain unemployed. Discrimination in the workplace may lead to lower pay and promotions, lower job satisfaction and a higher risk of redundancy. In private services, being assigned poorer housing or failing to get a bank loan or mortgage may affect living conditions. Previous research has also found that unfair treatment can have damaging effects on self-esteem, well-being and health (Schmitt et al., 2014; Pascoe and Richman, 2009). While it is clear that the nature of a specific incident of discrimination, in terms of how serious it is and how often it occurs, will influence these effects (see McGinnity et al., 2012), at societal level discrimination can lead to a loss of trust in institutions, divisions between sections of society and a decline in social cohesion (De Vroome et al., 2014). The policy imperative to increase awareness and reduce the incidence of
Conclusion | 45
discrimination therefore remains strong. Building the evidence base is an essential step for developing effective policy and the study results highlight the need to monitor access and outcomes across a wide range of areas. The new National Strategy for Women and Girls: 2017 to 2020 includes a commitment to increasing disclosure of the gender pay gap by requiring companies with 50 or more employees to provide figures on wages on a periodic basis. Such initiatives would also be beneficial across other contexts and groups or grounds (for example, minority ethnic groups, those with disabilities). The very high levels of discrimination experienced by Travellers is not surprising and consistent with findings on education, health and employment (Watson et al., 2017), and the findings are important. As Travellers comprise a small group, the number of cases limited what we could present in this report. It is often not possible to separately identify Travellers in most analyses of poverty and exclusion. This points to the importance of maximising use of existing sources, such as the census and administrative data, for research on outcomes for this group so that their situation can be monitored over time.
The reverse in the downward trend in discrimination experienced by people with a disability in the workplace (Watson et al., 2013) is disappointing. Further analysis could be fruitful to investigate this further. Relevant questions include whether it is associated with the private or public sectors, and whether certain types of jobs most affected.
Improved collection and publication of statistics on public and private service users, such as participants in training schemes, and those using health or care services or financial services, would provide much needed information. While it is important to follow proper procedures to ensure confidentiality and avoid disclosure, technological advances mean that anonymised questionnaires are easier than ever to administer. Cooperation of private sector providers could be encouraged through quality awards schemes or via the regulatory frameworks where these exist.
In terms of service domains, the higher levels of discrimination found in housing when compared to other services signals yet another negative consequence of the severe pressures associated with a housing stock that is inadequate to meet demand. High rents and inadequate stock may have particular consequences for disadvantaged groups, and further research could identify those groups most at risk of housing discrimination.
Significant recent legislative change, such as that initiated by the marriage equality referendum and recognition of Traveller ethnicity, provide a positive signal on respecting the rights of different groups. Yet the recent rise of far-right groups and growing support for anti-immigrant policies in Europe and the US

46 | Who exp er iences d iscr iminat ion ?
highlight that civil rights for minority groups and freedom to live and work without threats of racist or sexist behaviour cannot be taken for granted.
References | 47
REFERENCES All Ireland Traveller Health Study Team (2010). All Ireland Traveller Health Study. Our
Geels. Summary of findings, Dublin: UCD School of Public Health and Population Science, available at https://www.ucd.ie/t4cms/AITHS_SUMMARY.pdf.
Al Ramiah, A., M. Hewstone, J.F. Dovidio and L.A. Penner (2010). ‘The social psychology of discrimination: Theory, measurement and consequences’, in Bond, L., F. McGinnity and H. Russell, H. (eds.) Making Equality Count; Irish and International Research Measuring Equality and Discrimination. Dublin: The Liffey Press.
Barrett, A., F. McGinnity and E. Quinn, E. (eds.) (2017) Monitoring report on integration 2016. Dublin: ESRI/The Department of Justice and Equality.
Blank, R.M., M. Dabady and C.F. Citro. (eds.) (2004). Measuring racial discrimination. Washington DC: The National Academies Press.
Bond, L., F. McGinnity and H. Russell (2010). ‘Introduction: Making equality count’, in Bond, L., F. McGinnity and H. Russell (eds.) Making Equality Count: Irish and International Research Measuring Equality and Discrimination. Dublin: Liffey Press.
CSO (2015). QNHS equality quarter 3 2014, available at http://pdf.cso.ie/www/pdf/20150902123751_QNHS_Equality_Module_Quarte r 3_2014_full.pdf
De Vroome T, M. Verkuyten and B. Martinovic (2014). ‘Host national identification of immigrants in the Netherlands’, International Migration Review. Vol. 48, No. 1, pp. 1-27.
Duffy, D., J. FitzGerald, K. Timoney and Byrne, D. (2014). Quarterly economic commentary. Dublin: ESRI.
European Commission (2015). Special Eurobarometer 437: Discrimination in the EU in 2015.
Eurofound (2016), Sixth European Working Conditions Survey – Overview report. Luxembourg: Publications Office of the European Union.
European Union Monitoring Centre on Racism and Xenophobia (2006). Migrants’ experiences of racism and xenophobia in 12 EU Member States: Pilot Study. Vienna: EUMC.
IHREC (2015). ‘Ireland and the International Covenant on Economic, Social and Cultural Rights’. Dublin: Irish Human Rights and Equality Commission.
Kingston G., F. McGinnity and P.J. O’Connell (2015). ‘Discrimination in the labour market: Nationality, ethnicity and the recession’, Work, Employment and Society, Vol. 29, No. 2, pp. 213-232.
Kingston, G., P.J. O’Connell and E. Kelly (2013). Immigrants at work: Ethnicity and nationality in the Irish labour market: Evidence from the QNHS Equality Module 2010. Dublin: Equality Authority/ESRI.
McGinnity, F. and M. Gijsberts (forthcoming, 2017). ‘The experience of discrimination among newly arrived Poles in Ireland and the Netherlands’, Ethnic and Racial Studies.
48 | Who exp er iences d iscr iminat ion ?
McGinnity, F., H. Russell, D. Watson, G. Kingston and E. Kelly (2014). Winners and Losers? The equality impact of the Great Recession in Ireland. Dublin: Equality Authority/ESRI.
McGinnity, F., D. Watson and G. Kingston (2012). Analysing the experience of discrimination in Ireland: Evidence from the QNHS Equality Module 2010. Dublin: Equality Authority/ESRI.
McGinnity, F. and P. Lunn (2011). ‘Measuring discrimination facing ethnic minority job applicants: an Irish experiment’, Work, Employment and Society, Vol. 25, No. 4, pp. 693-708.
McGinnity, F., P. O’Connell, E. Quinn and J. Williams (2006). Migrants’ experience of racism and discrimination in Ireland. Dublin: ESRI.
NDA (2011). A national survey of public attitudes to disability in Ireland. Dublin: National Disability Authority.
NESC (2013). The social dimensions of the crisis: The evidence and its implications, No. 134. Dublin: National Economic and Social Council Office.
O’Connor, P. (2010). ‘Is senior management in Irish universities male-dominated? What are the implications?’, Irish Journal of Sociology, Vol. 18, No. 1, pp. 1-20.
OECD (2013). ‘Discrimination against immigrants – Measurement, incidence and policy instruments’, in International Migration Outlook 2013. OECD Publishing.
Pager, D. and H. Shepherd (2008). ‘The sociology of discrimination: racial discrimination in employment, housing, credit, and consumer markets’, Annual Review of Sociology Vol. 34, pp. 181–209.
Pascoe, E.A. and L.S. Richman (2009). ‘Perceived discrimination and health: A meta-analytic review’, Psychological Bulletin, Vol. 135, No. 4, pp. 531-554.
Rich, J. (2014). ‘What do field experiments of discrimination in markets tell us? A meta-analysis of studies conducted since 2000’, IZA Discussion Paper No. 8584. Institute for the Study of Labor.
Russell, H., F. McGinnity and G. Kingston (2014). Gender and the quality of work: From boom to recession. Dublin: Equality Authority/ESRI.
Russell, H. and F. McGinnity (2011). Workplace Equality in the Recession? The Incidence and Impact of Equality Policies and Flexible Working. Dublin: Equality Authority/ESRI.
Russell, H., D. Watson and J. Banks (2011). Pregnancy at work: A national survey. Dublin: HSE Crisis Pregnancy Programme and the Equality Authority.
Russell, H., E. Quinn, R. O’Riain and F. McGinnity, F. (2008). The experience of discrimination in Ireland. Analysis of the QNHS Equality Module. Dublin: Equality Authority/ESRI.
Schmitt, M., N. Branscombe, T. Postmes and A. Garcia. 2014. ‘The consequences of perceived discrimination for psychological well-being: A meta-analytic review’, Psychological Bulletin, Vol. 140, pp. 921-948.
References | 49
Tolsma, J., M. Lubbers and M. Gijsberts (2012). ‘Education and cultural integration among ethnic minorities and natives in the Netherlands: A test of the integration paradox’, Journal of Ethnic and Migration Studies, Vol. 38, No. 5, pp. 793-813.
Watson, D., O. Kenny and F. McGinnity (2017). A social portrait of Travellers in Ireland. Dublin: ESRI.
Watson, D., G. Kingston and F. McGinnity, F. (2012). Disability in the Irish labour market: Evidence from the QNHS Equality Module 2010. Dublin: Equality Authority/ESRI.
Watson, D., P. Lunn, E. Quinn and H. Russell (2011). Multiple disadvantage in Ireland: An equality analysis of Census 2006. Dublin: Equality Authority/ESRI.
Zschirnt, E. and D. Ruedin (2016). ‘Ethnic discrimination in hiring decisions: A meta-analysis of correspondence tests 1990–2015’, Journal of Ethnic and Migration Studies, Vol. 42, No. 7.
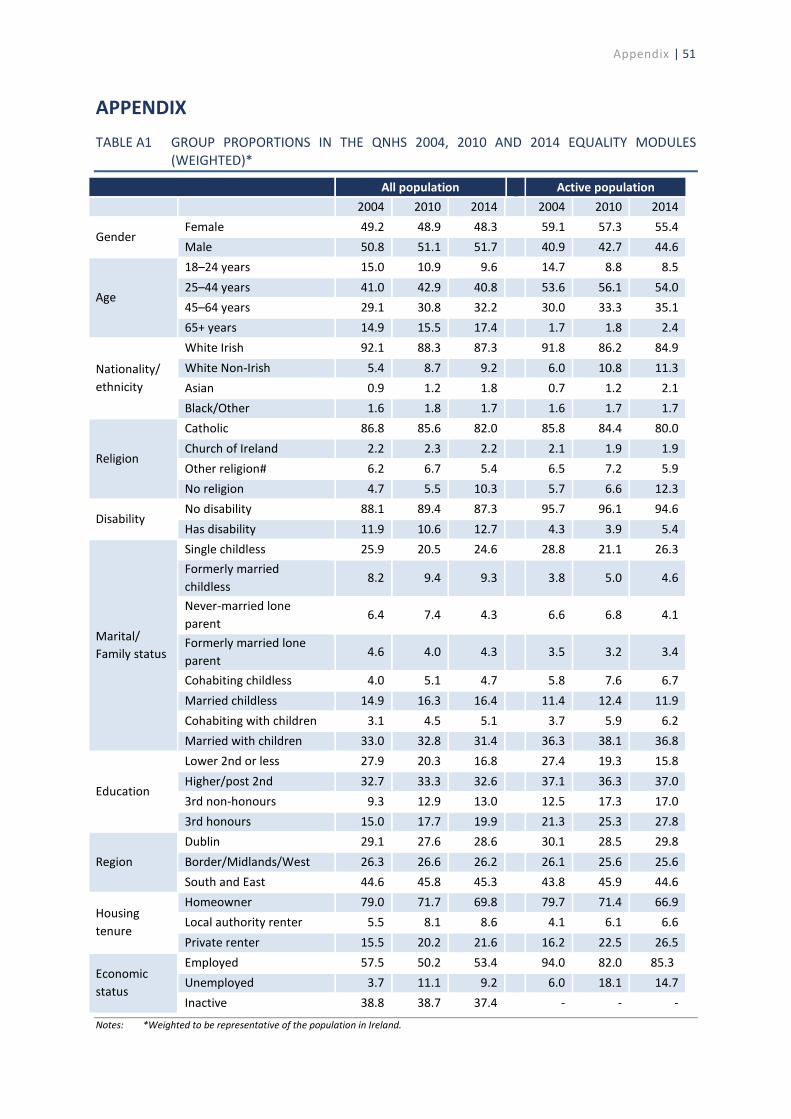
TABLE A1 GROUP PROPORTIONS IN THE QNHS 2004, 2010 AND 2014 EQUALITY MODULES (WEIGHTED)*
All population Active population 2004 2010 2014 2004 2010 2014
Female 49.2 48.9 48.3 59.1 57.3 55.4 Gender
Male 50.8 51.1 51.7 40.9 42.7 44.6 18–24 years 15.0 10.9 9.6 14.7 8.8 8.5
Age 25–44 years 41.0 42.9 40.8 53.6 56.1 54.0 45–64 years 29.1 30.8 32.2 30.0 33.3 35.1 65+ years 14.9 15.5 17.4 1.7 1.8 2.4 White Irish 92.1 88.3 87.3 91.8 86.2 84.9
Nationality/ White Non-Irish 5.4 8.7 9.2 6.0 10.8 11.3 ethnicity Asian 0.9 1.2 1.8 0.7 1.2 2.1
Black/Other 1.6 1.8 1.7 1.6 1.7 1.7 Catholic 86.8 85.6 82.0 85.8 84.4 80.0 Church of Ireland 2.2 2.3 2.2 2.1 1.9 1.9
Religion Other religion# 6.2 6.7 5.4 6.5 7.2 5.9 No religion 4.7 5.5 10.3 5.7 6.6 12.3 No disability 88.1 89.4 87.3 95.7 96.1 94.6
Disability Has disability 11.9 10.6 12.7 4.3 3.9 5.4 Single childless 25.9 20.5 24.6 28.8 21.1 26.3 Formerly married childless
8.2 9.4 9.3 3.8 5.0 4.6
Never-married lone 6.4 7.4 4.3 6.6 6.8 4.1
parent Marital/ Formerly married lone
4.6 4.0 4.3 3.5 3.2 3.4 Family status parent Cohabiting childless 4.0 5.1 4.7 5.8 7.6 6.7 Married childless 14.9 16.3 16.4 11.4 12.4 11.9 Cohabiting with children 3.1 4.5 5.1 3.7 5.9 6.2 Married with children 33.0 32.8 31.4 36.3 38.1 36.8 Lower 2nd or less 27.9 20.3 16.8 27.4 19.3 15.8 Higher/post 2nd 32.7 33.3 32.6 37.1 36.3 37.0
Education 3rd non-honours 9.3 12.9 13.0 12.5 17.3 17.0 3rd honours 15.0 17.7 19.9 21.3 25.3 27.8 Dublin 29.1 27.6 28.6 30.1 28.5 29.8
Region Border/Midlands/West 26.3 26.6 26.2 26.1 25.6 25.6 South and East 44.6 45.8 45.3 43.8 45.9 44.6 Homeowner 79.0 71.7 69.8 79.7 71.4 66.9
Housing Local authority renter 5.5 8.1 8.6 4.1 6.1 6.6
tenure Private renter 15.5 20.2 21.6 16.2 22.5 26.5 Employed 57.5 50.2 53.4 94.0 82.0 85.3
Economic Unemployed 3.7 11.1 9.2 6.0 18.1 14.7
status Inactive 38.8 38.7 37.4 - - -
Notes: *Weighted to be representative of the population in Ireland.
Appendix | 51
APPENDIX
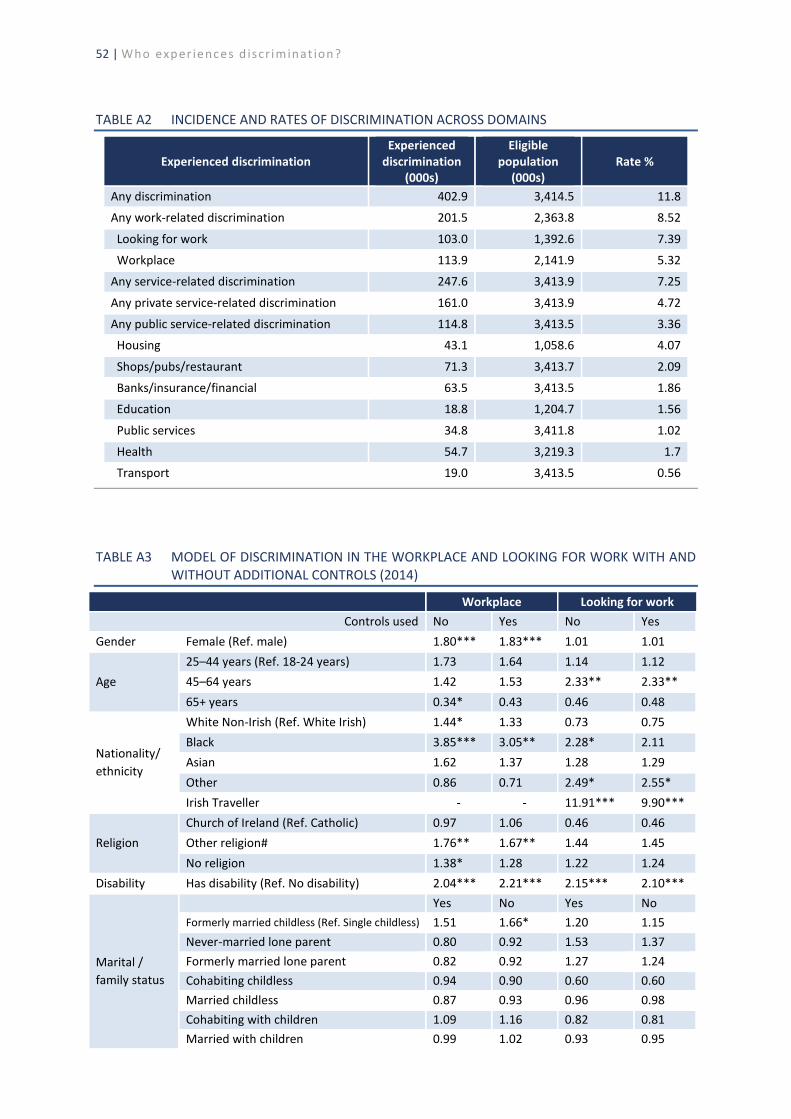
TABLE A2 INCIDENCE AND RATES OF DISCRIMINATION ACROSS DOMAINS
Experienced discrimination Experienced
discrimination (000s)
Eligible population
(000s) Rate %
Any discrimination 402.9 3,414.5 11.8
Any work-related discrimination 201.5 2,363.8 8.52
Looking for work 103.0 1,392.6 7.39
Workplace 113.9 2,141.9 5.32
Any service-related discrimination 247.6 3,413.9 7.25
Any private service-related discrimination 161.0 3,413.9 4.72
Any public service-related discrimination 114.8 3,413.5 3.36
Housing 43.1 1,058.6 4.07
Shops/pubs/restaurant 71.3 3,413.7 2.09
Banks/insurance/financial 63.5 3,413.5 1.86
Education 18.8 1,204.7 1.56
Public services 34.8 3,411.8 1.02
Health 54.7 3,219.3 1.7
Transport 19.0 3,413.5 0.56
TABLE A3 MODEL OF DISCRIMINATION IN THE WORKPLACE AND LOOKING FOR WORK WITH AND WITHOUT ADDITIONAL CONTROLS (2014)
Workplace Looking for work Controls used No Yes No Yes
Gender Female (Ref. male) 1.80*** 1.83*** 1.01 1.01 25–44 years (Ref. 18-24 years) 1.73 1.64 1.14 1.12
Age 45–64 years 1.42 1.53 2.33** 2.33** 65+ years 0.34* 0.43 0.46 0.48 White Non-Irish (Ref. White Irish) 1.44* 1.33 0.73 0.75 Black 3.85*** 3.05** 2.28* 2.11
Nationality/ Asian 1.62 1.37 1.28 1.29
ethnicity Other 0.86 0.71 2.49* 2.55* Irish Traveller - - 11.91*** 9.90*** Church of Ireland (Ref. Catholic) 0.97 1.06 0.46 0.46
Religion Other religion# 1.76** 1.67** 1.44 1.45 No religion 1.38* 1.28 1.22 1.24
Disability Has disability (Ref. No disability) 2.04*** 2.21*** 2.15*** 2.10*** Yes No Yes No
Formerly married childless (Ref. Single childless) 1.51 1.66* 1.20 1.15 Never-married lone parent 0.80 0.92 1.53 1.37
Marital / Formerly married lone parent 0.82 0.92 1.27 1.24 family status Cohabiting childless 0.94 0.90 0.60 0.60
Married childless 0.87 0.93 0.96 0.98 Cohabiting with children 1.09 1.16 0.82 0.81 Married with children 0.99 1.02 0.93 0.95
52 | Who exp er iences d iscr iminat ion ?
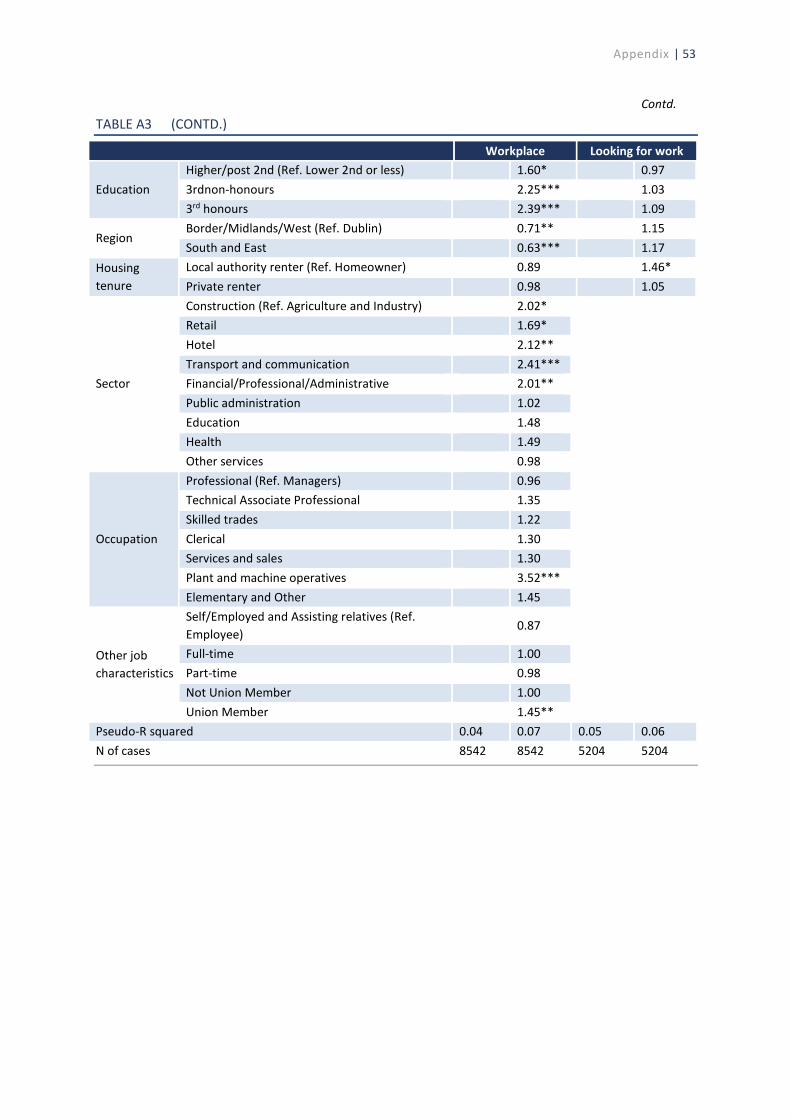
Appendix | 53
Contd. TABLE A3 (CONTD.)
Workplace Looking for work
Education Higher/post 2nd (Ref. Lower 2nd or less) 1.60* 0.97 3rdnon-honours 2.25*** 1.03 3rd honours 2.39*** 1.09
Region Border/Midlands/West (Ref. Dublin) South and East
0.71** 0.63***
1.15 1.17
Housing Local authority renter (Ref. Homeowner) 0.89 1.46* tenure Private renter 0.98 1.05
Construction (Ref. Agriculture and Industry) 2.02* Retail 1.69* Hotel 2.12** Transport and communication
Sector Financial/Professional/Administrative 2.01** Public administration 1.02 Education 1.48 Health 1.49 Other services 0.98 Professional (Ref. Managers) Technical Associate Professional 1.35 Skilled trades 1.22
Occupation Clerical 1.30 Services and sales 1.30 Plant and machine operatives 3.52***
2.41***
0.96
Elementary and Other 1.45 Self/Employed and Assisting relatives (Ref. Employee)
0.87
Other job Full-time 1.00 characteristics Part-time 0.98
Not Union Member Union Member 1.45**
Pseudo-R squared 0.04 0.07 0.05 0.06 N of cases 8542 8542 5204 5204
1.00
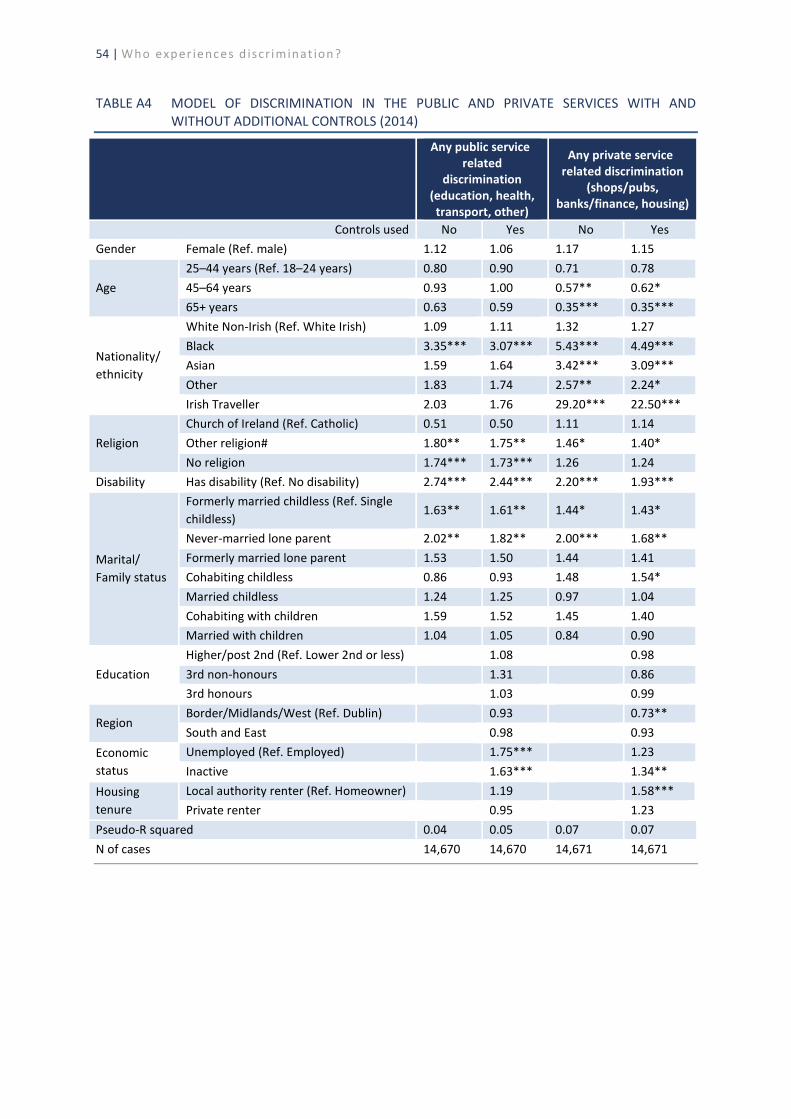
54 | Who exp er iences d iscr iminat ion ?
TABLE A4 MODEL OF DISCRIMINATION IN THE PUBLIC AND PRIVATE SERVICES WITH AND WITHOUT ADDITIONAL CONTROLS (2014)
Controls used No Yes No Yes Gender Female (Ref. male) 1.12 1.06 1.17 1.15
25–44 years (Ref. 18–24 years) 0.80 0.90 0.71 0.78 Age 45–64 years 0.93 1.00 0.57** 0.62*
65+ years 0.63 0.59 0.35*** 0.35*** White Non-Irish (Ref. White Irish) 1.09 1.11 1.32 1.27
Nationality/ ethnicity
Asian Other
1.59 1.83
1.64 1.74
3.42*** 2.57**
3.09*** 2.24*
Irish Traveller 2.03 1.76 29.20*** 22.50*** Church of Ireland (Ref. Catholic) 0.51 0.50 1.11 1.14
Religion Other religion# 1.80** 1.75** 1.46* 1.40*
Disability Has disability (Ref. No disability) 2.74*** 2.44*** 2.20*** 1.93*** Formerly married childless (Ref. Single
1.63** 1.61** 1.44* 1.43*
Never-married lone parent 2.02** 1.82** 2.00*** 1.68**
Marital/ Family status Cohabiting childless 0.86 0.93 1.48 1.54*
Married childless 1.24 1.25 0.97 1.04 Cohabiting with children 1.59 1.52 1.45 1.40 Married with children 1.04 1.05 0.84 0.90 Higher/post 2nd (Ref. Lower 2nd or less) 1.08 0.98
Education 3rd honours 1.03 0.99
Region Border/Midlands/West (Ref. Dublin) South and East
0.93 0.98
0.73** 0.93
Economic Unemployed (Ref. Employed) 1.75*** 1.23 status Inactive 1.63*** 1.34** Housing tenure Private renter 0.95 1.23 Pseudo-R squared 0.04 0.05 0.07 0.07 N of cases 14,670 14,670 14,671 14,671
Black 3.35*** 3.07*** 5.43*** 4.49***
No religion 1.74*** 1.73*** 1.26 1.24
childless)
Formerly married lone parent 1.53 1.50 1.44 1.41
3rd non-honours 1.31 0.86
Local authority renter (Ref. Homeowner) 1.19 1.58***
Any public service related
discrimination (education, health, transport, other)
Any private service related discrimination
(shops/pubs, banks/finance, housing)
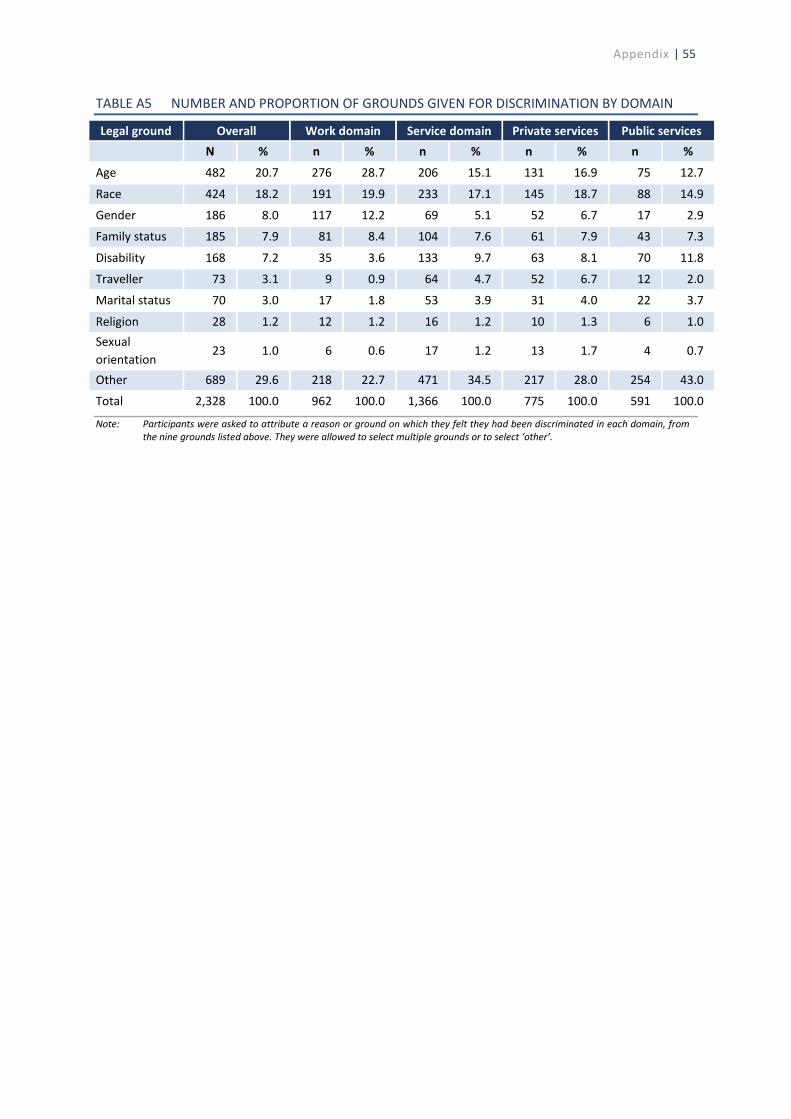
TABLE A5 NUMBER AND PROPORTION OF GROUNDS GIVEN FOR DISCRIMINATION BY DOMAIN
Overall Work domain Service domain Private services Public services Legal ground N % n % n % n % n %
Age 482 20.7 276 28.7 206 15.1 131 16.9 75 12.7
Race 424 18.2 191 19.9 233 17.1 145 18.7 88 14.9
Gender 186 8.0 117 12.2 69 5.1 52 6.7 17 2.9
Family status 185 7.9 81 8.4 104 7.6 61 7.9 43 7.3
Disability 168 7.2 35 3.6 133 9.7 63 8.1 70 11.8
Traveller 73 3.1 9 0.9 64 4.7 52 6.7 12 2.0
Marital status 70 3.0 17 1.8 53 3.9 31 4.0 22 3.7
Religion 28 1.2 12 1.2 16 1.2 10 1.3 6 1.0 Sexual
23 1.0 6 0.6 17 1.2 13 1.7 4 0.7 orientation Other 689 29.6 218 22.7 471 34.5 217 28.0 254 43.0
Total 2,328 100.0 962 100.0 1,366 100.0 775 100.0 591 100.0
Note: Participants were asked to attribute a reason or ground on which they felt they had been discriminated in each domain, from the nine grounds listed above. They were allowed to select multiple grounds or to select ‘other’.
Appendix | 55
16-22 Sráid na Faiche, Baile Átha Cliath 7, D07 CR20 16-22 Green Street, Dublin 7, D07 CR20
Guthán/Phone + 353 (0) 1 858 9601 Facs/Fax + 353 (0) 1 858 9609 Ríomhphost/Email [email protected] Idirlíon/Web www.ihrec.ie
Whitaker Square, Sir John Rogerson’s Quay Dublin 2
Phone +353 1 8632000 Fax +353 1 8632100 Email [email protected] Web www.esri.ie
RESEARCH SERIESRESEARCH SERIES
Who experiences discrimination in Ireland?Evidence from the QNHS Equality Modules
Frances McGinnity, Raffaele Grotti, Oona Kenny and Helen Russell
Who
exp
erie
nces
dis
crim
inat
ion
in Ir
elan
d?